


Abstract
Research on floral nectar quantity and composition is increasingly frequent, yet existing studies predominantly focus on plant species with larger flowers that yield abundant nectar. Consequently, standard collection techniques like the microcapillary method are often optimized only for these morphologically larger structures. This study evaluated the applicability of the flower-washing method for nectar sampling in smaller, shallow flowers, comparing its efficacy against the well-established microcapillary method. Three native species from the Ranunculaceae family with diverse blooming phenologies and floral structures were selected: Caltha palustris, Anemone nemorosa, and Clematis vitalba. Nectar samples obtained through both sampling methodologies were analyzed using high-performance liquid chromatography (HPLC) to determine individual profiles and concentrations of sugars, phenolic compounds, and amino acids. The microcapillary method demonstrated notable physical limitations, failing to yield any nectar from A. nemorosa, while success rates remained low for the other two species. Conversely, chemical analysis revealed highly significant discrepancies between the two sampling approaches. The flower-washing method proved highly unreliable, as the mandatory excision of floral tissues caused cellular damage, possibly leading to the leakage of intracellular substances and artificial contamination of the collected nectar. These findings indicate that while flower-washing is occasionally utilized for low-volume flowers, it introduces severe methodological artifacts that compromise data accuracy, highlighting the critical need for refined microcapillary approaches in comparative nectar analysis.
Keywords:
Anemone; Caltha; Clematis; flower washing method; microcapillaries; nectar; Ranunculaceae; sampling methods 1. Introduction
1.1. Nectar and Its Composition
Nectar is a key floral component that attracts pollinators and provides essential nutrients [1,2,3]. Synthesized in specialized glands called nectaries, it consists mainly of sugars that serve as a vital energy source for visiting animals [3,4]. It contains 30–90% water, up to 70% sugars, as well as nitrogen compounds, organic acids, pigments, essential oils, vitamins, minerals, lipids, phenols, terpenoids, alkaloids, non-protein amino acids, antioxidants, and secondary compounds [5,6,7]. The most common sugars found in nectar are sucrose, fructose, and glucose. Glucose and fructose are monosaccharides, while sucrose is a disaccharide. Monosaccharides or hexoses are produced either from sucrose in the phloem sap or by synthesis within the nectaries with transglucosidase and transfructosidase [5,8]. The ratio between sucrose and the two monosaccharides depends on the presence and activity of various enzymes, especially invertase, the enzyme responsible for catalyzing the hydrolysis of sucrose into fructose and glucose [9]. Hydrolysis increases the nectar osmolality, which in turn absorbs more water [10]. Based on the ratio of glucose, fructose, and sucrose, nectar can be divided into basic types: sucrose-dominant, sucrose-rich, hexose-rich, and hexose-dominant. Based on the ratio of hexose sugars (glucose and fructose) to sucrose, it is possible to infer whether nectar is hexose-dominant or sucrose-dominant and thereby predict which pollinators forage on particular flowers [5,11]. Frequently detected amino acids in nectar have been reported in many different plant species, suggesting that essential amino acids are also an important resource for pollinators, and some amino acids, especially high concentrations of proline, are significant for nectar [12,13,14,15,16]. Plants also produce secondary metabolites for a variety of functions but primarily as plant signals, for defense against herbivores and microbes. These compounds accumulate in plant tissues, also in nectaries but in lower concentrations [17]. Their importance as regulated defense systems has been well established [18,19,20,21,22,23]. It is possible that compounds appear in nectar because of phloem/xylem transport, similar to carbohydrates [19,20], which varies across species [5]. Some studies also show chemical differences between nectar, pollen, and petals that indicate that plants can regulate these compounds in specific tissues [7].
1.2. Methods of Nectar Sampling
Species within the Ranunculaceae family exhibit marked diversity in floral morphology and nectary structure, directly influencing insect pollinator visits and necessitating tailored nectar sampling methodologies [24,25]. Flower shape, driven by coevolutionary pressures, dictates nectar accessibility; for instance, shallow flowers attract butterflies and large wild bees, whereas long corolla tubes accommodate lepidopterans with elongated proboscises [5]. When evaluating nectar quantitatively and qualitatively, floral traits, insect foraging, and abiotic factors—predominantly temperature, humidity, evaporation, and soil nutrients—critically impact both nectar production and sampling efficiency [26,27,28,29,30,31]. Crucially, larger floral sizes do not consistently correlate with a higher nectar volume [26].
Selecting an appropriate sampling technique is vital for accurate qualitative evaluation. Standard refractometry offers rapid assessments but lacks precision and requires large nectar volumes, though refined fiber-optic refractometers can measure minimal quantities without destructive extraction [32]. However, refractometers remain unsuitable for detailed chemical profiling. The most prevalent approach involves extraction via microcapillaries, micropipettes, or microsyringes, which relies on capillary action [33,34,35]. While fast and non-destructive under gentle handling, microcapillary sampling is generally ineffective for small volumes below 1 μL. It presents high variability and risks damaging nectaries during repeated sampling, which causes cellular leakage [36].
To address low-volume constraints, several alternative methodologies have been investigated [26,36,37,38,39]. These include using specialized filter paper strips shaped to match floral mouthparts [36], active suction devices [40], and destructive flower-washing techniques involving flower excision and mechanical shaking in distilled water [37]. Although flower washing has been suggested to maximize yield [26], non-destructive flower rinsing avoids tissue cutting, thereby preventing intracellular sugar leakage into the sample [38]. Similarly, modified flower centrifugation utilizing glass wool can separate nectar from pollen contamination [26], which otherwise artificially elevates amino acid concentrations [5]. Regardless of the collection method, immediate flash-freezing of samples is imperative to prevent microbial degradation and preserve chemical integrity prior to subsequent analysis [34]. Plant species from the family Ranunculaceae are known to be good food sources for different pollinators [24]. They are common in Slovenia [41]. The family Ranunculaceae comprises approximately 50 genera and 1800 species. Its members are distributed worldwide, with the highest diversity in temperate and northern regions of the Northern Hemisphere. They are predominantly herbaceous plants, with some climbers also present [25,42]. Flowers are actinomorphic or star-shaped and bisexual. The perianth may be simple or double. In many species, the outer part of the perianth is brightly colored and serves to attract pollinators, while the inner perianth is often transformed into nectaries or at least bears nectar-secreting glands [25,43]. Flowers and pollination modes within the family are highly diverse. Floral traits, including number and shape of floral organs, differ markedly and can even represent diagnostic morphological characteristics of genera [44]. Most members of the Ranunculaceae are insect-pollinated; however, some species (e.g., Thalictrum) may be wind-pollinated and therefore lack nectaries. Nectaries may be present or absent and can occur on petals or in the form of trichomes. Insects visit the flowers for both pollen and nectar. In some Ranunculaceae species, pollen and nectar have been shown to be toxic; nevertheless, pollinators are still present and continue to collect nectar from these plants [5,45].
Research on nectar from smaller flowers remains limited due to the inherent technical difficulties of sampling. Consequently, many authors have relied on the washing method for nectar determination, leading us to initially predict that washing would serve as a useful, reliable, and less laborious approach for nectar sampling. However, by directly comparing these two methodologies, this study aimed to demonstrate that the washing method is highly problematic and can provide misleading data. In contrast, the microcapillary method is much more precise and ecologically relevant, closely mimicking natural foraging behaviors; a bee’s tongue functions essentially as a highly refined microcapillary. Therefore, evidence suggests that a significant number of existing studies on specific floral nectars are questionable, as the washing method frequently extracts compounds from other floral tissues rather than purely secreted nectar. To address these critical methodological concerns, this study specifically investigated two main research questions: first, whether the choice of sampling method (washing flowers and capillary method) significantly affects the quantified mass of individual chemical compounds; and second, whether the sampling method alters the determination of the predominant (dominant) sugar, phenolic compound, and amino acid profiles within the floral signature.
2. Materials and Methods
2.1. Researched Species and Their Nectary Glands
The study included three native plant species from the family Ranunculaceae, selected based on the seasonal dynamics of flowering [24,25] and the size of their natural populations in Slovenia [25,41]. Based on the seasonal flowering dynamics of species within this family, the following plant species were selected: Anemone nemorosa L., Caltha palustris L., and Clematis vitalba L.
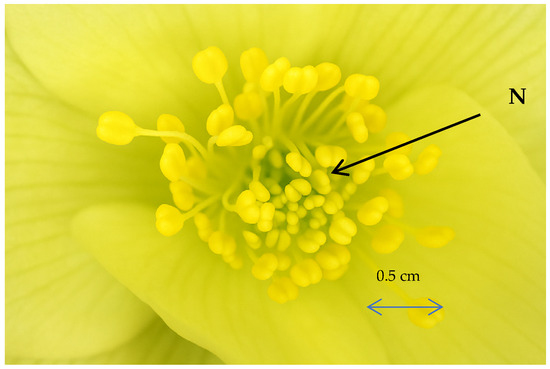
A. nemorosa is known as a plant species on which pollinators primarily collect pollen. Some studies report the absence of nectar [46,47], whereas Erbar and Leins [48] confirmed the presence of nectar and demonstrated that this species likely possesses nectaries similar to those of C. palustris, namely carpellary nectaries (Figure 1).
Figure 1.
A. nemorosa flower from the inside (10× magnification). N = nectar zone.
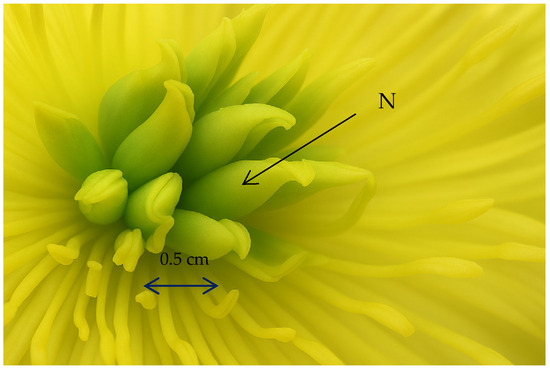
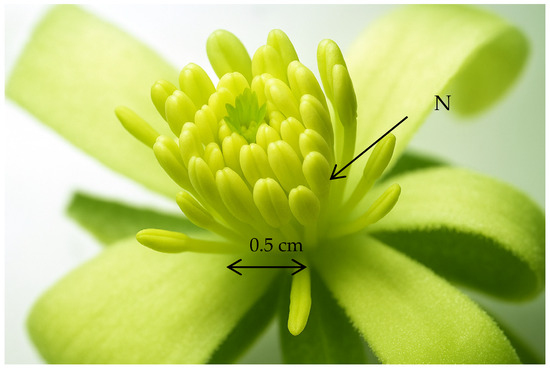
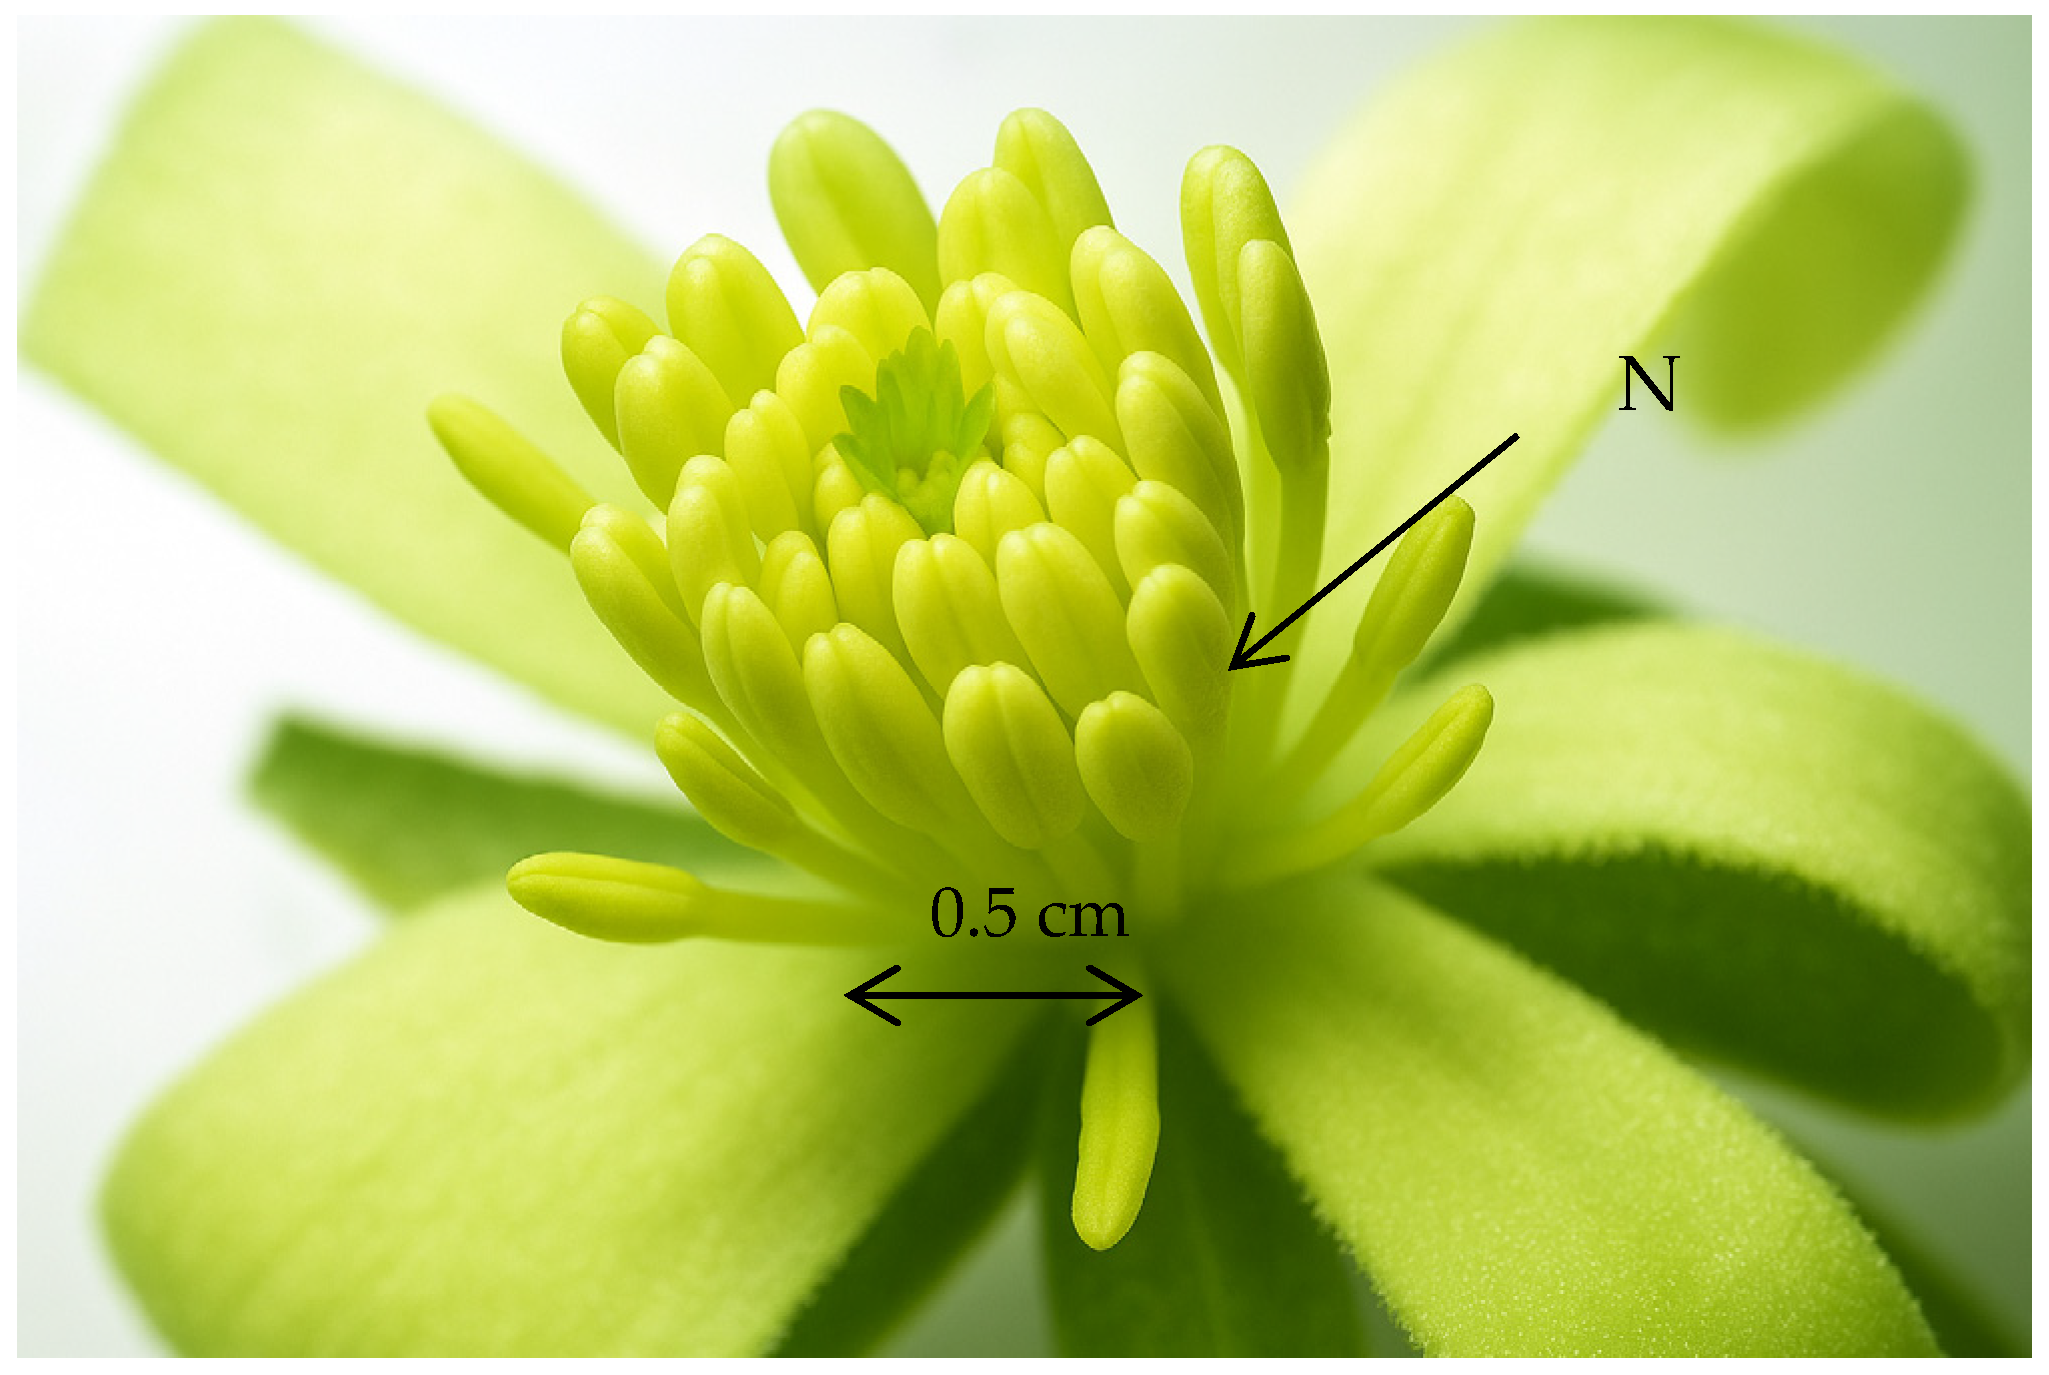
C. palustris is a characteristic species of wet habitats (meadows, forests, and riparian areas). The stem is thick and bears several flowers per individual. The species has a yellow, simple perianth and flowers from March to April [25]. Nectar is secreted by trichomes located on the ovaries (Figure 2), referred to as carpellary nectaries [48,49].
Figure 2.
C. palustris flower from the inside (10× magnification). N = nectar zone.
C. vitalba flowers in late summer and autumn [25]. In the genus Clematis, nectar is reportedly secreted at the base of the stamens (Figure 3) [50].
Figure 3.
C. vitalba flower from the inside (10× magnification). N = nectar zone.
2.2. Sampling Locations
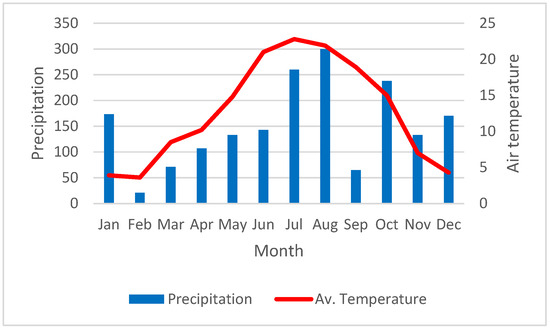
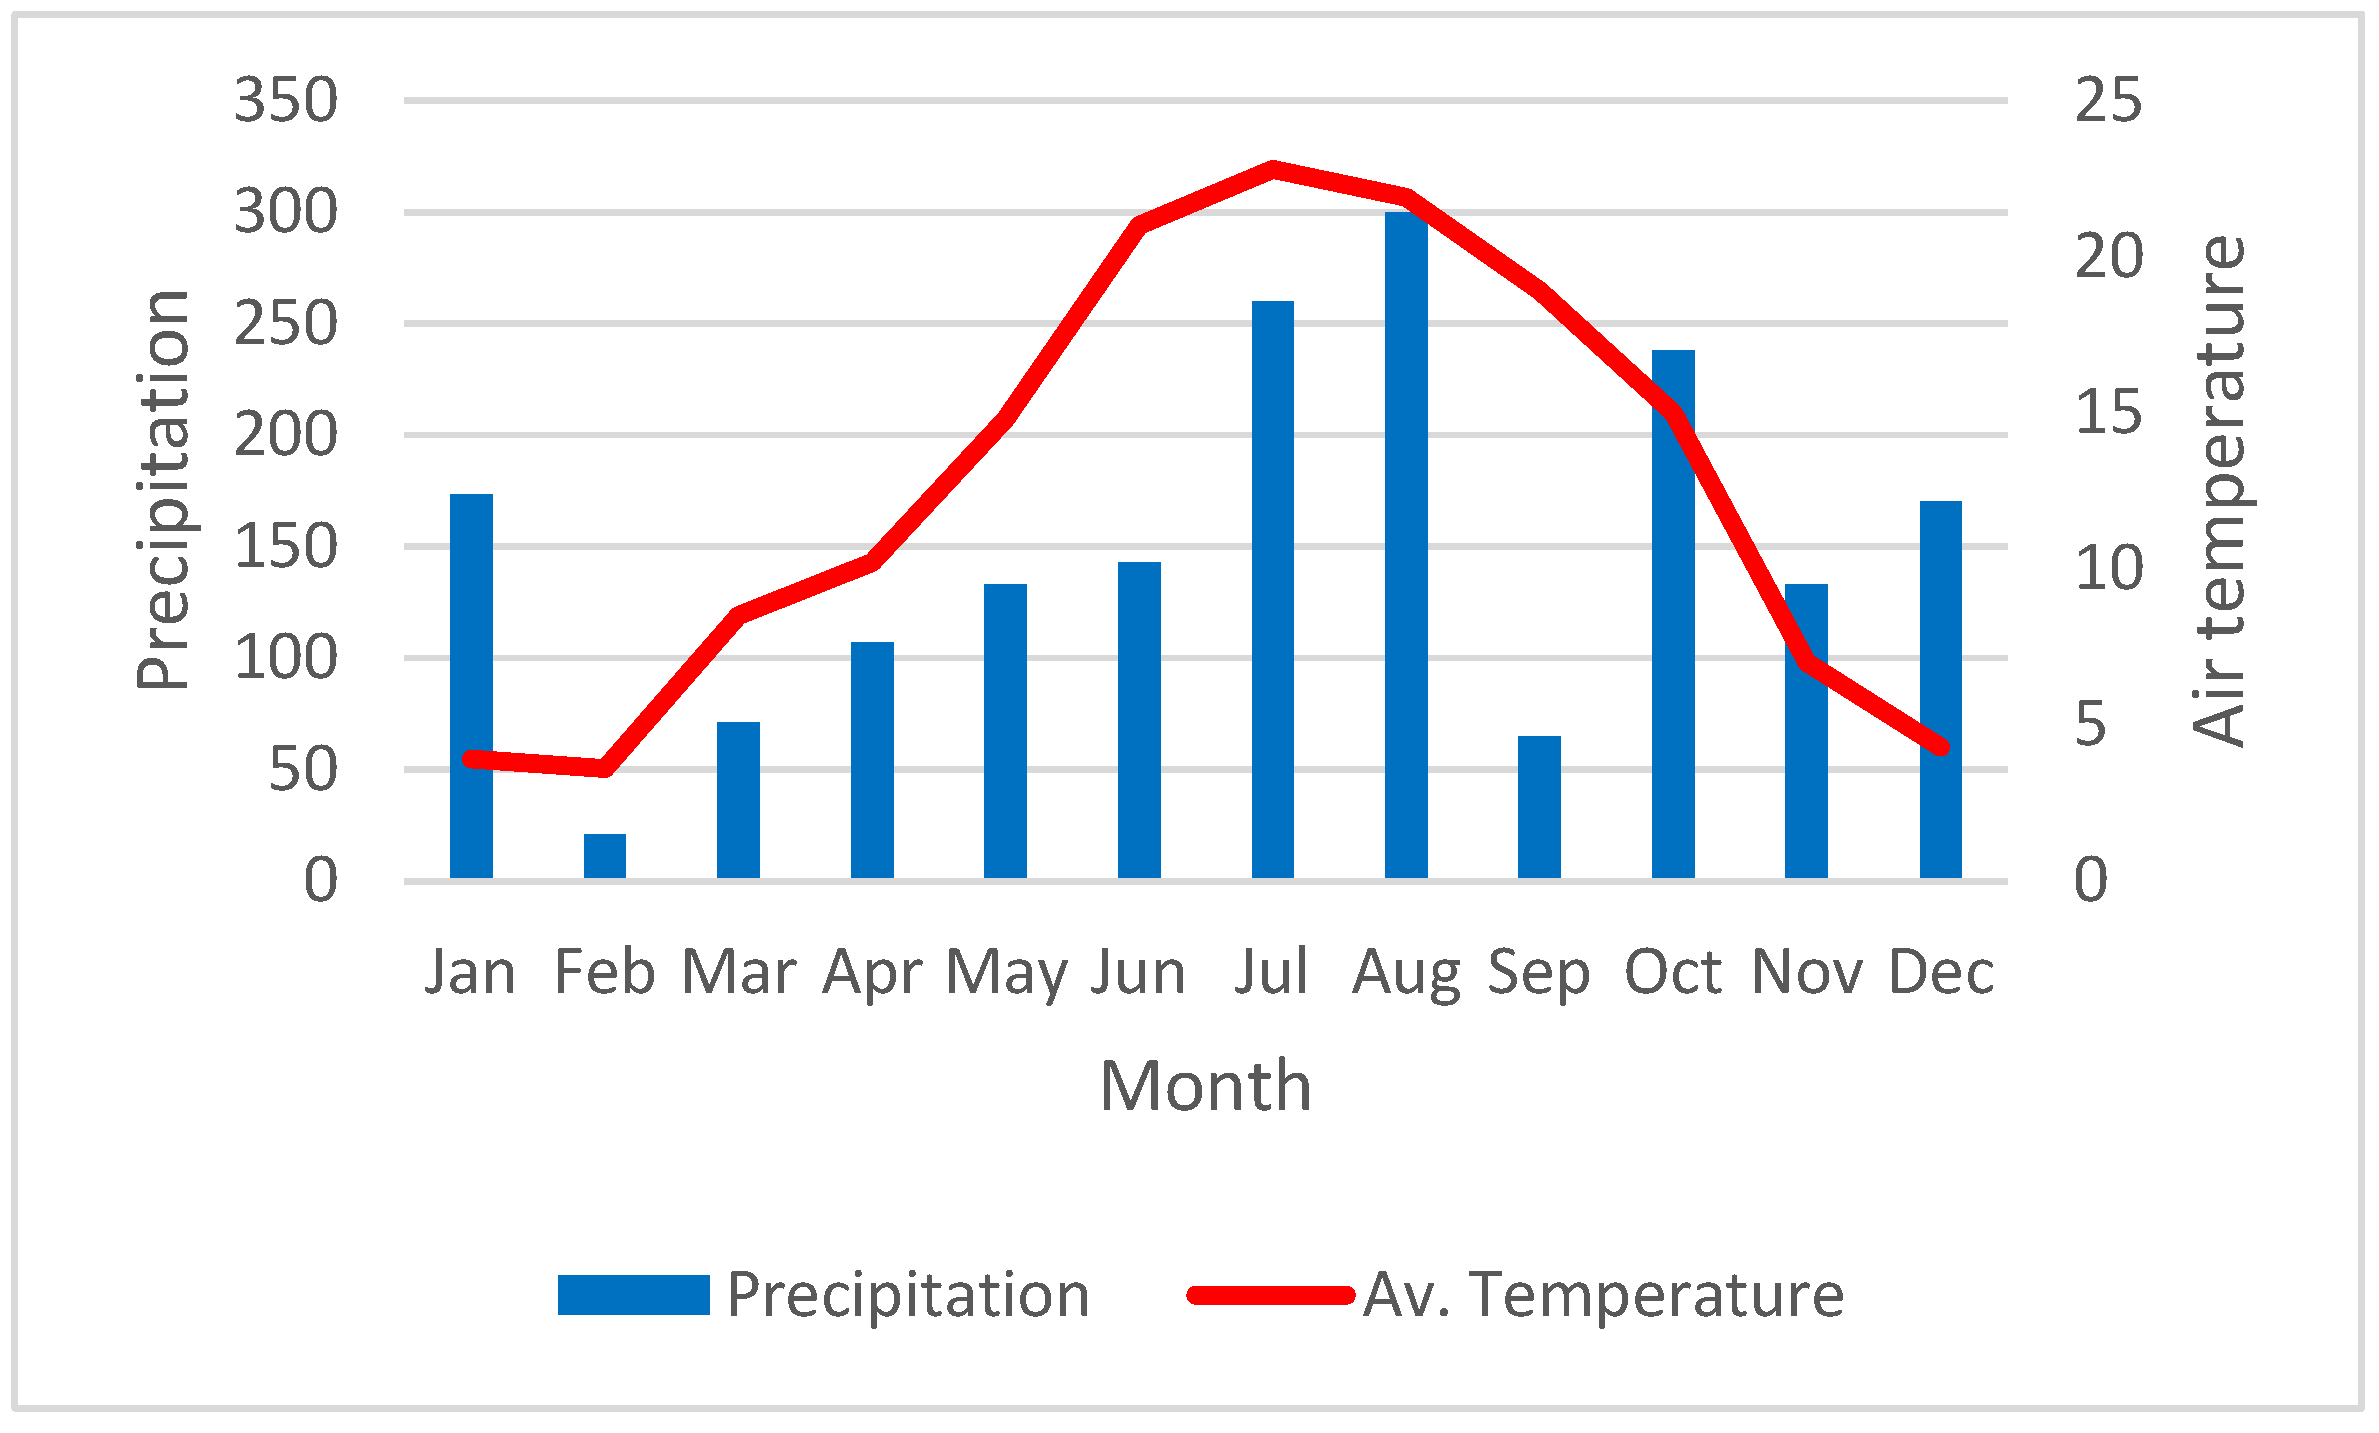
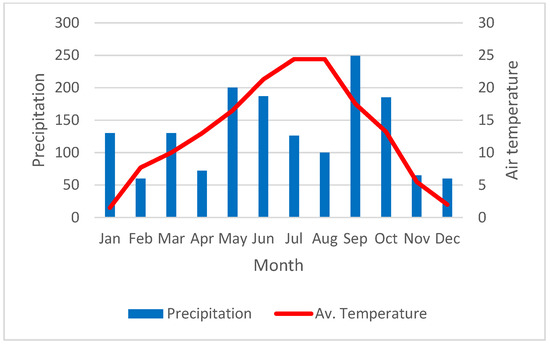
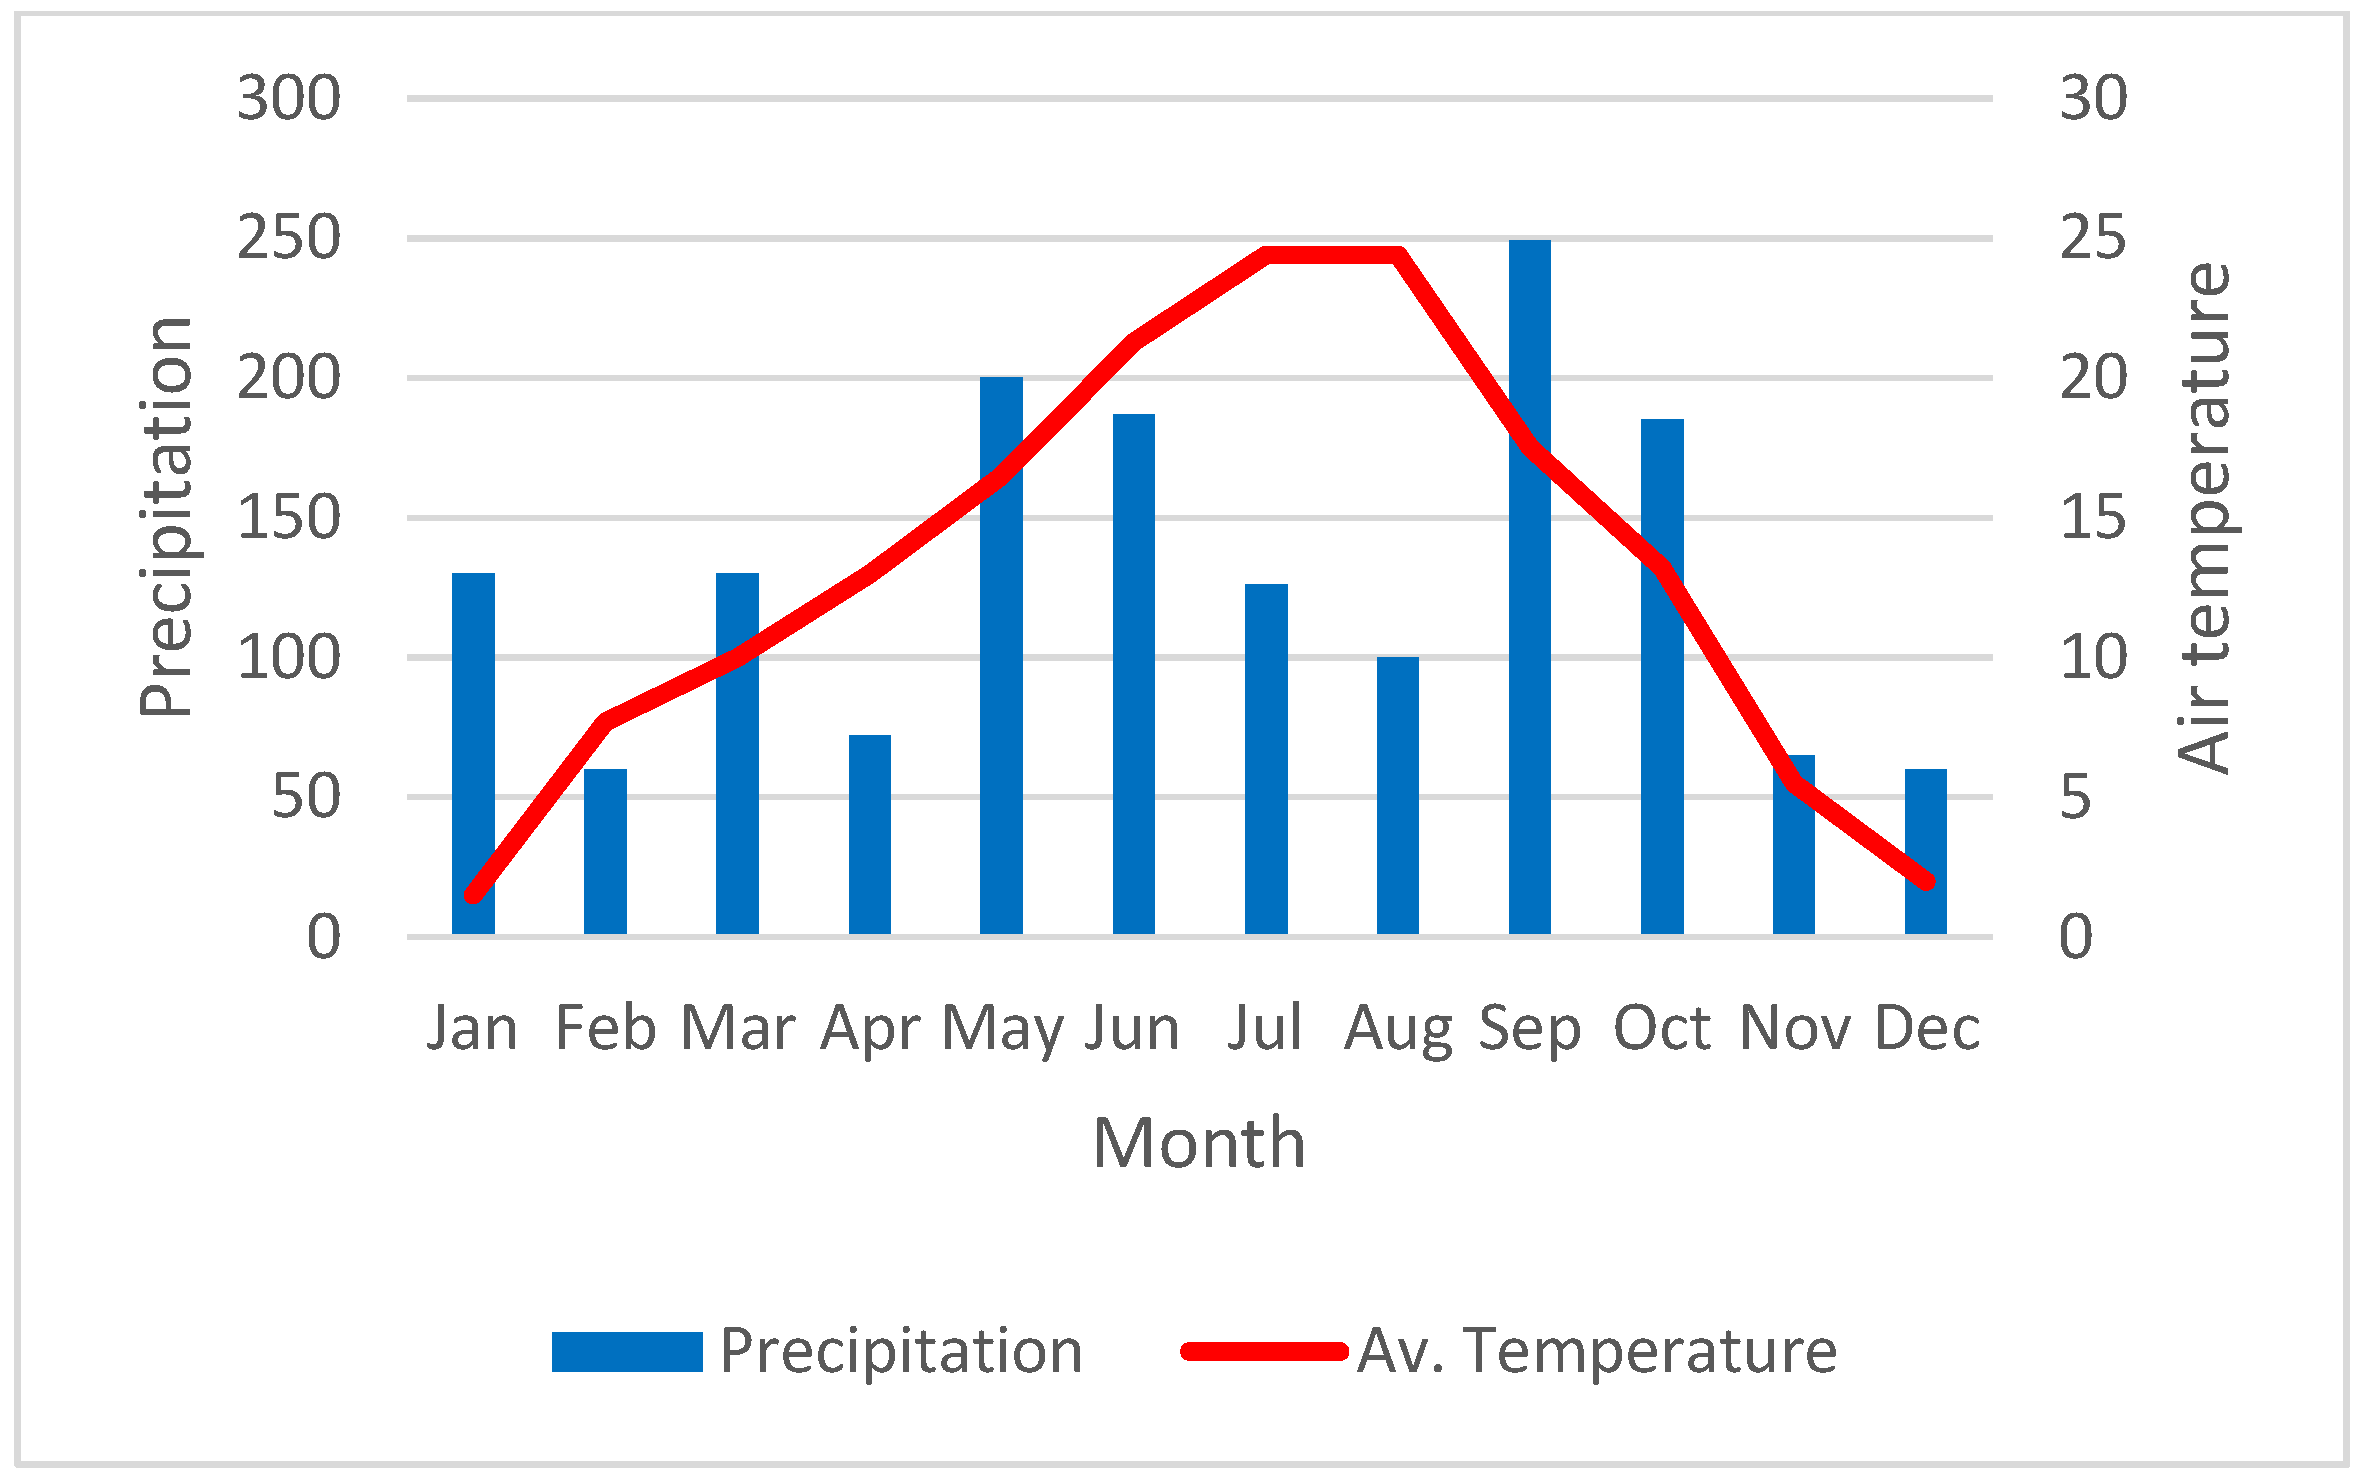
Plant species were sampled in Ljubljana, both in the southern part of the city and in its northern surroundings. Slovenia is located at the junction of four biogeographical regions: Alpine, Dinaric, Pannonian, and Sub-Mediterranean. It lies within the temperate climatic zone. Due to its transitional position, the influence of several climate types can be observed: Alpine, continental, and Mediterranean. Each plant species was sampled at two different geographic locations, depending on its habitat preferences. Central Slovenia, where Ljubljana is situated, has a temperate continental climate. Winters are often characterized by temperatures below freezing, while summers are warm. Precipitation is more frequent in spring and autumn [51]. Each plant species that proved successful for capillary sampling in the first year (except A. nemorosa) was sampled during the period 2023–2024. The average annual temperature and precipitation in Ljubljana and its surroundings in 2023 and 2024 are shown in Figure 4 and Figure 5.
Figure 4.
Average annual temperature (°C) and precipitation (mm) in 2023 (ARSO, 2026). The red line represents average temperature, and blue columns represent the amount of precipitation.
Figure 5.
Average annual temperature (°C) and precipitation (mm) in 2024 (ARSO, 2026). The red line represents average temperature, and blue columns represent the amount of precipitation.
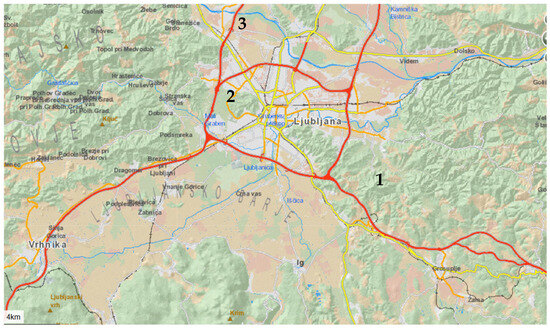
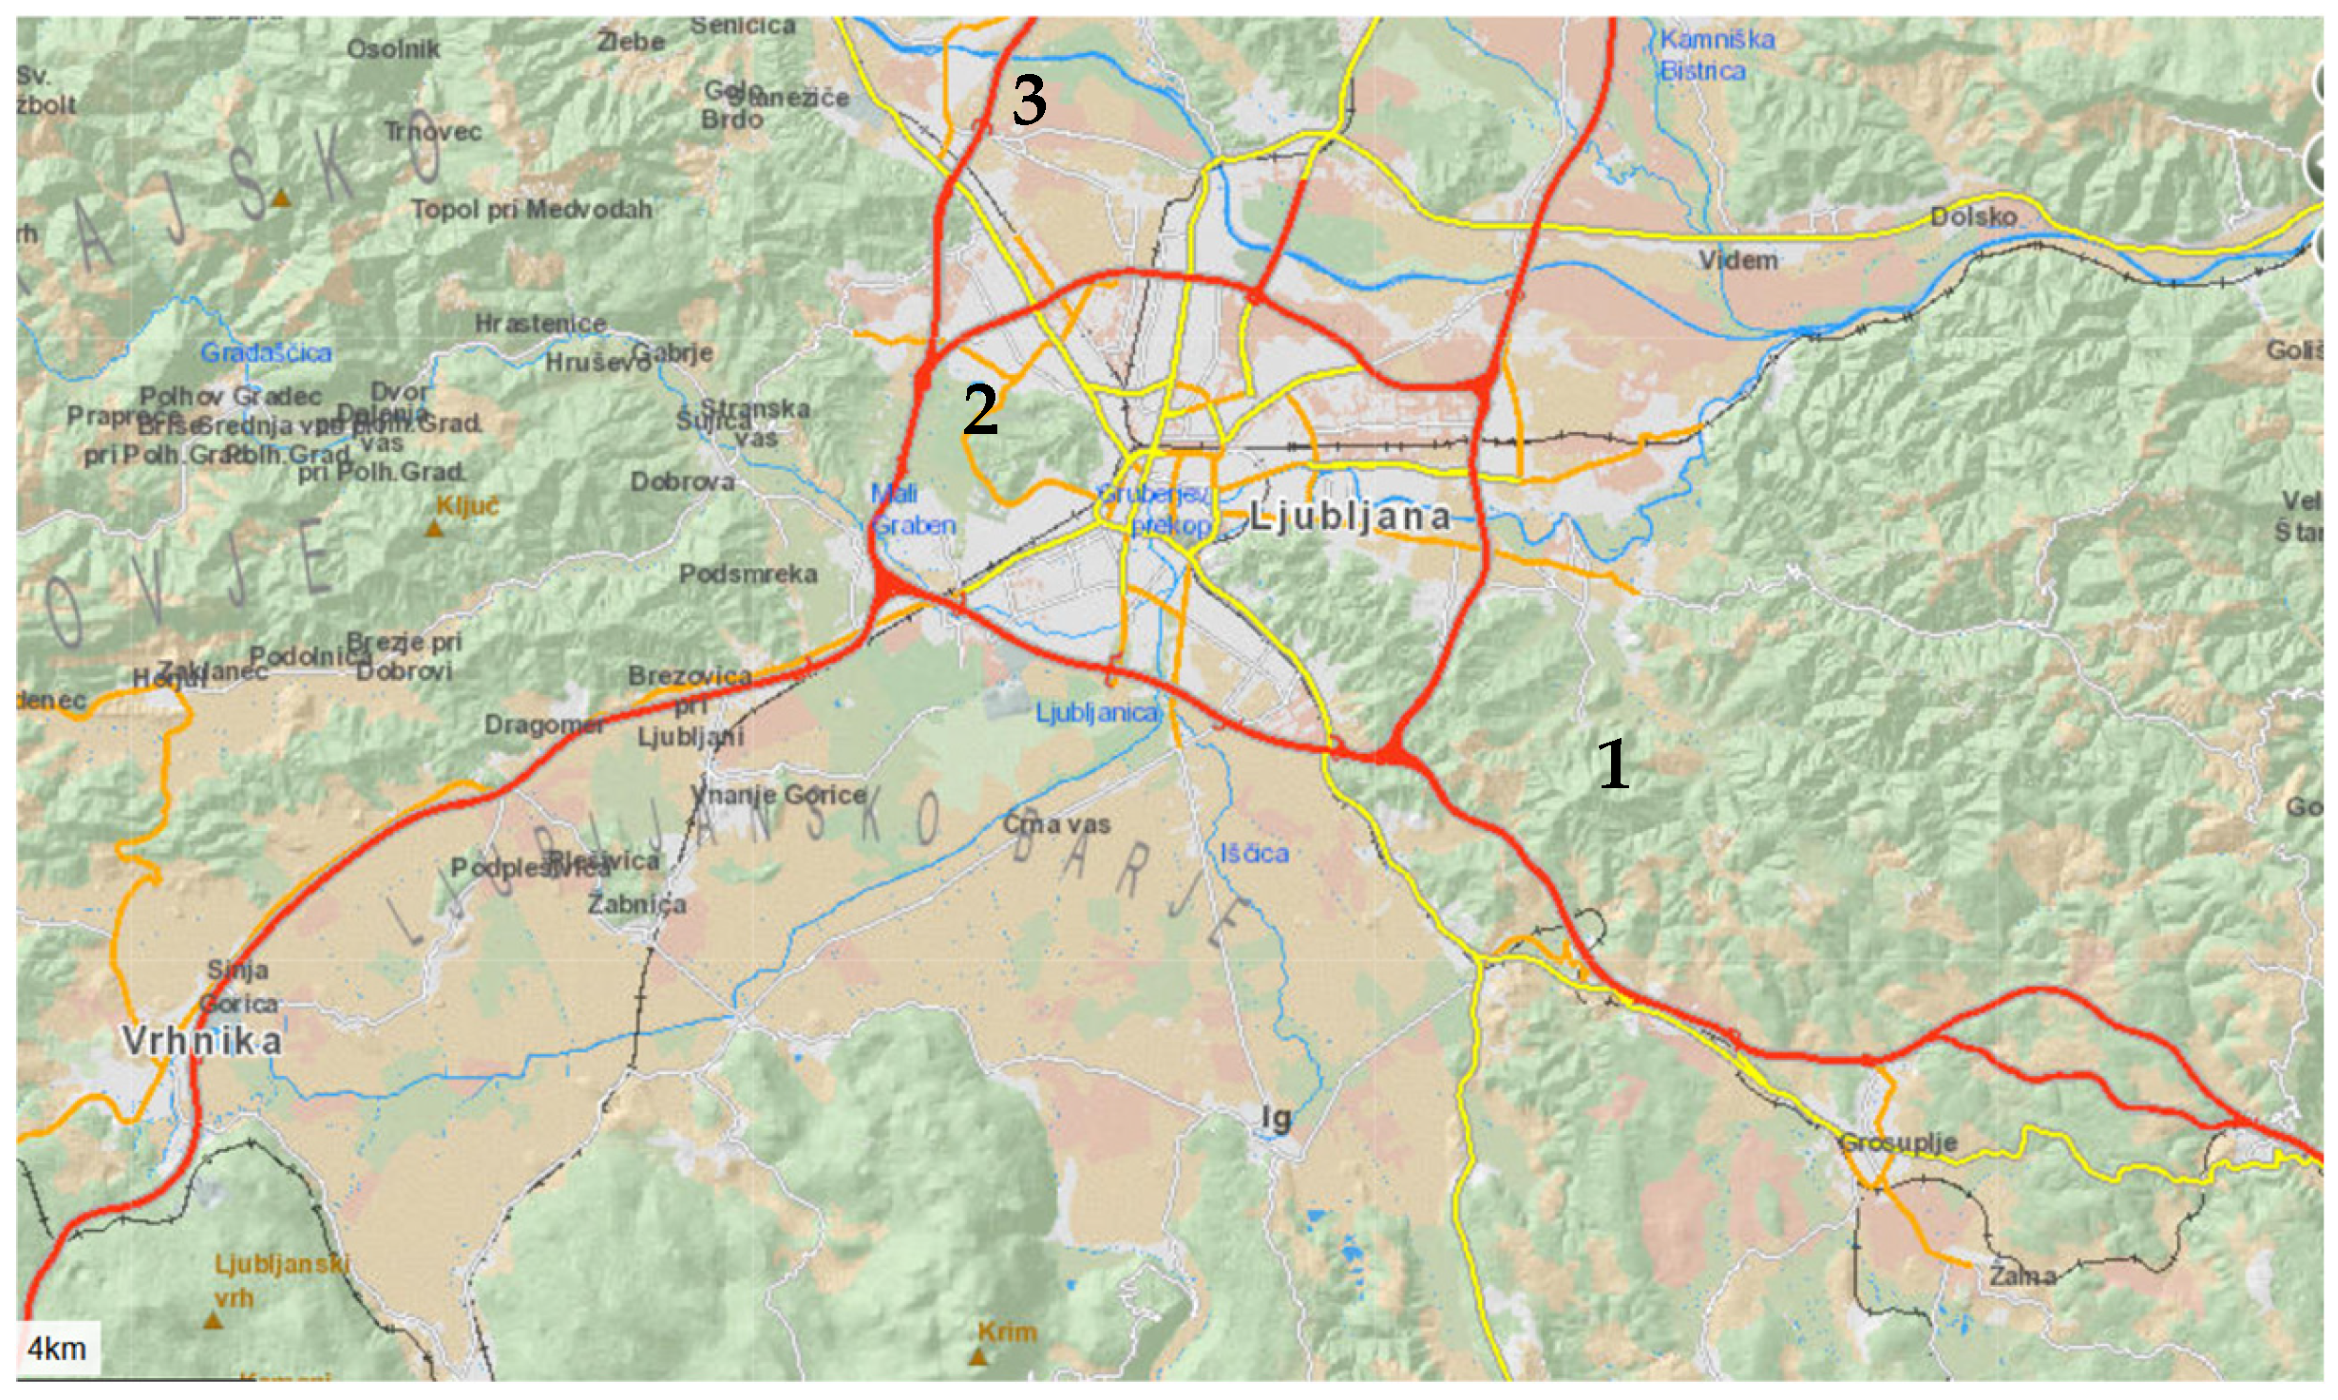
Pot na Orle (Figure 6) is situated at an elevation of 330–400 m a.s.l. The location was highly heterogeneous in terms of habitat types, including marshy areas and even dry grasslands. From the lower part upwards toward Orle, the foothills of the hill were relatively moist due to the presence of streams. The stream and meadows were bordered by beech forest. On one side, the meadow was marshy and shaded, while on the other side it was sun-exposed and dry. Toward Orle, forest cover gradually decreased and transitioned into dry grasslands. The studied habitat was the forest edge. Here we studied species A. nemorosa, C. palustris, and C. vitalba.
Figure 6.
Map of sampling locations (1—Pot na Orle, 2—biological center along Večna, 3—meadow in Roje).
The biological center along Večna pot (Figure 6) is situated at 295 m a.s.l., a wet meadow with marsh plant species that predominated. The forest edge consisted of various shrub species (Crataegus monogyna, Prunus spinosa). Soil was frequently flooded even within the forested area, particularly in spring. The studied habitats were forest edge and marshy meadow. Here we studied the species A. nemorosa and C. palustris.
Meadow in Roje (Figure 6) with a forest edge was located at 298 m a.s.l. The central part of the dry meadow also contained numerous shrub species. The soil was calcareous, with deposits from the nearby Sava River. Forested and cultivated areas bordered the meadow. The meadow is mown once per year, whereas the forest edge is unmanaged and shows strong expansion into the meadow. The studied habitat was the forest edge. Here we studied species C. vitalba.
2.3. Nectar Sampling Steps
2.3.1. Flower Protection
Because flowers are continuously visited by pollinators, it is important to protect the investigated flowers in advance in order to prevent pollinators from removing nectar. Various materials can be used for protection, such as nets, gauze, fleece covers, etc. [33,34,52]. In this study, plants were covered with fleece one day prior to sampling. We did not cover flowers at the beginning of flowering because we did not collect the nectar from the same flowers throughout our research, as we damaged flowers during the washing method for each sampling date. As nectar production and persistence are also influenced by rainfall [26], sampling was carried out only on rain-free days.
2.3.2. Nectar Collection
Nectar was sampled at three different times during the same day: at 09:00, 12:00, and 15:00. Sampling was conducted on the same day, at the same location, at all of the specified times. Two sampling methods were tested for each plant species. First, the microcapillary sampling method was applied, in which nectar is extracted by capillary action [33,34,35,36]. This method proved to be more suitable, as the flowers were not destroyed during sampling. In addition, there was a lower probability of pollen being collected together with nectar. However, this method was not suitable for all selected plant species (A. nemorosa), and therefore a modified flower-washing method was also used [26].
For capillary sampling, 1 µL microcapillaries (Vitrex Medical, Herlev, Denmark) were used. 1. For each plant species, four samples (one sample = all flowers per inflorescence) were collected in the field at each selected sampling time. In plant species in which a single individual bears multiple flowers, the number of flowers per sample corresponded to the number of flowers present on each individual of that species. The same individual plant was sampled three times throughout the day. Latex gloves were worn during handling to prevent possible contamination. After nectar extraction, the height of the nectar column in the microcapillary was immediately measured. Because the volume of the microcapillary tube was known, the volume of nectar collected from a single flower could be calculated directly in the field. Microcapillaries containing nectar were placed into centrifuge tubes and stored in a freezer at −20 °C until further analyses.
For the flower-washing method, one sample means that flowers were collected from five individuals in plant species whose individuals bear only a single small flower (A. nemorosa). In plant species with multiple flowers per individual, the number of flowers included in a sample corresponded to the number of flowers on each individual (C. palustris, C. vitalba). For each sampling time, two samples were collected. Flowers were cut using small scissors. For C. vitalba pistils, petals and sepals were removed (nectar is on the base of stamens), and for carpellary nectars (C. palustris and A. nemorosa) we removed sepals and petals and stamens, to not disturb the sites of nectar secretion. Because flower washing is a more invasive method that requires cutting the flowers, additional specimens could not be obtained at each location. These limitations explain why fewer samples were collected than with the microcapillary approach. The cut flowers were placed into large centrifuge tubes, 4 mL of distilled water was added, and the tubes were manually shaken for 1 min in the field. Before storing the samples in a freezer at −20 °C, they were shaken once more on a rotator.
2.4. Laboratory Work
2.4.1. Sample Preparation
Samples stored in the freezer were thawed and transferred into vials for further analysis. Samples collected using microcapillaries were diluted in 150 µL of water per sample in 2 mL centrifuge tubes. These were then centrifuged twice for 1 min each. After the final centrifugation (3 min in total), the liquid phase was transferred into an HPLC vial. Samples collected using the flower-washing method were processed by transferring the aqueous phase into smaller centrifuge tubes, centrifuging them for 3 min, and then transferring the sample into an HPLC vial.
2.4.2. Sugar Analysis
Standards of the three main sugars—sucrose, glucose, and fructose (Merck Millipore, Darmstadt, Germany)—were prepared by dissolving 100 mg of each sugar in 10 mL of deionized water (Milli-Q, Merck Millipore). The standards were then diluted to obtain working standard solutions with a concentration of 1 mg/mL for each sugar. Diluted nectar samples were analyzed using a Vanquish UHPLC system (Thermo Scientific, San Jose, CA, USA) coupled to a charged aerosol detector (CAD) and Chromeleon 7.2 SR4 data acquisition software (Thermo Scientific). The separation column was a Nucleogel Sugar Ca column (300 mm × 6.5 mm i.d.; Macherey-Nagel, Düren, Germany) operated at 90 °C. The mobile phase consisted of water under isocratic conditions (constant mobile phase composition throughout the analysis), with a flow rate of 0.7 mL/min. The CAD source temperature was set to 90 °C. The total analysis time was 13 min. Sample vials were thermostated at 10 °C. Water was used as the autosampler wash solution. Injection volumes were 5 µL for standard solutions and 15 µL for samples. For more information about the descriptive statistics of the sugar analysis method, see Table 1.
Table 1.
Descriptive statistics of the sugar analysis method.
2.4.3. Amino Acid Analysis
A standard amino acid solution was purchased from Sigma-Aldrich (St. Louis, MO, USA) and contained 10 µg/mL of each analyzed amino acid (proline, methionine, (iso)leucine, tyrosine, alanine). Diluted nectar samples were analyzed using an Accela 600 HPLC system (Thermo Scientific, San Jose, CA, USA) coupled to a TSQ Quantum mass spectrometer equipped with an electrospray ionization source (Thermo Scientific) and Xcalibur 2.1 data acquisition software (Thermo Scientific). Detection was performed in selected ion monitoring mode under positive ionization conditions. For the set of amino acids analyzed, the monitored and quantified ions corresponded to the M + 1 m/z values. The separation column was a Hypercarb column (50 mm × 2.1 mm i.d., particle size 3 µm; Thermo Scientific), operated at 55 °C. Solvents used for gradient elution were water with 0.1% formic acid (Solvent A) and methanol with 0.1% formic acid (Solvent B). The elution program consisted of isocratic elution from 0 to 2 min at 100% solvent A, followed by gradient elution from 2 to 5 min from 100% to 10% solvent A, and then a second isocratic elution from 5 to 9.4 min at 10% solvent A. Column reconditioning consisted of isocratic elution from 9.4 to 14 min at 100% solvent A. The flow rate was constant at 0.25 mL/min. The total analysis time was 14 min. Sample vials were thermostated at 8 °C. The wash solution consisted of water with 10% methanol (v/v). Injection volumes were 5 µL for both standards and samples. For more information about the descriptive statistics of the phenolic compound analysis method, see Table 2.
Table 2.
Descriptive statistics of the amino acids analysis method.
2.4.4. Analysis of Phenolic Compounds
Standards for phenolic analyses (chlorogenic acid, rutin, quercetin, quercitrin, isoquercitrin, and hyperoside; Extrasynthese, Genay, France) were prepared by dissolving 5 mg of each standard in 10 mL of methanol (Merck, Darmstadt, Germany). The solutions were then diluted with 50% (v/v) methanol to obtain working standard solutions with a concentration of 20 µg/mL for each analyte. Diluted nectar samples were analyzed using a Vanquish UHPLC system (Thermo Scientific, San Jose, CA, USA) coupled to a UV detector (detection wavelengths set at 330 nm and 360 nm) and Chromeleon 7.2 SR4 data acquisition software (Thermo Scientific). The separation column was a Hypersil Gold C18 column (100 mm × 2.1 mm i.d., particle size 3 µm; Thermo Scientific), operated at 40 °C. Solvents used for gradient elution were water with 0.1% formic acid (solvent A) and acetonitrile with 0.1% formic acid (solvent B). The elution program consisted of isocratic elution from 0 to 7 min at 10% solvent B, followed by gradient elution from 7 to 14 min from 10% to 60% solvent B. Column reconditioning consisted of isocratic elution from 14.1 to 19 min at 10% solvent B. The flow rate was constant at 0.25 mL/min. The total analysis time was 19 min. Sample vials were thermostated at 10 °C. The wash solution consisted of water with 10% methanol (v/v). Injection volumes were 5 µL for standard solutions and 10 µL for samples. For more information about the descriptive statistics of the amino acid analysis method, see Table 3.
Table 3.
Descriptive statistics of the phenolic compounds analysis method.
2.5. Data Processing
The recorded chromatograms obtained by HPLC were initially analyzed, and the concentrations of the investigated compounds (sugars, phenolic compounds, and amino acids) were calculated based on calibration standards. The concentrations were then recalculated to values prior to dilution. These adjusted concentrations were subsequently divided by the number of flowers sampled for each plant species, yielding the concentration of each compound per flower. Descriptive statistics (median, mean, and standard deviation), Pearson chi-square test, and Mann–Whitney U test were performed in IBM SPSS Statistics 23. Charts were made in Microsoft Excel 365.
Basic data processing (including the calculation of mean values of individual compounds obtained by flower washing and microcapillary sampling for each species) was performed using Microsoft Excel 365.
3. Results
3.1. Nectar Sampling
The floral structures were classified as shallow based on their morphology, but with different types of nectaries (Table 4). All flowers were sampled using both methods.
Table 4.
Possibility of sampling by the individual method according to the species.
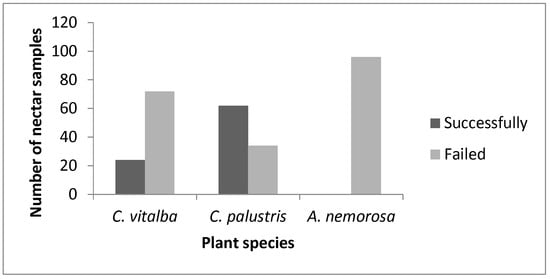
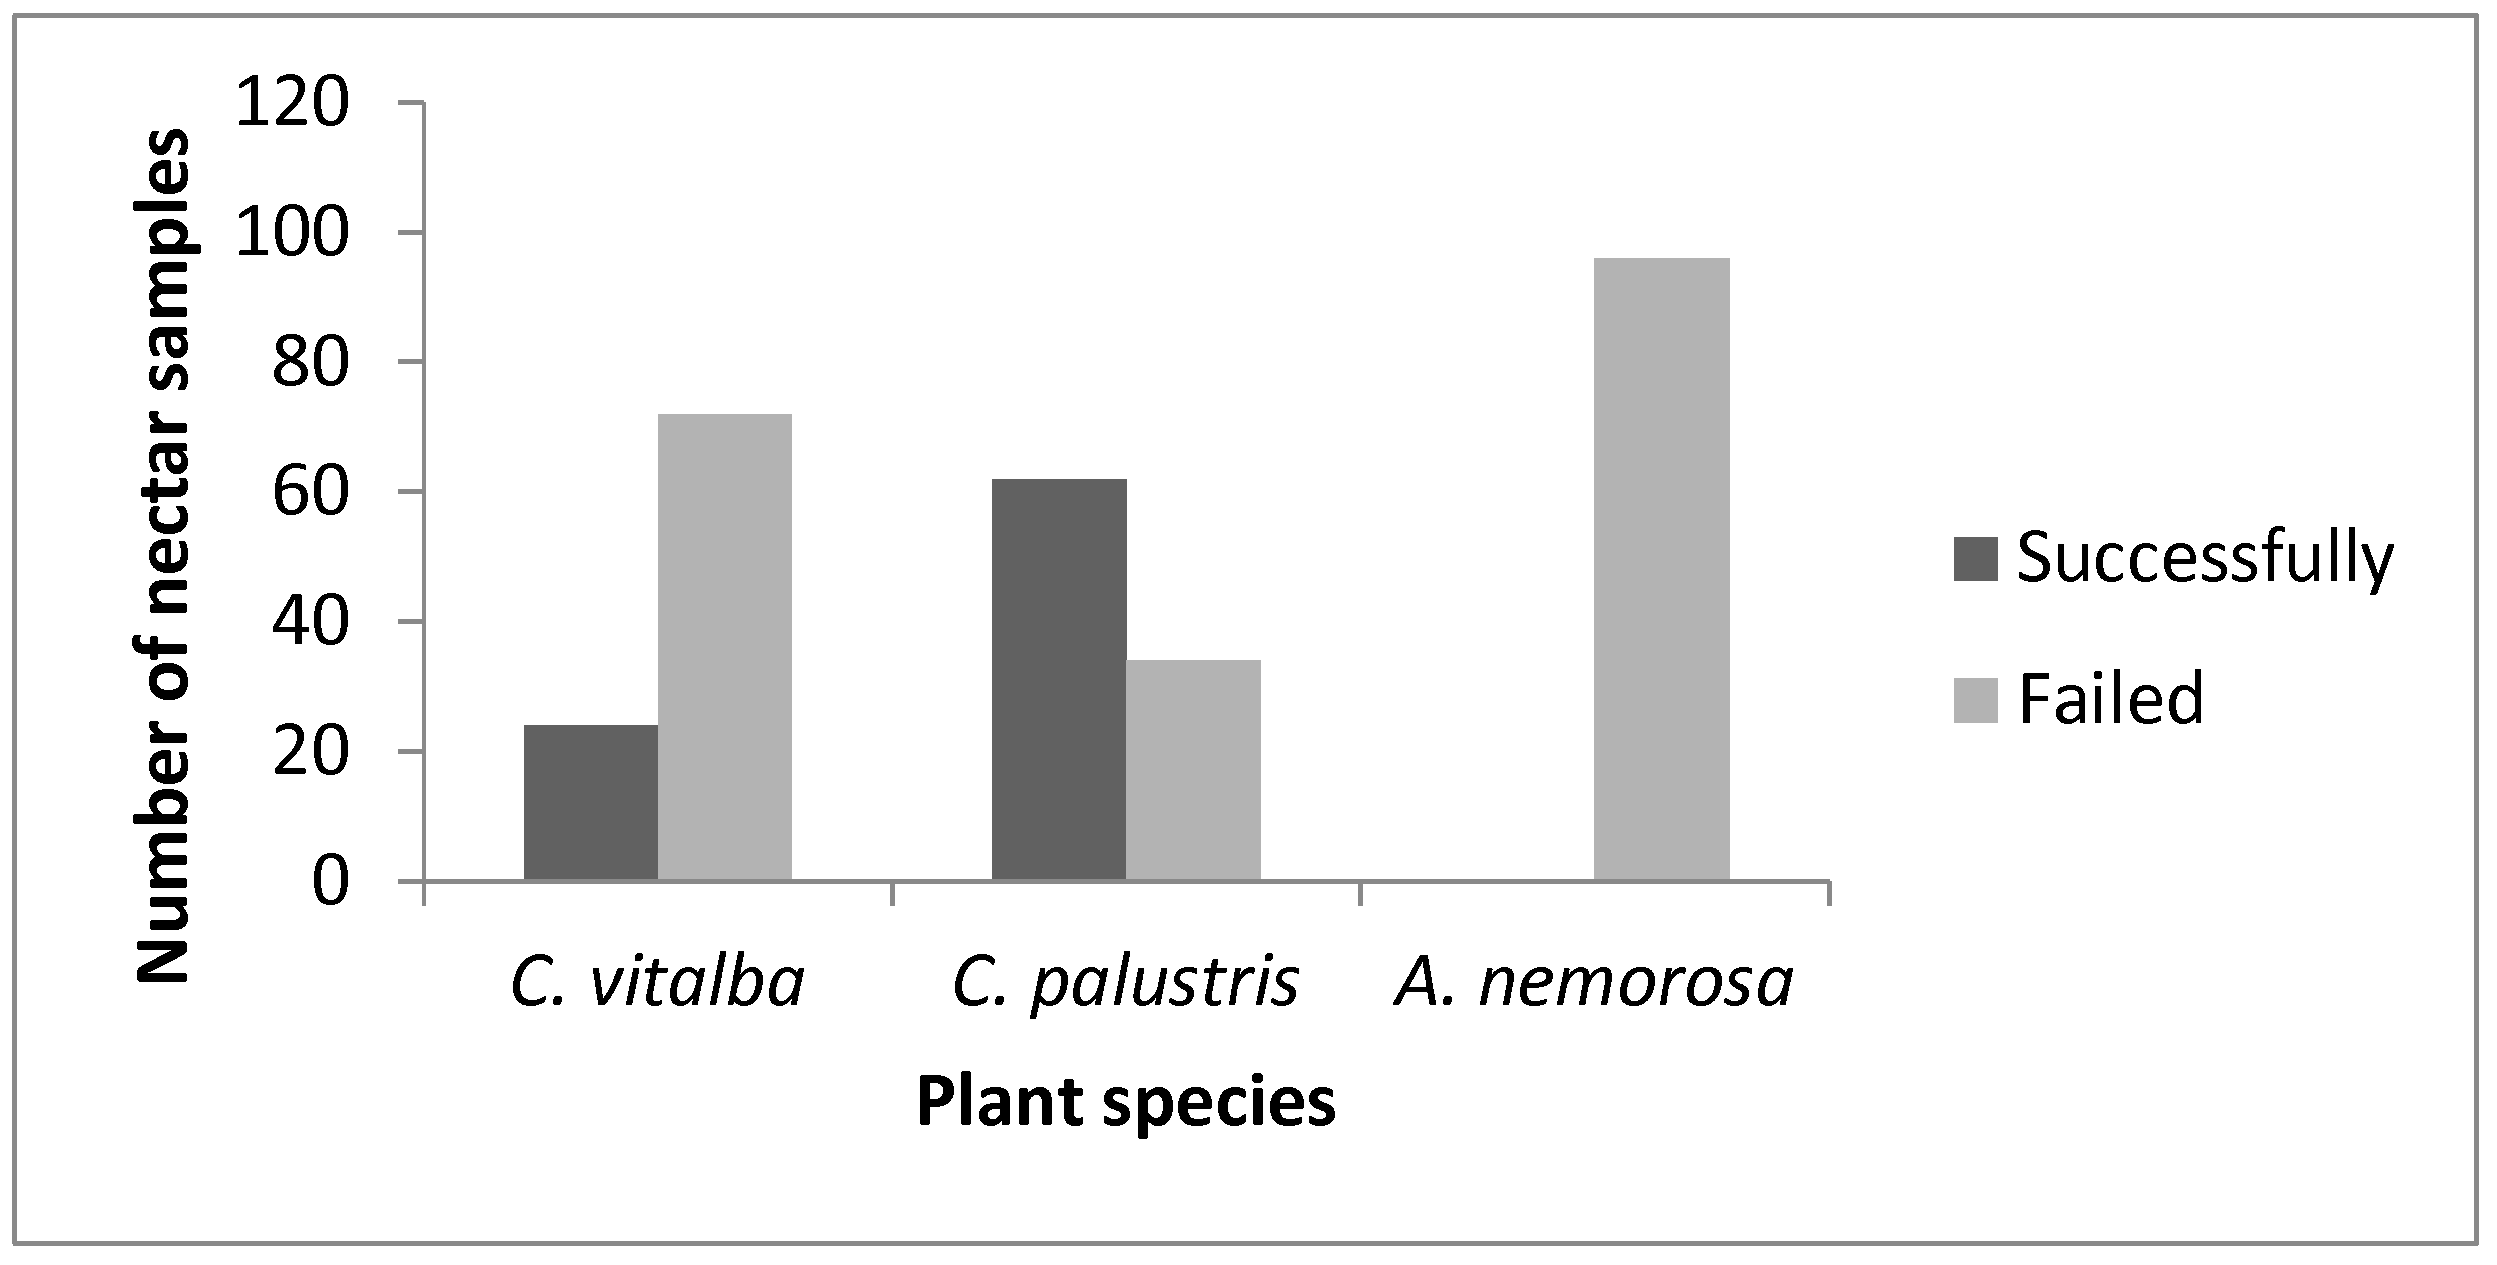
In the plant species A. nemorosa, sampling with microcapillaries was not possible. In C. vitalba and C. palustris, both methods could be applied; however, during the first year we observed that microcapillary sampling was not possible or was considerably hindered when weather conditions were dry for extended periods. Pearson chi-square tests confirmed that the washing method (100% success rate, n = 24) achieved a significantly higher success rate compared to the microcapillary method across all studied plants (n = 96 capillary attempts per species): C. palustris (64.6% capillary success rate; x2 = 11.86, p = 0.001), C. vitalba (25.0% capillary success rate; x2 = 45.00, p < 0.001), and A. nemorosa (0% capillary success rate; x2 = 120.00, p < 0.001) as visually presented in the bar chart (Figure 7).
Figure 7.
Successfully and failed collected nectar samples with microcapillaries.
3.2. Sugar Mass in Nectar
Nectar can be classified according to the presence of the three main sugars into sucrose-dominant nectar and hexose-dominant nectar (glucose and fructose). We analyzed those three sugars in nectar. Significant differences in values were observed between the washing method and the capillary method across species (Table 5).
Table 5.
Mean, median, and standard deviations of sugar mass per flower are presented in this table for each investigated plant species and collecting method. Median (mean ± SD). N = 96 for the capillary method represents the total number of samples; unsuccessful attempts and non-detectable values were included in statistical analysis.
Because the data showed a non-normal distribution, we selected the non-parametric Mann–Whitney U test to compare the groups. The non-parametric analysis revealed distinct patterns in sugar accumulation depending on the collection method and plant species. Overall, the washing method yielded consistently and substantially higher sugar masses compared to the capillary method, as evidenced by a drastic difference in mean ranks.
A Mann–Whitney U test could not be performed for A. nemorosa, as capillary sampling was technically impossible. Due to this lack of capillary data, no statistical comparison between the two collection methods could be calculated for this specific species.
For C. palustris, the choice of collection method had no statistically significant effect on the mass of sucrose (U = 780, p = 0.120). However, the washing method resulted in highly significant and drastically higher masses for both glucose (p < 0.001) and fructose (p < 0.001) compared to the capillary method, where zero values were highly frequent.
For C. vitalba, the collected method significantly altered the entire sugar profile. The washing method yielded highly significant and uniformly higher masses across all three analyzed sugars: sucrose (p < 0.001), glucose (p < 0.001), and fructose (p < 0.001).
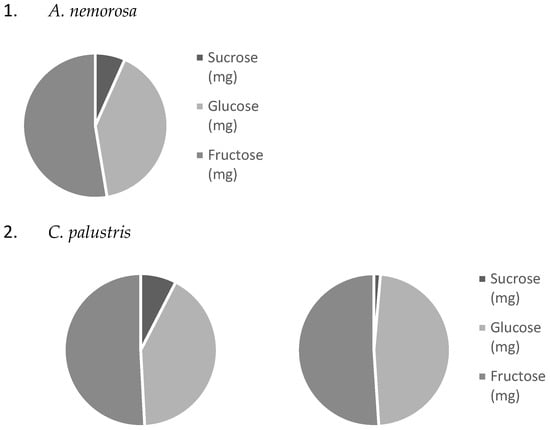
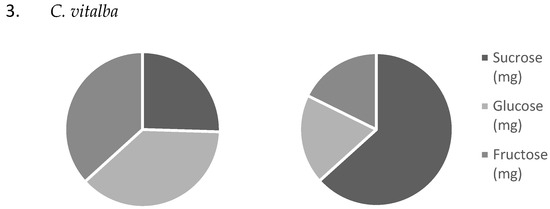
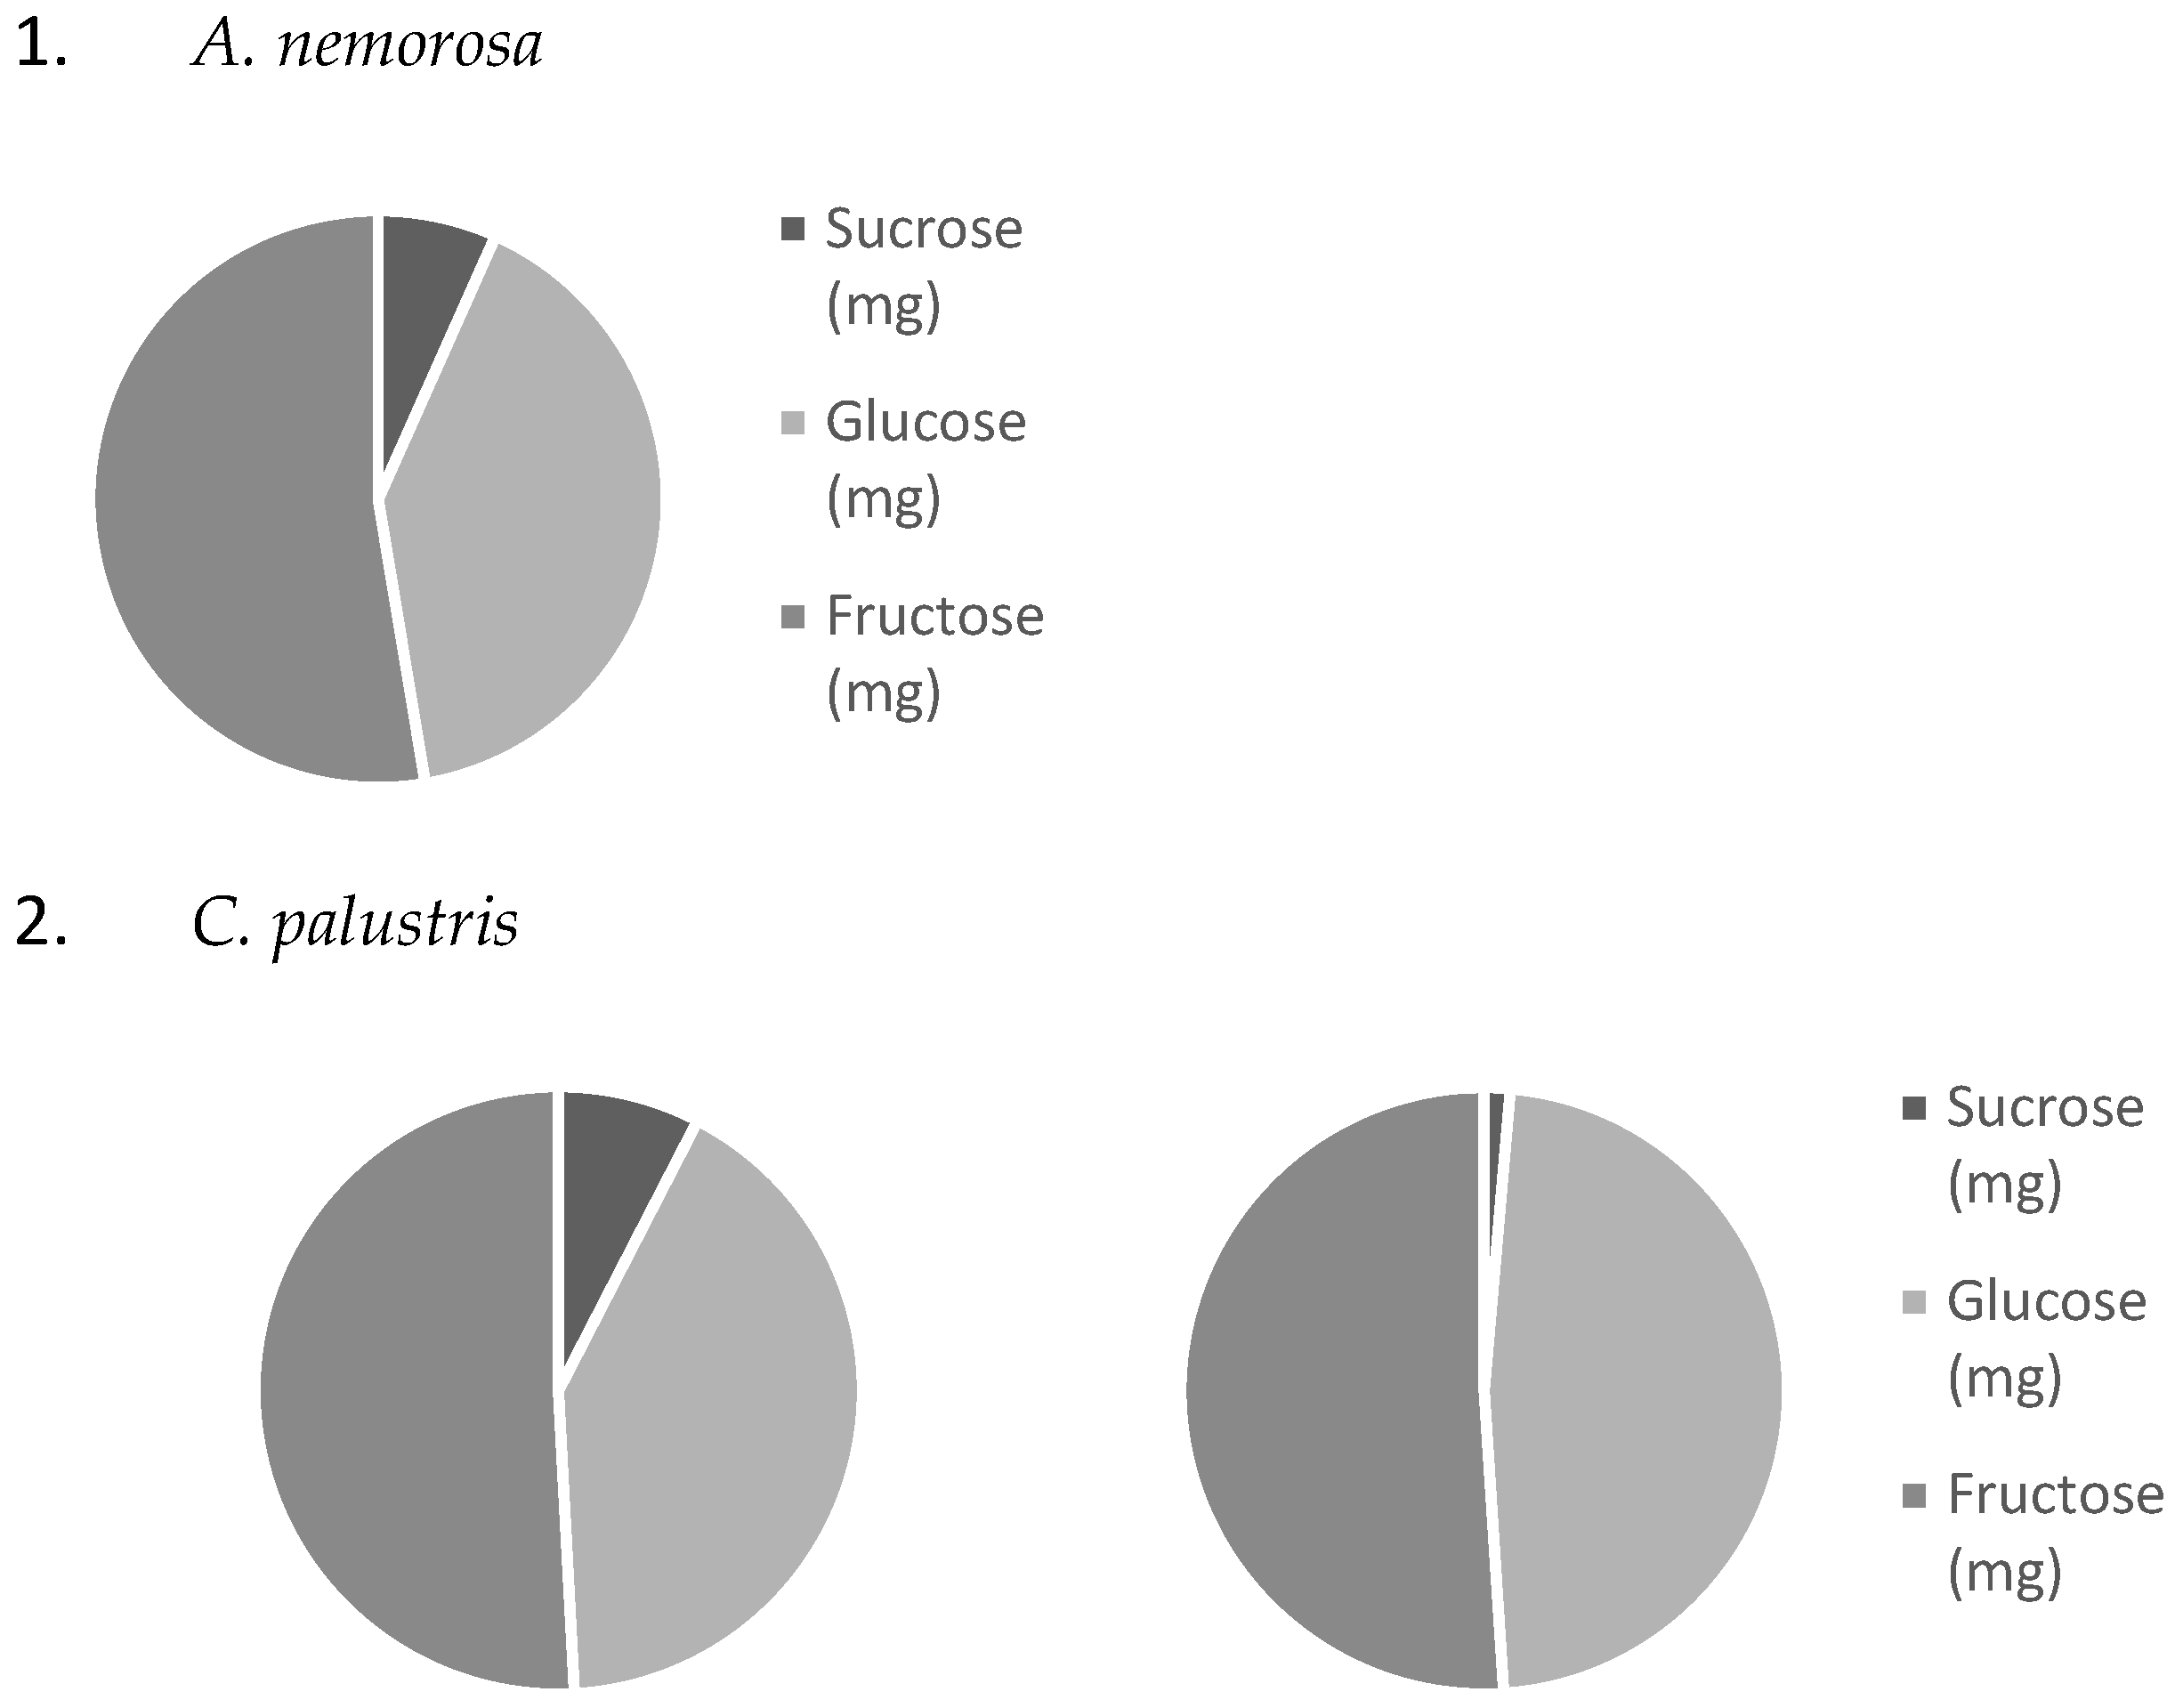
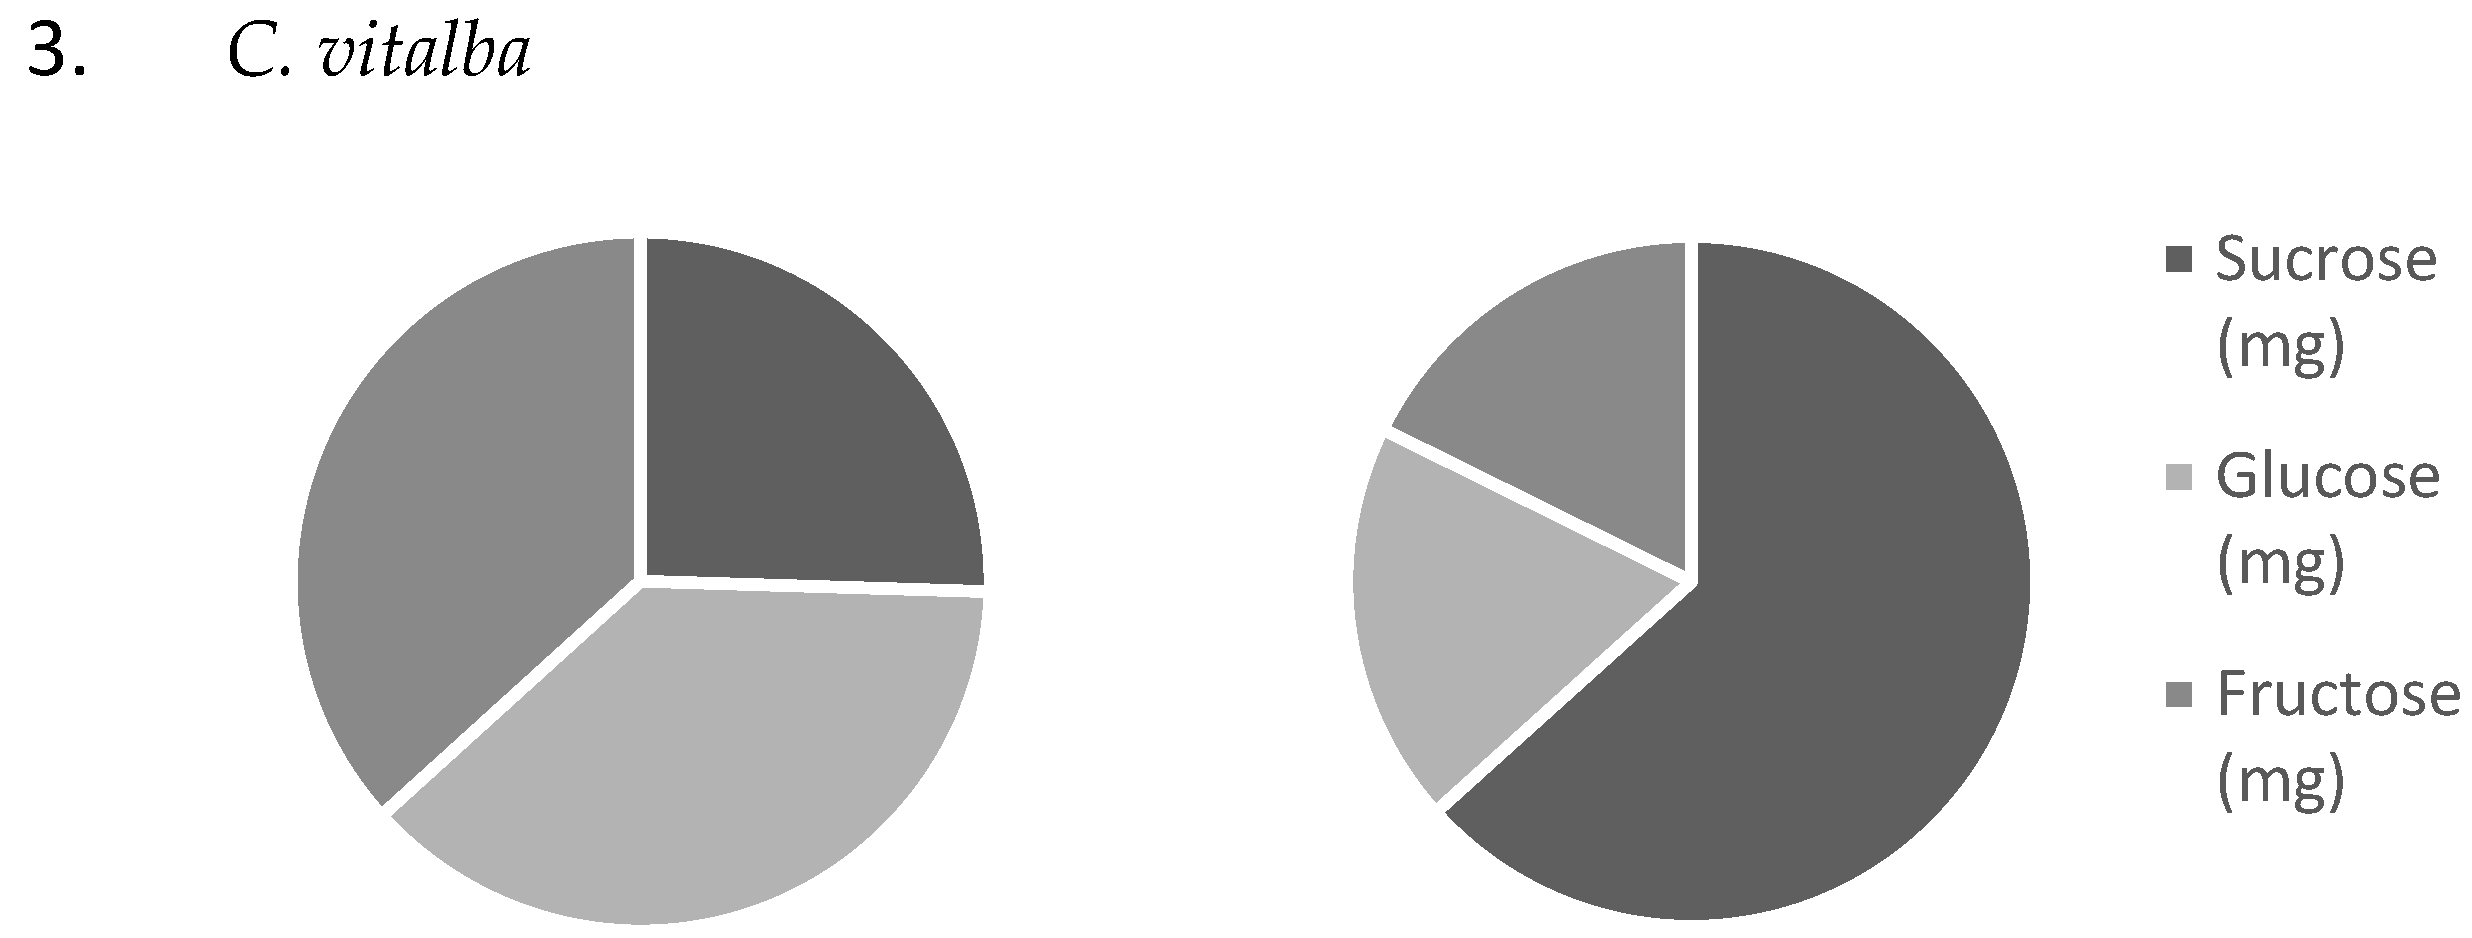
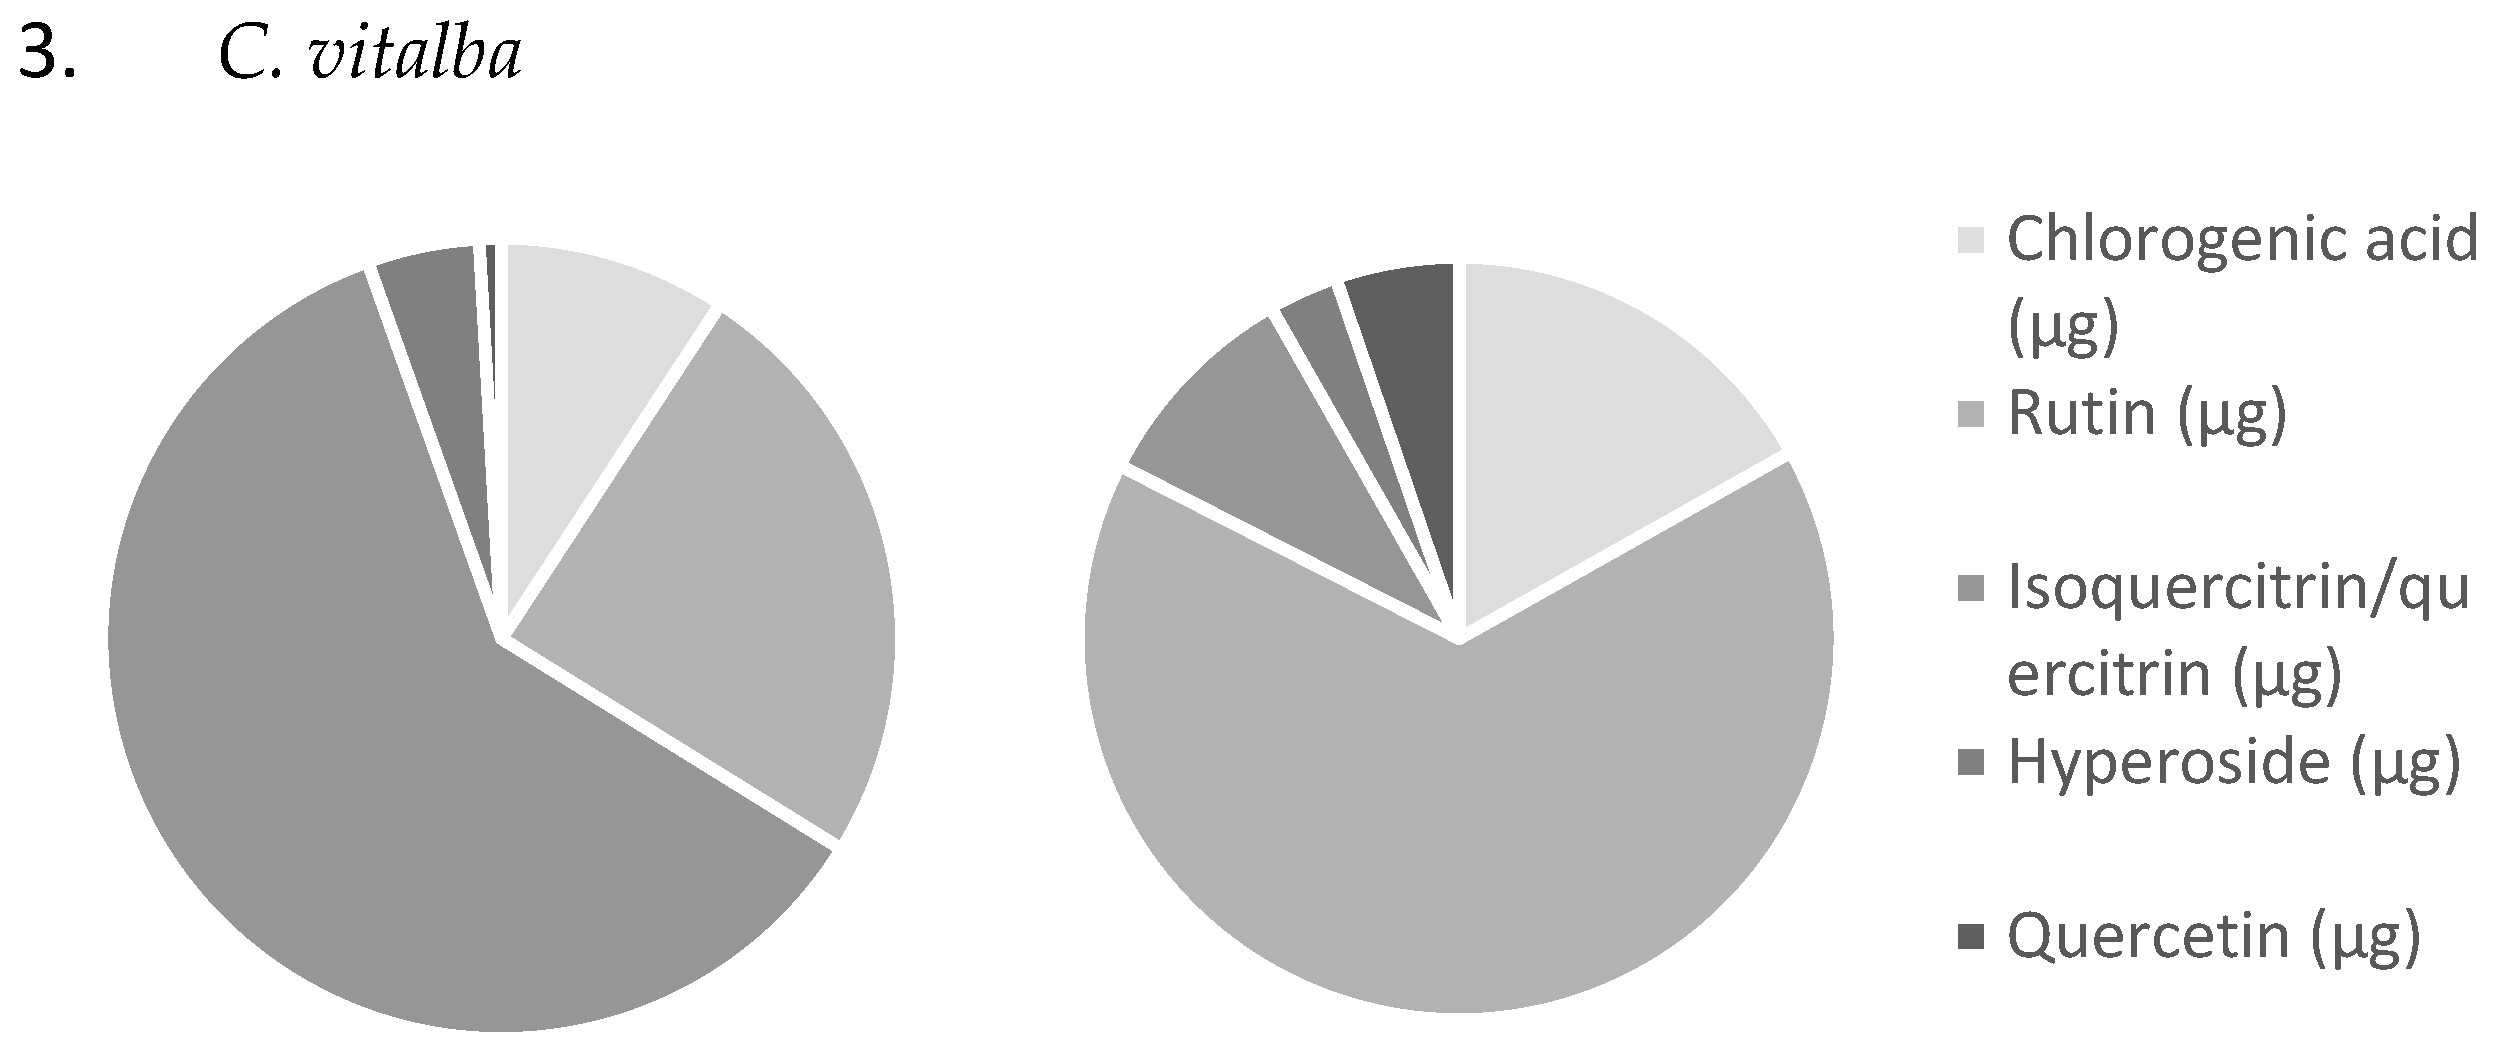
Comparison of the two sampling methods across all investigated species also revealed differences in which sugar was most abundant (Figure 8). In nectar collected with microcapillaries from C. vitalba, sucrose was the dominant sugar, whereas in nectar samples obtained using the flower-washing method, hexoses (glucose or fructose) predominated. In C. palustris, hexoses were dominant in both methods. Considering that the sucrose-to-hexose ratio provides more insight into nectar composition, the ratio between hexoses is not relevant. A comparison of nectar sampling methods for A. nemorosa was not possible because nectar could not be extracted with microcapillaries.
Figure 8.
Each pie chart was generated using the mean data for each collection method (Table 2). The left pie chart shows the washing method, and the right one shows the capillary method.
Although both methods were performed on the same days and times, and thus under the same abiotic conditions, large discrepancies were observed between results. The higher average sugar masses in the washing method may be due to the leaking of compounds from the flower that are not strictly part of the nectar. Therefore, the washing method is not considered suitable for precise qualitative sugar analysis. To accurately determine the initial sugar mass in samples, the initial nectar volume before dilution would also need to be known. The lower sugar mass in microcapillary samples could also be explained by the effect of sugar on nectar viscosity: at higher sugar concentrations, nectar is more difficult to draw into the capillary.
3.3. Phenolic Compounds Mass in Nectar
Phenolic compounds are present in nectar in lower concentrations. Six selected phenolic compounds were investigated: chlorogenic acid, rutin, isoquercitrin/quercitrin, hyperoside, and quercetin. Comparison of the two sampling methods revealed differences in the mass of phenolic compounds in some species (Table 6).
Table 6.
Mean, median, and standard deviations of phenolic compound mass per flower are presented in this table for each investigated plant species and collecting method. Median (mean ± SD). N = 96 for the capillary method represents the total number of samples; unsuccessful attempts and non-detectable values were included in statistical analysis.
Because the data showed a non-normal distribution, we selected the non-parametric Mann–Whitney U test to compare the groups. The non-parametric analysis for phenolic compounds demonstrated a mirrored methodological pattern, with the washing method extracting a broader range and significantly higher masses of phenolics.
For A. nemorosa, a comparative statistical analysis was impossible due to a lack of capillary data, as it was technically unfeasible to collect nectar using the capillary method. Consequently, only the descriptive metabolic data from the washing method are presented for this species.
For C. palustris, the collection method had no statistically significant effect on the mass of chlorogenic acid (U = 913, p = 0.097). However, a significant difference was observed for quercetin (p = 0.020), and highly significant differences (all p < 0.001) were found across all other analyzed phenolic compounds, with the washing method consistently yielding higher masses.
For C. vitalba, highly significant differences (all p < 0.001) were observed across all analyzed phenolic compounds, confirming that the washing method yields uniformly higher masses compared to the highly restricted capillary approach.
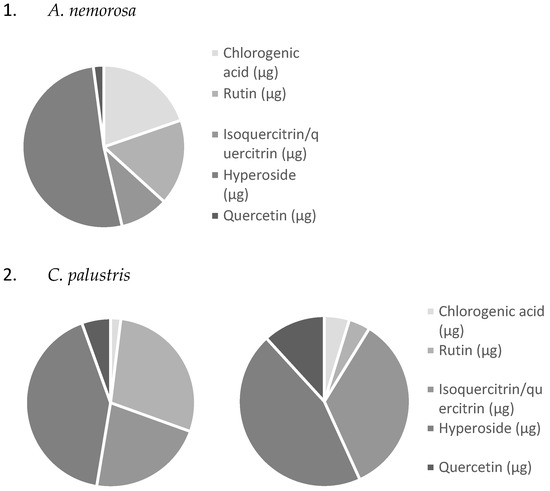
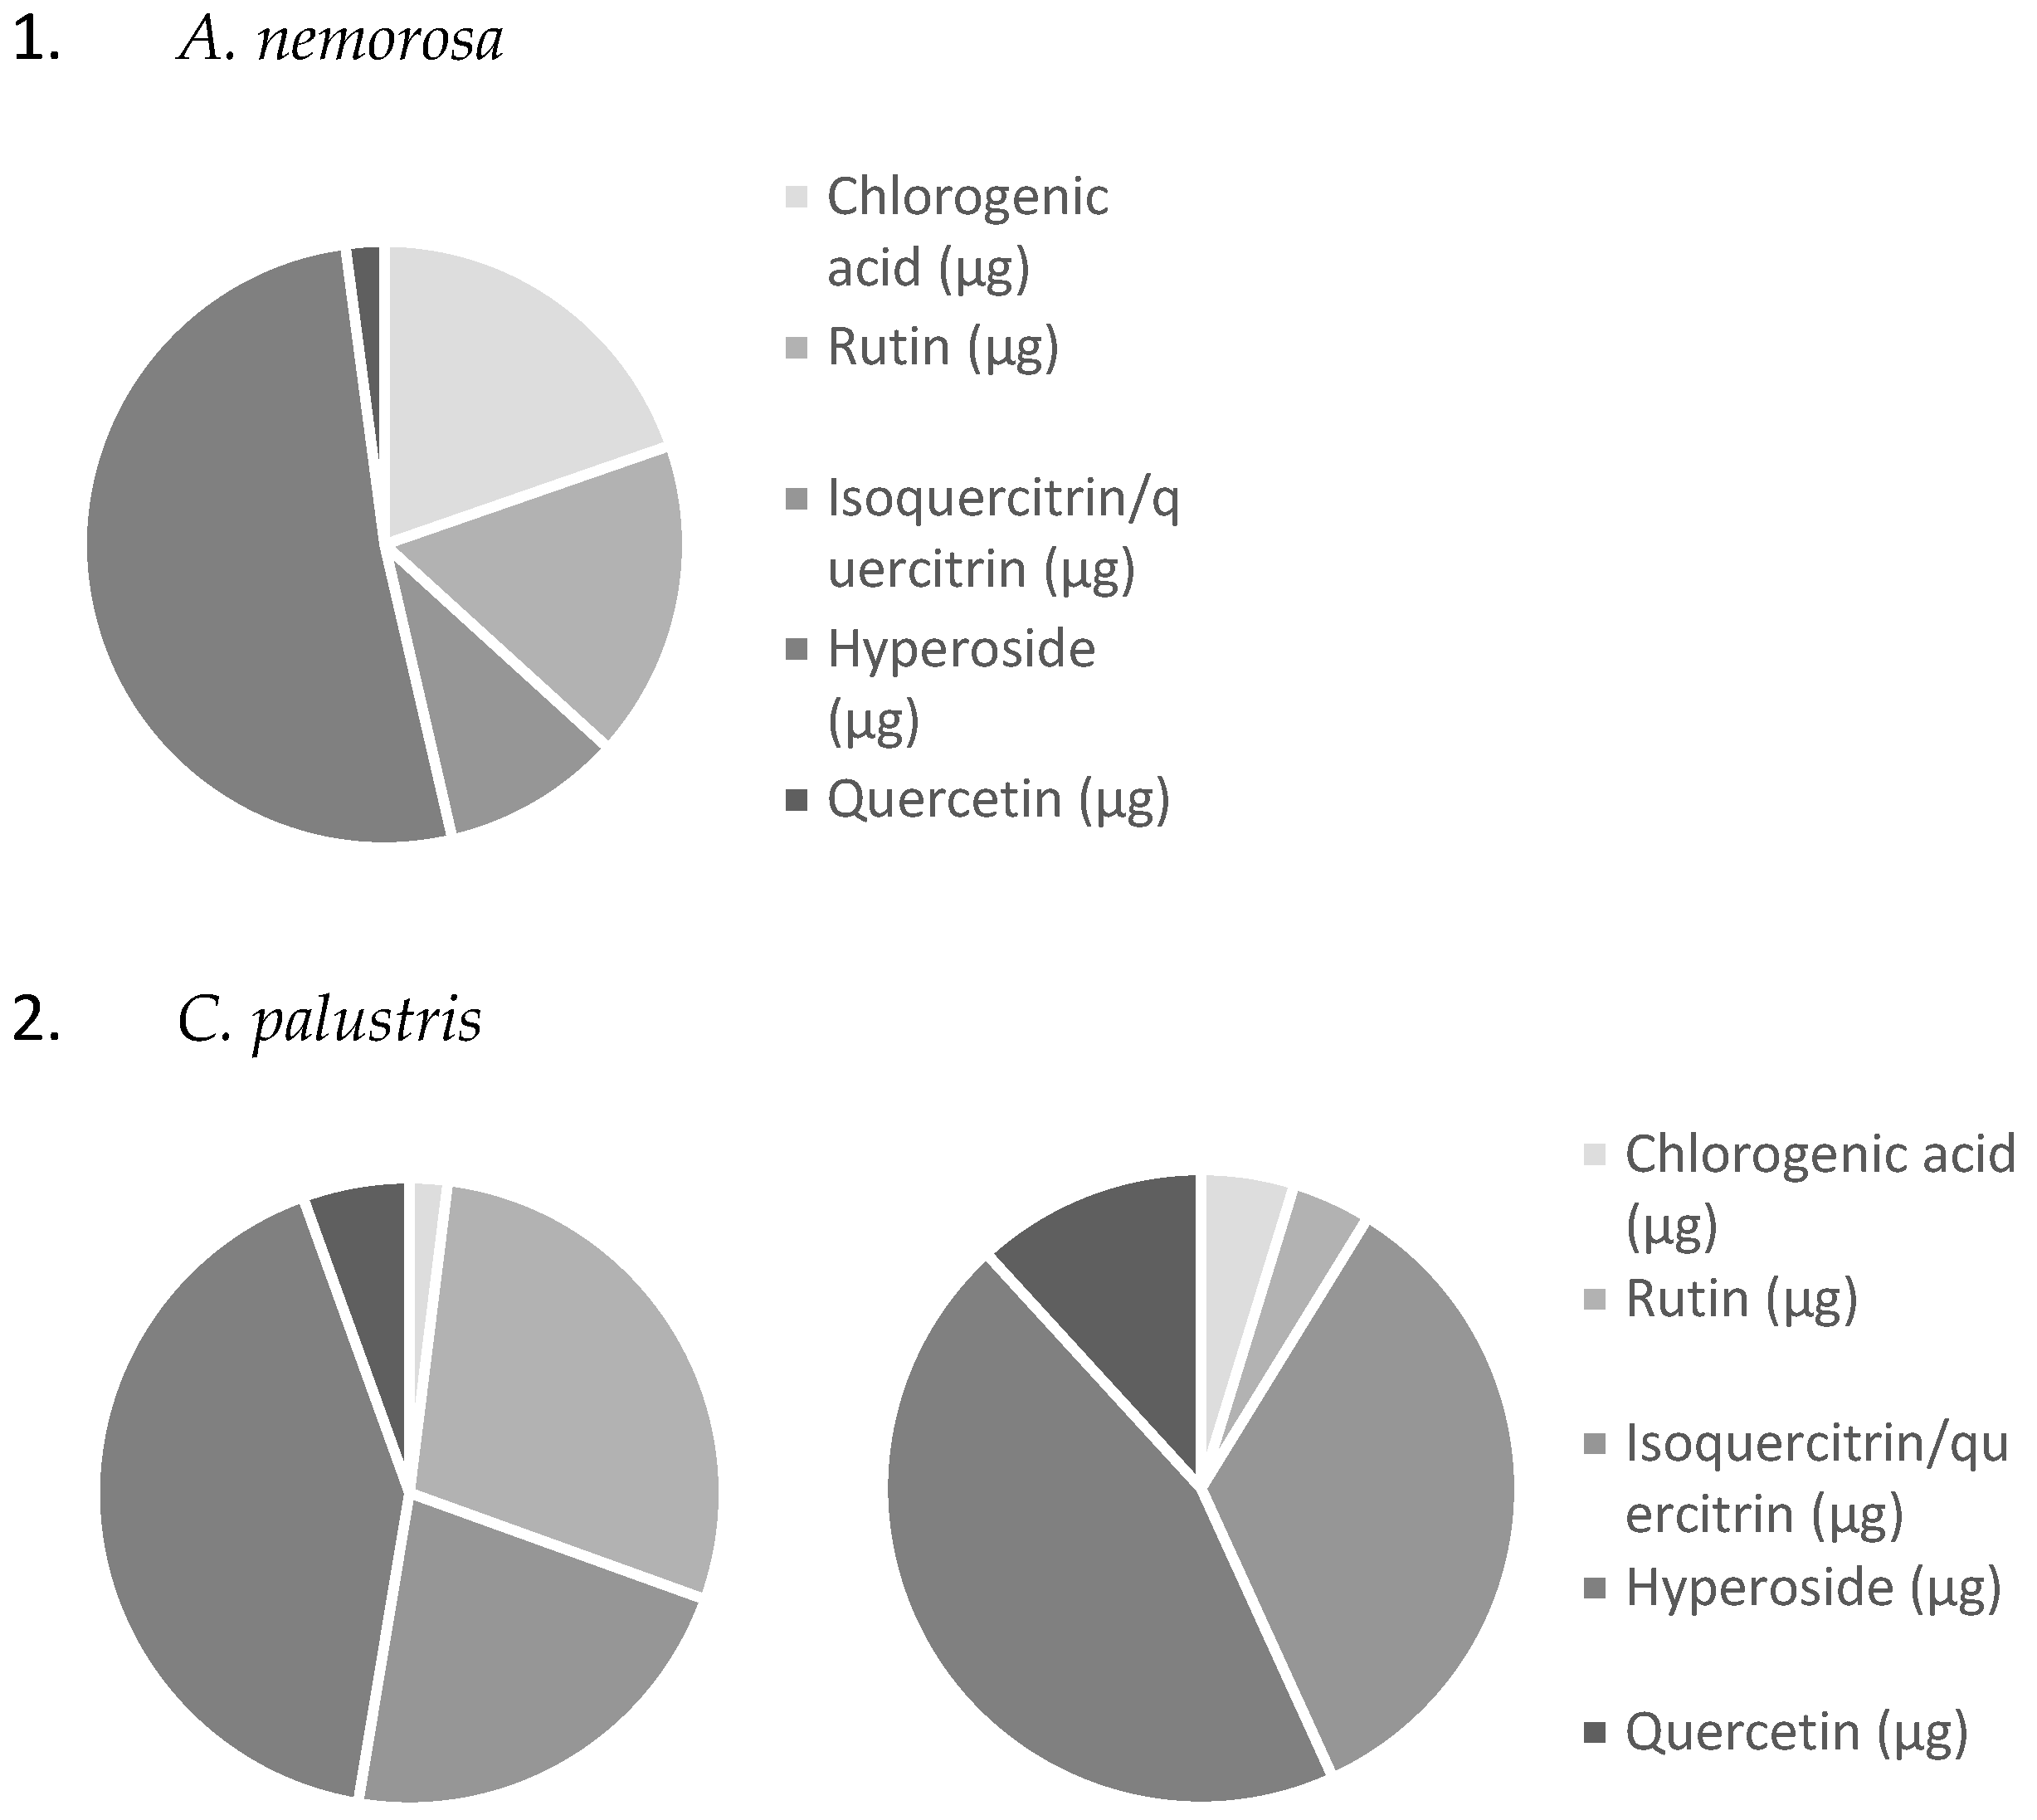
Comparison of the two sampling methods across all investigated species also revealed differences in which phenolic compound was most abundant (Figure 9). In C. vitalba, rutin predominated in nectar collected via microcapillaries, but not in the washing method, where isoquercitrin/quercitrin predominated. In C. palustris, hyperoside predominated in both methods samples. A. nemorosa nectar sampling methods comparison was not possible because nectar could not be extracted with microcapillaries.
Figure 9.
Each pie chart was generated using the mean data for each collection method (Table 3). The left pie chart shows the washing method, and the right one shows the capillary method.
Despite this agreement, the average mass of phenolic compounds differed between methods. This discrepancy is likely due to additional phenolic compounds leaching from cut flower tissues into the samples during the washing procedure. Therefore, the washing method is not considered suitable for precise qualitative analysis of phenolic compounds.
3.4. Amino Acids Mass in Nectar
Amino acids are also present in nectar at low concentrations. Six selected amino acids were analyzed: proline, isoleucine, leucine, methionine, alanine, and tyrosine. Comparison of the two sampling methods revealed differences in the mass of amino acids in some species (Table 7).
Table 7.
Mean, median, and standard deviations of phenolic compound mass per flower are presented in this table for each investigated plant species and collecting method. Median (mean ± SD). N = 96 for the capillary method represents the total number of samples; unsuccessful attempts and non-detectable values were included in statistical analysis.
Because the data showed a non-normal distribution, we selected the non-parametric Mann–Whitney U test to compare the groups. The non-parametric analysis for amino acid masses mirrored the trends observed for sugars and phenolics, with the washing method yielding significantly higher total masses across all analyzed amino acids.
For C. palustris, the collection method significantly influenced the detected masses of proline (p = 0.002) and methionine (p = 0.001), while highly significant differences (all p < 0.001) were observed for the remaining three amino acids.
For C. vitalba, highly significant differences (all p < 0.001) were consistently found across all five investigated amino acids, confirming that the washing method yields uniformly higher masses compared to the highly restricted capillary approach in this species.
Finally, a comparative statistical analysis for amino acids was impossible for A. nemorosa. This was due to a complete lack of capillary data, as it was technically unfeasible to collect nectar via the capillary method for this specific species. Consequently, only the descriptive amino acid data from the washing method are presented for A. nemorosa.
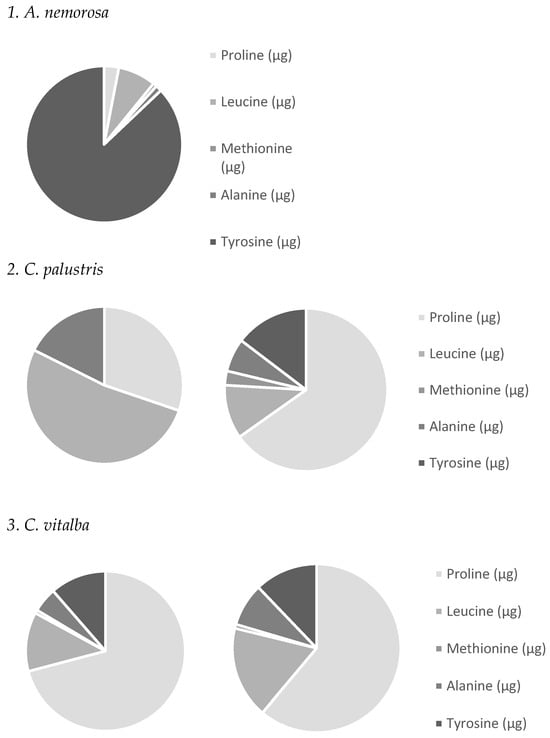
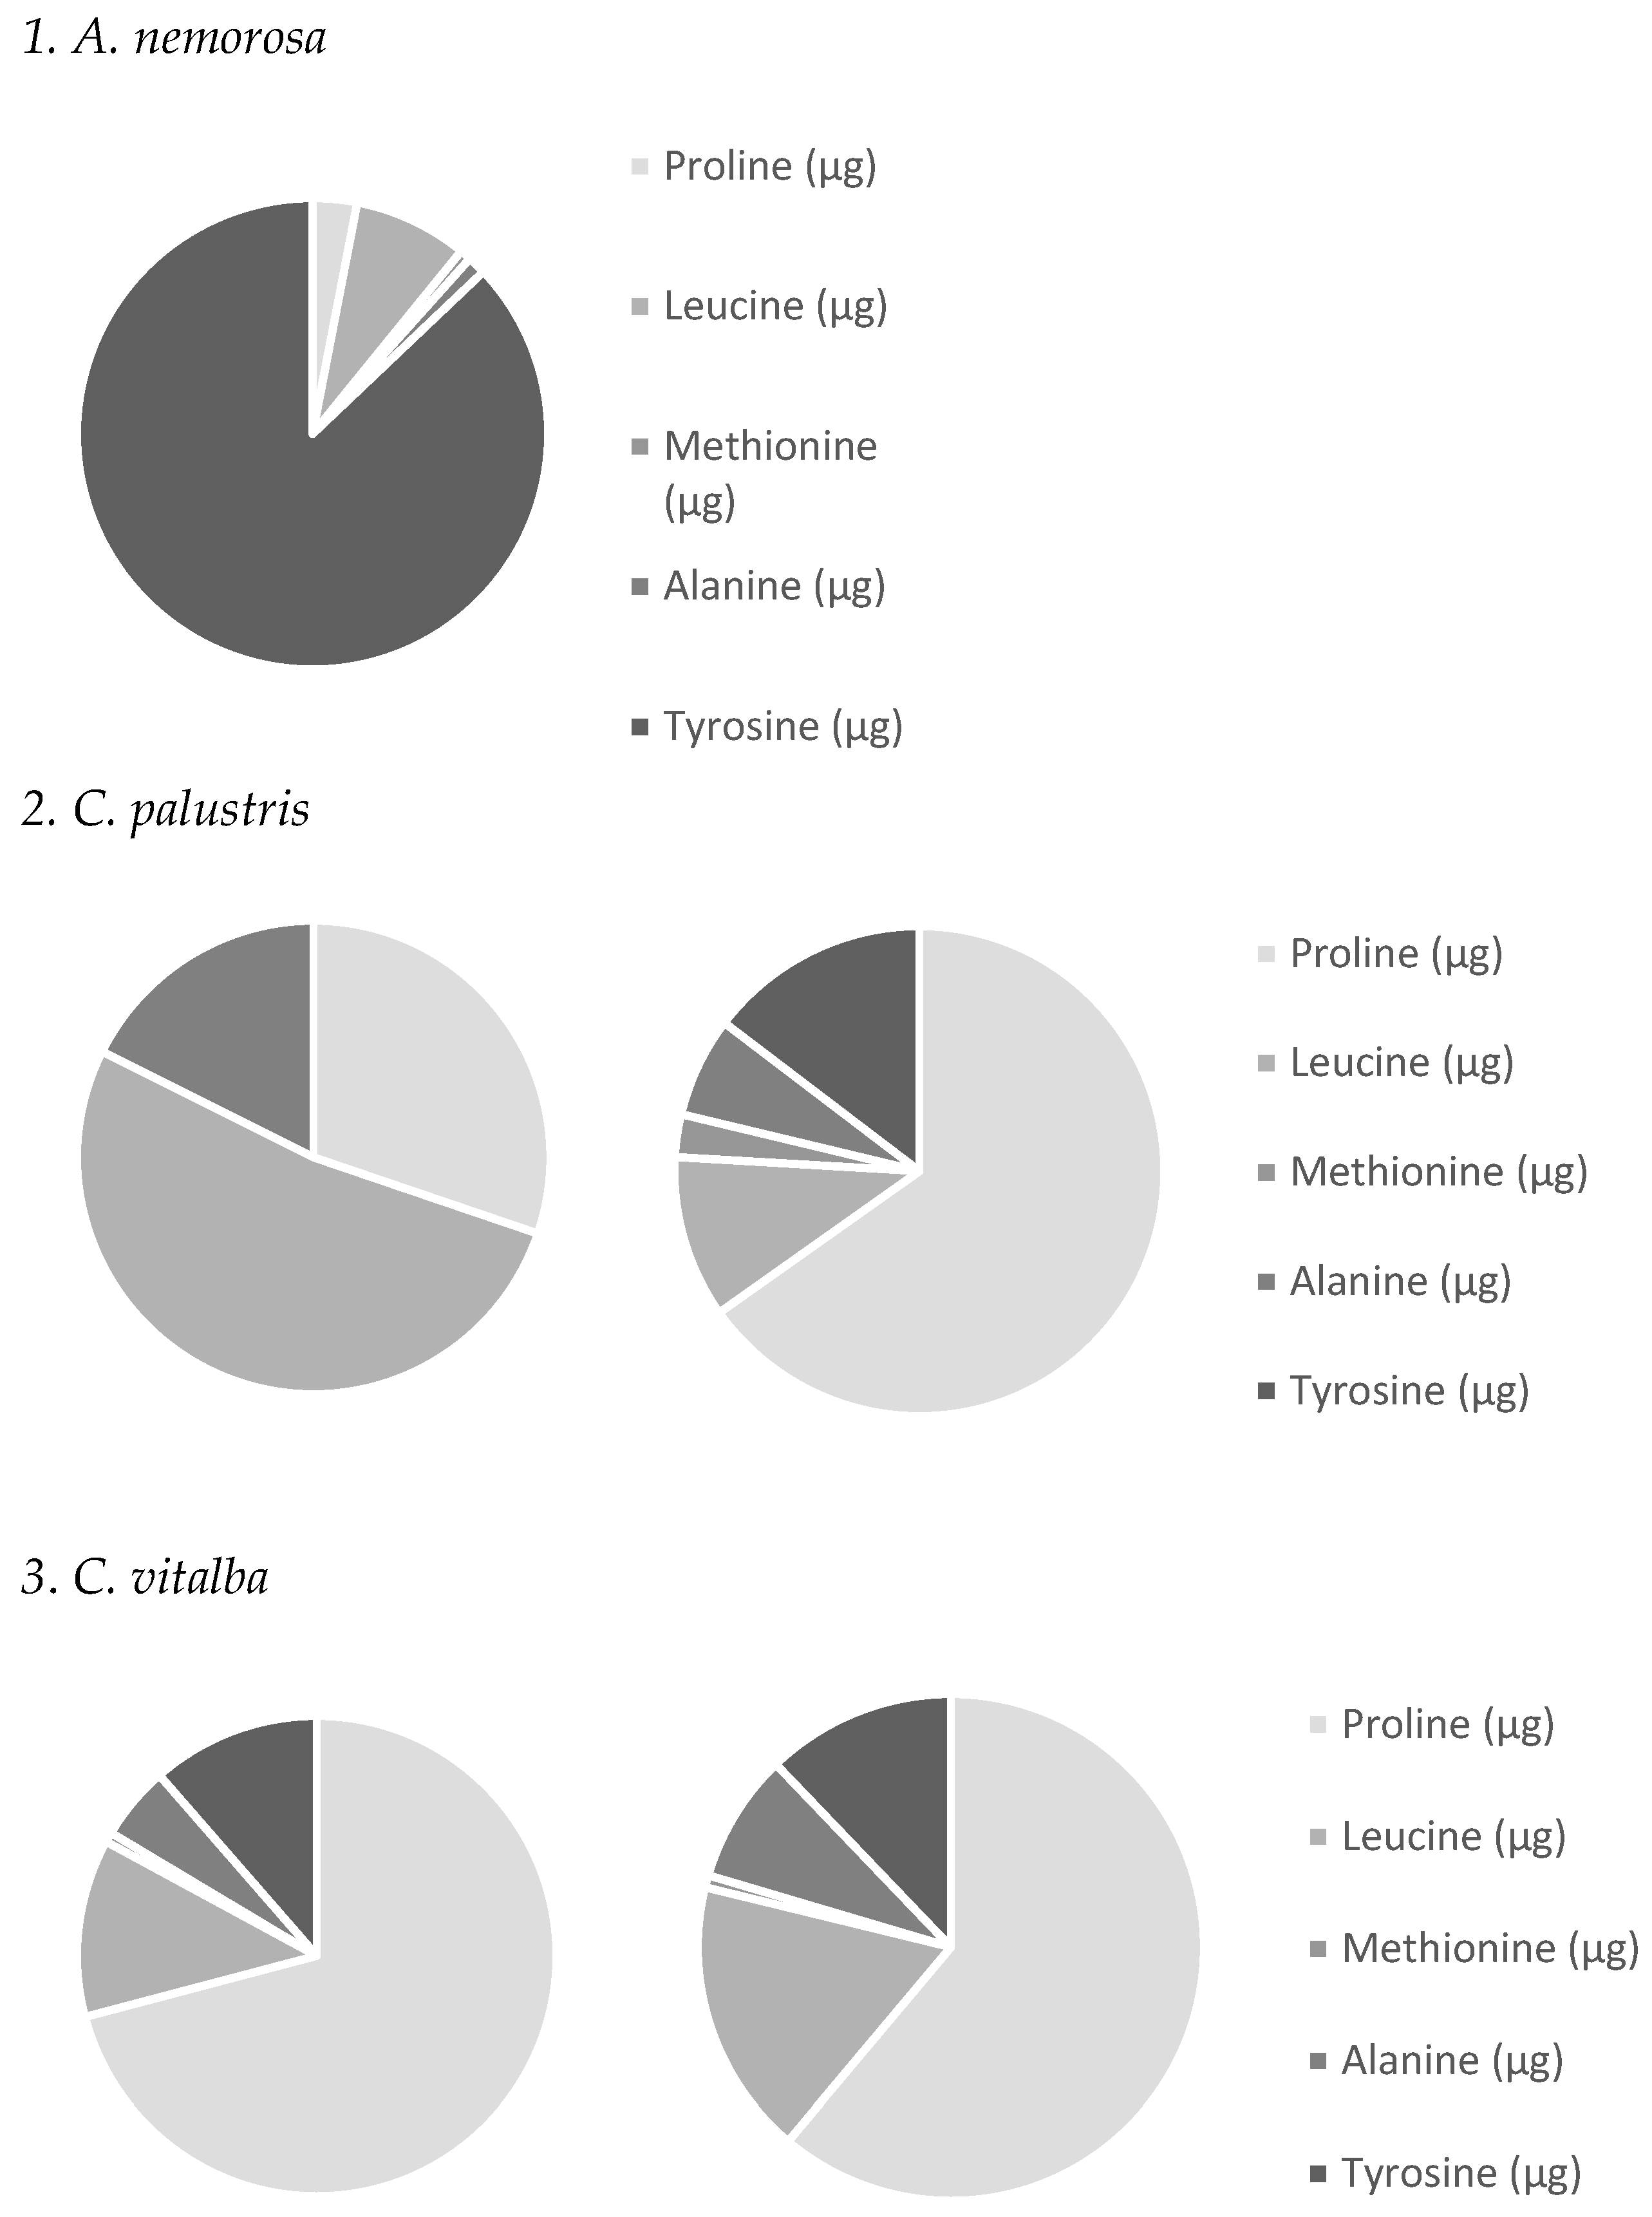
In both plant species sampled with microcapillaries, proline was the dominant amino acid (Figure 10). In the flower-washing method, proline did not dominate in C. palustris, but it did in C. vitalba. A. nemorosa nectar sampling methods comparison was not possible because nectar could not be extracted with microcapillaries.
Figure 10.
Each pie chart was generated using the mean data for each collection method (Table 4). The left pie chart shows the washing method, and the right one shows the capillary method.
The average amino acid masses obtained with the washing method were considerably higher than those obtained with microcapillaries. Therefore, the washing method is not considered suitable for precise qualitative analysis of amino acids.
3.5. Pros and Cons of Each Method of Nectar Sampling
The findings confirm that the flower-washing method is unreliable and remains useful only in a limited number of cases. Therefore, the microcapillaries method is also useful for shallow flowers with less nectar, but with some limits (Table 8).
Table 8.
Pros and cons of each method of nectar sampling.
4. Discussion
Nectar is a fundamental food source for pollinators and plays a crucial role in plant–pollinator interactions, affecting pollinator visitation, foraging behavior, and ultimately plant reproductive success [1,2,3,4,5,42,43,44]. In this study, the focus was placed on the nectar of three native plant species from the Ranunculaceae family: Caltha palustris, Anemone nemorosa, and Clematis vitalba, which display considerable diversity in floral morphology and nectary structure. Nectar is secreted through specialized glands, or nectaries, which differ in size, shape, and position on the flower [43,46,47,48,53,54]. This morphological variation, combined with differences in nectar volume, makes sampling particularly challenging and requires careful selection of appropriate sampling methods.
Although refractometry is a simple and commonly used technique to measure sugar concentration, detailed quantitative and qualitative analyses of nectar components require more precise methods. The species that we studied have morphologically diverse flowers and nectaries [25], necessitating the use of complementary sampling techniques. Based on prior studies [26,33,34,35,36,37,39], microcapillary sampling and flower-washing were employed [37]. In Ranunculaceae, microcapillary sampling was most straightforward in our previous study with Helleborus niger [30], a species with relatively large flowers whose deep nectaries are formed by petals [53]. By contrast, sampling was more difficult in researched species such as C. palustris and C. vitalba, where nectar is secreted from carpellary nectaries in C. palustris or the staminal base in C. vitalba, respectively [48,49,50]. These nectaries are exposed and prone to evaporation, especially under dry conditions. Similarly, in Anemone nemorosa, nectar is secreted from carpellary nectaries similar to those in C. palustris [48], but microcapillary sampling was completely unsuccessful, necessitating the use of flower washing.
Environmental factors strongly influenced sampling efficiency. Nectar from C. vitalba was mostly collected under dry conditions, resulting in reduced volumes and increased viscosity. Abiotic factors, particularly humidity and water availability, are well-documented to affect nectar secretion [5,26,28,29,30,31,35]. Drought can reduce nectar volume and alter its chemical composition, whereas high humidity can dilute sugars and amino acids [35]. In low-volume flowers, even minor environmental fluctuations can significantly affect nectar accessibility, extraction success, and chemical measurements. Similarly, in the dry part of the year for C. vitalba, only the washing method yielded some nectar compounds, but no samples of these compounds were collected via the capillary method. Existing literature indicates that during drought and heat, plants do not secrete nectar. This can also be indirectly seen by observing pollinators, which are practically absent in such abiotic conditions of high temperature and drought; they are only present in the early morning. Similarly, for other analyzed species (Helleborus niger, Galanthus nivalis, Salvia pratensis, Salvia glutinosa), we observed that nectar is formed under the same abiotic conditions when there is enough moisture early in the morning, and temperatures are not yet too high [30,31]. Therefore, there is considerable evidence showing that nectar compounds are not directly obtained; beekeepers also know that proper humidity and suitable temperatures are required for honey production. In drought, the production of honey, for which nectar is a component, completely drops. The findings regarding how challenging microcapillary sampling can be are consistent with McKenna and Thomson [36], who reported that microcapillary sampling is challenging in small flowers and that careful handling is essential to prevent damage to the nectary or corolla. While Morrant et al. [26] suggested that microcapillaries are unsuitable for nectar volumes below 1 µL, the results show that microcapillaries of appropriate size can successfully sample even lower volumes. These observations underscore the importance of matching capillary size to nectar volume and highlight the potential for microcapillary sampling in a wider range of flower types than previously considered. Although the method is often recommended for deep flowers, it is demonstrated to be also feasible in shallow flowers, provided that environmental conditions, particularly humidity, are suitable; otherwise, sampling becomes difficult.
Comparison of microcapillary sampling with alternative approaches, such as flower washing, illustrates both strengths and limitations of each method. Power et al. [55] reported that micro-rinse methods yield amino acid profiles comparable to microcapillary extractions, whereas high-volume rinsing (2 mL) or flower washing inflates concentrations and alters chemical composition due to contamination from dried nectar on floral tissues, pollen, vascular fluids, and cellular contents. In our study, flower-washing consistently produced higher estimates of sugar content and amino acid concentration; however, much of this increase likely originates from leaking of solutes from damaged tissues rather than true nectar. Since amounts of each substance were higher than in comparable research [55], there is no other explanation than leaking. This effect was particularly pronounced for sugars, consistent with the findings of Morrant et al. [26] and Herrera et al. [45], and can be further exacerbated when washing or rinsing durations are extended, causing additional contamination from vascular and cellular fluids.
Methodological choice has profound implications for ecological interpretation. Flower washing precludes repeated sampling of individual flowers, limiting its utility for studies of nectar secretion dynamics. In contrast, microcapillary sampling preserves floral integrity and minimizes contamination, enabling repeated measurements over time. Nevertheless, even the most efficient methods likely underestimate total sugar content, with first washes recovering only 60–90% of sugars [26]. Variation in sugar recovery across consecutive washes suggests contributions from sucrose leaching from cells or phloem, potentially influenced by invertase activity in nectaries or osmotic effects during water-based sampling [9,56]. These factors highlight the trade-off between methodological efficiency and ecological relevance.
Temporal factors, including storage and sample handling, further affect nectar composition. Morrant et al. [26] demonstrated that concentrations of glucose and fructose can change significantly over days in refrigerated nectar, even without additives, emphasizing the importance of immediate processing or controlled storage. Such temporal variability interacts with environmental factors, such as temperature and humidity, influencing nectar viscosity, sugar concentration, and overall accessibility to pollinators. In the present study, careful attention to immediate sampling and storage helped minimize these effects, but they remain critical considerations for any comparative nectar analysis, particularly in species with low-volume flowers. This investigation also included a plant species, A. nemorosa, for which nectar sampling via microcapillaries proved impossible, meaning that samples could only be obtained using the flower-washing method. However, as previously noted, the flower-washing technique can introduce extraneous sugars from damaged vegetative tissues unrelated to actual nectar secretion [38]. Sugars are partly derived from the photosynthesis of green plant tissues [5,8,57]. Although the present results demonstrated measurable sugar concentrations when utilizing the washing method, it cannot be definitively concluded that these findings reflect true nectar secretion from nectary glands. Indeed, several studies suggest that nectar may not even be secreted by this specific species [58,59,60], which is widely recognized as a floral resource where pollinators predominantly forage for pollen.
While the aforementioned literature reports an absence of nectar, a study by Erbar and Leins [48] confirmed its presence. Evidence indicates that A. nemorosa possesses carpellary nectaries structurally similar to those found in C.palustris. Consequently, it can be inferred that the flower-washing method likely extracted a certain proportion of genuine floral nectar. Nevertheless, the complete lack of capillary-harvested samples across numerous replicates may also be attributed to sampling the flowers at suboptimal temporal intervals.
Overall, this study highlights the complex interplay between flower morphology, nectar volume, abiotic factors, and sampling methodology. Microcapillary sampling remains the most reliable method for obtaining uncontaminated nectar samples when adapted to flower type and environmental conditions. Flower washing can be valuable for certain chemical analyses or for capturing total soluble compounds but must be interpreted cautiously due to potential tissue-derived contamination. A comprehensive approach that integrates methodological, morphological, and environmental considerations is essential to accurately assess nectar traits and their ecological consequences. Given that this washing method integrates the total content of nectar components, it should be emphasized that it primarily serves to monitor overall trends in nectar secretion over the course of the day or in response to changing external conditions.
In summary, understanding nectar dynamics requires careful attention to flower morphology, environmental context, and methodological rigor. The results demonstrate that even within a single plant family, nectar accessibility and chemical composition can vary widely due to structural, temporal, and abiotic factors. By combining microcapillary sampling with selective use of washing methods, researchers can obtain ecologically meaningful and chemically accurate data, enhancing the understanding of nectar-mediated plant–pollinator interactions and the evolutionary pressures shaping floral rewards.
5. Conclusions
The most reliable method for nectar sampling is the capillary method, which is suitable only for flowers with more nectar. The washing method is suitable for all flowers. Overall, microcapillary sampling provides a more accurate and reliable method for both quantitative and qualitative nectar analyses, particularly when comparing sugar composition, amino acids, and phenolic compounds. Flower-washing may overestimate concentrations and does not allow tracking of temporal dynamics. Given that this washing method integrates the total content of nectar components, it should be emphasized that it primarily serves to monitor overall trends in nectar secretion over the course of the day or in response to changing external conditions.
Author Contributions
Conceptualization, B.R. and J.B.; methodology, K.M.; validation, M.K.; formal analysis, K.M.; investigation, K.M.; data curation, K.M.; writing—original draft preparation, K.M.; writing—review and editing, B.R., J.B., M.K.; visualization, K.M.; supervision, B.R., J.B., M.K. All authors have read and agreed to the published version of the manuscript.
Funding
The authors acknowledge the financial support from the Slovenian Research and Innovation Agency (ARIS), research core funding No. P1-0005, and through the Research Programme P1-0212 (Plant Biology).
Data Availability Statement
Data is unavailable due to privacy.
Conflicts of Interest
The authors declare no conflicts of interest.
References
- Buchmann, S.L.; Naphan, G.P. The Forgotten Pollinators; Island Press: Washington, DC, USA, 1997; 292p. [Google Scholar]
- Kulloli, S.K.; Chandore, A.; Aitawade, M.M. Nectar dynamics and pollination studies in three species of Lamiaceae. Curr. Sci. 2011, 100, 509–516. [Google Scholar]
- Roy, R.; Schmitt, A.J.; Thomas, J.B.; Carter, C.J. Review: Nectar biology: From molecules to ecosystems. Plant Sci. 2017, 262, 148–164. [Google Scholar] [CrossRef] [Scilit] [PubMed]
- Baker, G.; Baker, I. Amino-acids in nectar and their evolutionary significance. Nature 1973, 241, 543–545. [Google Scholar] [CrossRef] [Scilit]
- Nicolson, S.W.; Thornburg, R.W. Nectar Chemistry. In Nectaries and Nectar; Nicolson, S., Nepi, M., Pacini, E., Eds.; Springer: New York, NY, USA, 2007; pp. 215–263. [Google Scholar]
- Pozo, M.I.; Lievens, B.; Jacquemyn, H. Impact of Microorganisms on Nectar Chemistry, Pollinator Attraction and Plant Fitness. In Nectar: Production, Chemical Composition and Benefits to Animals and Plants; Peck, R.L., Ed.; Nova Science Publishers Inc: New York, NY, USA, 2015; pp. 1–45. [Google Scholar]
- Irwin, R.E.; Cook, D.; Richardson, L.L.; Manson, J.S.; Gardner, D.R. Secondary compounds in floral rewards of toxic rangeland plants: Impacts on pollinators. J. Agric. Food Chem. 2014, 62, 7335–7344. [Google Scholar] [CrossRef] [Scilit] [PubMed]
- Bertazzini, M.; Forlani, G. Intraspecific variability of floral nectar volume and composition in rapeseed (Brassica napus L. var. oleifera). Front. Plant Sci. 2016, 7, 1–13. [Google Scholar] [CrossRef] [Scilit] [PubMed]
- Pate, J.S.; Peoples, M.B.; Storer, P.J.; Atkins, C.A. The extrafloral nectaries of cowpea (Vigna unguiculata (L.) Walp.) II. Nectar composition, origin of nectar solutes and nectary functioning. Planta 1985, 166, 28–38. [Google Scholar] [CrossRef] [Scilit] [PubMed]
- Nicolson, S. Sweet solutions: Nectar chemistry and quality. Philos. Trans. R. Soc. B 2022, 377, 20210163. [Google Scholar] [CrossRef] [Scilit] [PubMed]
- Petanidou, T. Sugars in mediterranean floral nectars: An ecological and evolutionary approach. J. Chem. Ecol. 2005, 31, 1065–1087. [Google Scholar] [CrossRef] [Scilit] [PubMed]
- Vaudo, A.D.; Tooker, J.F.; Grozinger, C.M.; Patch, H.M. Bee nutrition and floral resource restoration. Curr. Opin. Insect Sci. 2015, 10, 133–141. [Google Scholar] [CrossRef] [Scilit] [PubMed]
- Carter, C.; Shafir, S.; Yehonatan, L.; Palmer, R.G.; Thornburg, R. A novel role for proline in plant floral nectars. Naturwissenschaften 2006, 93, 72–79. [Google Scholar] [CrossRef] [Scilit] [PubMed]
- Brosemer, R.W.; Veerabhadrappa, P.S. Pathway of proline oxidation in insect flight muscle. Biochem. Biophys. Acta 1965, 110, 102–112. [Google Scholar] [CrossRef] [Scilit] [PubMed]
- Mačukanović-Jocić, M.; Djurdjević, L. Influence of microclimatic conditions on nectar exudation in Glechoma hirsuta. Arch. Biol. Sci. 2005, 57, 119–126. [Google Scholar] [CrossRef] [Scilit]
- Roguz, K.; Bajguz, A.; Chmur, M.; Gołebiewska, A.; Roguz, A.; Zych, M. Diversity of nectar amino acids in the Fritillaria (Liliaceae) genus: Ecological and evolutionary implications. Sci. Rep. 2019, 9, 1–13. [Google Scholar] [CrossRef] [Scilit] [PubMed]
- Schoonhoven, L.M.; van Loon, J.J.A.; Dicke, M. Plant Chemistry: Endless Variety. In Insect-Plant Biology; Oxford University Press: Oxford, UK, 2005; pp. 3–82. [Google Scholar]
- Agrawal, A.A.; Weber, M.G. On the study of plant defence and herbivory using comparative approaches: How important are secondary plant compounds. Ecol. Lett. 2015, 18, 985–991. [Google Scholar] [CrossRef] [Scilit] [PubMed]
- Adler, L.S. The ecological significance of toxic nectar. Oikos 2000, 91, 409–420. [Google Scholar] [CrossRef] [Scilit]
- Nepi, M. Nectary Structure and Ultrastructure. In Nectaries and Nectar; Nicolson, S., Nepi, M., Pacini, E., Eds.; Springer: New York, NY, USA, 2007. [Google Scholar]
- Riveros, A.J.; Gronenberg, W. The flavonoid rutin protects the bumble bee Bombus impatiens against cognitive impairment by imidacloprid and fipronil. J. Exp. Biol. 2022, 225, 244526. [Google Scholar] [CrossRef] [Scilit] [PubMed]
- Wang, K.; Zhang, H.; Yuan, L.; Li, X.; Cai, Y. Potential Implications of hyperoside on oxidative stress-induced human diseases: A Comprehensive Review. J. Inflamm. Res. 2023, 16, 4503–4526. [Google Scholar] [CrossRef] [Scilit]
- Li, W.; Jiang, O.; Wang, T.; Liu, J.; Chen, D. Comparison of the antioxidant effects of quercitrin and isoquercitrin: Understanding the role of the 6″-OH group. Molecules 2016, 21, 1246. [Google Scholar] [CrossRef] [Scilit] [PubMed]
- Ravnjak, B.; Bavcon, J.; Božič, J. Avtohtone Medovite Rastline; University Botanic Gardens Ljubljana, Department of Biology, Biotechnical Faculty: Ljubljana, Slovenia, 2020; 285p. [Google Scholar]
- Martinčič, A.; Wraber, T.; Jogan, N.; Podobnik, A.; Turk, B.; Vreš, B.; Ravnik, V.; Frajman, B.; Strgulc Krajšek, S.; Trčak, B. Mala Flora Slovenije: Ključ za Določanje Praprotnic in Semenk; Tehniška Založba Slovenije: Ljubljana, Slovenia, 2007; 967p. [Google Scholar]
- Morrant, D.S.; Schumann, R.; Petit, S. Field methods for sampling and storing nectar from flowers with low nectar volumes. Ann. Bot. 2008, 103, 533–542. [Google Scholar] [CrossRef] [Scilit] [PubMed]
- Kradolfer, U.; Erhardt, A. Nectar secretion patterns in Salvia pratensis L. (Lamiaceae). Flora 1995, 190, 229–235. [Google Scholar] [CrossRef] [Scilit]
- Cardoza, Y.J.; Harris, G.K.; Grozinger, C.M. Effects of soil quality enhancement on pollinator-plant interactions. Psyche J. Entomol. 2012, 4, 1–8. [Google Scholar] [CrossRef] [Scilit]
- Mačukanović Jocić, M.; Duletić-Laušević, S.; Jocic, G. Nectar production in three melliferous species of Lamiaceae in natural and experimental conditions. Acta Vet. 2004, 54, 475–487. [Google Scholar] [CrossRef] [Scilit]
- Malovrh, K.; Bavcon, J.; Križman, M.; Ravnjak, B. Effect of abiotic factors on nectar quality and secretion of two early spring species, Galanthus nivalis L. and Helleborus niger L. Diversity 2024, 16, 469. [Google Scholar] [CrossRef] [Scilit]
- Malovrh, K.; Ravnjak, B.; Bavcon, J.; Križman, M. Nectar production and three main sugars in nectar of Salvia pratensis and Salvia glutinosa in Correlation with Abiotic Factors. Agriculture 2024, 14, 668. [Google Scholar] [CrossRef] [Scilit]
- Aronne, G.; Malara, P. Fiber optic refractometer for in-vivo sugar concentration measurements of low-nectar-producing flowers. New Phytol. 2019, 224, 987–993. [Google Scholar] [CrossRef] [Scilit] [PubMed]
- Collins, B.G.; Newland, C. Honeyeater population changes in relation to food availability in the jarrah forest of Western Australia. Aust. J. Ecol. 1986, 1, 63–76. [Google Scholar] [CrossRef] [Scilit]
- Lanza, J.; Smith, G.C.; Sack, S.; Cash, A. Variation in nectar volume and composition of Impatiens capensis at the individual, plant, and population levels. Oecologia 1995, 102, 113–119. [Google Scholar] [CrossRef] [Scilit] [PubMed]
- Corbet, S.A. Nectar sugar content: Estimating standing crop and secretion rate in the field. Apidologie 2003, 34, 1–10. [Google Scholar] [CrossRef] [Scilit]
- McKenna, M.A.; Thomson, J.D. A technique for sampling and measuring small amounts of floral nectar. Ecology 1988, 69, 1306–1307. [Google Scholar] [CrossRef] [Scilit]
- Mallick, A.S. Technique for washing nectar from the flowers of Tasmanian leatherwood (Eucryphia lucida, Eucryphiaceae). Aust. Ecol. 2000, 25, 210–212. [Google Scholar] [CrossRef]
- Nunez, J. Nectar flow by melliferous flora and gathering flow in Apis mellifera ligusta. J. Insect Physiol. 1977, 23, 265–275. [Google Scholar] [CrossRef] [Scilit]
- Swanson, C.A.; Shuel, B.W. The centrifuge method for measuring nectar yield. Plant Physiol. 1950, 25, 513–520. [Google Scholar] [CrossRef] [Scilit] [PubMed]
- Armstrong, D.P.; Paton, D.C. Methods for measuring amounts of energy available from banksia inflorescences. Aust. J. Ecol. 1990, 15, 24l–297. [Google Scholar] [CrossRef] [Scilit]
- Jogan, N.; Bačič, T.; Frajman, B.; Leskovar, I.; Naglič, D.; Podobnik, A.; Rozman, B.; Strgulc-Krajšek, S.; Trčak, B. Gradivo za Atlas Flore Slovenije; Center za Kartografijo Favne in Flore: Miklavž na Dravskem polju, Slovenia, 2001. [Google Scholar]
- Bavcon, J.; Ravnjak, B.; Bavcon, D. Cvetne Formule Rastlinskih Družin v Botaničnem Vrtu Univerze v Ljubljani = Floral Formulas of Plant Families in the University Botanic Gardens Ljubljana; University Botanic Gardens Ljubljana: Ljubljana, Slovenia, 2017. [Google Scholar]
- Kosuge, K. Petal evolution in Ranunculaceae. Plant Syst. Evol. 1994, 8, 185–191. [Google Scholar] [CrossRef] [Scilit] [PubMed]
- Bernardello, G. A Systematic Survey of Floral Nectaries. In Nectaries and Nectar; Nicolson, S.W., Nepi, M., Pacini, E., Eds.; Springer: Dordrecht, The Netherlands, 2007; pp. 19–128. [Google Scholar]
- Herrera, C.M.; Perez, R.; Alonso, C. Extreme interplant variation in nectar sugar composition in an insect pollinated perennial herb. Am. J. Bot. 2006, 93, 575–581. [Google Scholar] [CrossRef] [Scilit] [PubMed]
- Petanidou, T.; Goethals, V.; Smets, E. Nectary structure of Labiatae in relation to their nectar secretion and characteristics in a Mediterranean shrub community: Does flowering time matter? Plant Syst. Evol. 2000, 225, 103–118. [Google Scholar] [CrossRef] [Scilit]
- Heywood, V. Cvetnice: Kritosemenke Sveta; DZS: Ljubljana, Slovenia, 1995; 335p. [Google Scholar]
- Erbar, C.; Leins, P. Nectar production in the pollen flower of Anemone nemorosa in comparison with other Ranunculaceae and Magnolia (Magnoliaceae). Org. Divers. Evol. 2013, 13, 287–300. [Google Scholar] [CrossRef] [Scilit]
- Peterson, R.L.; Scott, M.G.; Miller, S.L. Some Aspects of carpel structure in Caltha palustris L. (Ranunculaceae). Am. J. Bot. 1979, 66, 334. [Google Scholar] [CrossRef] [Scilit]
- Kratochwil, A. Zur Bestäubungsstrategie von Pulsatilla vulgaris Mill. Flora 1988, 181, 261–324. [Google Scholar] [CrossRef] [Scilit]
- ARSO [Agencija Republike Slovenije za Okolje]. Available online: https://www.arso.gov.si/ (accessed on 15 January 2026).
- Kostryco, M.; Chwil, M. Nectar abundance and nectar composition in selected Rubus idaeus L. varieties. Agriculture 2022, 12, 1132. [Google Scholar] [CrossRef] [Scilit]
- Vesprini, J.L.; Nepi, M.; Pacini, E. Nectary structure, nectar secretion patterns and nectar composition in two Helleborus species. Plant Biol. 2008, 1, 560–568. [Google Scholar]
- Weryszko-Chmielweska, E. Ecological features of flowers including nectary structure of chosen species from Lamiaceae family. Fitoterapia 2000, 69, 191–192. [Google Scholar]
- Power, E.F.; Stabler, D.; Borland, A.M.; Barnes, J.; Wright, G.A. Analysis of nectar from low-volume flowers: A comparison of collection methods for free amino acids. Methods Ecol. Evol. 2018, 9, 734–743. [Google Scholar] [CrossRef] [Scilit] [PubMed]
- De la Barrera, E.; Nobel, P.S. Nectar: Properties, floral aspects, and speculations on origin. Trends Plant Sci. 2004, 9, 65–69. [Google Scholar] [CrossRef] [Scilit] [PubMed]
- Pacini, E.; Nepi, M. Nectar Production and Presentation. In Nectaries and Nectar; Nicolson, S., Nepi, M., Pacini, E., Eds.; Springer: New York, NY, USA, 2007; pp. 167–214. [Google Scholar]
- Denisow, B.; Anton, S.; Wrzesien, M. Morphology of Anemone sylvestris L. flower (Ranunculaceae). Acta Bot. Croat. 2016, 75, 74–80. [Google Scholar] [CrossRef] [Scilit]
- Kasiotis, K.; Baira, E.; Iosifidou, S.; Bergele, K.; Manea-Karga, E.; Theologidis, L.; Barmpouni, T.; Tsipi, D.; Machera, K. Characterization of Ikaria Heather honey by untargeted ultrahigh-performance liquid chromotography high resolution mass spectrometry metabolomics and melissopalynological analysis. Front. Chem. 2022, 10, 924881. [Google Scholar] [CrossRef] [Scilit] [PubMed]
- Stawiarz, E. Pollen of non-nectariferous plants in the microscopic image of honey of some communes of the Swiertokryskie voivodeship. Acta Agrobot. 2009, 62, 53–58. [Google Scholar]

Disclaimer/Publisher’s Note: The statements, opinions and data contained in all publications are solely those of the individual author(s) and contributor(s) and not of MDPI and/or the editor(s). MDPI and/or the editor(s) disclaim responsibility for any injury to people or property resulting from any ideas, methods, instructions or products referred to in the content. |
© 2026 by the authors. Licensee MDPI, Basel, Switzerland. This article is an open access article distributed under the terms and conditions of the Creative Commons Attribution (CC BY) license.