


Abstract
Effective conservation of the Near Threatened (NT) black-necked crane (Grus nigricollis) requires standardized frameworks for organizing multi-scale biodiversity data. This study proposes the Essential Biodiversity Variables (EBV) system as an optimal structure for archiving and sharing biodiversity data such as Habitat Suitability Index (HSI). Developed by the Group on Earth Observations Biodiversity Observation Network (GEO BON), the EBV framework is an emerging system offering a robust solution for standardizing data exchange. Based on 483,592 valid location records of 106 black-necked cranes using satellite telemetry, we apply species distribution models and demonstrate how the multi-dimensional EBV architecture accommodates distinct life-stage preferences: breeding sites favor mid-elevations modulated by temperature; migration staging relies on precipitation regimes; and wintering grounds are driven by moisture availability and the avoidance of human-modified landscapes. The EBV NetCDF (Network Common Data Form) format functions as a self-describing hypercube that captures spatial, temporal, and life-stage dimensions while ensuring metadata transparency. This integration facilitates critical applications, including the identification of priority conservation areas and climate vulnerability assessments, thereby bridging the gap between species-specific modeling and global biodiversity monitoring standards.
1. Introduction
The conservation of endangered species requires not only detailed ecological knowledge but also standardized frameworks for organizing, sharing, and analyzing biodiversity data at multiple scales [1]. The black-necked crane (Grus nigricollis), classified as Near Threatened (NT) on the IUCN Red List with a global population of approximately 17,389–17,610 individuals [2], represents the challenges facing high-altitude wetland species whose annual cycle spans distinct ecological zones across the Qinghai–Tibetan and Yunnan-Guizhou Plateaus [3]. Understanding and monitoring the habitat requirements of this species across its breeding, migration, and wintering stages demands sophisticated analytical tools and, critically, appropriate data formats that can capture the multi-dimensional nature of habitat suitability information [3,4,5].
The Group on Earth Observations Biodiversity Observation Network (GEO BON) and its Essential Biodiversity Variables (EBVs) system provide a standardized infrastructure for biodiversity monitoring and data sharing [1,6]. GEO BON represents a global partnership established to address the fragmentation that historically characterized biodiversity monitoring efforts worldwide [6]. Unlike climate change monitoring, which benefited from well-established frameworks like the Global Climate Observing System, biodiversity observation remained scattered across millions of uncoordinated local, national, and international activities, making it difficult to assess global trends or compare findings across regions [7]. GEO BON emerged under the supports of the Group on Earth Observations, a voluntary partnership now comprising over 73 national governments and 46 participating organizations, to create a coherent system for collecting, managing, analyzing, and reporting biodiversity data at multiple scales [6].
EBVs represent a paradigm shift in biodiversity monitoring methodology, providing a minimal set of measurements necessary to capture the major dimensions of biodiversity change in a complementary fashion [1]. The concept was inspired by the Essential Climate Variables (ECVs) that guide the Global Climate Observing System under the United Nations Framework Convention on Climate Change, adapted to address the greater complexity and multidimensionality of biodiversity compared to climatic parameters [6]. The EBV framework serves as an intermediate abstraction layer between primary observations, such as those derived from different sampling events, methodologies, or monitoring programs, and aggregated indicators like the Living Planet Index [1,8].
The strategic positioning of EBVs as an intermediate layer enables several important functions. First, it allows valid aggregation of data from multiple monitoring programs that may use different methodologies or target different taxonomic groups, creating harmonized datasets that support regional and global assessments [8]. Second, it maintains flexibility in the species or taxonomic groups addressed, accommodating the varying data availability across different organism groups [9]. Third, EBVs are designed to be insulated from changing technologies at the observation level and evolving approaches at the indicator level, providing a stable foundation for long-term monitoring that can accommodate technological advances without requiring fundamental restructuring [1,10].
The EBV framework encompasses six classes organized hierarchically from genetic composition to ecosystem function, reflecting the multi-level nature of biodiversity itself [1].
- Genetic Composition variables measure the genetic diversity within species populations, including allelic diversity and co-ancestry measures, with temporal sensitivity aligned with generation time.
- Species Population variables encompass both Species Distribution (SD EBV) and Species Abundance (SA EBV), representing probability of occurrence and predicted counts of individuals, respectively.
- Species Traits capture functional characteristics including phenology, body mass, and behavioral attributes that often respond rapidly to environmental perturbations.
- Community Composition addresses the diversity and structure of species assemblages, typically with temporal sensitivities of five to over ten years.
- Ecosystem Structure encompasses variables related to habitat structure and physical characteristics measurable through remote sensing.
- Ecosystem Function addresses biogeochemical and ecological processes including nutrient retention and productivity.
Among the EBV classes, Species Population variables are particularly relevant to the black-necked crane because they directly address the spatial and temporal patterns of species occurrence that underpin habitat suitability assessments [1]. The species population distribution EBV represents the probability of occurrence over contiguous spatial and temporal units. The operationalization of this EBV has usually benefited from existing data infrastructure including the Global Biodiversity Information Facility (GBIF) [11] for species occurrence data and the Map of Life [12] for coordinated data assembly and modeled outputs. These platforms provide foundational data streams that can be synthesized into EBV products, while the BON in a Box platform enables the development of processing pipelines that transform raw occurrence data into standardized EBV formats [13].
Despite the sophisticated design of the EBV framework, the EBV Data Portal currently hosts only 48 EBVs (https://portal.geobon.org/datasets, accessed on 11 July 2026). The potential value of the EBV framework has not been recognized. This study aims to promote the utility of EBVs through a comprehensive case study of the black-necked crane.
The EBV format offers an optimal structure for organizing, storing, and sharing Habitat Suitability Index (HSI) data for the black-necked crane across its annual cycle. This integration combines the standardization benefits of the EBV framework with the ecological specificity of HSI assessments, enabling more effective conservation planning and policy support [13].
2. Methods
2.1. Occurrence Data
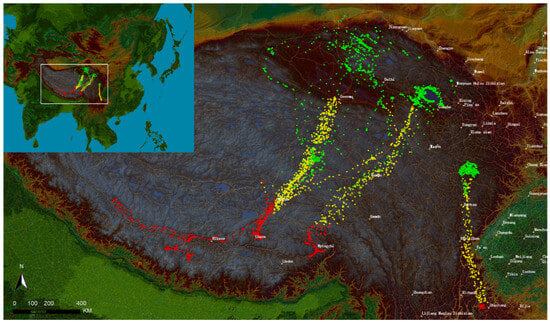
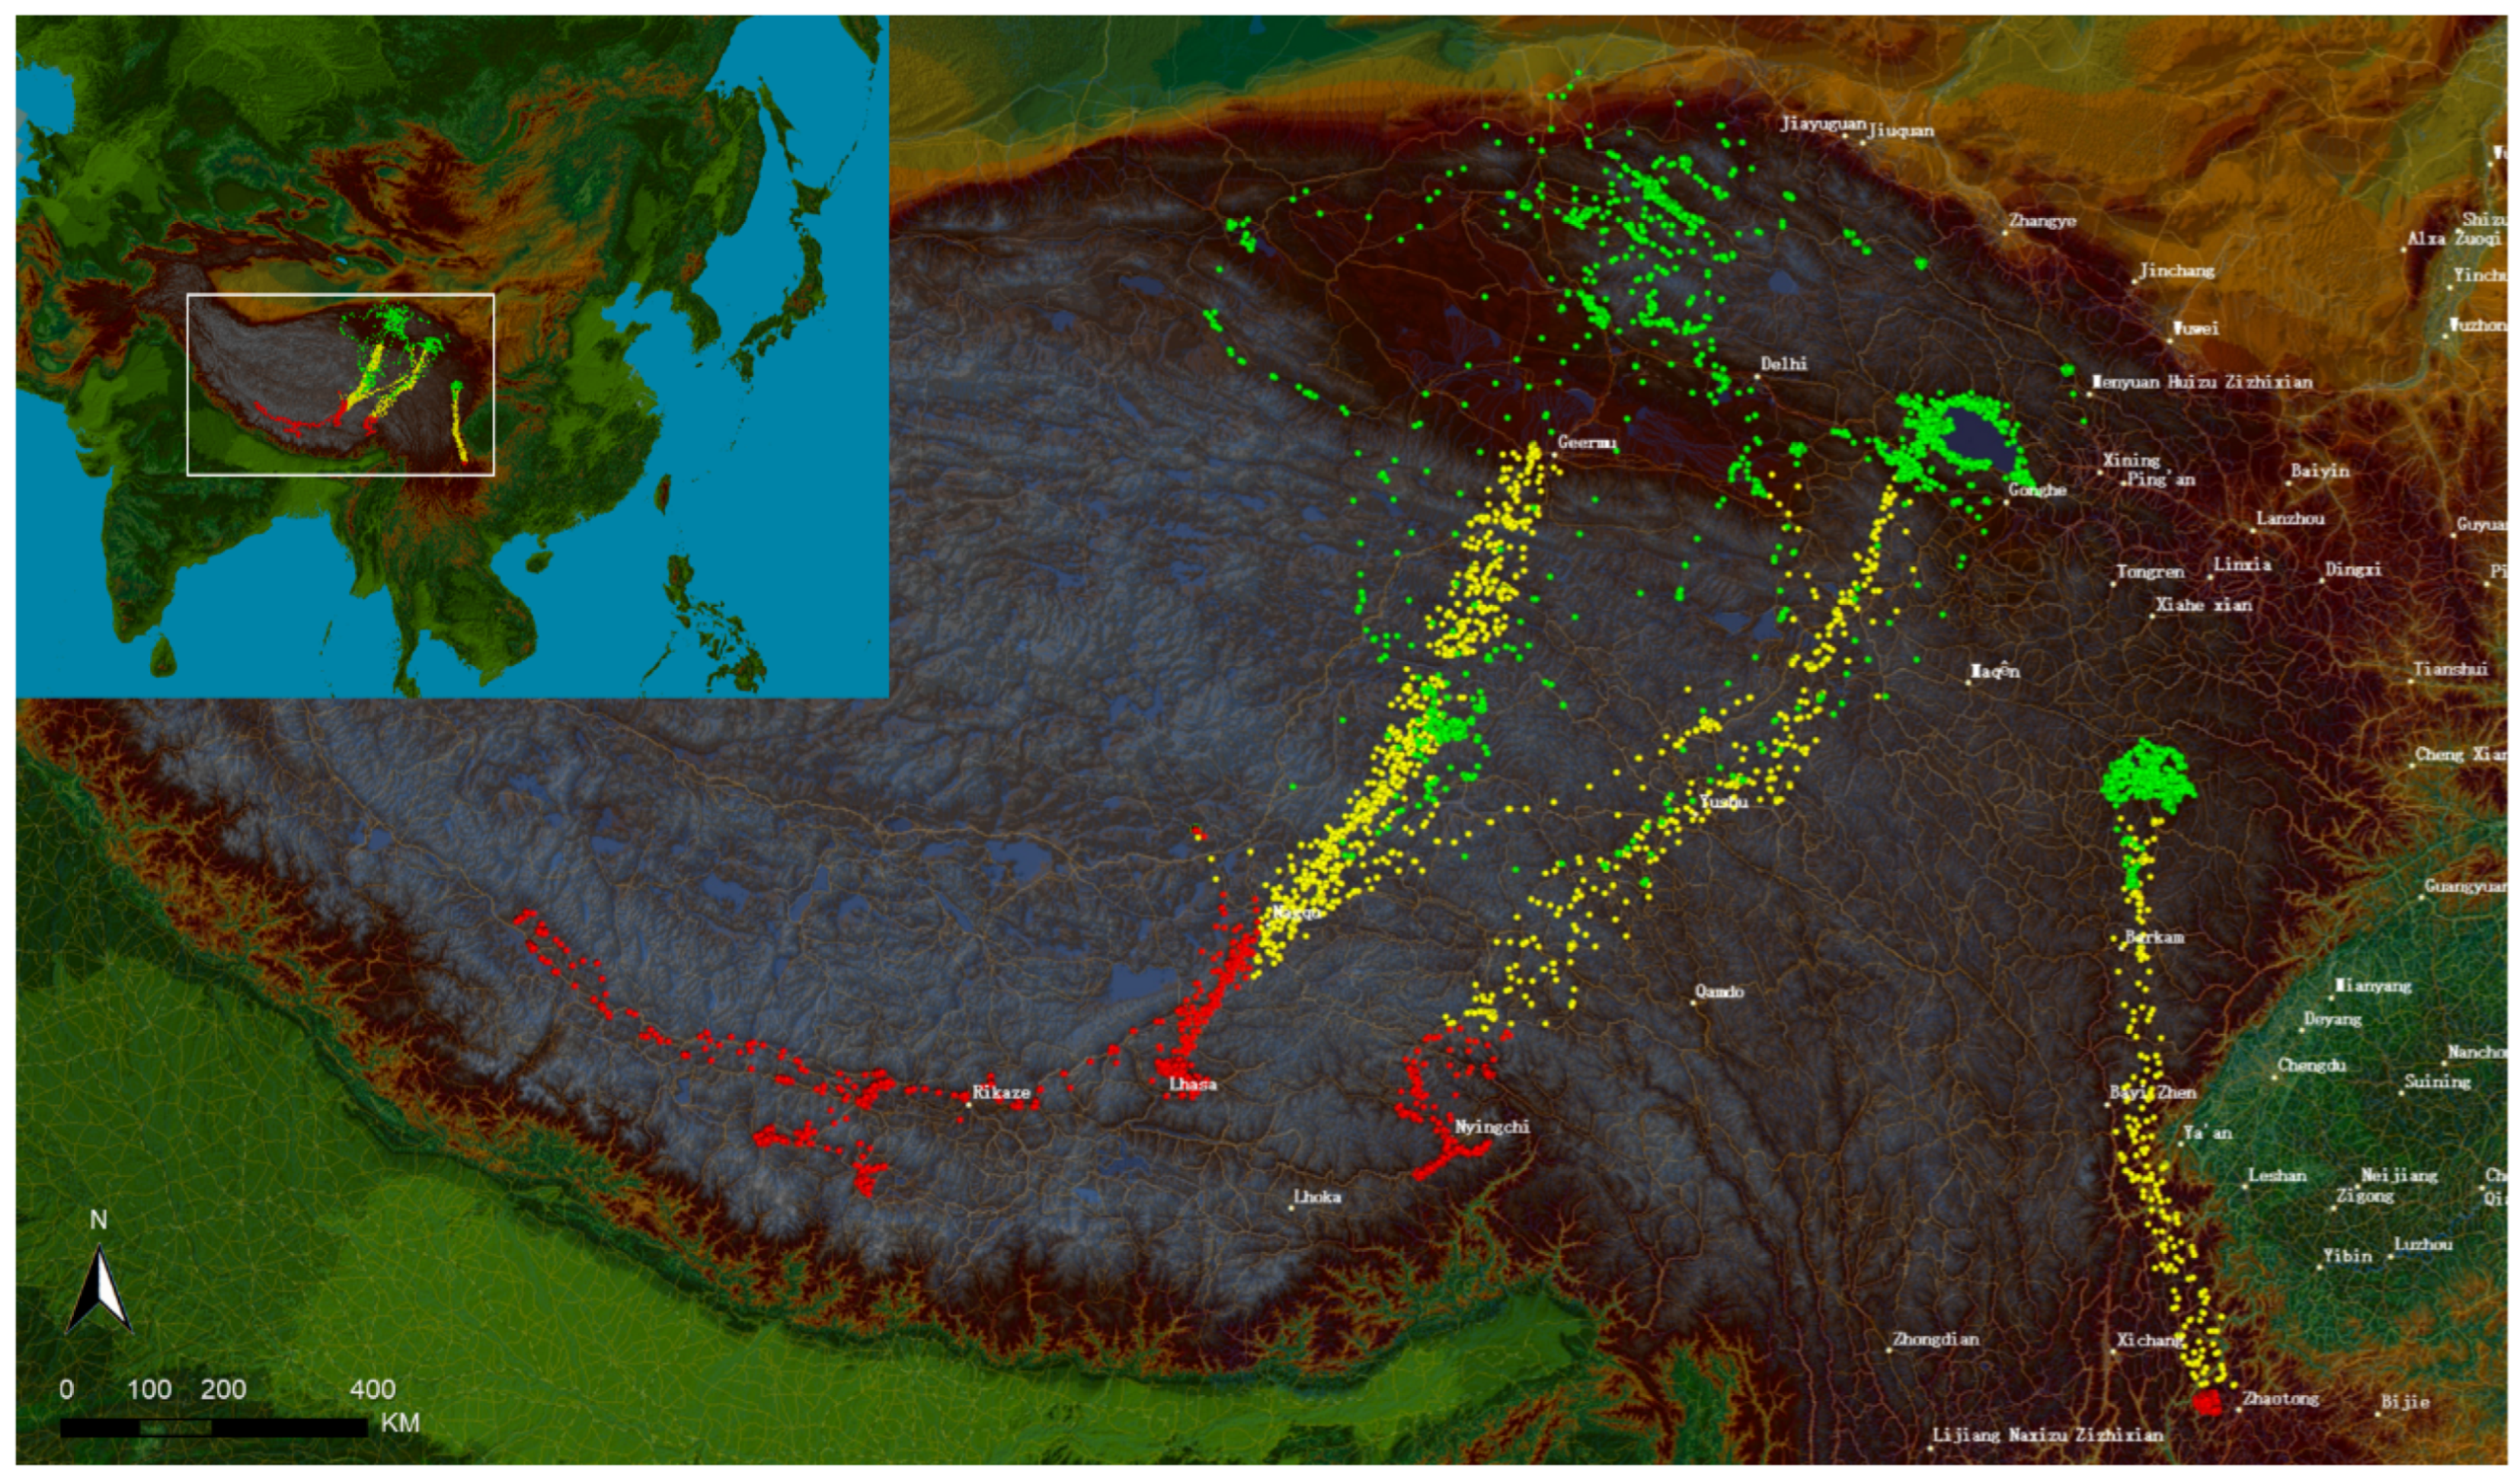
In this study, we have tracked 106 black-necked cranes using satellite telemetry from 2014 to 2020, yielding 483,592 valid location records at hourly intervals [3,14]. These occurrence data, featuring precise latitude/longitude coordinates, provide a robust dataset for calculating the Habitat Suitability Index across breeding, migratory, and wintering seasons (Figure 1). Among all occurrences, we have 174,229 occurrences for the breeding stage, 20,955 for the migration stage, and 192,516 for the wintering stage. After spatial thinning to retain only one point per 1 km2, the final datasets consisted of 55,560, 12,375, and 49,976 occurrences for the breeding, migration, and wintering stages, respectively.
Figure 1.
Satellite tracking locations of black-necked cranes on the Qinghai–Tibet Plateau. Breeding, migration, and wintering sites are indicated by green, yellow, and red points. The background colors show elevation.
The delineation of the three stages is based on three indices: time, flight speed, and location. We primarily defined these stages using the Julian day. The breeding stage spans from Julian day 91 to 273, while the wintering stage extends from day 274 to day 100 of the following year. The spring and autumn migration stages are characterized by locations between the breeding and wintering areas, combined with a movement speed exceeding 100 km/day.
2.2. Habitat Suitability Index (HSI)
The Habitat Suitability Index represents a numerical index that quantifies the capacity of a given habitat to support a selected species, providing a standardized metric for comparing habitat quality across locations and time periods [15]. The HSI framework involves identifying key environmental variables that influence habitat use by the target species, developing suitability index curves for each variable that describe how suitability varies across the range of observed values, and combining these individual indices into a composite HSI using mathematical formulas [16]. The resulting index typically ranges from zero, representing unsuitable habitat where the species cannot maintain populations, to one, representing optimal habitat where all requirements are met [17].
Species distribution models (SDMs) provide a powerful analytical framework for generating Habitat Suitability Index values, bridging the gap between species occurrence data and quantitative habitat assessments [18,19]. SDMs relate species occurrence records, obtained from field surveys, museum specimens, citizen science databases, or satellite tracking, to environmental variables that characterize the conditions at those locations, using statistical or machine learning algorithms to identify the environmental space occupied by the species [20]. The resulting model outputs can be transformed into habitat suitability values by applying suitability functions that scale occurrence probabilities or environmental suitability scores to the 0–1 HSI range [17].
For the black-necked crane, SDM-derived HSI values can incorporate key environmental variables including bioclimate factors (temperature, precipitation), topographic features (elevation), and anthropogenic disturbance metrics [4]. The spatial predictions generated by SDMs thus produce continuous maps of habitat suitability across the landscape, enabling identification of high-quality habitat patches, ecological corridors, and areas where habitat degradation may be occurring.
In this study, we selected random forest [21] to develop species distribution models with 29 environmental variables, which had been compiled into a 29-layer stacked raster file (.grd) with 30 arc-second resolution publicly available for global terrestrial areas [22]. In the dataset, the 19 bioclimate variables were from the WorldClim 2.0 dataset (https://worldclim.com/, accessed on 15 January 2022) [23] for current climate conditions. The elevation data were originally acquired by spaceborne shuttle radar [24], and downloaded from the website of the United State Geological Survey (USGS) [25]. The human footprint index (v2, 1995–2004) is a raster dataset created from nine global data layers covering human population density, human land use, human access (coastlines, roads, railroads, and navigable rivers), and infrastructure (built-up areas, nighttime lights, land use/land cover) [26]. The data for solar radiation, wind speed, and water vapor pressure were downloaded from WorldClim [27]; data for each of the three variables are available for each month, and we selected values in January and July for this study. The land cover dataset was produced by the USGS EROS Data Center; it was one of the first globally consistent, 1 km resolution land cover maps derived from satellite remote sensing [28]. The Global Lakes and Wetlands Database (GLWD) was developed by Bernhard Lehner & Petra Döll, University of Kassel, Germany, and it is a global-scale database of inland surface water bodies combining lakes, reservoirs, and wetlands by integrating multiple existing maps and data sources [29].
For the random forest analysis, 10,000 evenly distributed pseudo-absence points covering the distribution area of the black-necked crane were generated to compare with occurrences at the breeding, migration, and wintering stages, respectively.
The random forest algorithm, implemented via the randomForest package, is notable for requiring minimal parameter tuning [30]. We utilized 500 trees and retained all other parameters at their default values. We did not employ separate cross-validation because random forest inherently utilizes bootstrap sampling; consequently, the out-of-bag (OOB) data serve as an internal validation mechanism. The 10,000 pseudo-absences were evenly selected to represent the gradient of environmental variables. Additionally, we filtered occurrence records by removing points within a 1 km radius to mitigate spatial autocorrelation, although it is worth noting that spatial autocorrelation does not negatively impact the calculation of the habitat suitability index.
2.3. Ecological Requirements of the Black-Necked Crane
The black-necked crane holds a unique position among the world’s fifteen crane species as the only one that completes its entire life cycle on high-altitude plateaus [3]. This distinctive life history creates specific habitat requirements that vary substantially across the annual cycle, encompassing distinct breeding, migration, and wintering phases, each with its own set of environmental requirements [14,31]. Understanding these stage-specific requirements is essential for developing accurate HSI models that can inform conservation planning.
During the breeding season, which extends from April through October, black-necked cranes occupy high-elevation habitats on the Qinghai–Tibetan Plateau, ranging from southeastern Xinjiang through Tibet and Qinghai to southern Gansu and northwestern Sichuan [31,32,33]. Breeding habitat occurs at elevations between 2500 and 5000 m, characterized by vast alpine wetlands, marshy meadows, and shallow lakes that provide both foraging opportunities and safe nesting sites [31,34].
Studies in the Yanchiwan area of Gansu Province have characterized the nesting habitat preferences of black-necked cranes, demonstrating a preference for lower-elevation wetlands on the high plateau with minimal human disturbance [32,35]. Long-term monitoring at the Longbao National Nature Reserve in Qinghai Province has documented how the species adapts nest site selection in response to environmental pressures over four decades, with landscape pattern changes, including wetland fragmentation, agricultural expansion, and infrastructure development, showing negative correlations with human population dynamics [36].
Migration between breeding and wintering areas represents a critical phase in the black-necked crane’s annual cycle. Three primary migration routes, the eastern, central, and western routes, connect breeding populations to wintering areas, each traversing distinct geographic corridors with critical stopover sites where cranes rest and refuel [3]. Satellite tracking studies have documented remarkable fidelity of individual cranes to breeding, stopover and wintering sites year after year [3,37]. The quality and availability of stopover habitats significantly influence migration timing and survival rates, making these sites important targets for HSI assessment even though they are used only transiently [3].
Wintering grounds are distributed across Tibet, southern Sichuan, northern Yunnan, and western Guizhou [2,38]. These areas provide the open water and foraging habitat necessary for survival during the plateau winter, when most breeding areas become snow-covered. The Dashanbao National Nature Reserve in Yunnan Province represents one of the most important wintering habitats, with over a thousand black-necked cranes wintering annually [38], while the Caohai National Nature Reserve in Guizhou hosts approximately 2500 individuals [5]. Winter habitat selection is influenced by the availability of food in wetland soils, the presence of shallow water for roosting at night, and the minimization of human disturbance [2,5].
2.4. Detect Driving Factors for the Stage-Specific HSI Components Based on Linear Models
While complex species distribution models, such as random forest and MaxEnt, provide aggregate importance indices for each variable [20], linear models offer the distinct advantage of explicitly characterizing linear trends, quadratic optima, and interaction effects among continuous variables [39]. We developed logistic regression models to explain the presence and absence of cranes by environmental variables for the breeding, migration, and wintering stages separately.
The development of the logistic regression models followed the best practices outlined by Li and Li [39]. First, we employed a random forest algorithm to select the most influential predictors from a pool of 29 candidates, identifying the top 12 variables for each stage. Second, we assessed multicollinearity using Variance Inflation Factors (VIFs); variables with VIF > 5 were excluded, resulting in a final set of 5–6 variables per stage. Finally, we constructed full models incorporating all two-way interactions and quadratic terms, followed by stepwise model selection.
2.5. Produce EBVs Using Stage-Specific HSI Data
The occurrence data from satellite telemetry span 2015 to 2020. We predicted HSIs for each year individually. In addition, we generated HSIs using occurrence records across all years combined, as these represent the entire black-necked crane population, whereas a single year’s records do not cover all subpopulations. The predicted HSIs are stored as GeoTIFF raster layers. We used the terra package [40] to process raster data and the ebvcube package [41] to combine time-series HSIs across three life-history stages. The jsonlite package [42] was used to handle EBV metadata. The EBV cube has dimensions of 1766 × 2685 × 7 × 3, corresponding to 1766 rows, 2685 columns, 7 time steps (years), and 3 entities (representing breeding, migration, and wintering stages). The R code is provided in the Supplementary File (Create EBVs.R).
3. Results
3.1. HSIs of the Three Stages Using Random Forest
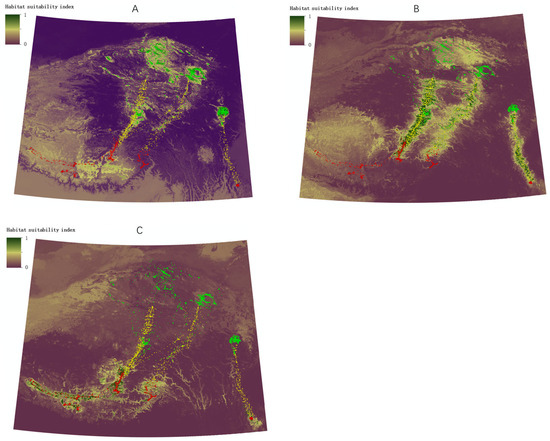
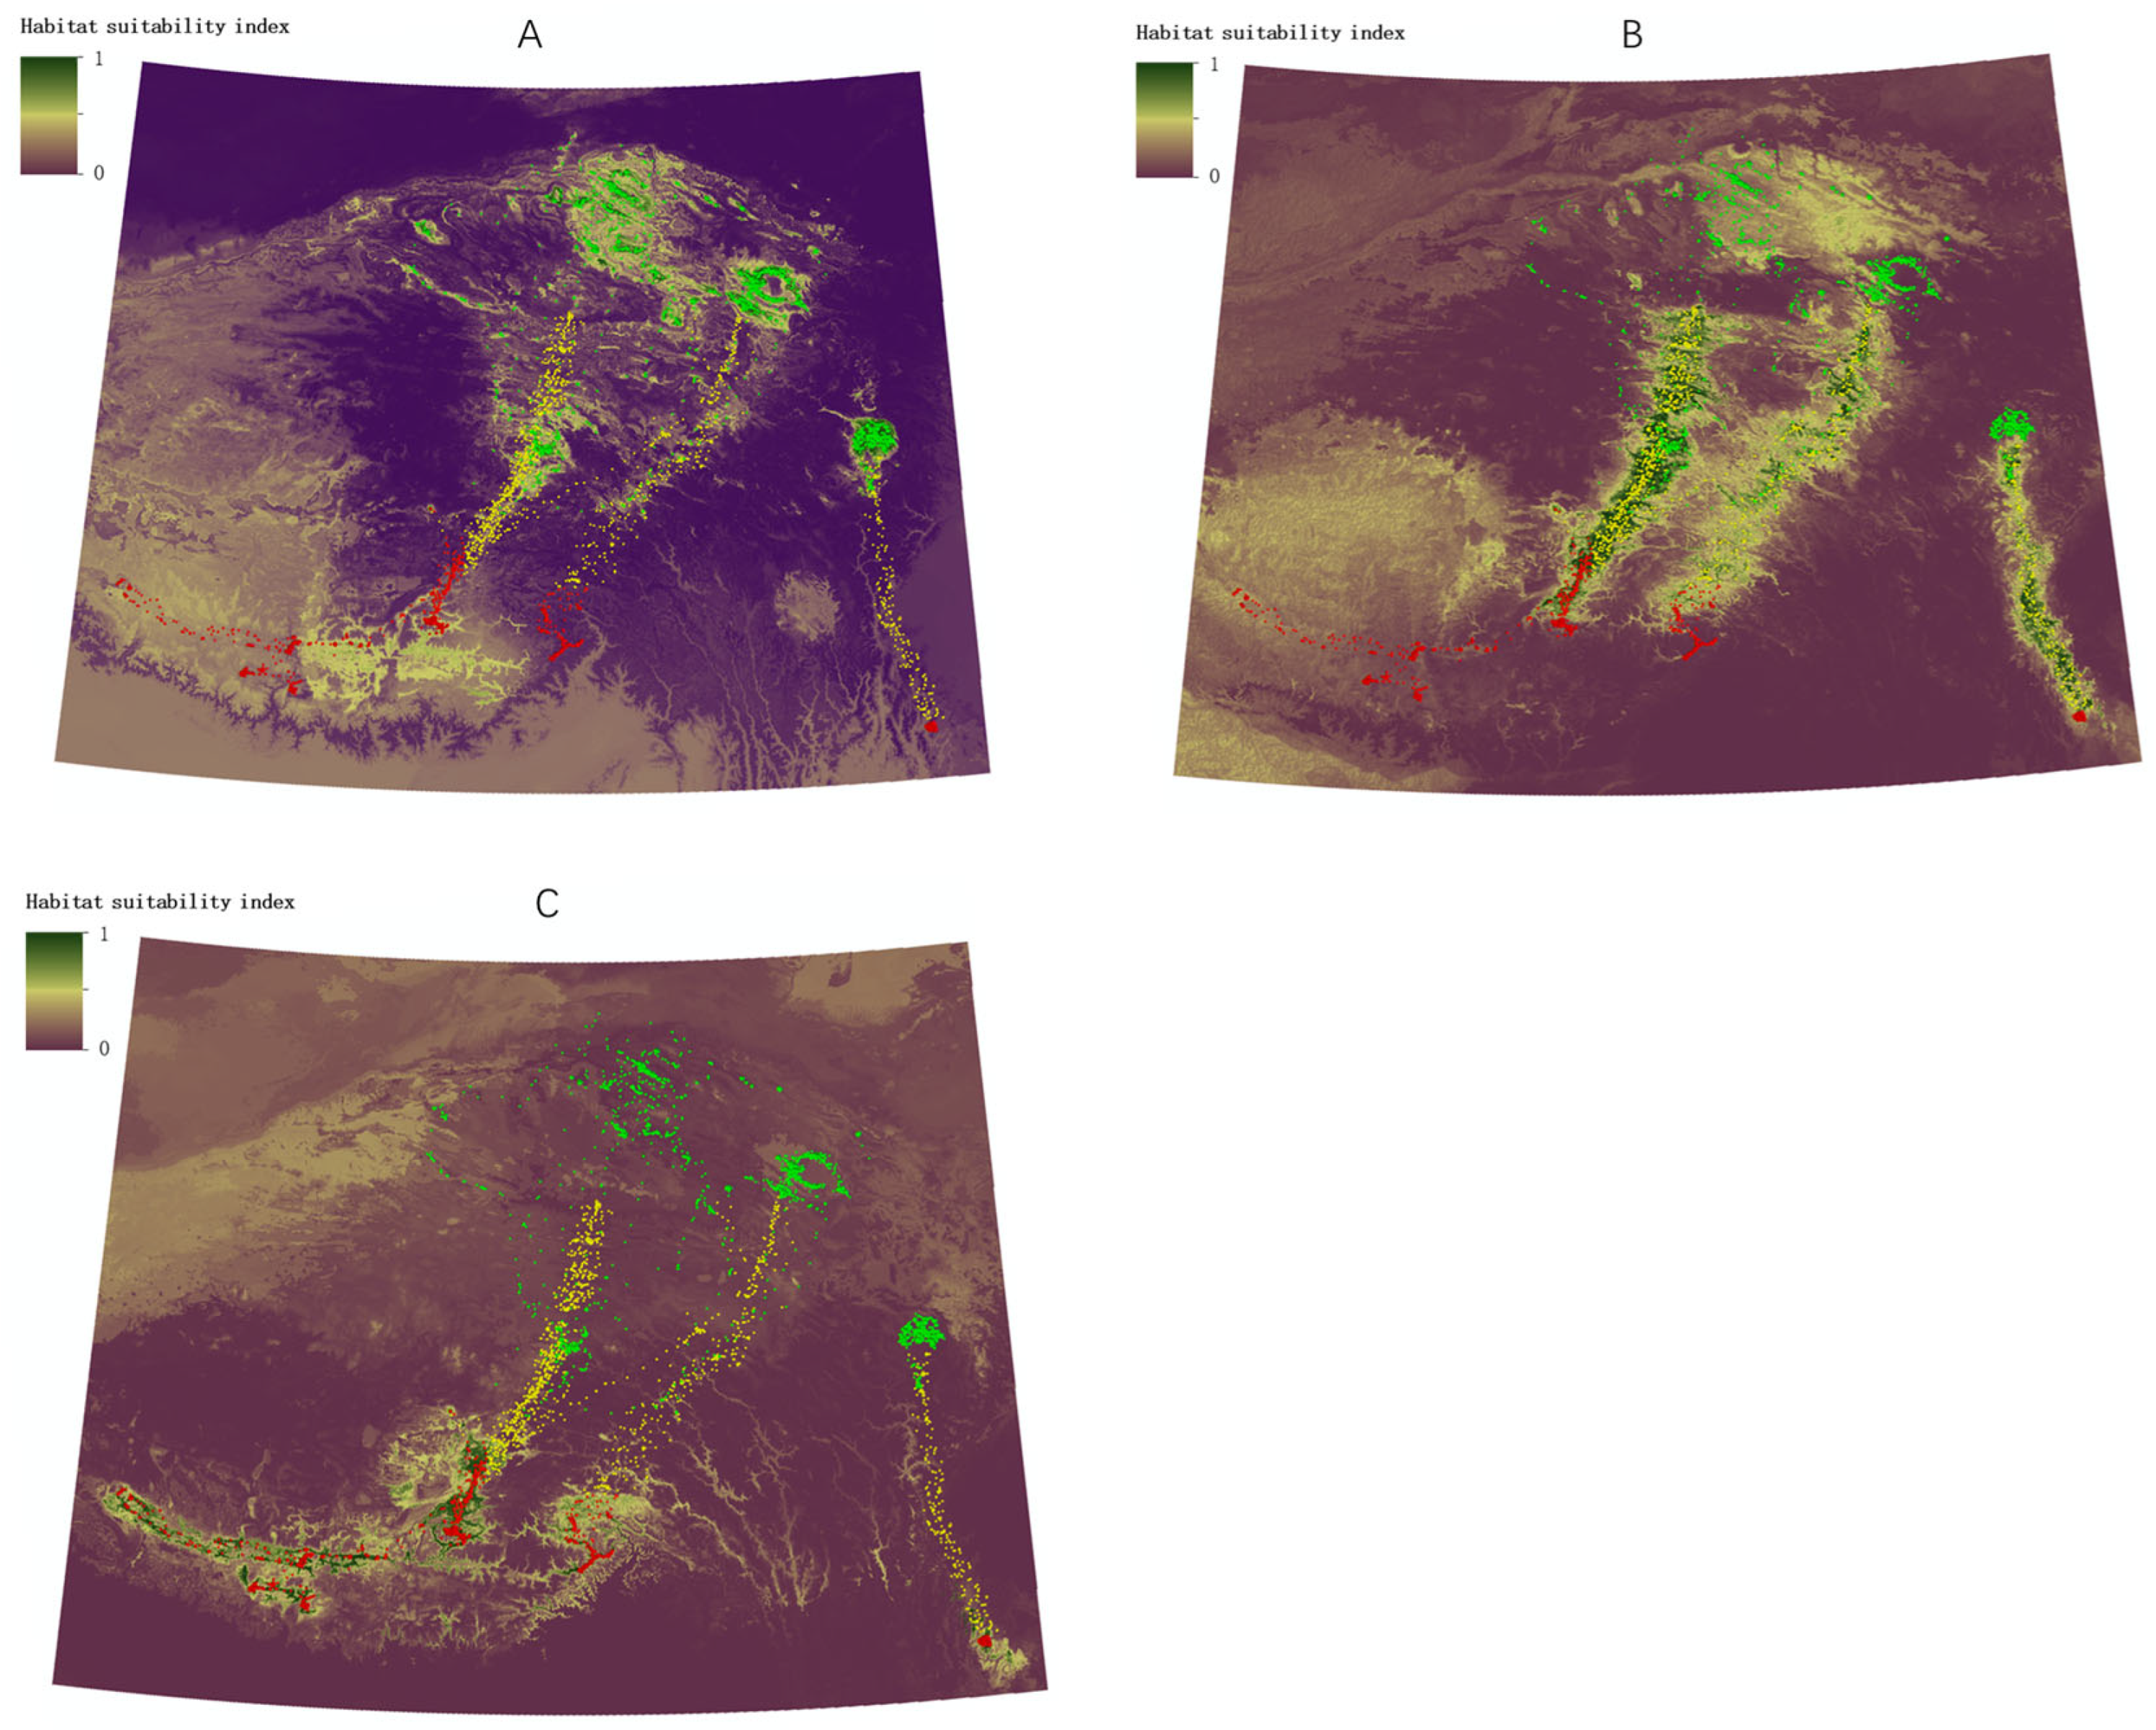
Species distribution models, developed using all occurrence data from 2020 to 2025 and the random forest algorithm, predicted HSIs for the breeding, migration, and wintering stages (Figure 2). The partial effects of the top 12 variables (out of 29) for the breeding, migration, and wintering stages are presented in Figures S1–S3.
Figure 2.
Habitat suitability indices for the black-necked crane in the breeding (A), migration (B), and wintering (C) stages based on species distribution models using satellite tracking data from 2020 to 2025 and the random forest algorithm. The green, yellow, and red points represent breeding, migration, and wintering sites, respectively.
The random forest models predicted black-necked crane presence across three distinct life-history stages, consistently identifying elevation, solar radiation (January/July), water vapor pressure (January/July), and a subset of bioclimatic variables (bio_3, bio_4, bio_5, bio_7, bio_12) as key predictors. However, the specific variables driving each stage varied: the breeding stage was uniquely characterized by landcover type; the migration stage introduced January wind speed (wind1), mean diurnal temperature range (bio_2), and mean temperature (bio_1) as top predictors; and the wintering stage was additionally influenced by precipitation seasonality (bio_15) and precipitation of the coldest quarter (bio_19).
3.2. Key Environmental Factors for HSIs Using Linear Models
Linear models with quadratic and two-way interaction terms reveal differences in the contributions of environmental variables across the three stages. The most significant terms in the final models, indicated by high deviance values, are presented in Table 1. Figure S4 presents the effect sizes and 95% confidence intervals of the model coefficients for the three stages.
Table 1.
Deviance of terms (including two-way interaction and quadratic terms) and model performance indices for logistic regressions explaining presence/absence of black-necked cranes in the three stages.
3.2.1. Breeding Stage
Black-necked cranes select breeding habitat primarily based on elevation (elev2, the quadratic term), which exhibits a strong unimodal relationship with presence, cranes strongly prefer a narrow mid-elevation band, with occupancy declining sharply at both low and high altitudes. Temperature seasonality (bio_42, the quadratic term) and its interaction with elevation are the second- and third-ranked predictors, indicating that the thermal regime of the breeding grounds modulates habitat suitability within the preferred elevation range. Water vapor pressure in July (vapor72, the quadratic term) and its interaction with temperature seasonality further shape breeding site selection, reflecting the cranes’ need for humid, thermally stable conditions during the breeding season. Human footprint enters the model primarily through interactions with elevation and diurnal temperature range, suggesting that human disturbance matters mainly at certain altitudes, likely mid-elevations where human activity most overlaps with optimal crane habitat.
3.2.2. Migration Stage
Habitat selection during migration is driven by precipitation regime rather than topography, with precipitation seasonality (bio_15) as the dominant predictor. Cranes time their stopovers and select staging sites based on the predictability and temporal distribution of rainfall, not just total water availability. The strong interaction between precipitation seasonality and annual precipitation (bio_15:bio_12) indicates that cranes respond to different precipitation patterns depending on the overall moisture environment along the flyway. Solar radiation in July interacts with both precipitation and human footprint to shape migration habitat, suggesting that energy availability and thermal conditions modulate the effects of moisture and human disturbance during long-distance movement. Notably, elevation plays a minimal role during migration, the quadratic elevation term ranks only 9th (Table 1), indicating that cranes are less constrained by altitude when moving between breeding and wintering grounds.
3.2.3. Wintering Stage
Wintering ground selection is governed by a combination of moisture availability and human landscape modification, with annual precipitation (bio_12) as the single strongest predictor, wetter wintering grounds are strongly preferred, reflecting the cranes’ need for adequate water and foraging resources during the cold season. Temperature seasonality (bio_52, the quadratic term) is the second-ranked predictor, indicating that wintering habitat suitability also depends on thermal stability across the year. Human footprint is also a primary driver of wintering site selection (Table 1, ranked 4th overall), suggesting that cranes actively avoid heavily human-modified landscapes when choosing wintering habitat, a pattern absent in the breeding and migration stages. Solar radiation in January and its interactions with temperature and footprint dominate the remaining predictors, indicating that the thermal environment and its interaction with landscape anthropization are critical for winter survival.
3.2.4. Comparisons Among the Three Stages
Habitat preference for black-necked cranes shifts markedly across life stages: breeding grounds are primarily selected based on elevation, with a strong unimodal pattern (mid-elevations preferred, extremes avoided), modulated by temperature seasonality and humidity; migration staging sites are governed by precipitation regime, the timing and predictability of rainfall across the year, and the interaction between moisture and solar energy along the flyway, with altitude playing only a minor role; and wintering grounds are driven by moisture availability (annual precipitation) combined with strong avoidance of human-modified landscapes, which emerges as a dominant factor only during winter. In short, breeding habitat selection is topographic, migration is climatic-hydrological, and wintering is moisture- and human-dominated.
3.3. EBV for Black-Necked Crane HSI Data
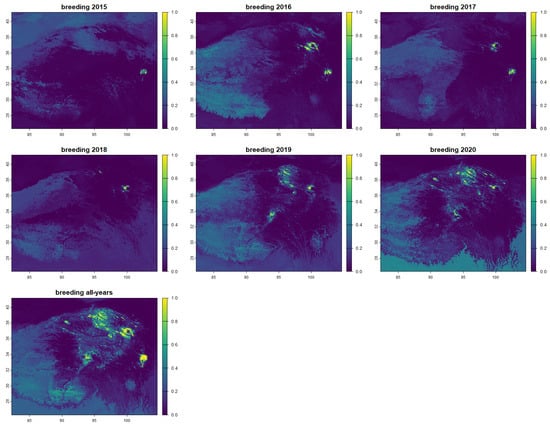
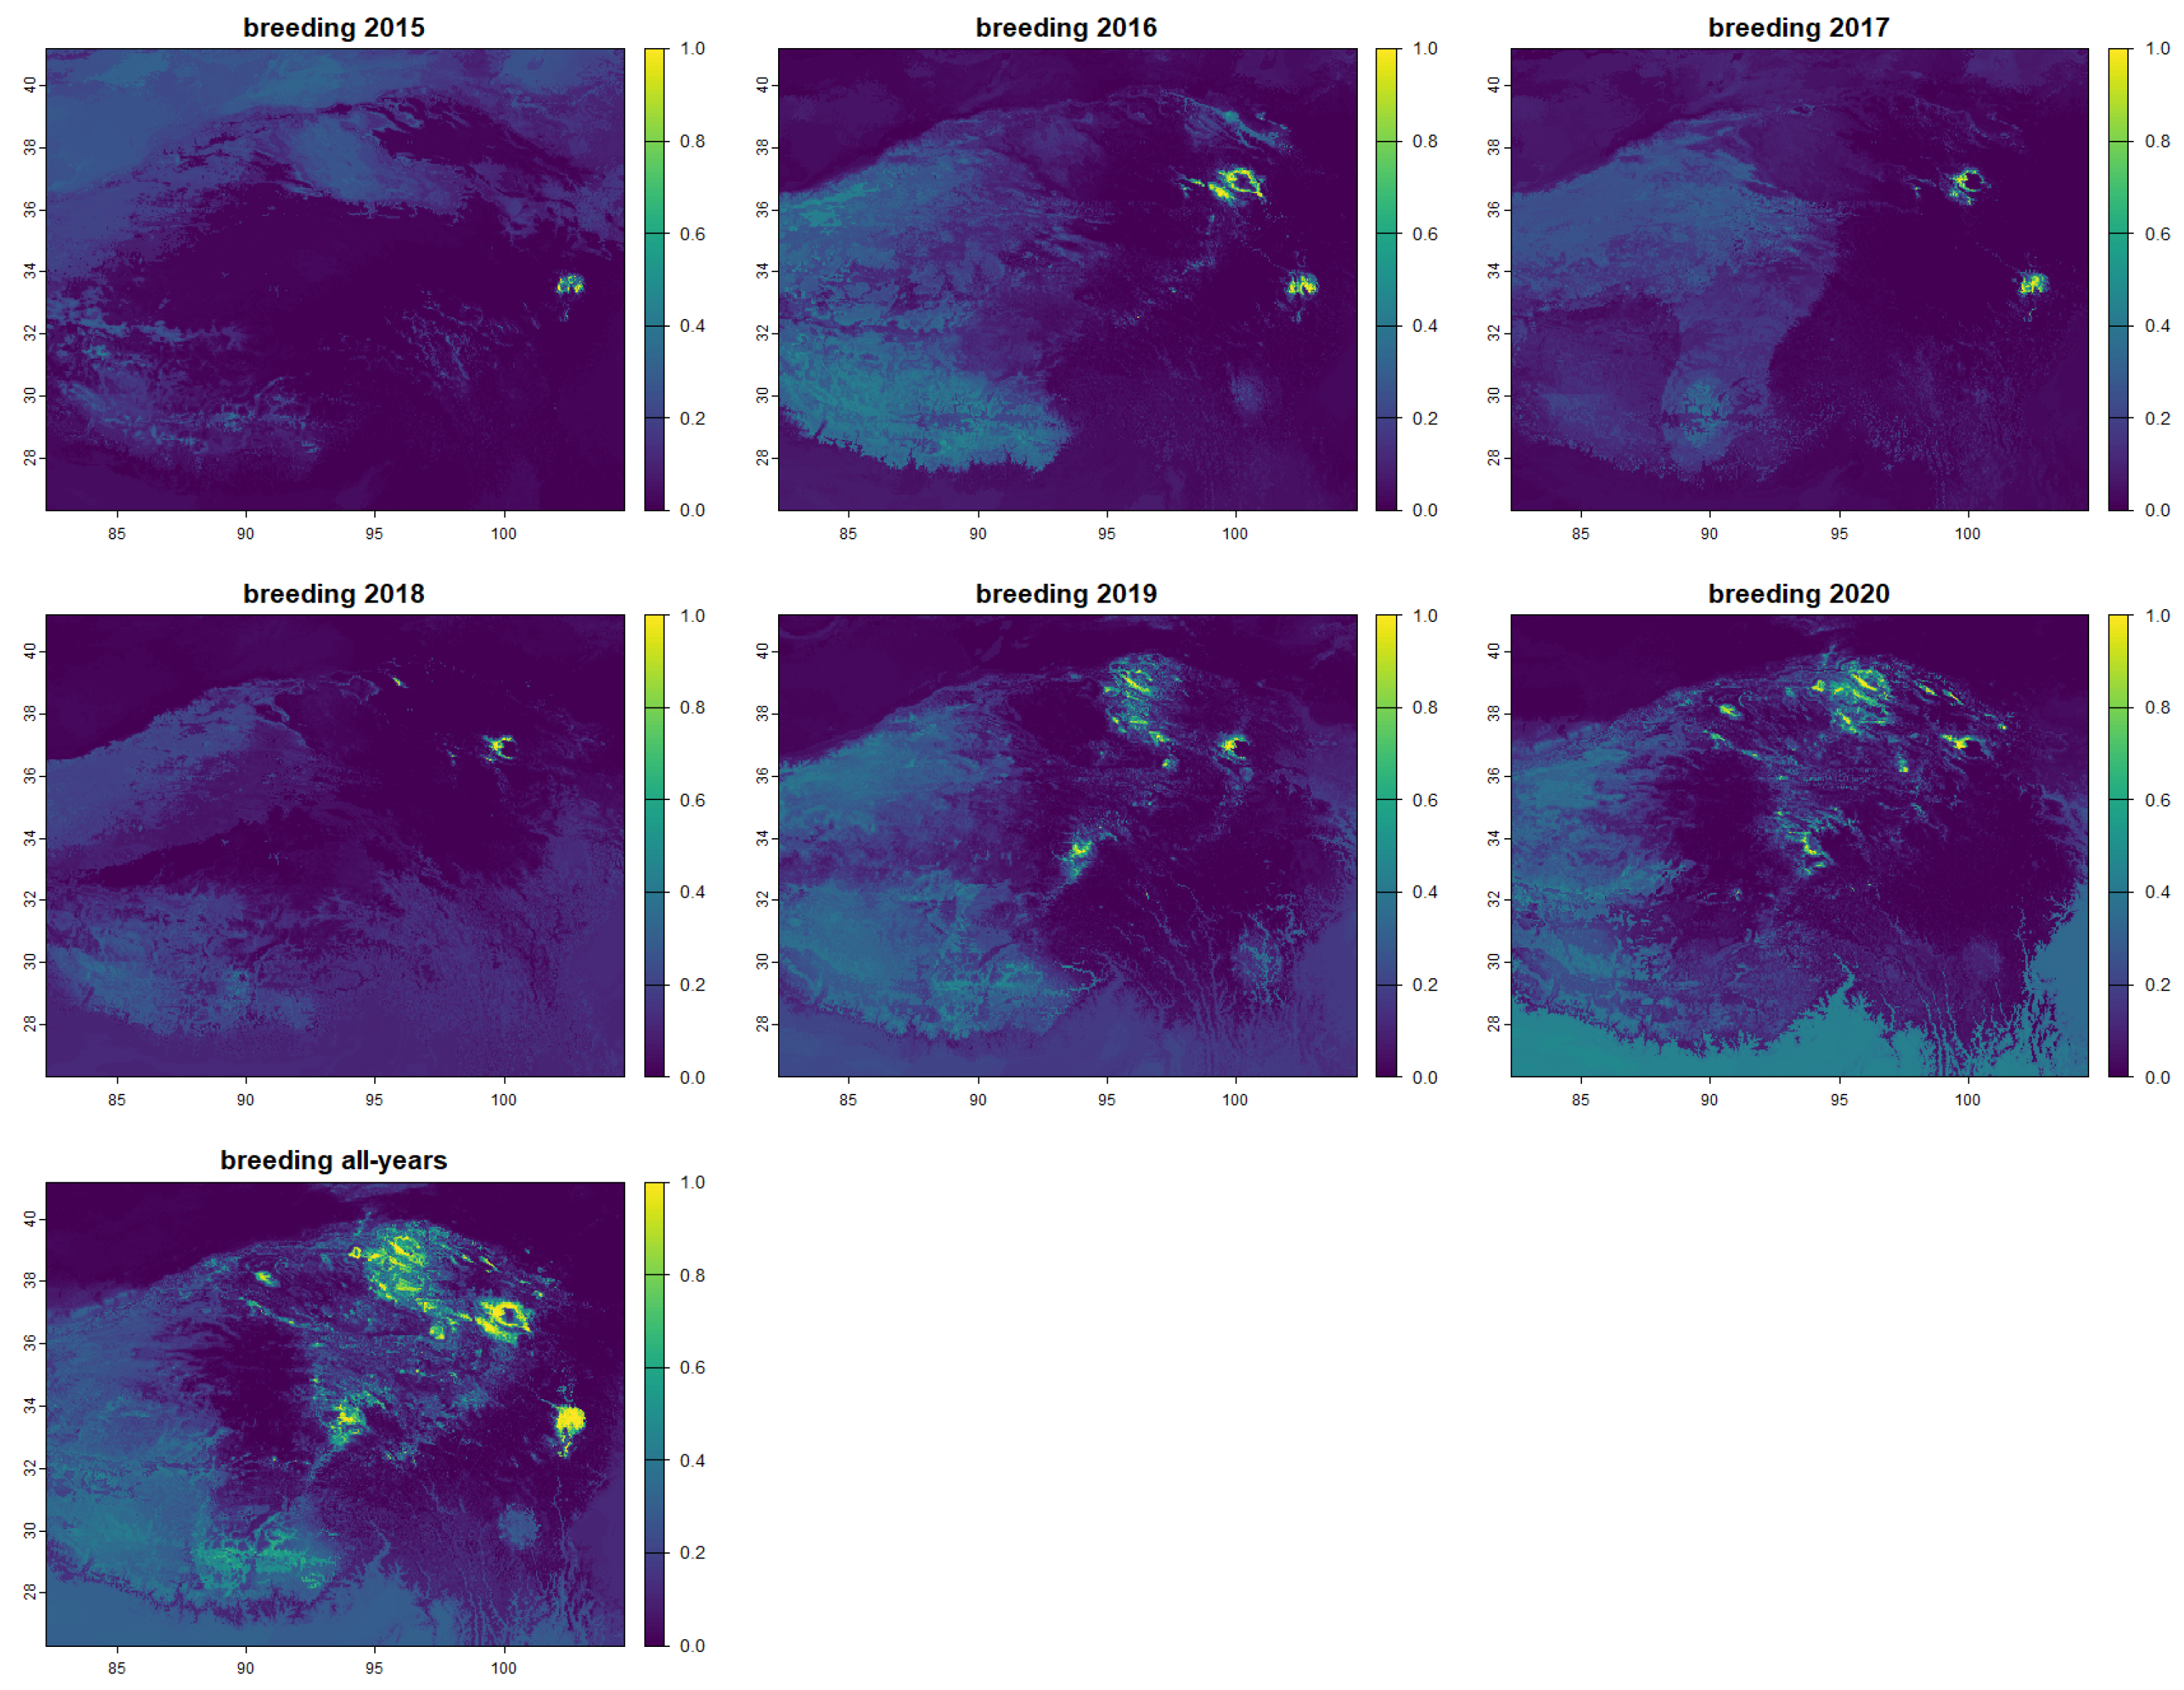
For black-necked crane HSI data, the multi-dimensional structure of EBV data accommodates the spatial coordinates (latitude and longitude), temporal dimensions (2015–2020), the three life stages (breeding, migration, wintering) (Figure 3 and Figures S5 and S6). The time-series data are notably unbalanced, as the number of tracked individuals during the breeding stage increased from three in 2015 to 44 in 2020, mirroring the actual monitoring process.
Figure 3.
Habitat suitability index for the black-necked crane in the breeding stage from 2015 to 2020, and one layer using occurrences in all years. From 2015 to 2018, the number of tracked individuals was fewer than 30, resulting in sparse occurrence data.
The 106 tracked black-necked cranes encompass all major wintering grounds distributed across Tibet, southern Sichuan, northern Yunnan, and western Guizhou, as well as the three primary migration routes (eastern, central, and western). The breeding range spans from southeastern Xinjiang through Tibet and Qinghai to southern Gansu and northwestern Sichuan, and the tracked birds cover most of the major breeding areas. As such, our findings can be considered representative of the global population (the seventh panel in Figure 3 and Figures S5 and S6).
4. Discussion
The EBVs data framework is well-designed yet not well applied. To address this, we utilized a comprehensive dataset on black-necked cranes to demonstrate habitat suitability across different years and life stages. By leveraging the standardized, interoperable data structure of the EBV framework, this study can enhance conservation planning by facilitating the identification of life-stage key factors, forecasting climate-driven habitat shifts, and supporting long-term adaptive management.
4.1. Technical Framework and Standardization of EBVs
4.1.1. Multidimensional Data Structure
The NetCDF implementation of EBV format provides a self-describing, machine-independent, and multidimensional structure that supports the creation, access, and sharing of array-oriented scientific data [43].
EBV hypercube data differs fundamentally from GeoTIFF rasters, GBIF occurrence records, and GenBank sequence data in structure, purpose, and use case. GeoTIFFs encode spatial data as regular gridded raster bands with embedded georeference metadata, optimized for continuous fields like land cover or elevation, whereas EBV hypercubes extend this into higher dimensions (latitude, longitude, depth, time, and multiple ecological variables), enabling spatiotemporal analysis of biodiversity trends [1]. GBIF, by contrast, delivers point-based species occurrence records of discrete observations with coordinates, taxonomy, and dates, which are fundamentally tabular and event-driven, not gridded or continuous [11]. GenBank rounds out the picture with nucleotide and protein sequences stored as linear text records, focused on the genetic blueprint of organisms rather than spatial or ecological measurements.
4.1.2. Comprehensive Metadata for Provenance and Transparency
A critical feature of EBV NetCDF files is the ability to store comprehensive metadata as attributes, enabling users to understand the provenance, methodology, and limitations of HSI data products. For black-necked crane HSI assessments, the metadata include information about the EBV class being represented (i.e., Species Distribution EBV), data source citations and methodology descriptions for both field data and modeling approaches, the spatial reference system and resolution, the temporal coverage and resolution, the units of measurement for both HSI values and component variables, data quality flags and uncertainty estimates, and the complete processing history documenting all transformations applied to derive the final values.
4.1.3. Standardization for Comparability and Rigor
The GEO BON EBV Portal and similar infrastructure platforms provide frameworks for consistent metadata documentation that ensure users can appropriately interpret HSI data for their specific applications [13]. This standardization addresses a historical limitation of HSI assessments, where methodological variation and incomplete documentation have hindered comparability across studies and over time. By requiring standardized metadata, the EBV framework enables more rigorous assessment of how habitat suitability has changed and whether conservation interventions have been effective.
The EBV framework’s emphasis on interoperability provides significant benefits for HSI data users. EBV NetCDF files are designed for compatibility with common analysis environments used in biodiversity research and environmental science, including R (through packages like ebvcube [41], ncdf4 [44], jsonlite [42], terra [40]), Python version 3.11 (through libraries like xarray [45]), MATLAB R2024b, and Geographic Information Systems like QGIS 3.44.x and ArcGIS Desktop (ArcMap 10.x). This broad compatibility facilitates the integration of black-necked crane HSI data into diverse analytical workflows, from local management applications to continental-scale assessments.
Interoperability also enables the integration of black-necked crane HSI data with other EBV products, creating opportunities for cross-taxonomic and cross-system analyses. For example, black-necked crane HSI data can be related to Ecosystem Structure EBVs (reflecting habitat structure from remote sensing), to other species’ distribution EBVs (enabling assessment of community-level patterns), or to environmental driver variables that contextualize habitat suitability changes. This integration supports the holistic approach to biodiversity assessment that the EBV framework is designed to enable.
The BON in a Box platform [13] provides particular opportunities for operationalizing EBV-formatted HSI data. This open and collaborative platform enables biodiversity monitoring, indicator calculation, and reporting to support the Kunming-Montreal Global Biodiversity Framework, with pipelines that can incorporate EBV data products including HSI values. The platform’s modular architecture allows users to combine black-necked crane HSI data with other data streams, while its containerized deployment ensures reproducibility across computing environments.
4.2. Potential Applications of EBV-Formatted HSI Data for Black-Necked Crane Conservation
4.2.1. Detect Key Environmental Factors
Habitat selection in black-necked cranes exhibits distinct, stage-specific drivers. Breeding grounds are primarily governed by topography, characterized by a strong unimodal response to elevation (favoring mid-elevations). In contrast, migration staging sites are dictated by climatic-hydrological factors, specifically precipitation regimes and the interaction between moisture and solar energy, where altitude plays a negligible role. Finally, wintering habitat selection is driven by annual moisture availability and a pronounced avoidance of anthropogenic landscapes, a constraint that becomes dominant only during the winter season [5].
4.2.2. Identifying Priority Conservation Areas
EBV-formatted HSI data for the black-necked crane provides a powerful tool for identifying priority areas for conservation action. By mapping habitat suitability across the species’ range, managers can identify areas of high conservation value that should be prioritized for protection, as well as areas where habitat restoration efforts might yield the greatest benefits. The EBV format enables this analysis to incorporate data from multiple sources and time periods, providing a comprehensive view of habitat availability and quality.
The stage-specific structure of EBV-formatted HSI data enables identification of life-stage bottlenecks, i.e., periods or locations where habitat suitability is particularly limited relative to other stages. For the black-necked crane, such analysis might reveal that breeding habitat is the primary constraint on populations, or conversely, that migration stopover sites represent critical bottlenecks that disproportionately affect population dynamics. This information directs conservation resources toward the interventions that will have the greatest impact.
Integration with maps of existing protected areas enables assessment of whether current protection adequately covers high-suitability habitat [46]. Gaps in protection can then be identified and addressed through expansion of existing reserves, establishment of new protected areas, or development of conservation agreements with private landholders [47]. The EBV format facilitates this analysis by enabling comparison of HSI data with protected area boundaries at multiple spatial and temporal scales.
4.2.3. Climate Change Vulnerability Assessment
EBV-formatted HSI data provides a foundation for assessing the vulnerability of black-necked crane habitat to climate change. By combining current HSI assessments with climate projection scenarios, managers can forecast how habitat suitability might shift as temperatures warm and precipitation patterns change. Such projections are particularly relevant for a species restricted to high-altitude habitats, as many areas within the current range may become unsuitable while new areas at higher elevations might become colonized [48].
The temporal dimension of EBV format enables explicit representation of projected changes, allowing visualization of how habitat suitability might evolve over the coming decades [43]. This temporal perspective supports proactive conservation planning that anticipates future conditions rather than merely reacting to current habitat patterns. For the black-necked crane, climate velocity analysis [49] can identify areas where habitat suitability is likely to decline most rapidly, guiding prioritization of conservation action.
The EBV framework also enables integration with climate impact models that project changes in environmental drivers (temperature, precipitation, wetland hydrology) that underlie HSI assessments. By combining these projections with species-specific relationships, managers can develop more robust assessments of climate change vulnerability that account for both direct effects on habitat suitability and indirect effects through changes in food availability, competition, or predation.
4.2.4. Adaptive Management and Monitoring
The EBV framework supports adaptive management by enabling systematic assessment of habitat changes over time [13]. Repeated HSI calculations, structured within the standardized EBV format, can track whether habitat quality is improving, stable, or declining across the black-necked crane’s range. This temporal monitoring provides early warning of potential problems and enables evaluation of whether management interventions have achieved their intended effects.
The metadata standards of EBV format ensure that temporal comparisons are methodologically valid by documenting any changes in data sources, analytical methods, or environmental conditions that might affect HSI values. This documentation is essential for distinguishing genuine changes in habitat suitability from artifacts of methodological variation, a critical consideration for long-term monitoring programs.
Integration with the broader EBV observation system enables assessment of how black-necked crane habitat changes relate to changes in other biodiversity variables. For example, declining HSI values for the black-necked crane might be associated with changes in Ecosystem Structure EBVs (reflecting wetland degradation) or with changes in other species’ Distribution EBVs (reflecting community-level changes in wetland ecosystems). This integration supports understanding of the drivers of habitat change and the development of appropriately targeted responses.
5. Conclusions
The integration of Habitat Suitability Index methodology with the EBV framework represents a significant opportunity for advancing species-specific conservation within the broader context of global biodiversity monitoring. For the black-necked crane, this integration offers a pathway to more effective conservation that combines the ecological specificity of HSI assessments with the standardization and interoperability benefits of the EBV format. The resulting data products can support local management decisions while contributing to regional and global biodiversity assessments that inform international policy frameworks.
The EBV NetCDF format provides an optimal structure for black-necked crane HSI data because it naturally accommodates the multi-dimensional nature of habitat suitability information, encompassing spatial variation, temporal dynamics, life-stage specificity, and multiple component variables, while ensuring that metadata documentation enables appropriate interpretation and use. This format enables integration with the broader EBV observation system, connecting black-necked crane conservation to the global framework for biodiversity monitoring that GEO BON has developed over the past two decades.
The practical implementation of EBV-formatted HSI data for the black-necked crane requires continued investment in both field research to refine understanding of stage-specific habitat requirements and technical development to establish standardized processing pipelines within the EBV framework. The BON in a Box platform provides an existing infrastructure for developing these pipelines, while the GEO BON EBV Portal offers a distribution channel that can reach both conservation practitioners and policy makers who need access to standardized habitat suitability information [13].
As climate change and human development continue to alter the plateau wetlands upon which the black-necked crane depends, the need for effective monitoring and conservation frameworks becomes increasingly urgent [50,51]. The integration of HSI methodology with the EBV framework offers a path forward, standardized, interoperable, and species-specific, that can support the evidence-based conservation decisions needed to ensure the persistence of this remarkable species into the future.
Supplementary Materials
The following supporting information can be downloaded at: https://www.mdpi.com/article/10.3390/d18080486/s1, Figure S1. Partial dependence plots for the top 12 variables (out of 29) derived from the random forest model illustrate the effects of each variable on the presence of black-necked cranes during the breeding stage. The full name of the variables are: bio_3 = Isothermality; bio_4 = Temperature Seasonality; bio_5 = Max Temperature of Warmest Month; bio_7 = Temperature Annual Range; bio_9 = Mean Temperature of Driest Quater; bio_12 = Annual Precipitation; bio_15 = Precipitation Seasonality; elev = Elevation; footprint = Human footprint index; solar1/solar7 = Solar radiation (January/July); vapor7 = Water vapor pressure (July); landcover = Land cover type. Figure S2. Partial dependence plots for the top 12 variables (out of 29) derived from the random forest model illustrate the effects of each variable on the presence of black-necked cranes during the migration stage. The full name of the variables are: bio_2 = Mean Diurnal Range; bio_3 = Isothermality; bio_4 = Temperature Seasonality; bio_5 = Max Temperature of Warmest Month; bio_7 = Temperature Annual Range; bio_12 = Annual Precipitation; bio_15 = Precipitation Seasonality; elev = Elevation; footprint = Human footprint index; solar1/solar7 = Solar radiation (January/July); vapor7 = Water vapor pressure (July); wind1 = Wind Speed (January). Figure S3. Partial dependence plots for the top 12 variables (out of 29) derived from the random forest model illustrate the effects of each variable on the presence of black-necked cranes during the wintering stage. The full name of the variables are: bio_3 = Isothermality; bio_4 = Temperature Seasonality; bio_5 = Max Temperature of Warmest Month; bio_7 = Temperature Annual Range; bio_12 = Annual Precipitation; bio_15 = Precipitation Seasonality; bio_19 = Precipitation of Coldest Quarter; elev = Elevation; footprint = Human footprint index; solar1/solar7 = Solar radiation (January/July); vapor1 = Water vapor pressure (January). Figure S4. The effect sizes and 95% confidence intervals of the model coefficients of best linear models for the three stages: A. breeding; B. migration; C. wintering. Figure S5. Habitat suitability index for the black-necked crane in the migration stage from 2015 to 2020, and one layer using occurrences in all years. From 2015 to 2018, the number of tracked individuals was fewer than 30, resulting in sparse occurrence data. Figure S6. Habitat suitability index for the black-necked crane in the wintering stage from 2015 to 2020, and one layer using occurrences in all years. From 2015 to 2018, the number of tracked individuals was fewer than 30, resulting in sparse occurrence data.
Author Contributions
Conceptualization, X.L. and Y.S.; methodology, X.L. and Y.Z.; software, X.L.; validation, X.L. and Y.G.; formal analysis, X.L. and Y.S.; investigation, Y.G.; resources, Y.G.; data curation, X.L.; writing—original draft preparation, X.L.; writing—review and editing, X.L., Y.Z., Y.W., J.J., W.X. and Y.F.; visualization, X.L.; supervision, Y.S.; project administration, X.L. and Y.S.; funding acquisition, X.L. and Y.S. All authors have read and agreed to the published version of the manuscript.
Funding
This work was supported by Intergovernmental International Science and Technology Innovation Cooperation Program under National Key Research and Development Plan (2024YFE0198600), and the Natural Resources Survey and Monitoring Project of the Jiuquan Branch, Gansu Provincial Administration of Giant Panda and Qilian Mountain National Park (GSRC-2024-051).
Institutional Review Board Statement
Not applicable.
Data Availability Statement
The data of habitat suitability index are provided as Supplementary Files, which will be publicly available at the GEO BON website.
Acknowledgments
We thank the China National Forestry and Grass Administration, Forestry and Grassland Bureau of Qinghai Province and Gansu Province for their help during the field work.
Conflicts of Interest
The authors declare no conflicts of interest.
References
- Pereira, H.M.; Ferrier, S.; Walters, M.; Geller, G.N.; Jongman, R.H.; Scholes, R.J.; Bruford, M.W.; Brummitt, N.; Butchart, S.H.; Cardoso, A.; et al. Essential biodiversity variables. Science 2013, 339, 277–278. [Google Scholar] [CrossRef] [Scilit] [PubMed]
- Chen, J.; Pu, Z.; Huang, Z.; Yu, F.; Zhang, J.; Xu, D.; Xu, J.; Shang, C.; Dilimulati, P.; Li, Y.; et al. Global number and distribution of overwintering black-necked crane (Grus nigricollis). Biodivers. Sci. 2023, 31, 22400. [Google Scholar] [CrossRef] [Scilit]
- An, J.; Guo, Y. Characteristics of important migratory stopover sites of black-necked cranes on the Tibetan plateau. Glob. Ecol. Conserv. 2025, 64, e03950. [Google Scholar] [CrossRef] [Scilit]
- Bai, J.; Hou, P.; Jin, D.; Zhai, J.; Ma, Y.; Zhao, J. Habitat suitability assessment of black-necked crane (Grus nigricollis) in the zoige grassland wetland ecological function zone on the eastern tibetan plateau. Diversity 2022, 14, 579. [Google Scholar] [CrossRef] [Scilit]
- Wu, D.; Hu, C.; Zhang, M.; Li, Z.; Su, H. Foraging habitat selection of overwintering Black-necked Cranes in the farming area surrounding the Caohai Wetland, Guizhou Province, China. Avian Res. 2020, 11, 5. [Google Scholar] [CrossRef] [Scilit]
- Scholes, R.J.; Mace, G.M.; Turner, W.; Geller, G.N.; Jürgens, N.; Larigauderie, A.; Muchoney, D.; Walther, B.A.; Mooney, H. Toward a global biodiversity observing system. Science 2008, 321, 1044–1045. [Google Scholar] [CrossRef] [Scilit] [PubMed]
- Scholes, R.J.; Walters, M.; Turak, E.; Saarenmaa, H.; Heip, C.H.; Tuama, É.Ó.; Faith, D.P.; Mooney, H.A.; Ferrier, S.; Jongman, R.H.; et al. Building a global observing system for biodiversity. Curr. Opin. Environ. Sustain. 2012, 4, 139–146. [Google Scholar] [CrossRef] [Scilit]
- Proença, V.; Martin, L.J.; Pereira, H.M.; Fernandez, M.; McRae, L.; Belnap, J.; Böhm, M.; Brummitt, N.; García-Moreno, J.; Gregory, R.D.; et al. Global biodiversity monitoring: From data sources to Essential Biodiversity Variables. Biol. Conserv. 2017, 213, 256–263. [Google Scholar] [CrossRef] [Scilit]
- Lumbierres, M.; Milanović, M.; Beja, P.; Bonn, A.; Breeze, T.D.; Brotons, L.; Fernández, N.; Junker, J.; Liquete, C.; Solheim, A.L.; et al. Towards implementing workflows for essential biodiversity variables at a European scale. Glob. Ecol. Conserv. 2025, 62, e03699. [Google Scholar] [CrossRef] [Scilit]
- Haase, P.; Tonkin, J.D.; Stoll, S.; Burkhard, B.; Frenzel, M.; Geijzendorffer, I.R.; Häuser, C.; Klotz, S.; Kühn, I.; McDowell, W.H.; et al. The next generation of site-based long-term ecological monitoring: Linking essential biodiversity variables and ecosystem integrity. Sci. Total Environ. 2018, 613, 1376–1384. [Google Scholar] [CrossRef] [Scilit]
- Telenius, A. Biodiversity information goes public: GBIF at your service. Nord. J. Bot. 2011, 29, 378–381. [Google Scholar] [CrossRef] [Scilit]
- Jetz, W.; McPherson, J.M.; Guralnick, R.P. Integrating biodiversity distribution knowledge: Toward a global map of life. Trends Ecol. Evol. 2012, 27, 151–159. [Google Scholar] [CrossRef] [Scilit] [PubMed]
- Griffith, J.; Lord, J.-M.; Catchen, M.D.; Arce-Plata, M.I.; Blanchet, F.G.; Chandramohan, M.; Diaz-Corzo, M.C.; Gravel, D.; Gutiérrez, C.; Helfenstein, I.S.; et al. BON in a Box: An Open and Collaborative Platform for Biodiversity Monitoring, Indicator Calculation, and Reporting. Bioscience 2026, 76, 345–358. [Google Scholar] [CrossRef] [Scilit] [PubMed]
- Wang, Y.; Mi, C.; Guo, Y. Satellite tracking reveals a new migration route of black-necked cranes (Grus nigricollis) in Qinghai-Tibet Plateau. PeerJ 2020, 8, e9715. [Google Scholar] [CrossRef] [Scilit]
- Jorgensen, E.E. Habitat suitability is a valuable concept. Wildl. Soc. Bull. 1997, 25, 602–603. [Google Scholar]
- Hirzel, A.H.; Le Lay, G.; Helfer, V.; Randin, C.; Guisan, A. Evaluating the ability of habitat suitability models to predict species presences. Ecol. Model. 2006, 199, 142–152. [Google Scholar] [CrossRef] [Scilit]
- Thuiller, W.; Muenkemueller, T. Habitat suitability modelling. In Effects of Climate Change on Birds; Moller, A.P., Fiedler, W., Berthold, P., Eds.; Oxford University Press: New York, NY, USA, 2010; pp. 77–85. [Google Scholar]
- Guisan, A.; Thuiller, W. Predicting species distribution: Offering more than simple habitat models. Ecol. Lett. 2005, 8, 993–1009. [Google Scholar] [CrossRef] [Scilit] [PubMed]
- Guisan, A.; Zimmermann, N.E. Predictive habitat distribution models in ecology. Ecol. Model. 2000, 135, 147–186. [Google Scholar] [CrossRef] [Scilit]
- Li, X.H.; Wang, Y. Applying various algorithms for species distribution modeling. Integr. Zool. 2013, 8, 124–135. [Google Scholar] [CrossRef] [Scilit] [PubMed]
- Breiman, L. Random forests. Mach. Learn. 2001, 45, 5–32. [Google Scholar] [CrossRef] [Scilit]
- Li, X.; Li, N.; Li, B.; Sun, Y.; Gao, E. abundanceR: A novel method for estimating wildlife abundance based on distance sampling and species distribution models. Land 2022, 11, 660. [Google Scholar] [CrossRef] [Scilit]
- Fick, S.E.; Hijmans, R.J. WorldClim 2: New 1km spatial resolution climate surfaces for global land areas. Int. J. Climatol. 2017, 37, 4302–4315. [Google Scholar] [CrossRef] [Scilit]
- Rabus, B.; Eineder, M.; Roth, A.; Bamler, R. The shuttle radar topography mission—A new class of digital elevation models acquired by spaceborne radar. Isprs J. Photogramm. Remote Sens. 2003, 57, 241–262. [Google Scholar] [CrossRef] [Scilit]
- U.S. Geological Survey. Global 30 Arc-Second Elevation Data Set GTOPO30; U.S. Geological Survey: Sioux Falls, SD, USA, 2017. [Google Scholar] [CrossRef] [Scilit]
- Wildlife Conservation Society-WCS; Center for International Earth Science Information Network-CIESIN-Columbia University. Last of the Wild Project, Version 2, 2005 (LWP-2): Global Human Footprint Dataset (Geographic); NASA Socioeconomic Data and Applications Center (SEDAC): Palisades, NY, USA, 2005.
- Hijmans, R.J.; Cameron, S.E.; Parra, J.L.; Jones, P.G.; Jarvis, A. Very high resolution interpolated climate surfaces for global land areas. Int. J. Climatol. 2005, 25, 1965–1978. [Google Scholar] [CrossRef] [Scilit]
- Loveland, T.R.; Reed, B.C.; Brown, J.F.; Ohlen, D.O.; Zhu, J.; Yang, L.; Merchant, J.W. Development of a global land cover characteristics database and IGBP DISCover from 1-km AVHRR data. Int. J. Remote Sens. 2000, 21, 1303–1330. [Google Scholar] [CrossRef] [Scilit]
- Lehner, B.; Doell, P. Development and validation of a global database of lakes, reservoirs and wetlands. J. Hydrol. 2004, 296, 1–22. [Google Scholar] [CrossRef] [Scilit]
- Li, X. Random forest is a specific algorithm, not omnipotent for all datasets. Chin. J. Appl. Entomol. 2019, 56, 170–179. [Google Scholar] [CrossRef]
- Liu, Q.; Li, F.S.; Buzzard, P.; Qian, F.W.; Zhang, F.; Zhao, J.L.; Yang, J.X.; Yang, X.J. Migration routes and new breeding areas of black-necked cranes. Wilson J. Ornithol. 2012, 124, 704–712. [Google Scholar] [CrossRef] [Scilit]
- Wang, B.C.; Pei, W.; Yang, J.C.; Se, Y.J.; Li, X.Z.; Yang, H.R. Nesting habitat preference of the black-necked crane and influence of anthropogenic disturbance in Yanchiwan, Gansu. Biodivers. Sci. 2022, 30, 21241. [Google Scholar] [CrossRef] [Scilit]
- Han, X.; Guo, Y.; Mi, C.; Huettmann, F.; Wen, L. Machine Learning Model Analysis of Breeding Habitats for the Black-necked Crane in Central Asian Uplands under Anthropogenic Pressures. Sci. Rep. 2017, 7, 6114. [Google Scholar] [CrossRef] [Scilit] [PubMed]
- Pan, Z.; Li, X.; Guo, Y. Image-based individual identification of wild Black-necked Cranes (Grus nigricollis) using deep learning. Avian Res. 2026, 17, 100414. [Google Scholar] [CrossRef] [Scilit]
- Zhang, L.X.; Shu, M.L.; An, B.; Suo, Y.L.; Se, Y.J.; Yang, X.J. Number and distribution of the black-necked cranes (Grus nigricollis) in Yanchiwan National Nature Reserve, Gansu, China. Zool. Res. 2014, 35, 117. [Google Scholar] [CrossRef]
- Wei, Q.; Shao, Y.; Xie, C.; Cui, B.; Tian, B.; Brisco, B.; Li, K.; Tang, W. Number and nest-site selection of breeding black-necked cranes over the past 40 years in the Longbao Wetland Nature Reserve, Qinghai, China. Big Earth Data 2021, 5, 217–236. [Google Scholar] [CrossRef] [Scilit]
- Wang, Z.J.; Guo, Y.M.; Dou, Z.G.; Se, Y.J.; Yang, J.C.; Na, S.; Yu, F.Q. Autumn migration route and stopover sites of black-necked crane (Grus nigricollis) breeding in Yanchiwan Nature Reserve, China. Waterbirds 2020, 43, 94–106. [Google Scholar] [CrossRef] [Scilit]
- Gao, L.B.; Qian, F.W.; Yang, X.J.; Wu, H.Q.; Li, F.S. Satellite tracking on the migratory routes of wintering black-necked cranes at Dashanbao in Yunnan. Zool. Res. 2007, 28, 353–361. [Google Scholar]
- Li, B.D.; Li, X.H. Best practices for developing linear models with multiple explanatory variables. Adv. Genet. 2026, 7, e00024. [Google Scholar] [CrossRef] [Scilit] [PubMed]
- Hijmans, R.J.; Barbosa, M.; Brown, A. terra: Spatial Data Analysis, version 1.9-34; R Foundation for Statistical Computing: Vienna, Austria, 2026.
- Quoß, L.; Fernández, N.; Langer, C.; Valdez, J.; Fernández, M.A.; Pereira, H.M. Building Essential Biodiversity Variable netCDFs with the ebvcube R Package. In Biodiversity Information Science and Standards; Pensoft Publishers: Sofia, Bulgaria, 2022. [Google Scholar] [CrossRef] [Scilit]
- Ooms, J. The jsonlite package: A practical and consistent mapping between json data and R objects. arXiv 2014, arXiv:1403.2805. [Google Scholar]
- Jetz, W.; McGeoch, M.A.; Guralnick, R.; Ferrier, S.; Beck, J.; Costello, M.J.; Fernandez, M.; Geller, G.N.; Keil, P.; Merow, C.; et al. Essential biodiversity variables for mapping and monitoring species populations. Nat. Ecol. Evol. 2019, 3, 539–551. [Google Scholar] [CrossRef] [Scilit] [PubMed]
- Pierce, D. ncdf4: Interface to Unidata netCDF (Version 4 or Earlier) Format Data Files, version 1.24; R Foundation for Statistical Computing: Vienna, Austria, 2025.
- Hoyer, S.; Hamman, J. xarray: ND labeled arrays and datasets in Python. J. Open Res. Softw. 2017, 5, 10. [Google Scholar] [CrossRef] [Scilit]
- Zalinge, R.N.v.; Barzen, J.; Garnett, S.T. Tracking sarus crane movements in Cambodia and Vietnam reveals seasonal vulnerabilities and gaps in protected area coverage. Endanger. Species Res. 2023, 50, 151–165. [Google Scholar] [CrossRef] [Scilit]
- Sowa, S.P.; Annis, G.; Morey, M.E.; Diamond, D.D. A gap analysis and comprehensive conservation strategy for riverine ecosystems of Missouri. Ecol. Monogr. 2007, 77, 301–334. [Google Scholar] [CrossRef] [Scilit]
- Jiang, D.; Zhao, X.; López-Pujol, J.; Wang, Z.; Qu, Y.; Zhang, Y.; Zhang, T.; Li, D.; Jiang, K.; Wang, B.; et al. Effects of climate change and anthropogenic activity on ranges of vertebrate species endemic to the Qinghai–Tibet Plateau over 40 years. Conserv. Biol. 2023, 37, e14069. [Google Scholar] [CrossRef] [Scilit] [PubMed]
- Loarie, S.R.; Duffy, P.B.; Hamilton, H.; Asner, G.P.; Field, C.B.; Ackerly, D.D. The velocity of climate change. Nature 2009, 462, 1052–1055. [Google Scholar] [CrossRef] [Scilit] [PubMed]
- Jia, R.; Ma, T.; Zhang, F.; Zhang, G.; Liu, D.; Lu, J. Population dynamics and habitat use of the Black-necked Crane (Grus nigricollis) in the Yarlung Tsangpo River basin, Tibet, China. Avian Res. 2019, 10, 32. [Google Scholar] [CrossRef] [Scilit]
- Han, X.; Huettmann, F.; Guo, Y.; Mi, C.; Wen, L. Conservation prioritization with machine learning predictions for the black-necked crane Grus nigricollis, a flagship species on the Tibetan Plateau for 2070. Reg. Environ. Change 2018, 18, 2173–2182. [Google Scholar] [CrossRef] [Scilit]

Disclaimer/Publisher’s Note: The statements, opinions and data contained in all publications are solely those of the individual author(s) and contributor(s) and not of MDPI and/or the editor(s). MDPI and/or the editor(s) disclaim responsibility for any injury to people or property resulting from any ideas, methods, instructions or products referred to in the content. |
© 2026 by the authors. Licensee MDPI, Basel, Switzerland. This article is an open access article distributed under the terms and conditions of the Creative Commons Attribution (CC BY) license.