


Abstract
Climate change threatens ecosystem stability in arid Central Asia, yet regional vegetation responses remain poorly resolved at the operational scale of land-use policy. We integrated long-term meteorological records (2000–2024) from Kazhydromet with Landsat surface-reflectance imagery for four epochs (2010, 2015, 2020, 2025) across the five administrative regions of Southern Kazakhstan (≈710,000 km2). After cross-sensor harmonization of Landsat 5 TM and Landsat 8 OLI, dense vegetation cover (NDVI > 0.4) increased modestly across all regions, with the cumulative area growing from 9.09 to 9.60 million hectares (+5.6%) and a transient 2020 minimum linked to the 2018–2020 drought. Per-region OLS trend slopes were not statistically significant at p < 0.05, given the four-epoch sampling (n = 4). A composite Biodiversity–Climate Sensitivity Index (BCSI), constructed from four normalized components (temperature trend, precipitation deficit, NDVI trend, and the coefficient of variation of dense-vegetation cover as a biodiversity–vulnerability proxy), identifies the lower Syr Darya floodplain and former Aral Sea margins as the most sensitive territories and the Northern Tien Shan as the most resilient. The framework provides an operational evidence base for climate-adaptive conservation aligned with SDG 13 and SDG 15.
1. Introduction
Climate change is widely recognized as one of the primary drivers of global biodiversity loss and ecosystem degradation [1,2,3,4]. Rising air temperatures, shifts in precipitation patterns, and increased frequency of extreme climatic events directly affect species distributions, ecosystem productivity, and ecological stability [5,6,7,8]. These impacts are particularly pronounced in arid and semi-arid regions, where ecosystems operate close to their physiological and hydrological limits [1,9,10].
Southern Kazakhstan features a high level of natural ecosystem diversity, including deserts, semi-deserts, steppes, foothills, and mountain systems of the Western Tien Shan, Karatau, and Dzhungarian Alatau ranges. The region hosts numerous endemic and relic species and plays an important role in maintaining ecological balance and ecosystem services. Recent climatic observations indicate a steady warming trend accompanied by increasing aridity, raising concerns about long-term biodiversity conservation and sustainable land use [11,12,13].
Despite documented warming, the response of Central Asian dryland vegetation to climate change is not unidirectional. Studies from comparable regions report contrasting trends—browning in some hotspots [14] and greening attributable to CO2 fertilization, irrigation expansion, and reduced grazing in others [13,15]. Compounding these climatic drivers, anthropogenic pressures specific to Southern Kazakhstan—including municipal solid waste accumulation in rapidly growing secondary cities such as Shymkent [16]—further modify ecosystem trajectories and complicate attribution of vegetation change to climate alone. Disentangling these competing signals at the operational scale of land-use policy (i.e., the administrative region) requires region-resolved, multi-temporal, and multi-indicator analyses.
Within the framework of the United Nations Sustainable Development Goals—particularly SDG 13 (Climate Action) and SDG 15 (Life on Land)—understanding climate–vegetation interactions at regional scales is critical [2,17,18]. This study therefore aims to (i) quantify the climatic context of Southern Kazakhstan from 2000 to 2024; (ii) characterize the spatial and temporal dynamics of dense-vegetation cover (NDVI > 0.4) at four epochs between 2010 and 2025 across the five administrative regions; (iii) develop and apply a composite Biodiversity–Climate Sensitivity Index (BCSI) that integrates climatic and vegetation indicators within a single GIS framework, using the coefficient of variation of NDVI cover as a proxy for ecosystem vulnerability; and (iv) identify priority territories for climate-adaptive conservation in Central Asia.
2. Materials and Methods
2.1. Study Area
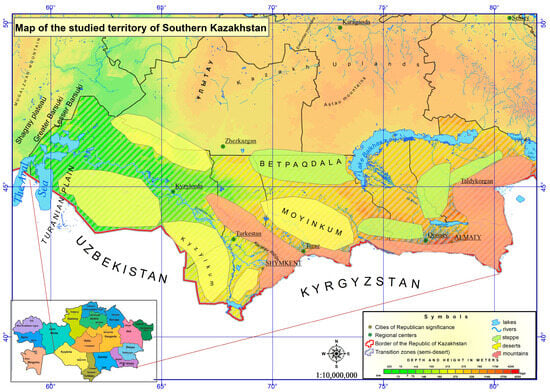
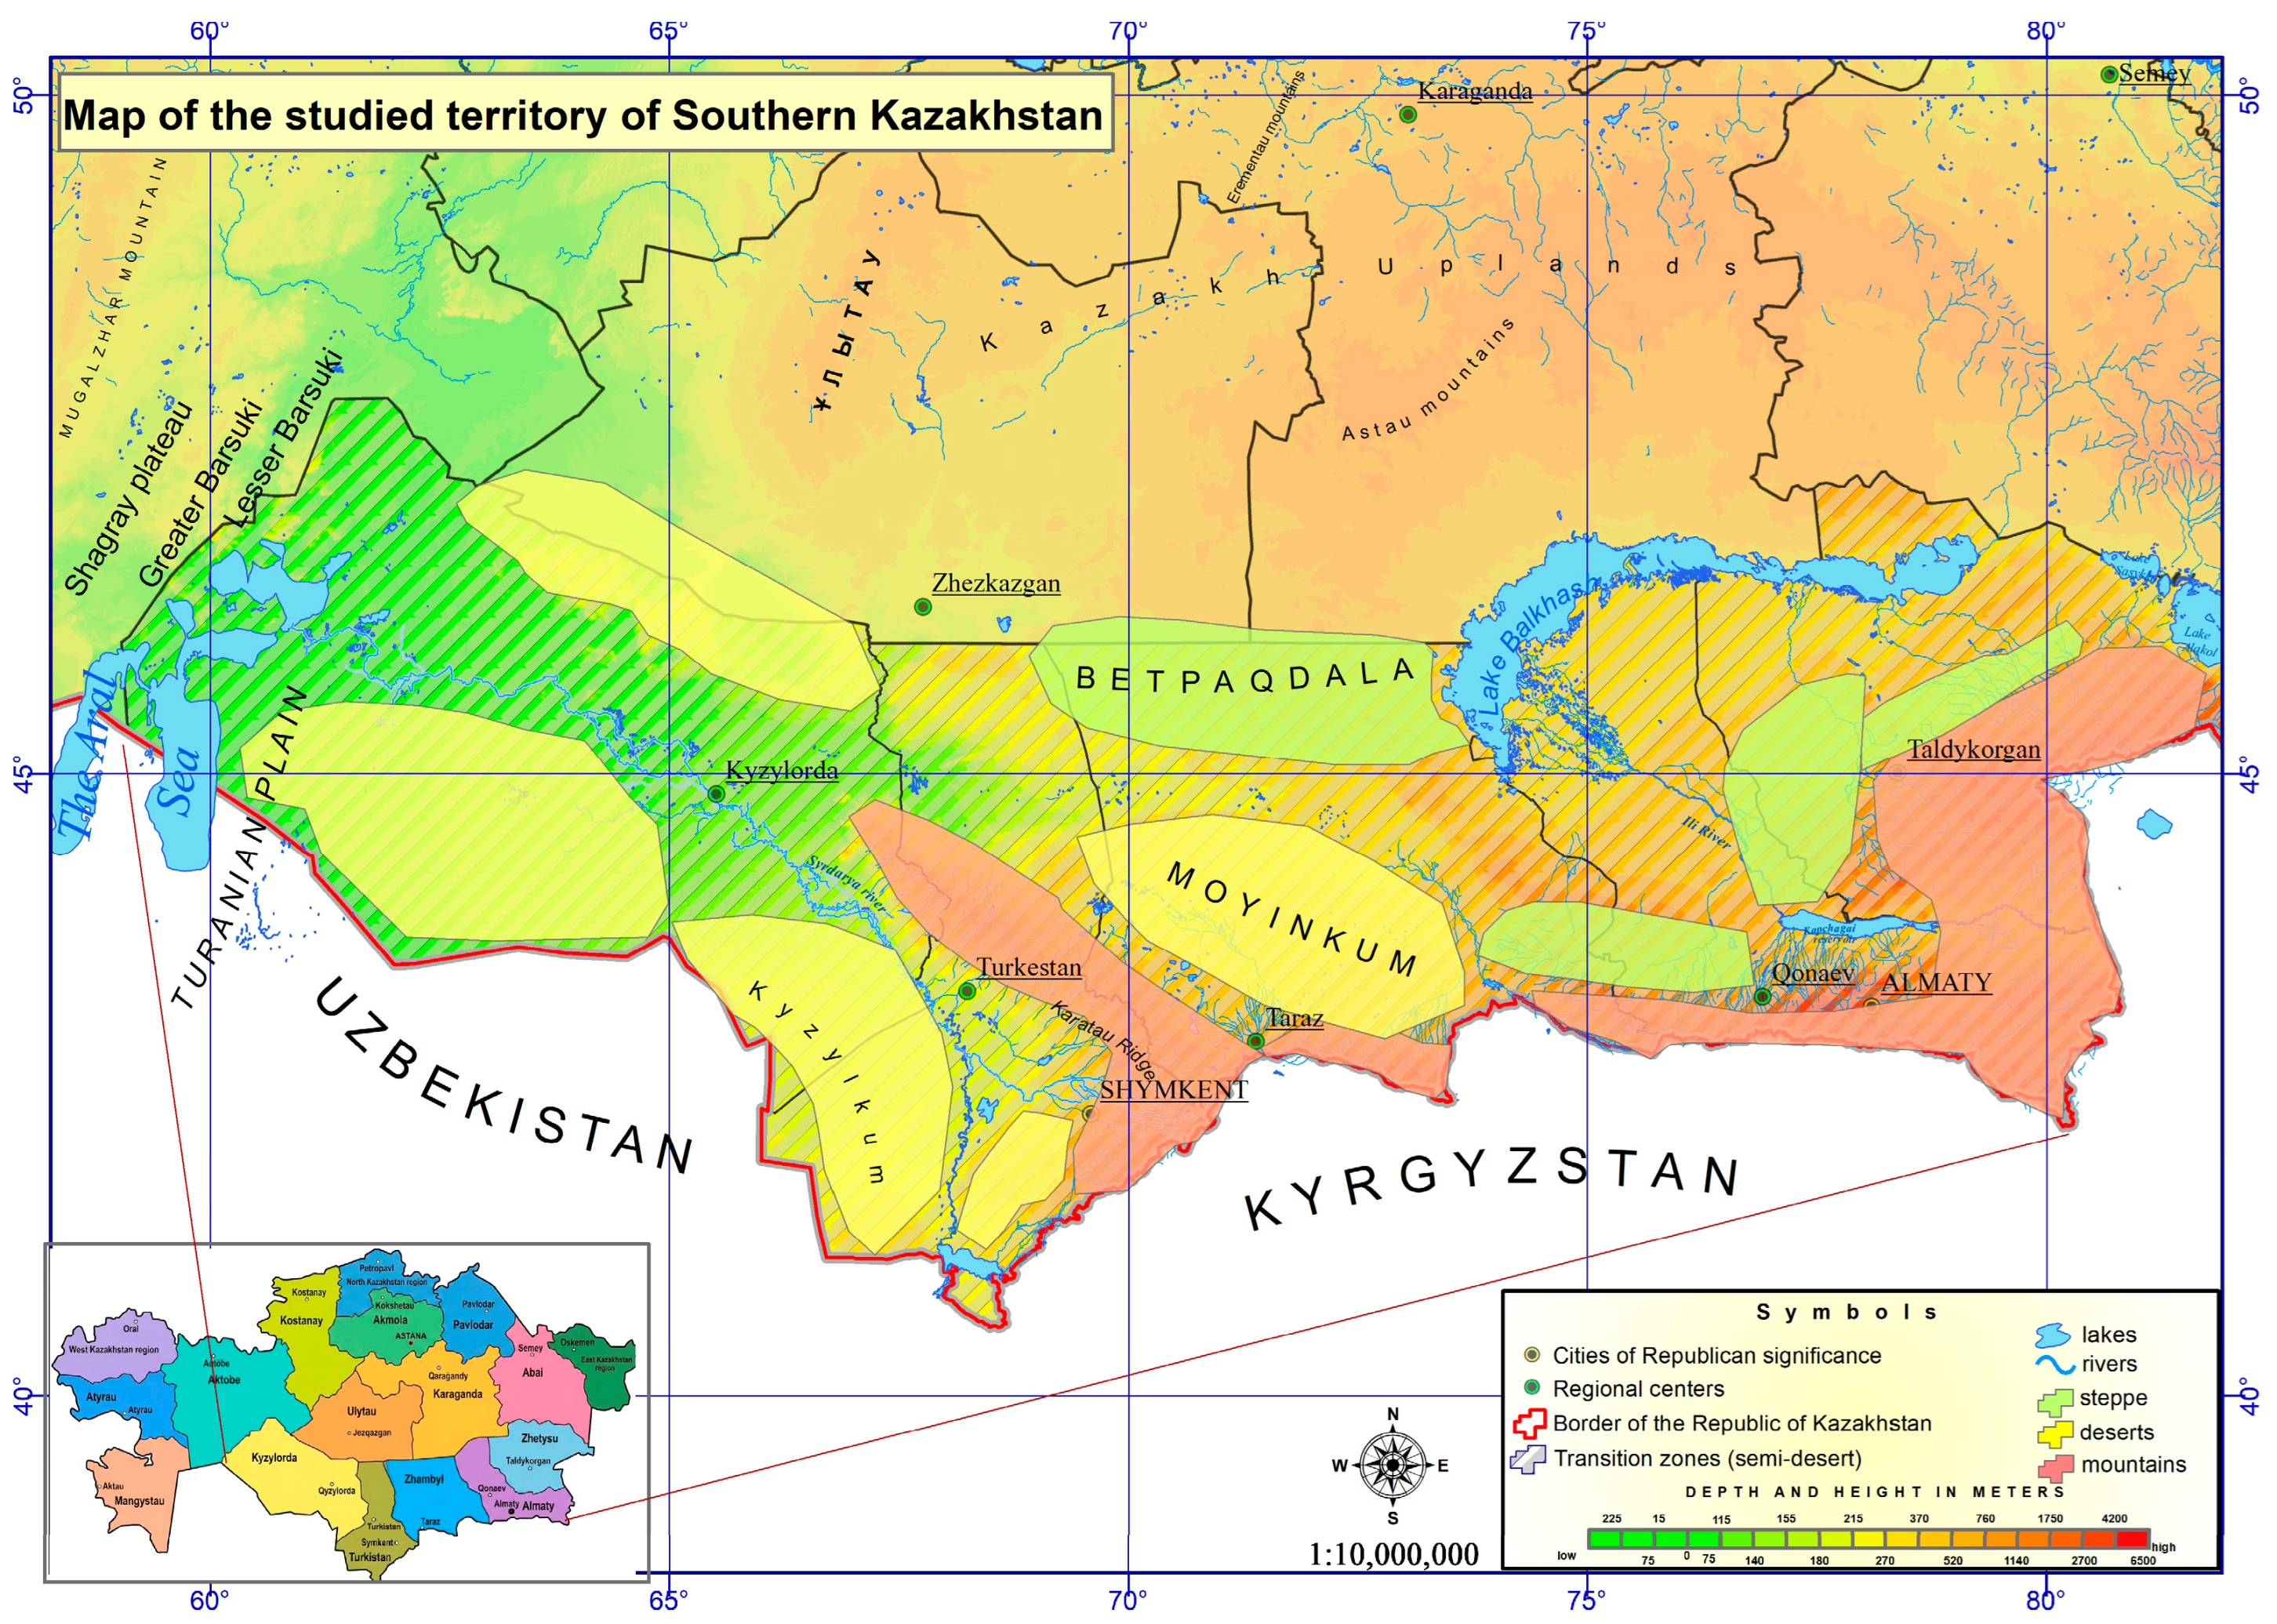
The study area spans the five administrative regions of Southern Kazakhstan—Kyzylorda, Turkistan, Zhambyl, Almaty, and Zhetysu—covering approximately 710,000 km2 (Figure 1). The territory includes desert and semi-desert ecosystems (Moyynkum and Kyzylkum sands, the lower Syr Darya floodplain), steppe and dry-steppe landscapes, foothill zones, and mountain ecosystems of the Western Tien Shan and Dzhungarian Alatau. The climate is sharply continental, with hot summers, cold winters, low annual precipitation, and high interannual variability [11].
Figure 1.
Study area: the five administrative regions of Southern Kazakhstan (Kyzylorda, Turkistan, Zhambyl, Almaty, and Zhetysu), shown together with the regional NDVI distribution (for 2025) used to delineate ecosystem types.
Vegetation cover in Southern Kazakhstan reflects strong altitudinal and climatic gradients. Desert ecosystems of the Kyzylorda and southern Turkistan regions are dominated by xerophytic and halophytic species, including Haloxylon aphyllum, Calligonum spp., Salsola arbuscula, Artemisia terrae-albae, and Tamarix spp., adapted to arid soils and moisture deficiency. Semi-desert and steppe landscapes of Zhambyl and northern Turkistan are characterized by Stipa spp., Festuca valesiaca, Poa bulbosa, and Artemisia spp., forming sparse pasture and dry-grass communities.
Foothill and mountain ecosystems of the Almaty and Zhetysu regions support denser and more diverse vegetation cover, including meadow-steppe communities, shrub formations, and fragments of mountain forests dominated by Picea schrenkiana, Malus sieversii, Juniperus seravschanica, and various riparian species along river valleys. Irrigated agricultural zones, particularly within the Syr Darya, Ili, Shu, and Talas river basins, also contribute substantially to high NDVI values due to cultivated vegetation and anthropogenic greening.
This pronounced spatial heterogeneity of vegetation types strongly influences NDVI distribution and ecosystem sensitivity patterns across the study area.
The Zhetysu region was administratively separated from the former Almaty Region in June 2022. To ensure consistency across the four NDVI epochs (2010, 2015, 2020, 2025), the post-2022 boundaries were applied retrospectively to the earlier epochs by intersecting Landsat composites with the current administrative geometry. Therefore, per-region statistics for 2010 and 2015 correspond to the territory now designated as Almaty or Zhetysu, not to the historical Almaty Region as a single unit.
2.2. Climatic Context
Climatic variables included mean annual air temperature and total annual precipitation, derived from long-term observational records at meteorological stations operated by Kazakhstan’s national hydrometeorological service (Kazhydromet) [11]. The Kazhydromet network in the study area includes long-term observation stations at Aralsk, Kazaly, Kyzylorda, Turkestan, Shymkent, Taraz, Merke, T. Ryskulov, Almaty (Kamenskoe Plato), Esik, Taldykorgan, Sarkand, and Zharkent, several of which have been recognized by the World Meteorological Organization as centennial observation stations. Linear trends in mean annual temperature were quantified using ordinary least squares (OLS) regression [19], with significance assessed at p < 0.05:
where Tt is the mean annual temperature in year t, α is the intercept, β is the warming rate (°C·yr−1), and εt represents random climatic fluctuations. To complement the parametric OLS analysis, monotonic trends were independently verified using the nonparametric Mann–Kendall test [20] and the Theil–Sen slope estimator [21]. Precipitation variability was assessed using the coefficient of variation:
where σP is the standard deviation, and μP is the mean annual precipitation.
Tt = α + β · t + εt,
CVP = (σP/μP) × 100%,
2.3. Vegetation Data and NDVI Processing
Vegetation condition and ecosystem productivity were characterized using the satellite-derived Normalized Difference Vegetation Index (NDVI). Landsat Collection 2 Surface Reflectance products were used—Landsat 5 TM for 2010, and Landsat 8 OLI for 2015, 2020, and 2025—at 30-m spatial resolution, accessed through the USGS EarthExplorer platform (https://earthexplorer.usgs.gov (accessed on 21 February 2026)). Peak-growing-season composites (July–August) were generated for each target year to minimize phenological variability and cloud contamination. The analysis was based on four multi-temporal observation epochs (2010, 2015, 2020, and 2025), representing the peak vegetation period (July–August) for the entire study area. A total of 20 regional observations were analyzed (5 administrative regions × 4 temporal epochs). In addition, pixel-level analysis was conducted using Landsat surface-reflectance imagery at 30 m spatial resolution across approximately 710.000 km2, resulting in several million valid NDVI pixels per epoch after cloud masking and preprocessing. Cloud and cirrus pixels were masked using the CFMask quality-assessment band. NDVI was computed from red and near-infrared surface-reflectance bands following the standard formulation [22]:
where ρNIR and ρRED denote near-infrared and red reflectance, respectively [23]. For Landsat 5 TM, ρRED = Band 3 and ρNIR = Band 4; for Landsat 8 OLI, ρRED = Band 4 and ρNIR = Band 5.
NDVI = (ρNIR − ρRED)/(ρNIR + ρRED),
Cross-sensor harmonization. The transition from Landsat 5 TM (2010) to Landsat 8 OLI (2015–2025) introduces small but systematic differences in surface-reflectance values that can bias multi-temporal NDVI comparisons. To ensure inter-sensor comparability, OLI surface reflectance was transformed to TM-equivalent values using the ordinary-least-squares coefficients reported by [24] for the red and NIR bands before NDVI calculation.
An NDVI threshold of >0.4 was used to delineate dense-vegetation cover, consistent with regional classifications for Central Asian drylands [13,14,15]. All geospatial processing was performed in ArcGIS Pro 3.2 (Esri, Redlands, CA, USA), and data were harmonized to the WGS 1984 UTM Zone 42N projection. Per-pixel and per-region temporal NDVI trends were estimated using OLS regression for the four target years:
NDVIt = α + β · t + εt,
Statistical significance was evaluated at p < 0.05; given the limited sample size (n = 4 epochs), trend significance results are interpreted conservatively (Section 3.2).
2.4. Composite Biodiversity–Climate Sensitivity Index (BCSI)
To integrate climatic and vegetation indicators within a single decision-support metric, a composite Biodiversity–Climate Sensitivity Index (BCSI) was developed following the OECD/JRC methodology for composite indicators [25,26]. Four normalized components were used:
- X1—temperature trend (mean annual air temperature trend 2000–2024 in °C/decade), as a proxy for thermal stress;
- X2—precipitation deficit (annual precipitation trend in mm/decade, sign-inverted), as a proxy for hydrological stress;
- X3—NDVI trend (dense-vegetation cover trend in pp/decade, sign-inverted), as a direct vegetation response;
- X4—vegetation volatility (coefficient of variation of dense-vegetation cover 2010–2025), as a proxy for biodiversity vulnerability—the rationale being that ecosystems whose dense-vegetation cover is more variable across epochs are more likely to host species exposed to recurrent stress and habitat instability.
Before aggregation, all four components were normalized using min–max scaling so that each contributed on a common 0–1 scale:
Xinorm = (Xi − Xmin)/(Xmax − Xmin),
Higher normalized values indicate greater sensitivity (e.g., stronger warming, larger NDVI decline, higher vegetation volatility). The composite index was then computed as a weighted sum:
BCSI = Σi wi · Xinorm, Σwi = 1,
Equal weights (w1 = w2 = w3 = w4 = 0.25) were used as a defensible default following best-practice recommendations for composite indicators when no a priori reason exists to favor one component [25,26]. The resulting continuous BCSI surface was discretized into five sensitivity classes—Very Low (<0.30), Low (0.30–0.50), Moderate (0.50–0.54), High (0.54–0.57), and Very High (>0.57)—using natural-breaks classification optimized for the regional BCSI distribution. To assess robustness, the BCSI was recomputed under three alternative weighting schemes: climate-dominant (w1 = 0.40, w2 = 0.30, w3 = 0.20, w4 = 0.10); vegetation-dominant (w1 = 0.20, w2 = 0.10, w3 = 0.40, w4 = 0.30); and precipitation-dominant. Across all alternatives, the spatial location of Very High and Very Low classes was preserved (Section 3.3).
Note on terminology. The term ‘Biodiversity–Climate Sensitivity Index’ is retained for compatibility with related regional-scale composite-index frameworks; however, in the present study, the biodiversity component (X4) is operationalized through the coefficient of variation of remotely sensed dense-vegetation cover, which is a proxy for ecosystem vulnerability rather than a direct measurement of species richness or diversity. Direct species-level integration is identified as a priority for future versions of the index (Section 4.5).
2.5. Analytical Workflow
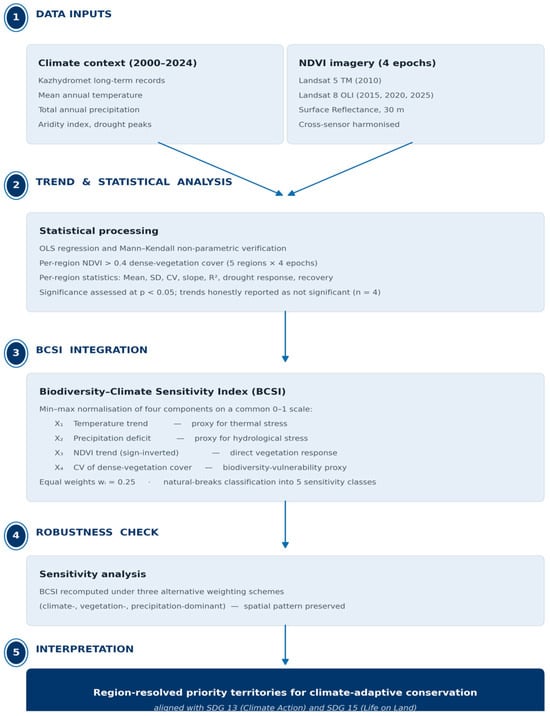
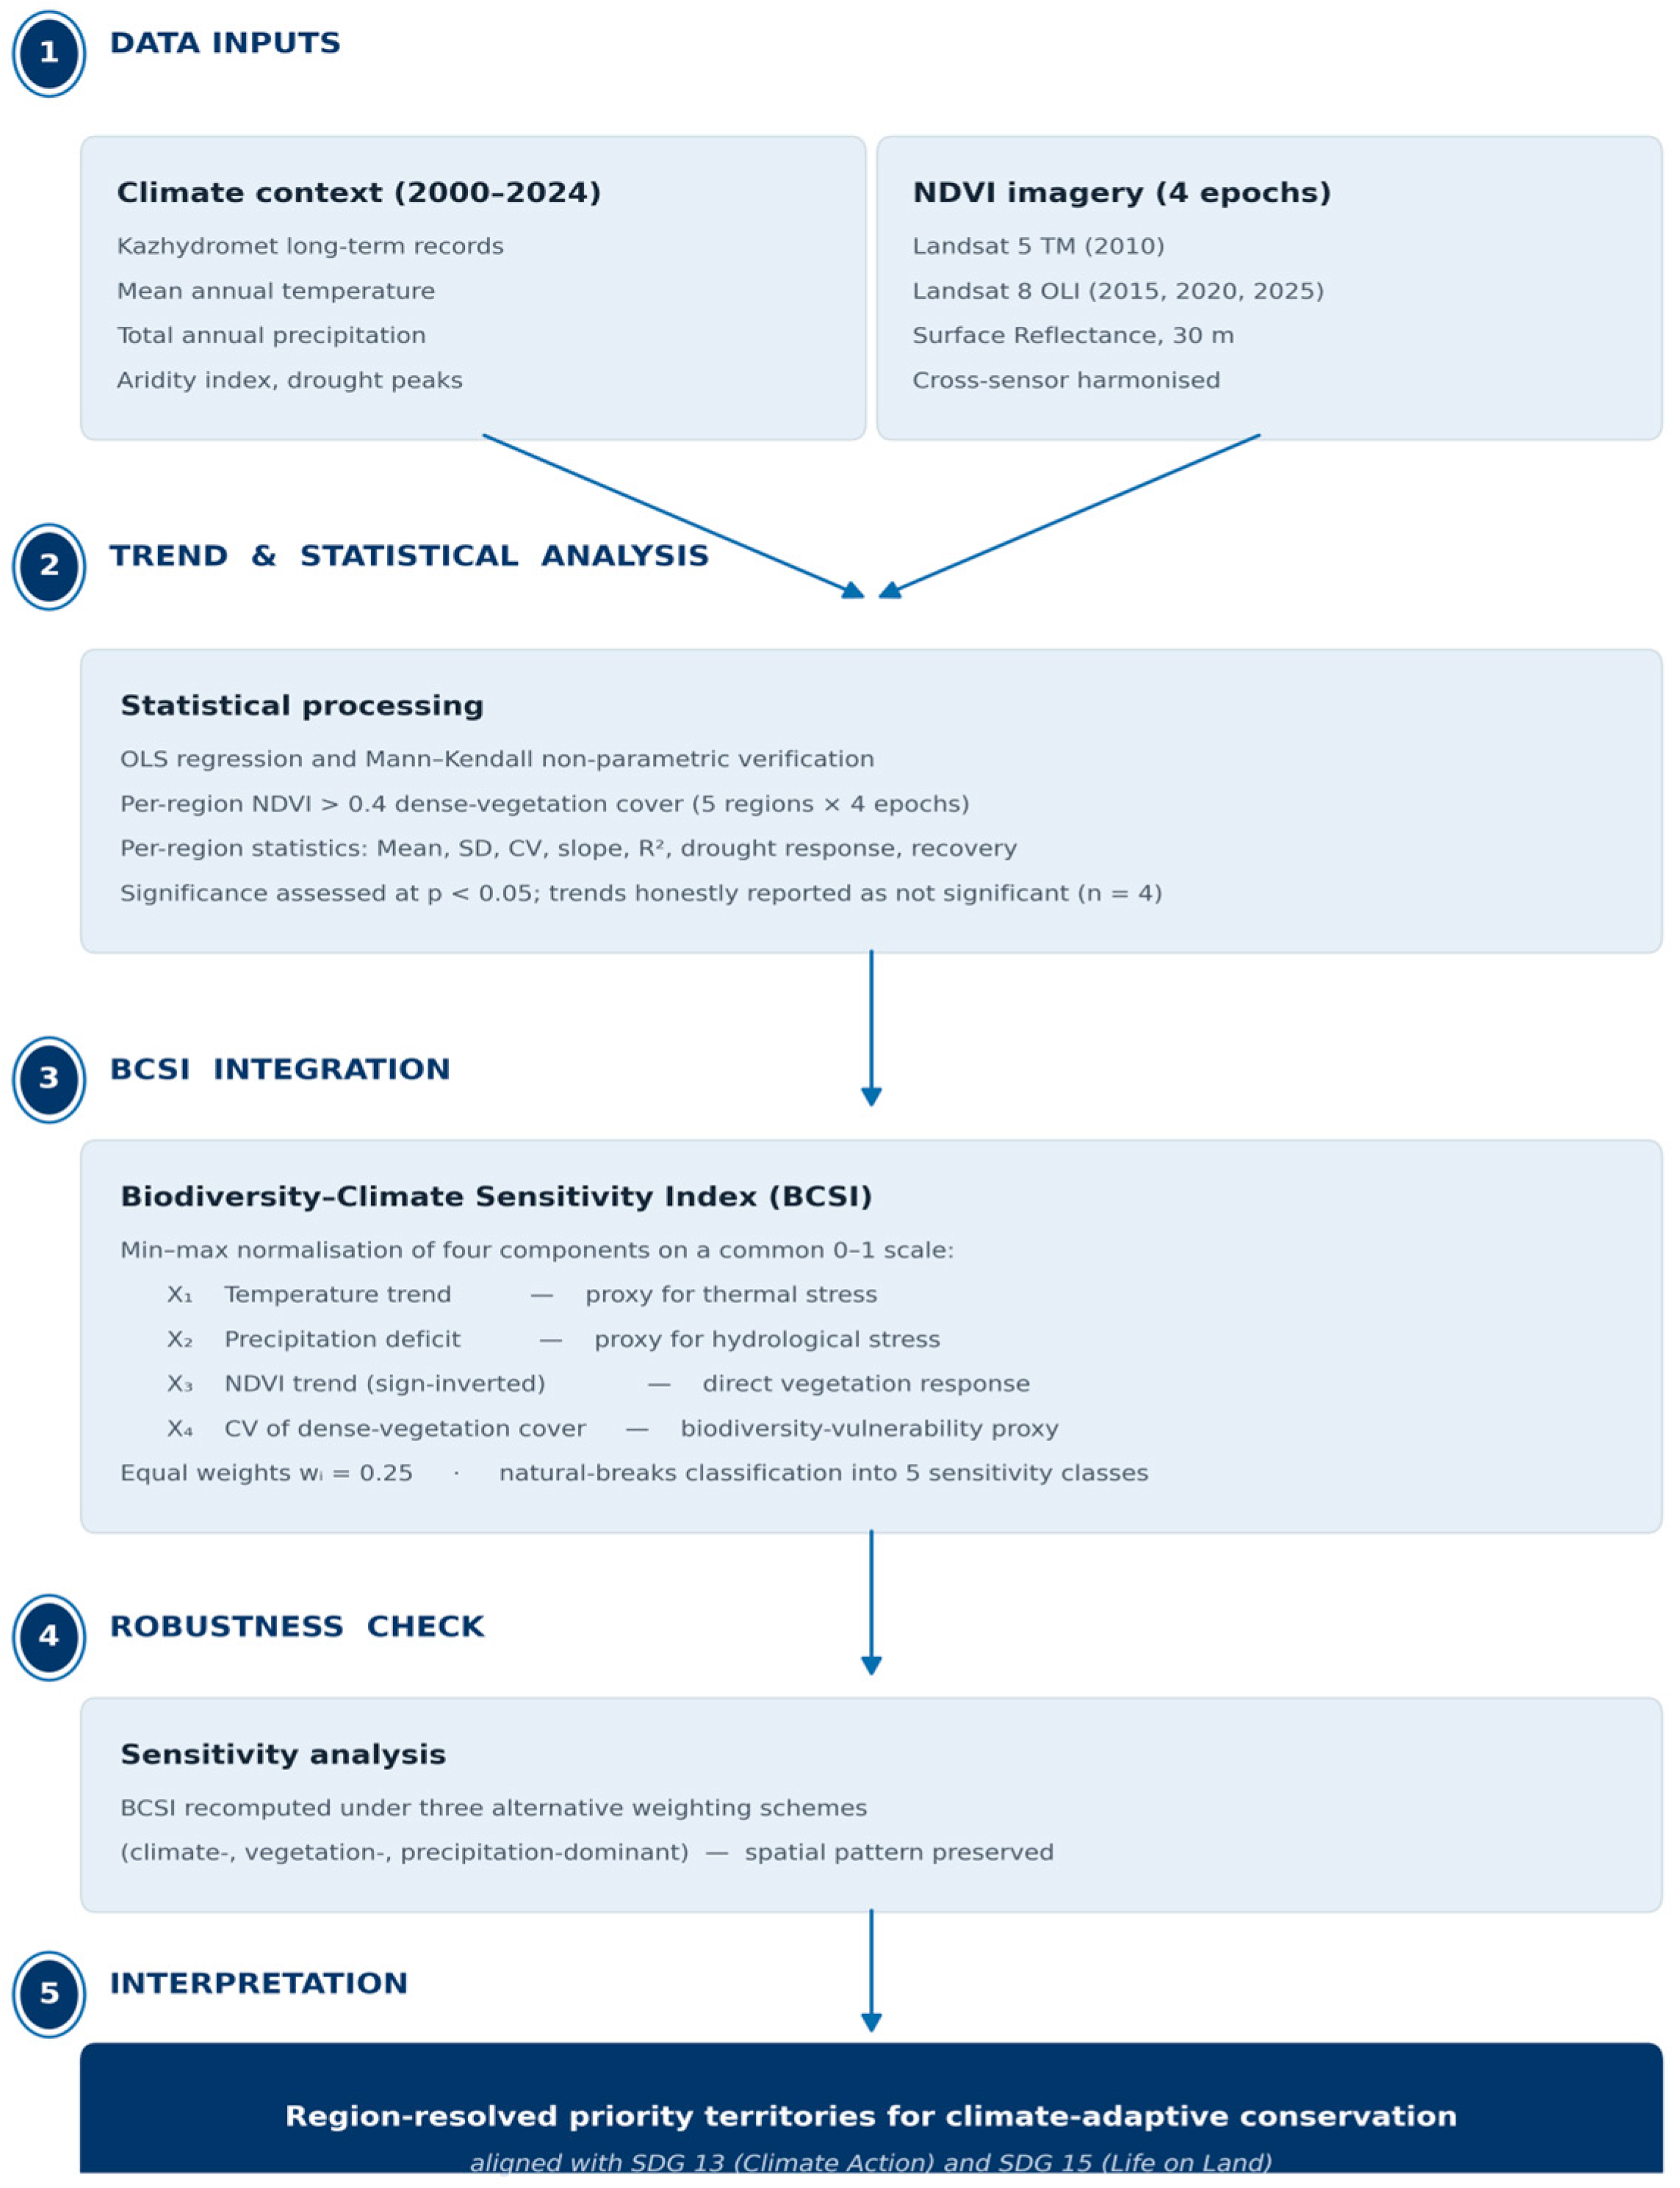
The integrated workflow consisted of (i) data preprocessing and harmonization, including cross-sensor calibration of Landsat 5/8; (ii) temporal trend analysis of climatic and NDVI variables using parallel OLS and Mann–Kendall procedures; (iii) per-region computation of dense-vegetation cover statistics (mean, standard deviation, coefficient of variation, OLS slope, R2, drought response, recovery); (iv) BCSI computation with equal weights and sensitivity testing under three alternative weighting schemes; and (v) comparative evaluation of ecosystem responses across the five administrative regions and the three broad ecosystem types (desert, steppe, mountain). The full analytical framework is summarized in Figure 2.
Figure 2.
Analytical framework of the study showing the integration of climatic data, vegetation indices, biodiversity metrics, and statistical analyses for assessing ecosystem responses to climate change.
3. Results
3.1. Climatic Context, 2000–2024
Analysis of long-term Kazhydromet records [11] indicates a consistent regional warming trend across Southern Kazakhstan, with decadal warming rates ranging from approximately +0.28 to +0.42 °C per decade. The strongest warming has occurred in the lowland and arid zones of Kyzylorda and southern Turkistan, whereas mountain ecosystems in Almaty and Zhetysu have experienced more moderate but still significant warming. Precipitation regimes have become more irregular: arid and steppe zones have seen stable or weakly declining precipitation, while some mountainous areas have shown slight increases. Pronounced drought pulses occurred in 2012 and during the prolonged 2018–2020 dry spell, both consistent with regional reports [13,27]. The aggregate climate context relevant to the present analysis is summarized in Table 1.
Table 1.
Summary of climatic context for Southern Kazakhstan, 2000–2024.
3.2. Spatial NDVI Patterns and Dense-Vegetation Dynamics
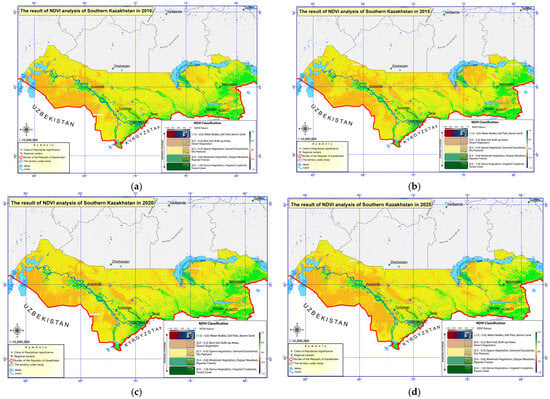
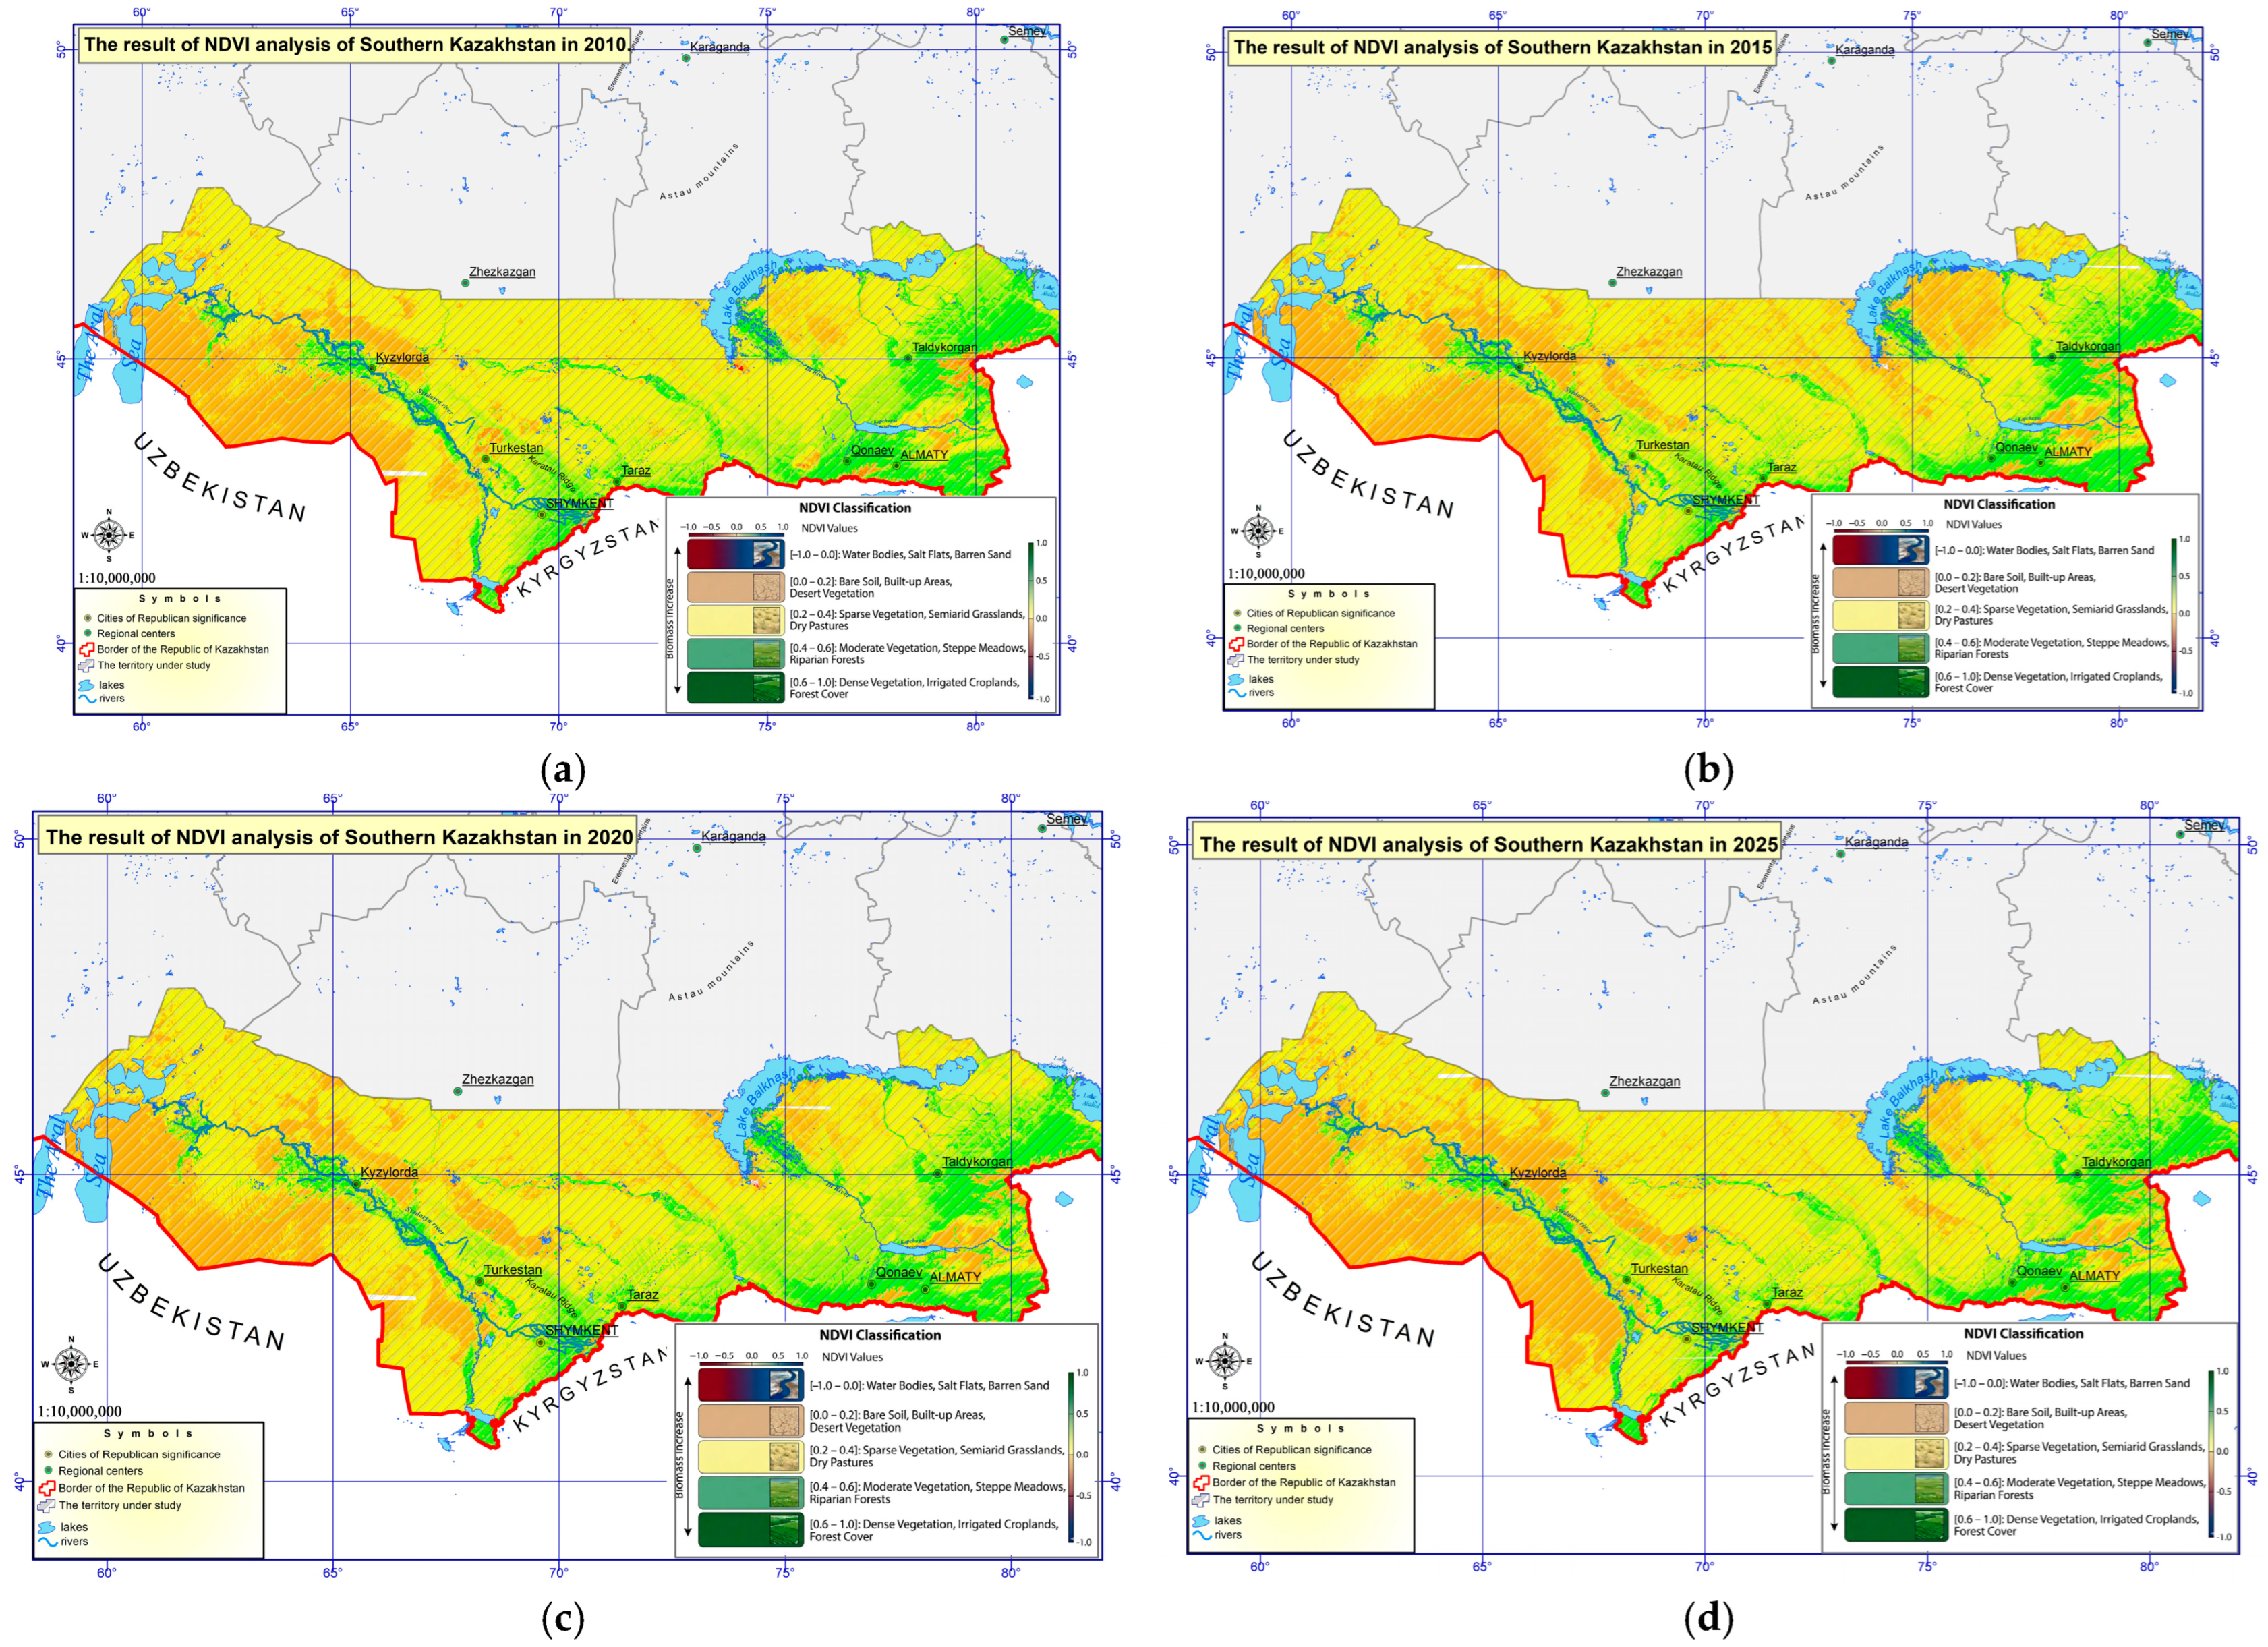
Spatial NDVI distributions for the four target years are shown in Figure 3 as a five-class gradient ranging from water bodies and bare ground (NDVI ≤ 0.0) to dense vegetation (NDVI > 0.6). Across all four epochs, the highest NDVI values are concentrated in the foothill and mountain belts of the Almaty and Zhetysu regions and in the irrigated belt of central Turkistan. In contrast, the desert lowlands of Kyzylorda and parts of Zhambyl maintain low NDVI (<0.2). The 2020 panel shows a visible reduction in the moderate-NDVI class (0.2–0.4) across all regions, consistent with the 2018–2020 drought, with recovery observed in 2025.
Figure 3.
Spatial distribution of NDVI across Southern Kazakhstan for (a) 2010, (b) 2015, (c) 2020, and (d) 2025 derived from harmonized Landsat 5/8 surface reflectance composites. NDVI is classified into five ecosystem types: water/bare (≤0.0), desert/built-up (0.0–0.2), sparse vegetation (0.2–0.4), moderate vegetation (0.4–0.6), and dense vegetation (>0.6), including irrigated croplands and forests. All maps use the same projection (WGS 1984 UTM Zone 42N) and legend. The reduction in moderate NDVI in 2020 reflects drought conditions during 2018–2020.
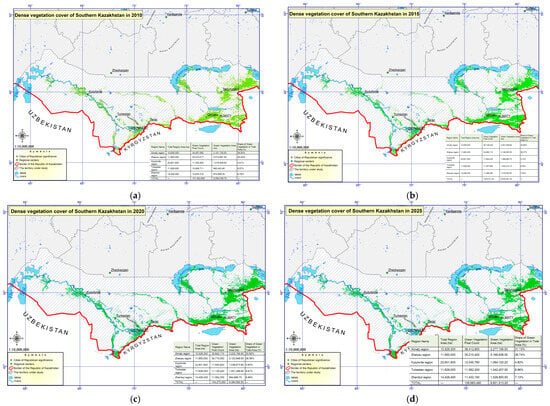
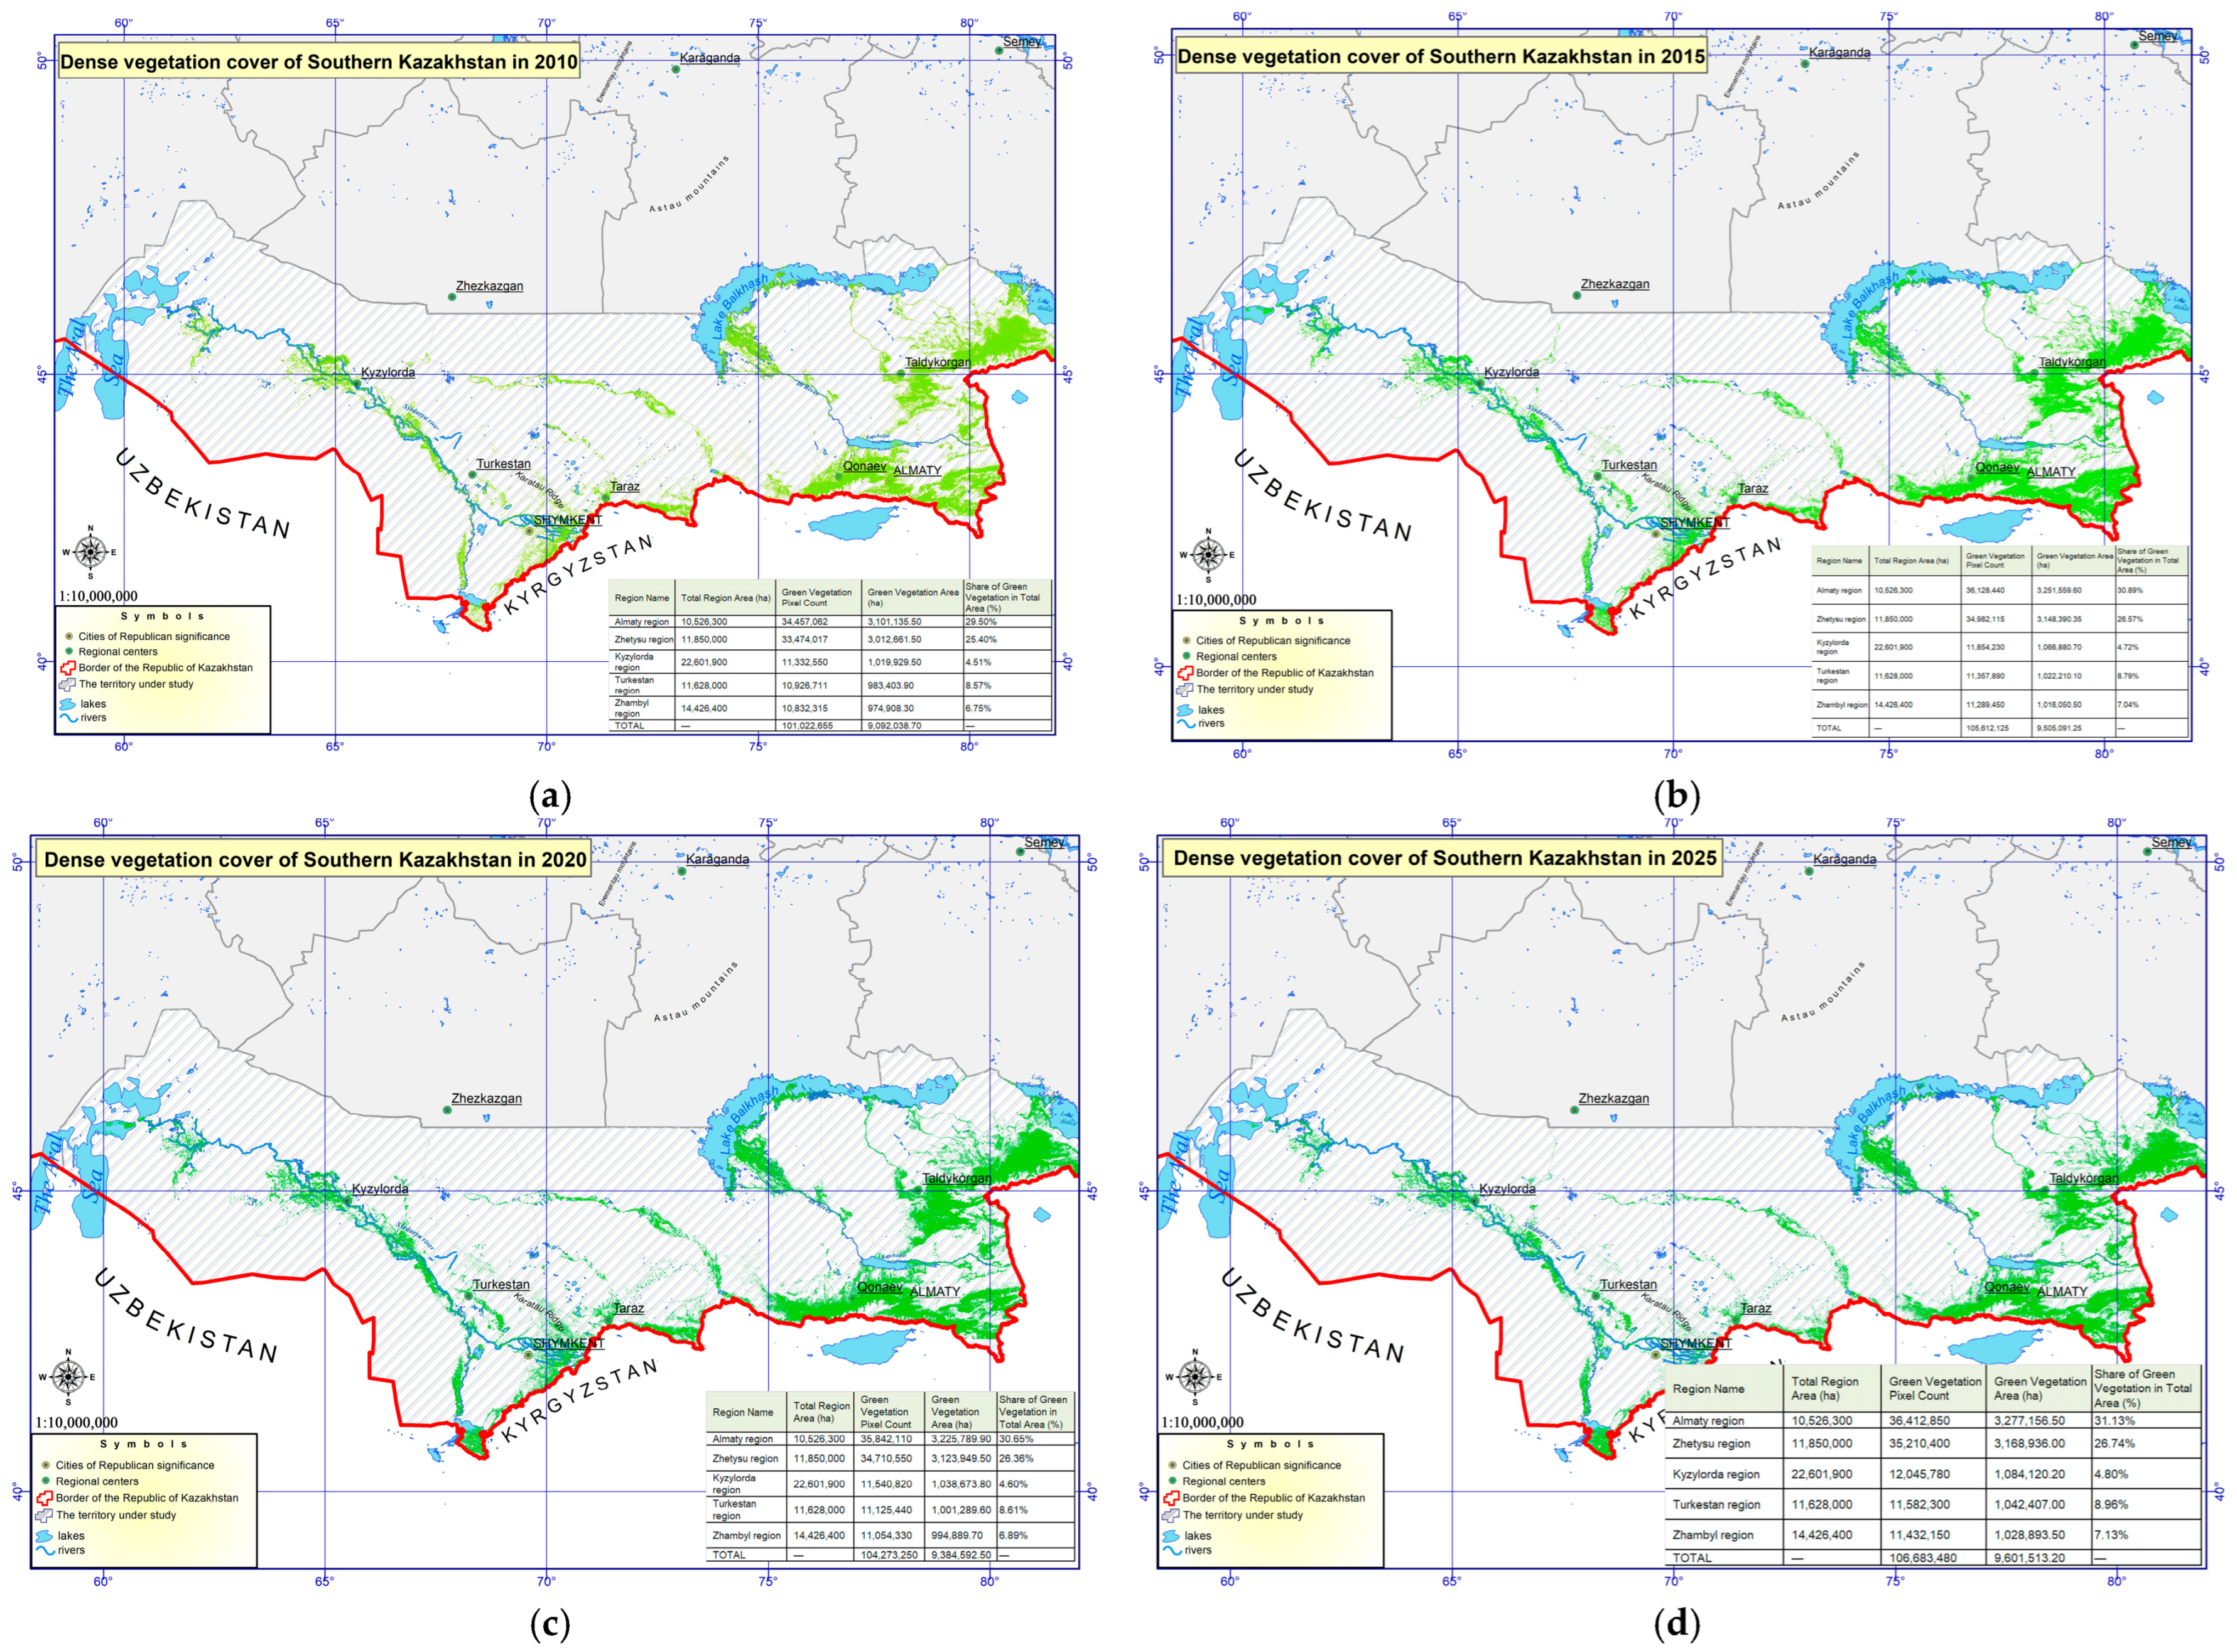
Quantification of dense vegetation cover (NDVI > 0.4) across the four target years is summarized in Table 2 and shown in Figure 4. Over the full 2010–2025 period, every region recorded a positive net change in dense vegetation cover. The mountain ecosystems of Almaty rose from 29.50% to 31.13% (+1.63 pp), and those of Zhetysu from 25.40% to 26.74% (+1.34 pp). The arid lowlands also expanded their dense-vegetation footprint, though more modestly in absolute terms: Turkistan from 8.57% to 8.96% (+0.39 pp), Zhambyl from 6.75% to 7.13% (+0.38 pp), and Kyzylorda from 4.51% to 4.80% (+0.29 pp). The cumulative dense-vegetation area of Southern Kazakhstan grew from 9.092 Mha in 2010 to 9.602 Mha in 2025—a net change of +5.6% over 15 years—with a transient minimum of 9.385 Mha in 2020 attributable to the 2018–2020 drought (Figure 4).
Table 2.
Ecosystem-level vegetation indicators across regions of Southern Kazakhstan (2010–2025), derived from Landsat Collection 2 dense-vegetation time series (NDVI > 0.4).
Figure 4.
Spatial distribution of dense vegetation cover (NDVI > 0.4) in Southern Kazakhstan for (a) 2010, (b) 2015, (c) 2020, and (d) 2025, showing temporal changes in vegetation extent across the study period.
Importantly, although every region showed a positive net change, the OLS trend slopes for the four-epoch series were not statistically significant at p < 0.05 (n = 4 observations per region). The R2 values of the OLS fits ranged from 0.508 (Turkistan) to 0.691 (Almaty), indicating that a linear time component explains a substantial proportion of the inter-epoch variance. However, the limited number of observations precludes a definitive assessment of the trend. The observed direction of change is therefore consistent with regional resilience but not conclusive evidence of a sustained greening trajectory; a continuous annual time series would be required to confirm the trend definitively (Section 4.5). Per-region statistical detail (mean, standard deviation, CV, OLS slope, R2, drought response, recovery) is provided in Table 2.
Across all five regions, the data also reveal a consistent inverse relationship between mean cover and CV: the mountain ecosystems of Almaty and Zhetysu (highest mean cover, ≈26–31%) show the lowest CV (1.97–2.05%), whereas the desert ecosystem of Kyzylorda (lowest mean cover, ≈4.7%) shows the highest CV (2.38%). This pattern indicates that arid lowlands are not only less vegetated in absolute terms but also more variable across epochs, supporting the use of CV as a meaningful component of ecological sensitivity in the BCSI (Section 3.3). The 2020 drought response is also strongest in arid lowlands (−2.0 to −2.5%) and weakest in mountains (−0.8%), and the 2020 → 2025 recovery follows the same gradient (+4.4% in Kyzylorda vs. +1.6% in Almaty).
Green-shaded pixels mark surfaces classified as dense vegetation. Per-region area statistics are reported in Table 2. The 2018–2020 drought is evident as a transient reduction across all regions in panel (c), followed by recovery and net expansion by 2025.
Thus, the statistical analysis included four temporal observations for each administrative region (n = 4), corresponding to the years 2010, 2015, 2020, and 2025, and a total regional sample size of n = 20 across the five study regions.
3.3. Composite Biodiversity–Climate Sensitivity Index (BCSI) Results
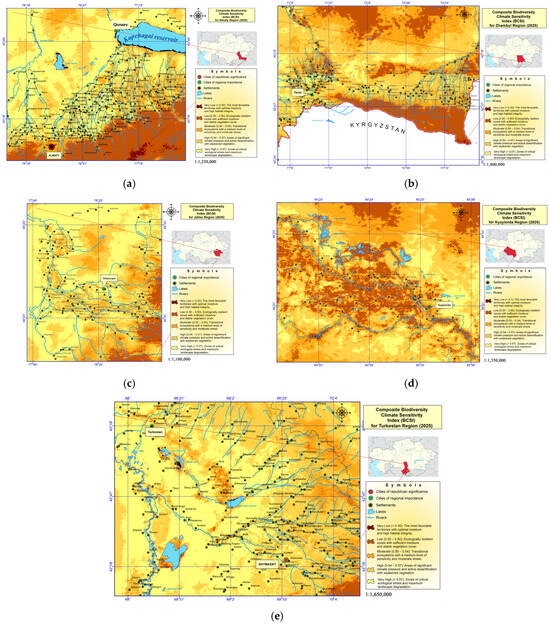
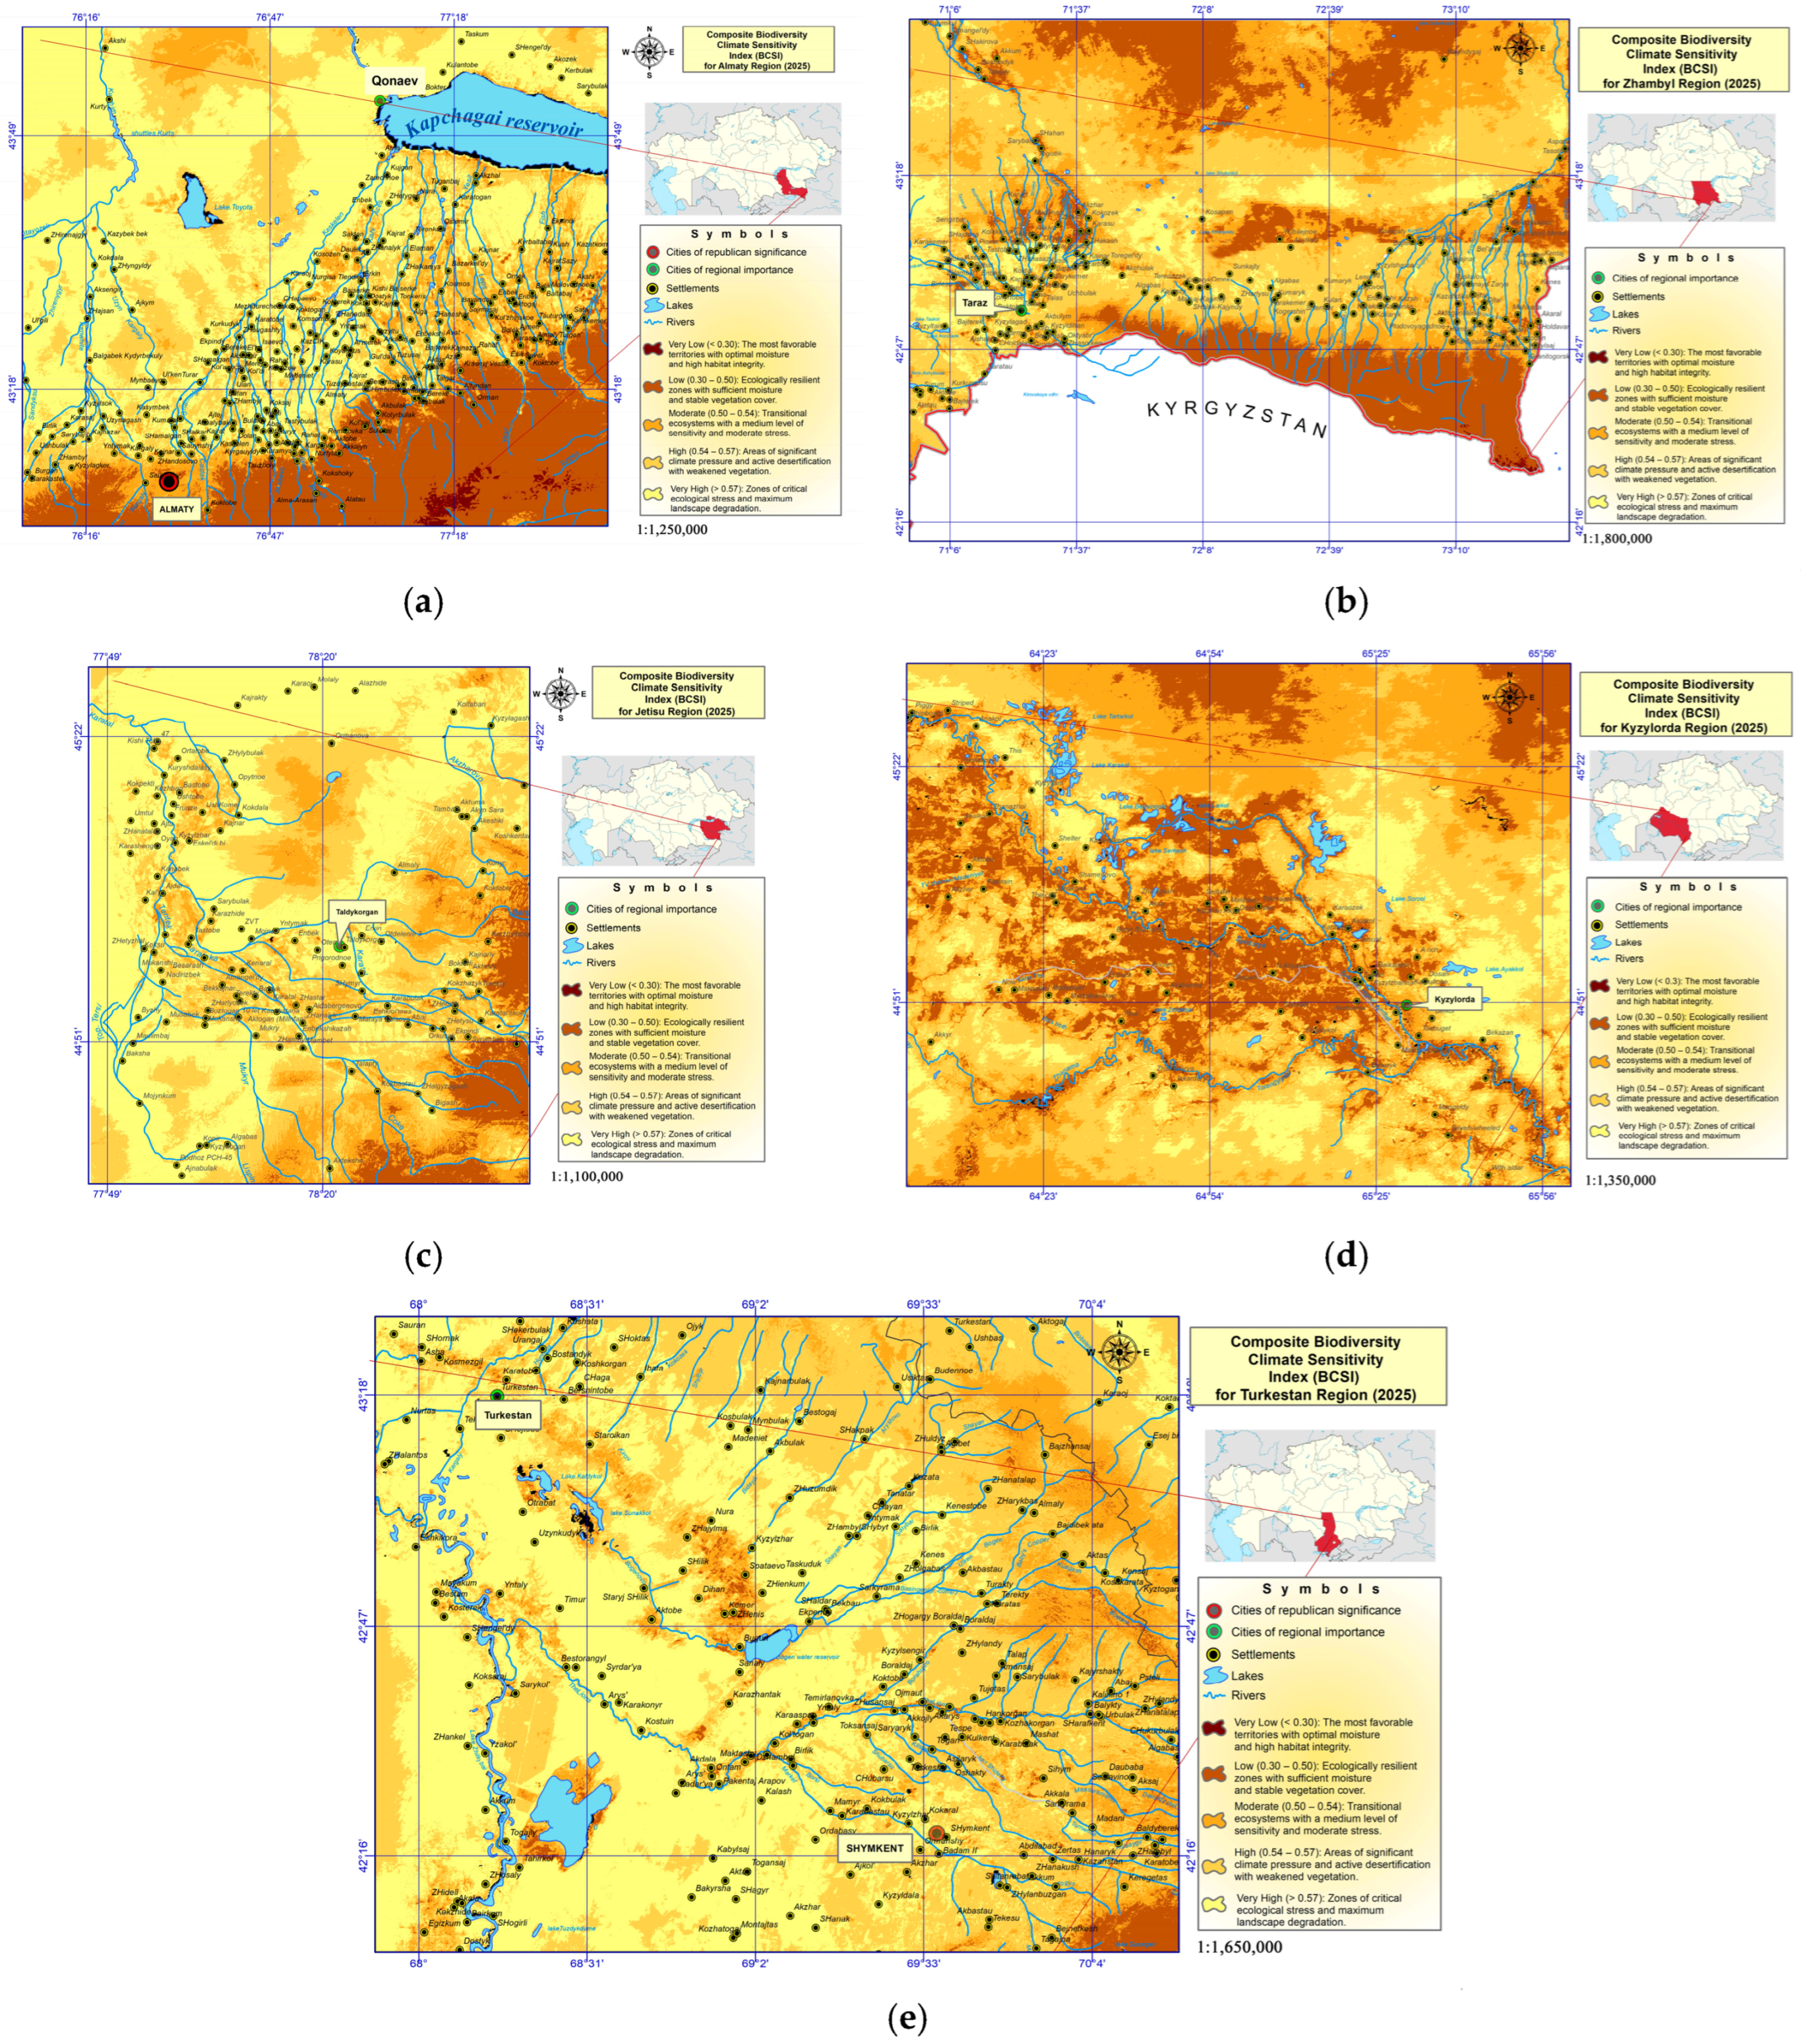
The BCSI maps (Figure 5) illustrate pronounced spatial variability in ecosystem sensitivity across the five administrative regions. In the Kyzylorda region (Figure 5a), the landscape is predominantly characterized by Moderate-to-High BCSI classes, with extensive areas categorized as Very High along the lower Syr Darya floodplain and the former Aral Sea margins, reflecting the region’s status as one of Central Asia’s most ecologically stressed zones [13,28]. The Turkistan region (Figure 5b) displays a discernible gradient, with Low-to-Moderate BCSI values dominating the central irrigated belt and heightened sensitivity along the desert margins of the Kyzylkum and Moyynkum sands. In Zhambyl (Figure 5c), the landscape primarily exhibits Moderate BCSI values, with localized zones of low sensitivity found in the foothill belt of the Kyrgyz Range and along the corridors of the Talas and Chu rivers. The Almaty region (Figure 5d) demonstrates notable internal variation: the mountainous southeastern sector (Northern Tien Shan) consistently registers as Very Low to Low BCSI, representing the most ecologically resilient areas within the study, while the lowland steppe regions and the Kapchagai reservoir margins show Moderate-to-High sensitivity. Similarly, the Zhetysu region (Figure 5e) presents a subtler mountain-to-lowland gradient, with low-sensitivity foothills of the Dzhungarian Alatau transitioning to Moderate values in the Balkhash drainage basin.
Figure 5.
Composite Biodiversity–Climate Sensitivity Index (BCSI) in Southern Kazakhstan, 2025. Panels (a–e) represent Kyzylorda, Turkistan, Zhambyl, Almaty, and Zhetysu regions. BCSI is grouped into five classes from Very Low (<0.30) to Very High (>0.57), with higher values indicating greater ecosystem sensitivity. Insets show regional locations in Kazakhstan.
Across all five regions, mountainous, well-watered foothill ecosystems consistently show lower BCSI values. At the same time, arid lowlands, hydrologically modified areas, and desert-margin transitional zones are identified as priority targets for conservation and adaptive management. The dominant BCSI class for each region is summarized in Table 3.
Table 3.
Dominant BCSI class and spatial pattern by region (2025).
4. Discussion
4.1. Climatic Context for Vegetation Responses
The observed increase in temperature, ranging from 0.28 to 0.42 °C per decade across Southern Kazakhstan, aligns with broader climate patterns documented throughout Central Asia, where temperature increases often exceed global averages in arid and semi-arid regions [2,5,12]. Long-term data from Kazhydromet [11] further corroborate a persistent upward trend in mean annual air temperature, accompanied by greater climate variability. This variability has led to enhanced evapotranspiration rates and increased water stress in lowland ecosystems. Additionally, precipitation patterns have become more erratic, with extended dry spells—most notably in 2012 and from 2018 to 2020—alternating with episodes of extreme short-term events. The trend toward stable or declining precipitation in lowland areas highlights regions such as southern Turkistan, Kyzylorda, and Zhambyl as zones experiencing an accelerating moisture deficit. These regional climate signals provide essential context for understanding the vegetation responses observed in this study.
4.2. Resilience Signal and Its Statistical Limits
The aggregate finding of this study—a 5.6% net increase in dense-vegetation area between 2010 and 2025, with positive change in every administrative region—appears to contradict the prevailing narrative of degradation in Central Asian drylands [12,13,27]. Two important qualifications are necessary.
First, the four-epoch sampling design (n = 4) is inherently limited in its ability to confirm trends. Although OLS R2 values are moderate to high (0.51–0.69) and the direction of change is consistently positive across all five regions, none of the per-region OLS slopes reach statistical significance at p < 0.05. The observed direction of change is therefore consistent with regional resilience but not conclusive evidence of a sustained greening trajectory. A continuous annual NDVI time series, ideally implemented in Google Earth Engine, would enable more robust trend detection using non-parametric tests such as the Mann–Kendall statistic with Sen’s slope estimator. This is identified as a priority for future versions of this analysis (Section 4.5).
Second, the observed greening signal is unlikely to be attributable solely to climate. CO2 fertilization has been documented to enhance water-use efficiency and primary productivity in semi-arid systems globally [10,29]. Post-Soviet livestock numbers have not fully recovered to their late-1980s peaks across much of Southern Kazakhstan, allowing partial regrowth of pasture in formerly heavily grazed steppe and semi-desert zones [13,15,30]. Visual inspection of Figure 3 also indicates that a substantial fraction of the high-NDVI expansion in the foothill belts of Almaty, Zhetysu, and northern Turkistan coincides with the cadastral footprint of irrigation schemes in the Shu, Talas, Aksu, Charyn, and Ile river basins, suggesting that management drivers also contribute to the regional signal. Disentangling these competing components—for example, by overlaying dense-vegetation pixels with the GFSAD30 irrigated-cropland mask—is a priority for future versions of this analysis.
Third, the transient minimum in 2020 demonstrates that the system remains sensitive to drought pulses; what distinguishes our results is the rapid recovery between 2020 and 2025, observed across all five regions and quantified in Table 2 (1.4–4.4% recovery from 2020 to 2025). This recovery indicates short-term sensitivity to precipitation pulses, superimposed on a longer-term trend, with the magnitude of both drought response and recovery strongest in the most arid regions (Kyzylorda, Zhambyl) and weakest in mountain regions (Almaty, Zhetysu).
4.3. Spatial Heterogeneity Revealed by the BCSI
Although the regional aggregate signal indicates expansion, the BCSI maps (Figure 5) show that resilience is unevenly distributed. The lower Syr Darya floodplain and former Aral Sea margins in the Kyzylorda region remain the most sensitive territories [28], with extensive areas in the High and Very High BCSI classes. This finding aligns with Hao et al. [14], who identified vegetation browning hotspots concentrated in the central Aral-Caspian basin. Elevated BCSI values along the desert margins of the Turkistan region and around the Shymkent agglomeration are also consistent with documented anthropogenic pressures in the area, including municipal solid waste accumulation [16], which serve as additional ecological stressors alongside climatic drivers. By contrast, the mountainous southeastern sector of the Almaty region (Northern Tien Shan) is the most resilient zone of the entire study area, supported by orographic moisture availability and high topographic complexity. This bimodal pattern within Almaty—Very Low BCSI in the mountains, Moderate in the lowlands—is the strongest within-region contrast we observed and underscores the importance of sub-regional resolution in conservation planning. The robustness of these spatial patterns to alternative BCSI weighting schemes (Section 3.3) strengthens confidence in their use for priority-setting.
An important diagnostic property of the BCSI emerges from the relationship between Table 2 and the BCSI maps: regions with high vegetation volatility (CV) in Table 2 consistently receive higher BCSI scores, supporting the inclusion of CV (X4) as a proxy for ecosystem vulnerability. Kyzylorda, with the highest CV (2.38%) and the lowest mean cover (4.7%), falls into the High/Very High BCSI cluster; Almaty, with the lowest CV (2.05%) and the highest mean cover (30.5%), falls into the Very Low BCSI cluster.
4.4. Comparison with Recent Regional Studies
Our findings broadly align with the most recent regional assessments while providing a region-resolved perspective. Tokbergenova et al. [15] reported similar climate–vegetation responses in Kazakhstan’s pasture ecosystems over a comparable period, with mountain pastures maintaining higher and more stable productivity than steppe and desert pastures. Zhao et al. [13] documented persistent grassland degradation in parts of Central Asia driven by combined climatic and grazing pressures, but their analysis pooled administrative units and could not resolve the contrast between resilient mountain belts and vulnerable lowland margins that our BCSI mapping reveals. Hao et al. 14] emphasized the high sensitivity of Central Asian vegetation to water deficit, consistent with the 2018–2020 drought signal in our Figure 4c and with the per-region drought response in Table 2 (strongest in arid lowlands). The unique contribution of this study is integrating these strands into a single composite index (BCSI) at the operational scale of administrative regions.
The trends identified in Southern Kazakhstan are broadly comparable to vegetation dynamics reported for other arid and semi-arid regions worldwide. Similar patterns of partial greening combined with high climatic sensitivity have been documented in northwestern China, particularly within the Xinjiang and Inner Mongolia drylands, where NDVI increases have been associated with irrigation expansion, ecological restoration programs, and CO2 fertilization effects. At the same time, these regions remain highly vulnerable to prolonged droughts and increasing evapotranspiration under climate warming.
Comparable processes have also been reported in the arid regions of Uzbekistan and Turkmenistan within the Aral Sea basin, where localized greening in irrigated landscapes coexists with severe degradation in desert-margin ecosystems. In the Middle East and North Africa (MENA) region, studies from Iran and northern Saudi Arabia similarly demonstrate strong spatial heterogeneity in vegetation responses, with mountain and foothill ecosystems exhibiting greater resilience than lowland deserts due to higher moisture availability and topographic buffering.
The drought sensitivity observed in Southern Kazakhstan during 2018–2020 is also consistent with findings from the southwestern United States and Australian drylands, where episodic precipitation deficits produce rapid declines in vegetation productivity followed by partial recovery during wetter years. These international comparisons suggest that the vegetation dynamics identified in Southern Kazakhstan represent part of a broader global pattern characteristic of arid ecosystems undergoing climatic and anthropogenic transformation.
4.5. Limitations and Future Work
Several limitations should be acknowledged. First, the NDVI analysis relies on Landsat composites for four discrete epochs (2010, 2015, 2020, and 2025); this five-yearly sampling captures decadal-scale change but is statistically underpowered for definitive trend detection (n = 4 temporal observations per region and n = 20 at the regional-comparative level; no per-region OLS slope reaches p < 0.05). A continuous annual time series, ideally implemented in Google Earth Engine using the full Landsat 5/7/8/9 archive, would substantially strengthen the trend assessment and is the highest-priority extension of this work.
Second, the NDVI threshold of >0.4 used to delineate dense vegetation is a conservative choice appropriate for Central Asian drylands but may underestimate productivity in sparse pastures and semi-deserts; a continuous-NDVI metric (e.g., growing-season-integrated NDVI) would provide a more nuanced productivity signal.
Third, the biodiversity component of the BCSI (X4) is currently operationalized using the coefficient of variation of dense-vegetation cover, a remote-sensing proxy for ecosystem vulnerability rather than a direct measure of species-level diversity. Direct integration of species richness (S) and Shannon diversity (H) data—for example, from the Kazakhstan National Biodiversity Information System, the Republic Red Data Book of Kazakhstan, or open platforms such as GBIF—is identified as a priority for future iterations of the index.
Fourth, the analysis does not explicitly disentangle climatic drivers from anthropogenic pressures, such as grazing intensity, irrigation withdrawal, and land-use change, all of which strongly influence vegetation dynamics in Southern Kazakhstan. Recent regional assessments document substantial pollution loads from municipal solid waste in the Shymkent–Turkistan agglomeration [16]. Integrating such anthropogenic-pressure layers is an additional priority. Decomposing greening pixels using a global irrigated-cropland mask, such as GFSAD30 [31], would directly quantify the management contribution to the observed signal.
Finally, the BCSI relies on equal weights as a defensible default; sensitivity analyses with three alternative weighting schemes (Section 3.3) confirmed that the spatial pattern of Very High and Very Low classes is preserved, but quantitative BCSI values shift modestly. Formal weight derivation through expert elicitation (e.g., the Analytic Hierarchy Process) would further strengthen the index but is reserved for future versions that also integrate species-level biodiversity data. These limitations define priority directions for future research and should be considered when transferring the proposed framework to other arid and semi-arid regions.
5. Conclusions
This study presents an integrated, regionally resolved assessment of climate–vegetation interactions in the ecosystems of Southern Kazakhstan from 2010 to 2025, combining open-access climate data from Kazhydromet, multi-temporal Landsat NDVI imagery harmonized across sensors, and a composite Biodiversity–Climate Sensitivity Index (BCSI). Three findings are central.
First, the multi-temporal NDVI analysis reveals ecosystem-specific patterns. Mountain ecosystems in the Almaty and Zhetysu regions had the highest dense-vegetation cover (means of 30.54% and 26.27%, respectively) and the lowest inter-epoch volatility (CV ≈ 2.0%). Steppe and foothill landscapes in Zhambyl and Turkistan exhibited moderate but stable coverage. Arid ecosystems in Kyzylorda, despite the lowest absolute vegetation cover (4.66%), showed unexpected stability with no statistically significant decline. The 2020 drought response was strongest in arid lowlands (−2.0 to −2.5%) and weakest in mountains (−0.8%), and the 2020–2025 recovery followed the same gradient.
Second, the cumulative dense-vegetation area in Southern Kazakhstan increased from 9.092 Mha in 2010 to 9.602 Mha in 2025—a net change of +5.6% over 15 years—with a transient minimum of 9.385 Mha in 2020. Every administrative region recorded a positive net change, ranging from +0.29 percentage points in Kyzylorda to +1.63 pp in Almaty. Importantly, none of the per-region OLS trends are statistically significant at p < 0.05 under the four-epoch sampling design; the observed direction of change is therefore consistent with regional resilience but should not yet be interpreted as conclusive evidence of a sustained greening trajectory. Confirmation through a continuous annual time series is identified as the highest-priority extension of this work.
Third, the BCSI synthesizes climatic and vegetation indicators into a comprehensive decision-support tool, effectively addressing spatial sensitivity within the operational context of administrative regions. The lower Syr Darya floodplain and former Aral Sea margins in Kyzylorda stand out as the most vulnerable areas in Southern Kazakhstan, highlighting the need for targeted adaptive management. Conversely, the mountainous Northern Tien Shan region around Almaty demonstrates resilience, suggesting the importance of preserving its existing ecological conditions. The consistency of these priority classifications across various BCSI weighting schemes underscores their practical relevance for conservation policymaking. Moreover, the framework’s reliance on open-access data ensures its reproducibility and adaptability to other arid and semi-arid regions facing similar climate challenges. This approach supports evidence-based environmental management aligned with Sustainable Development Goals 13 (Climate Action) and 15 (Life on Land), as well as Kazakhstan’s national climate strategies.
The comparative analysis with other arid and semi-arid regions worldwide further demonstrates that Southern Kazakhstan follows broader global trends of climate-driven vegetation transformation, including simultaneous processes of localized greening, drought-induced instability, and increasing ecosystem heterogeneity under warming conditions.
Author Contributions
Conceptualization, A.A. (Aisulu Abduova) and A.A. (Arailym Askerbekova); methodology, A.A. (Aisulu Abduova) and G.K.; software, A.A. (Aisulu Abduova); validation, E.K., A.Y. and A.A. (Arailym Askerbekova); formal analysis, E.K. and A.Y.; investigation, G.B. and A.S.; resources, G.B. and A.S.; data curation, G.K. and A.Y.; writing—original draft preparation, A.A. (Aisulu Abduova) and A.S.; writing—review and editing, A.T.; visualization, G.B. and A.K.; supervision, N.Z. and A.K., A.T.; project administration, G.K. and N.Z.; funding acquisition, N.Z. All authors have read and agreed to the published version of the manuscript.
Funding
This research was funded by the Science Committee of the Ministry of Education and Science of the Republic of Kazakhstan, Grant No. AP23484853.
Data Availability Statement
The data presented in this study are available upon request from the corresponding authors.
Conflicts of Interest
The authors declare no conflicts of interest.
Abbreviations
The following abbreviations are used in this manuscript:
| BCSI | Composite Biodiversity–Climate Sensitivity Index |
| CFMask | C Function of Mask (Landsat cloud-mask algorithm) |
| CV | Coefficient of variation |
| GIS | Geographic Information System |
| H′ | Shannon diversity index |
| IPBES | Intergovernmental Science-Policy Platform on Biodiversity and Ecosystem Services |
| IPCC | Intergovernmental Panel on Climate Change |
| Mha | Million hectares |
| MSW | Municipal solid waste |
| NDVI | Normalized Difference Vegetation Index |
| OLI | Operational Land Imager (Landsat 8 sensor) |
| OLS | Ordinary Least Squares (regression) |
| Pb–Zn | Lead–Zinc |
| pp | Percentage points |
| S | Species richness |
| SDG | Sustainable Development Goal |
| TM | Thematic Mapper (Landsat 5 sensor) |
| USGS | United States Geological Survey |
| UTM | Universal Transverse Mercator |
| WGS | World Geodetic System |
References
- Maestre, F.T.; Eldridge, D.J.; Soliveres, S.; Kéfi, S.; Delgado-Baquerizo, M.; Bowker, M.A.; García-Palacios, P.; Gaitán, J.; Gallardo, A.; Lázaro, R.; et al. Structure and Functioning of Dryland Ecosystems in a Changing World. Annu. Rev. Ecol. Evol. Syst. 2016, 47, 215–237. [Google Scholar] [CrossRef] [Scilit]
- Calvin, K.; Dasgupta, D.; Krinner, G.; Mukherji, A.; Thorne, P.W.; Trisos, C.; Romero, J.; Aldunce, P.; Barrett, K.; Blanco, G.; et al. IPCC, 2023: Climate Change 2023: Synthesis Report. Contribution of Working Groups I, II and III to the Sixth Assessment Report of the Intergovernmental Panel on Climate Change; Lee, H., Romero, J., Arias, P., Bustamante, M., Elgizouli, I., Flato, G., Howden, M., Méndez-Vallejo, C., Pereira, J.J., Pichs-Madruga, R., et al., Eds.; Intergovernmental Panel on Climate Change (IPCC): Geneva, Switzerland, 2023. [Google Scholar]
- Intergovernmental Science-Policy Platform on Biodiversity and Ecosystem Services (IPBES). Global Assessment Report on Biodiversity and Ecosystem Services of the Intergovernmental Science-Policy Platform on Biodiversity and Ecosystem Services; Brondizio, E., Diaz, S., Settele, J., Ngo, H.T., Eds.; Zenodo: Geneva, Switzerland, 2019. [Google Scholar]
- Parmesan, C.; Yohe, G. A Globally Coherent Fingerprint of Climate Change Impacts across Natural Systems. Nature 2003, 421, 37–42. [Google Scholar] [CrossRef] [Scilit] [PubMed]
- Intergovernmental Panel on Climate Change (IPCC). Climate Change 2022—Impacts, Adaptation and Vulnerability: Working Group II Contribution to the Sixth Assessment Report of the Intergovernmental Panel on Climate Change, 1st ed.; Cambridge University Press: Cambridge, UK, 2023; ISBN 978-1-009-32584-4. [Google Scholar]
- Root, T.L.; Price, J.T.; Hall, K.R.; Schneider, S.H.; Rosenzweig, C.; Pounds, J.A. Fingerprints of Global Warming on Wild Animals and Plants. Nature 2003, 421, 57–60. [Google Scholar] [CrossRef] [Scilit]
- Bellard, C.; Bertelsmeier, C.; Leadley, P.; Thuiller, W.; Courchamp, F. Impacts of Climate Change on the Future of Biodiversity. Ecol. Lett. 2012, 15, 365–377. [Google Scholar] [CrossRef] [Scilit] [PubMed]
- Pecl, G.T.; Araújo, M.B.; Bell, J.D.; Blanchard, J.; Bonebrake, T.C.; Chen, I.-C.; Clark, T.D.; Colwell, R.K.; Danielsen, F.; Evengård, B.; et al. Biodiversity Redistribution under Climate Change: Impacts on Ecosystems and Human Well-Being. Science 2017, 355, eaai9214. [Google Scholar] [CrossRef] [Scilit]
- Allen, C.D.; Macalady, A.K.; Chenchouni, H.; Bachelet, D.; McDowell, N.; Vennetier, M.; Kitzberger, T.; Rigling, A.; Breshears, D.D.; Hogg, E.T.; et al. A Global Overview of Drought and Heat-Induced Tree Mortality Reveals Emerging Climate Change Risks for Forests. For. Ecol. Manag. 2010, 259, 660–684. [Google Scholar] [CrossRef] [Scilit]
- Smith, W.K.; Dannenberg, M.P.; Yan, D.; Herrmann, S.; Barnes, M.L.; Barron-Gafford, G.A.; Biederman, J.A.; Ferrenberg, S.; Fox, A.M.; Hudson, A.; et al. Remote Sensing of Dryland Ecosystem Structure and Function: Progress, Challenges, and Opportunities. Remote Sens. Environ. 2019, 233, 111401. [Google Scholar] [CrossRef] [Scilit]
- National Hydrometeorological Service. Kazhydromet Annual Climate Bulletin of Kazakhstan; National Hydrometeorological Service: Astana, Kazakhstan, 2024.
- Xu, H.; Wang, X.; Zhang, X. Decreased Vegetation Growth in Response to Summer Drought in Central Asia from 2000 to 2012. Int. J. Appl. Earth Obs. Geoinf. 2016, 52, 390–402. [Google Scholar] [CrossRef] [Scilit]
- Zhao, Y.; Wang, J.; Zhang, G.; Liu, L.; Yang, J.; Wu, X.; Biradar, C.; Dong, J.; Xiao, X. Divergent Trends in Grassland Degradation and Desertification under Land Use and Climate Change in Central Asia from 2000 to 2020. Ecol. Indic. 2023, 154, 110737. [Google Scholar] [CrossRef] [Scilit]
- Hao, H.; Chen, Y.; Xu, J.; Li, Z.; Li, Y.; Kayumba, P.M. Water Deficit May Cause Vegetation Browning in Central Asia. Remote Sens. 2022, 14, 2574. [Google Scholar] [CrossRef] [Scilit]
- Tokbergenova, A.; Kaliyeva, D.; Zulpykharov, K.; Taukebayev, O.; Salmurzauly, R.; Assanbayeva, A.; Mukhtarov, U.; Bilalov, B.; Tokkozhayev, D. Spatiotemporal Assessment of Climate Change Impacts on Pasture Ecosystems in Central Kazakhstan Using Remote Sensing and Spatial Analysis. Sustainability 2025, 17, 10331. [Google Scholar] [CrossRef] [Scilit]
- Aitimbetova, A.; Pernebayev, Z. Municipal Solid Waste in Shymkent: Environmental Impact and Management Approaches. Sustainability 2026, 18, 2745. [Google Scholar] [CrossRef] [Scilit]
- Reyers, B.; Stafford-Smith, M.; Erb, K.-H.; Scholes, R.J.; Selomane, O. Essential Variables Help to Focus Sustainable Development Goals Monitoring. Curr. Opin. Environ. Sustain. 2017, 26–27, 97–105. [Google Scholar] [CrossRef] [Scilit]
- Dawson, T.P.; Jackson, S.T.; House, J.I.; Prentice, I.C.; Mace, G.M. Beyond Predictions: Biodiversity Conservation in a Changing Climate. Science 2011, 332, 53–58. [Google Scholar] [CrossRef] [Scilit] [PubMed]
- Wilks, D.S. Statistical Methods in the Atmospheric Sciences: An Introduction, 4th ed.; Elsevier: Amsterdam, The Netherlands, 2019; ISBN 978-0-12-816527-0. [Google Scholar]
- Mann, H.B. Nonparametric Tests Against Trend. Econometrica 1945, 13, 245. [Google Scholar] [CrossRef] [Scilit]
- Sen, P.K. Estimates of the Regression Coefficient Based on Kendall’s Tau. J. Am. Stat. Assoc. 1968, 63, 1379–1389. [Google Scholar] [CrossRef]
- Tucker, C.J. Red and Photographic Infrared Linear Combinations for Monitoring Vegetation. Remote Sens. Environ. 1979, 8, 127–150. [Google Scholar] [CrossRef] [Scilit]
- Pettorelli, N.; Vik, J.O.; Mysterud, A.; Gaillard, J.-M.; Tucker, C.J.; Stenseth, N.C. Using the Satellite-Derived NDVI to Assess Ecological Responses to Environmental Change. Trends Ecol. Evol. 2005, 20, 503–510. [Google Scholar] [CrossRef] [Scilit]
- Roy, D.P.; Kovalskyy, V.; Zhang, H.K.; Vermote, E.F.; Yan, L.; Kumar, S.S.; Egorov, A. Characterization of Landsat-7 to Landsat-8 Reflective Wavelength and Normalized Difference Vegetation Index Continuity. Remote Sens. Environ. 2016, 185, 57–70. [Google Scholar] [CrossRef] [Scilit] [PubMed]
- Saisana, M.; Saltelli, A.; Tarantola, S. Uncertainty and Sensitivity Analysis Techniques as Tools for the Quality Assessment of Composite Indicators. J. R. Stat. Soc. Ser. A Stat. Soc. 2005, 168, 307–323. [Google Scholar] [CrossRef] [Scilit]
- OECD; European Union; Joint Research Centre—European Commission. Handbook on Constructing Composite Indicators: Methodology and User Guide; OECD: Paris, France, 2008; ISBN 978-92-64-04345-9. [Google Scholar]
- Wang, Z.; Wu, J.; Li, M.; Cao, Y.; Tilahun, M.; Chen, B. The Variability in Sensitivity of Vegetation Greenness to Climate Change across Eurasia. Ecol. Indic. 2024, 163, 112140. [Google Scholar] [CrossRef] [Scilit]
- Micklin, P. The Aral Sea Disaster. Annu. Rev. Earth Planet. Sci. 2007, 35, 47–72. [Google Scholar] [CrossRef] [Scilit]
- Donohue, R.J.; Roderick, M.L.; McVicar, T.R.; Farquhar, G.D. Impact of CO2 Fertilization on Maximum Foliage Cover across the Globe’s Warm, Arid Environments. Geophys. Res. Lett. 2013, 40, 3031–3035. [Google Scholar] [CrossRef] [Scilit]
- Kerven, C.; Robinson, S.; Behnke, R.; Kushenov, K.; Milner-Gulland, E.J. A Pastoral Frontier: From Chaos to Capitalism and the Re-Colonisation of the Kazakh Rangelands. J. Arid Environ. 2016, 127, 106–119. [Google Scholar] [CrossRef] [Scilit]
- Teluguntla, P.; Thenkabail, P.S.; Oliphant, A.; Xiong, J.; Gumma, M.K.; Congalton, R.G.; Yadav, K.; Huete, A. A 30-m Landsat-Derived Cropland Extent Product of Australia and China Using Random Forest Machine Learning Algorithm on Google Earth Engine Cloud Computing Platform. ISPRS J. Photogramm. Remote Sens. 2018, 144, 325–340. [Google Scholar] [CrossRef] [Scilit]

Disclaimer/Publisher’s Note: The statements, opinions and data contained in all publications are solely those of the individual author(s) and contributor(s) and not of MDPI and/or the editor(s). MDPI and/or the editor(s) disclaim responsibility for any injury to people or property resulting from any ideas, methods, instructions or products referred to in the content. |
© 2026 by the authors. Licensee MDPI, Basel, Switzerland. This article is an open access article distributed under the terms and conditions of the Creative Commons Attribution (CC BY) license.