


Abstract
Whether the leaf economics spectrum (LES) and its trait correlations operate at the intraspecific level, and how light versus soil nutrients are associated with leaf traits, remain unclear in stress-tolerant island plants. We quantified leaf morphological, anatomical, and LES traits of Eurya emarginata across four island populations and evaluated their associations with field-measured light availability (canopy density) and soil conditions; a shading experiment was used to test light-driven plasticity directly. Across field populations, leaf anatomical traits showed greater variability than LES traits (Kruskal–Wallis, p = 0.001). Most leaf trait pairs were correlated at the metapopulation level, whereas within local island populations many of these correlations became non-significant; this pattern may reflect smaller sample sizes and narrower trait ranges within islands as well as possible biological decoupling. Redundancy analysis indicated that canopy density was the main variable associated with leaf morphological and anatomical trait variation, whereas soil nutrients were the main variables associated with LES trait variation. The shading experiment confirmed that reduced light availability altered structural and photosynthetic traits. Our results show that light and soil conditions are associated with different trait groups, and that trait associations are scale-dependent. We conclude that intraspecific leaf trait variation in island populations is context-dependent, with anatomical traits varying more than LES traits, and that trait correlations observed at broad scales are not necessarily maintained within local populations.
1. Introduction
Plant functional traits (PFTs) are measurable morphological, physiological, and phenological characteristics that mediate how plants respond to and influence their environment [1]. Because they link individual performance to growth, reproduction, and survival, PFTs underpin many ecosystem functions [2,3,4,5,6]. Interest in PFTs has grown with accelerating global change, especially for plants coping with extreme or unstable environments [7,8,9,10]. Among PFTs, leaf traits are particularly informative because leaves are the primary interface between a plant and its surroundings, governing resource uptake and adaptive strategy [7,11,12]. Across broad geographic scales, climate gradients—above all temperature and moisture—organize the distribution of leaf traits into consistent patterns [13,14]. For example, leaf nitrogen and phosphorus concentrations and their stoichiometry vary predictably along these gradients and have been interpreted as distinct adaptive strategies through physiological and biogeochemical lenses [15]. Within communities, such climate-driven trends are further shaped by habitat filtering, which produces trait overlap and complementarity among coexisting species [16]. However, trait distribution patterns at spatial and community scales are not equivalent to intrinsic trait coordination; explaining why leaf traits assemble and differentiate along particular axes requires an integrative framework that explicitly characterizes trait trade-offs.
The leaf economics spectrum (LES) is a central framework in plant ecology that orders species along an axis from fast resource acquisition to slow resource conservation [17,18]. The spectrum arises from coordinated trade-offs among leaf traits: fast-return leaves combine high specific leaf area (SLA), high nutrient concentrations, and high photosynthetic rates with short lifespans, whereas slow-return leaves have low SLA, dense tissues, and greater durability [19,20]. Although the LES was developed to explain among-species differences, its expression and drivers within species—termed intraspecific trait variation (ITV)—are essential for understanding local adaptation, population resilience, and community assembly [21,22,23]. ITV is especially marked in heterogeneous environments, where both phenotypic plasticity and heritable genetic variation allow populations to match their phenotypes to local conditions [23,24,25,26].
Islands provide a natural setting for studying such variation because they combine pronounced biogeographic isolation with steep environmental gradients in, for example, light (through canopy structure) and soil nutrients [27,28]. Island plants commonly face high temperature, drought, salinity, and nutrient-poor soils [27,29,30], and they often adopt resource-conservative strategies expressed as thicker leaves with well-developed palisade tissue, reduced SLA, and high leaf dry matter content (LDMC) [31,32]. Nevertheless, little is known about leaf trait variation within a single dominant island species across its local microhabitats, and about whether the tight trait correlations predicted by the interspecific LES persist or weaken within species under strong environmental stress [33,34,35].
Eurya emarginata (Thunb.) Makino is a stress-tolerant evergreen shrub endemic to the coastal islands of Southeast China. It forms monodominant stands on rocky islands where canopy cover and soil conditions vary markedly and where plants experience strong winds, drought, and saline–alkaline stress, making it a compelling model for studying ITV and trait integration under natural stress [36,37]. Using its leaf traits—spanning morphological, anatomical, and LES traits—we tested an integrated hypothesis: along insular environmental gradients, light availability is associated mainly with structural and anatomical traits, whereas soil nutrients are associated mainly with LES traits; moreover, trait correlations that are significant at the metapopulation level are not necessarily maintained within local island populations, and anatomical traits show higher variability than LES traits. A controlled shading experiment was then used to test whether the light-related associations reflect phenotypic plasticity.
By testing this integrated hypothesis, this study aims to clarify how a key theoretical framework operates at the intraspecific level in a non-model, stress-tolerant plant, and how environmental gradients shape both the expression and the architecture of functional trait relationships.
2. Methods and Materials
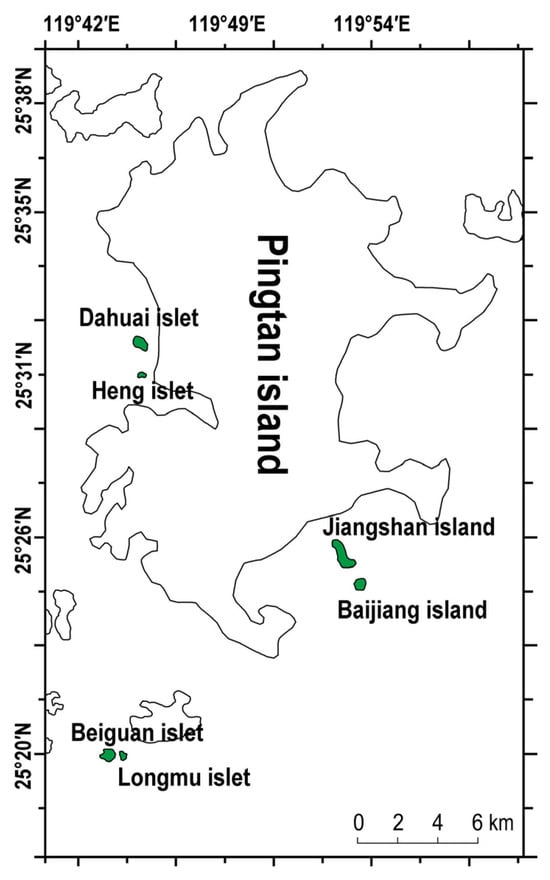
This study was carried out in Haitan Island (Pingtan Island), located off the southeastern coast of Fujian Province, China (25°15′–25°45′ N, 119°32′–120°10′ E; Figure 1). Situated within the wind corridor of the Taiwan Strait, the island experiences the rain shadow effect from Taiwan, characterized by strong winds, low and highly variable precipitation, and frequent occurrences of wind, drought and tidal disasters. The mean annual temperature, precipitation and evaporation are 19.6 °C, 1172 mm and 1300 mm, respectively.
Figure 1.
Distribution of 4 islands in this study area, Pingtan, China. The green areas in the image indicate the locations and sizes of the islands.
2.1. Vegetation Survey and Sampling Collection
A vegetation survey of six uninhabited islands surrounding Pingtan Island was conducted in 2020–2024. Natural forest of Eurya emarginata (Thunb.) Makino were identified on only four islands: Longmu Islet (LMY; E 119°41′51.659″, N 25°20′49.013″), Beiguan Islet (BGY; E 119°41′29.670″, N 25°20′48.224″), Dahuai Islet (DHY; E119°42′34.128″, N 25°32′34.242″) and Jiangshan Island (JSD; E 119°48′28.055″, N 25°26′18.766″) (Figure 1). Leaf samples of E. emarginata were subsequently collected from these four islands for anatomical analysis (Table 1) and common garden. It was identified by Professor Chuanyuan Deng (Fujian Agriculture and Forestry University). Voucher specimens were deposited in Yangcheng Teachers University, Yancheng, Jiangsu Province, China (Voucher Code: YE-2020-1-3; YE-2023-1-3).
Table 1.
Characteristics of the surveyed islands.
2.2. Experimental Design
Twenty-four plots (20 m × 20 m; six plots per island) were established. For each plot we recorded GPS coordinates, elevation, slope gradient, aspect, slope position, and canopy density (measured with a portable light meter). Within each plot, five mature E. emarginata individuals were selected (one near each of the four corners and one in the centre), and leaf samples were collected from the four cardinal directions of each plant. For statistical analyses, individual leaf values were averaged to obtain a single plant-level value for each trait, and plant-level values as one data set to obtain plot-level means; plot-level values (n = 30 per island) were used as the unit of replication in comparisons among islands and in correlation analyses, unless otherwise stated.
Leaf sampling and processing. Mature, fully expanded, undamaged leaves without petioles were collected. Small segments (~2.0 × 10.0 mm) excised from the mid-section of the leaf for anatomical observation were immediately immersed in medical vials containing 2.5% glutaraldehyde solution and processed by paraffin sectioning; the remaining leaf material was used for functional trait measurements. Vacuum infiltration was applied to ensure complete submersion of all samples, and vials were placed on ice packs (4 °C) for transport to the laboratory, with towels used as insulation to prevent direct contact between samples and ice. In total, 120 plants were sampled (24 plots × 5 plants; 6 plots × 5 plants per island), with multiple leaves collected from the four cardinal directions of each plant and pooled per plant before measurement.
2.3. Leaf Trait Measurements
(1) Leaf morphological and leaf economics spectrum (LES) traits
In each plot, five mature E. emarginata plants were selected at the four corners and the center, and samples were collected from each plant in the four cardinal directions (east, south, west, and north). Ten leaves were collected from each plant and packaged; a total of five samples were collected per plot. With six plots per island, 6 × 5 leaf samples were collected per island. Sampling was completed on four islands, and a total of 4 × 30 samples were collected.
Leaf morphological traits (LMTs): leaf length (LL), leaf width (LW), leaf shape index (LI), leaf thickness (LT), leaf perimeter (LP), leaf area (LA), leaf density (LD), leaf volume (LV), specific leaf weight (SLW), leaf water content (LWC), relative water deficit (RWD) (Table 2).
Table 2.
Measurements of leaf morphological traits.
LES traits: specific leaf area (SLA), leaf dry matter content (LDMC), leaf total carbon (L-TC), leaf total nitrogen (L-TN), leaf total phosphorus (L-TP), and leaf carbon-to-nitrogen ratio (C:N) (Table 2).
Leaf thickness was measured with a digital calliper (0.01 mm precision) at three points along the midvein (upper, middle, and lower) and averaged. Leaf fresh mass (LFM) was determined with a precision balance (0.001 g). Leaves were then soaked in darkness at 5 °C for 12 h, blotted dry, and weighed to obtain turgid mass. Leaves were scanned (CanoScan LiDE300, Canon Inc., Tokyo, Japan) and analyzed with ImageJ v2.14.0 to determine leaf length, width, shape index, perimeter, and area. After oven-drying at 85 °C for 48 h to constant mass, dry weight was recorded. Leaf C and N concentrations were quantified with a C–N elemental analyser (Vario EL III, Elementar, Langenselbold, Germany), and leaf P concentration was determined by the molybdenum–antimony anti-colorimetric method.
(2) Leaf anatomical traits (LATs)
Ten leaves were collected from each E. emarginata plant and packaged; a total of five samples were collected per plot. With six plots per island, 6 × 5 E. emarginata leaf samples were collected per island. Sampling was completed on four islands, and a total of 4 × 30 samples were collected. The collected samples were quickly placed into medical vials containing 2.5% glutaraldehyde solution, and vacuum evacuation was used to make all leaf samples sink completely. They were then placed with 4 °C ice packs and transported back to the laboratory. The samples must not come into direct contact with the ice; towels should be placed between them for separation. Subsequently, the samples were processed into sections using the paraffin sectioning method. LATs were obtained from paraffin sections: lower wax layer thickness (LWL, µm), lower cuticle thickness (LC, µm), upper wax layer thickness (UWL, µm), spongy tissue thickness (ST, µm), palisade tissue thickness (PT, µm), palisade-to-spongy ratio (PT/ST), leaf thickness (LT, µm), upper epidermis thickness (UEC, µm), ratio of spongy tissue thickness to leaf thickness (SR), upper cuticle thickness (UC, µm), lower epidermis thickness (LEC, µm), and leaf compactness (CTR). Derived indices were calculated as shown in Table 3.
Table 3.
Measurements of leaf anatomical traits.
2.4. Environmental Factor Determination
At each plot we recorded latitude, longitude, elevation (E), slope (S), aspect (AS), and slope position (SP); canopy density (CD) was measured with a portable light meter. Soil samples were collected by the five-point method: five cores (25 cm depth) were taken per plot, homogenised, placed in labelled zip-lock bags, and transported to the laboratory. Soil pH was measured potentiometrically with a glass electrode in a 1:2.5 soil-to-water suspension. Soil organic matter (SOM) and total nitrogen (TN) were determined by dry combustion (Vario EL, Elementar, Langenselbold, Germany). Total phosphorus (TP) was measured with a continuous-flow analyser after H2SO4–HClO4 digestion, and total potassium (TK) by flame emission spectroscopy following digestion [33,34,35]. Alkaline hydrolysable nitrogen (AN) was determined by alkaline hydrolysis–diffusion followed by acid titration; available phosphorus (AP) was extracted with 0.500 mol L−1 NaHCO3 and measured colorimetrically (molybdenum antimony blue), and available potassium (AK) was extracted with 1.00 mol L−1 NH4OAc and measured by flame emission spectroscopy [43,44,45]. Total soil water-soluble salt (TS) was determined following Wilke (2005) [46]. Soil water content (SWC) was measured by time-domain reflectometry using a HydroSense II probe (Campbell Scientific, Inc., Logan, UT, USA). Each soil variable was measured in five replicates.
2.5. Cluster Analysis
To explore how leaf anatomical trait variation among populations relates to their light environment, nine leaf anatomical traits (LATs) of E. emarginata (UWL, UC, UEC, PT, ST, LEC, LC, LWL, and LT) were standardised using Z-scores and clustered by Euclidean distance in relation to canopy density.
2.6. Common Garden Experiment
The common garden experiment used five-year-old healthy trees of uniform size, vigorous growth, and replicate clones (Pingtan Island, Fujian Province; mean height 75 cm, mean basal diameter 21.8 mm). Trees were transplanted in late March 2023 and allowed to establish under natural conditions for three months. From June to October 2023, shading was applied with black shade nets. The shading structures, oriented north–south and 2.0 m tall, fully covered the seedling beds to the ground, with the northern and southern sides left open for ventilation. Five shading levels were applied: full light (L0) and 70% (L1), 50% (L2), 30% (L3), and 10% (L4) transmittance. A single-factor completely randomized block design with three replicate blocks per treatment was adopted; each block was an independent shading structure containing several plants, so the three replicates represent independent groups of plants rather than repeated measurements, and the block was treated as the experimental unit. Adjacent treatments were separated by 1.5 m buffers to avoid overlapping shade, and standard management was applied uniformly across treatments. Because the shading treatment lasted about four months, the results reflect short-term plastic responses rather than long-term acclimation.
Linear regression was used to assess the contribution of shading to the variation in leaf functional traits, with the coefficient of determination (R2) used to gauge the strength of each relationship [47]; larger R2 values indicate a stronger influence of shading on a given trait. Model residuals were checked for normality and homogeneity of variance, and all reported models met these assumptions. Analyses were performed in R 4.2.2 (R Development Core Team, 2022).
2.7. Relationship Between Functional Traits and the Environment
We compiled a functional trait dataset for E. emarginata from the four islands (Longmu Islet, Beiguan Island, Jiangshan Island, and Dahuai Islet), including the maximum, minimum, median, and mean for each trait. Trait variability was summarized with the coefficient of variation (CV). Plot-level intraspecific variation was quantified separately for each trait using Pearson’s coefficient of variation (PCV) [48], computed as the within- and among-group standard deviation divided by the overall mean within the analysis-of-variance framework [37].
Leaf trait variation was further quantified using the plasticity index (PI = (Maximum value − Minimum value)/Maximum value) [38] and the coefficient of variation (CV), applied to morphological, anatomical, and stoichiometric traits. Because these field-derived indices integrate both environmental and genetic influences, we refer to them as measures of trait variation; the term ‘phenotypic plasticity’ is reserved for responses measured in the controlled shading experiment [49,50]. The Kruskal–Wallis H test was used to compare CV values among the three trait categories. Because Q–Q plots and the Shapiro–Wilk test indicated non-normal distributions and Levene’s test indicated heterogeneous variances, the non-parametric Kruskal–Wallis test was used.
The association between each soil factor and each trait category (LMTs, LATs, and LES traits) was examined with linear regression; predictors were retained and reported according to their standardized effect sizes and statistical support. Model residuals were checked for normality and homogeneity of variance before interpretation.
2.8. Statistical Analysis
Data were compiled in Microsoft Excel 2023. Normality and homogeneity of variance were assessed before analysis; where these assumptions were violated, non-parametric tests or variance-stabilizing transformations were used. Correlation analysis, one-way ANOVA, and cluster analysis were performed in SPSS 25.0 and R 4.2.2 (R Development Core Team, 2022). Redundancy analysis (RDA) and its ordination plots were produced in Canoco for Windows 5.0. Before RDA, collinearity among environmental predictors was assessed using variance inflation factors, and the significance of each RDA axis and of individual environmental terms was tested with Monte Carlo permutation tests (999 permutations). For correlation analyses, we report sample sizes (n = 6 plots per island; n = 24 plots at the metapopulation level) together with p values and, where relevant, effect sizes (correlation coefficients) and their 95% confidence intervals; non-significant within-island correlations are interpreted cautiously because these analyses have lower statistical power.
3. Results
3.1. LATs Show Greater Variability than LES Traits Across Insular Environmental Gradients
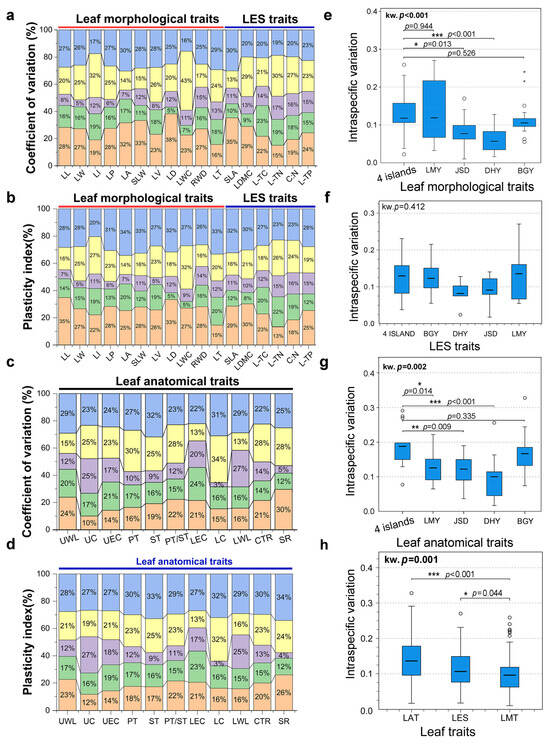
Leaf traits, particularly leaf thickness (LT), varied across the four islands and within the species (Supplementary Figure S1). Metapopulation-level trait variation generally exceeded that at the local population level, except for LES traits (Figure 2a–g). A Kruskal–Wallis H test comparing LATs, leaf morphological traits (LMTs), and LES traits yielded median CV values of 0.1385 (s.d. = 0.0643), 0.0853 (s.d. = 0.0656), and 0.1218 (s.d. = 0.0379), with mean ranks of 89.86, 59.81, and 80.87, respectively (p = 0.001). Thus, LATs show markedly higher trait variability than LMTs and LES traits across the studied environmental gradients, whereas LES traits remain relatively conservative (Figure 2h).
Figure 2.
Variability of local population and metapopulation leaf traits at the intraspecific level across four islands. (a,b) Coefficient of variation and plasticity index of LMTs and LES traits, respectively. (c,d) Coefficient of variation and plasticity index of LATs. (e) Variation in LMTs across the four islands (Kruskal–Wallis H test, p < 0.001). (f) Variation in LES traits across the four islands (Kruskal–Wallis H test, p = 0.412). (g) Variation in LATs across the four islands (Kruskal–Wallis H test, p = 0.001). (h) Kruskal–Wallis H test comparing variability among LMTs, LATs, and LES traits. Differences among islands were tested using one-way analysis. *, p < 0.05; **, p < 0.01; ***, p < 0.001.
3.2. Metapopulation-Level Leaf Trait Correlations Are Not Consistently Maintained Within Local Island Populations
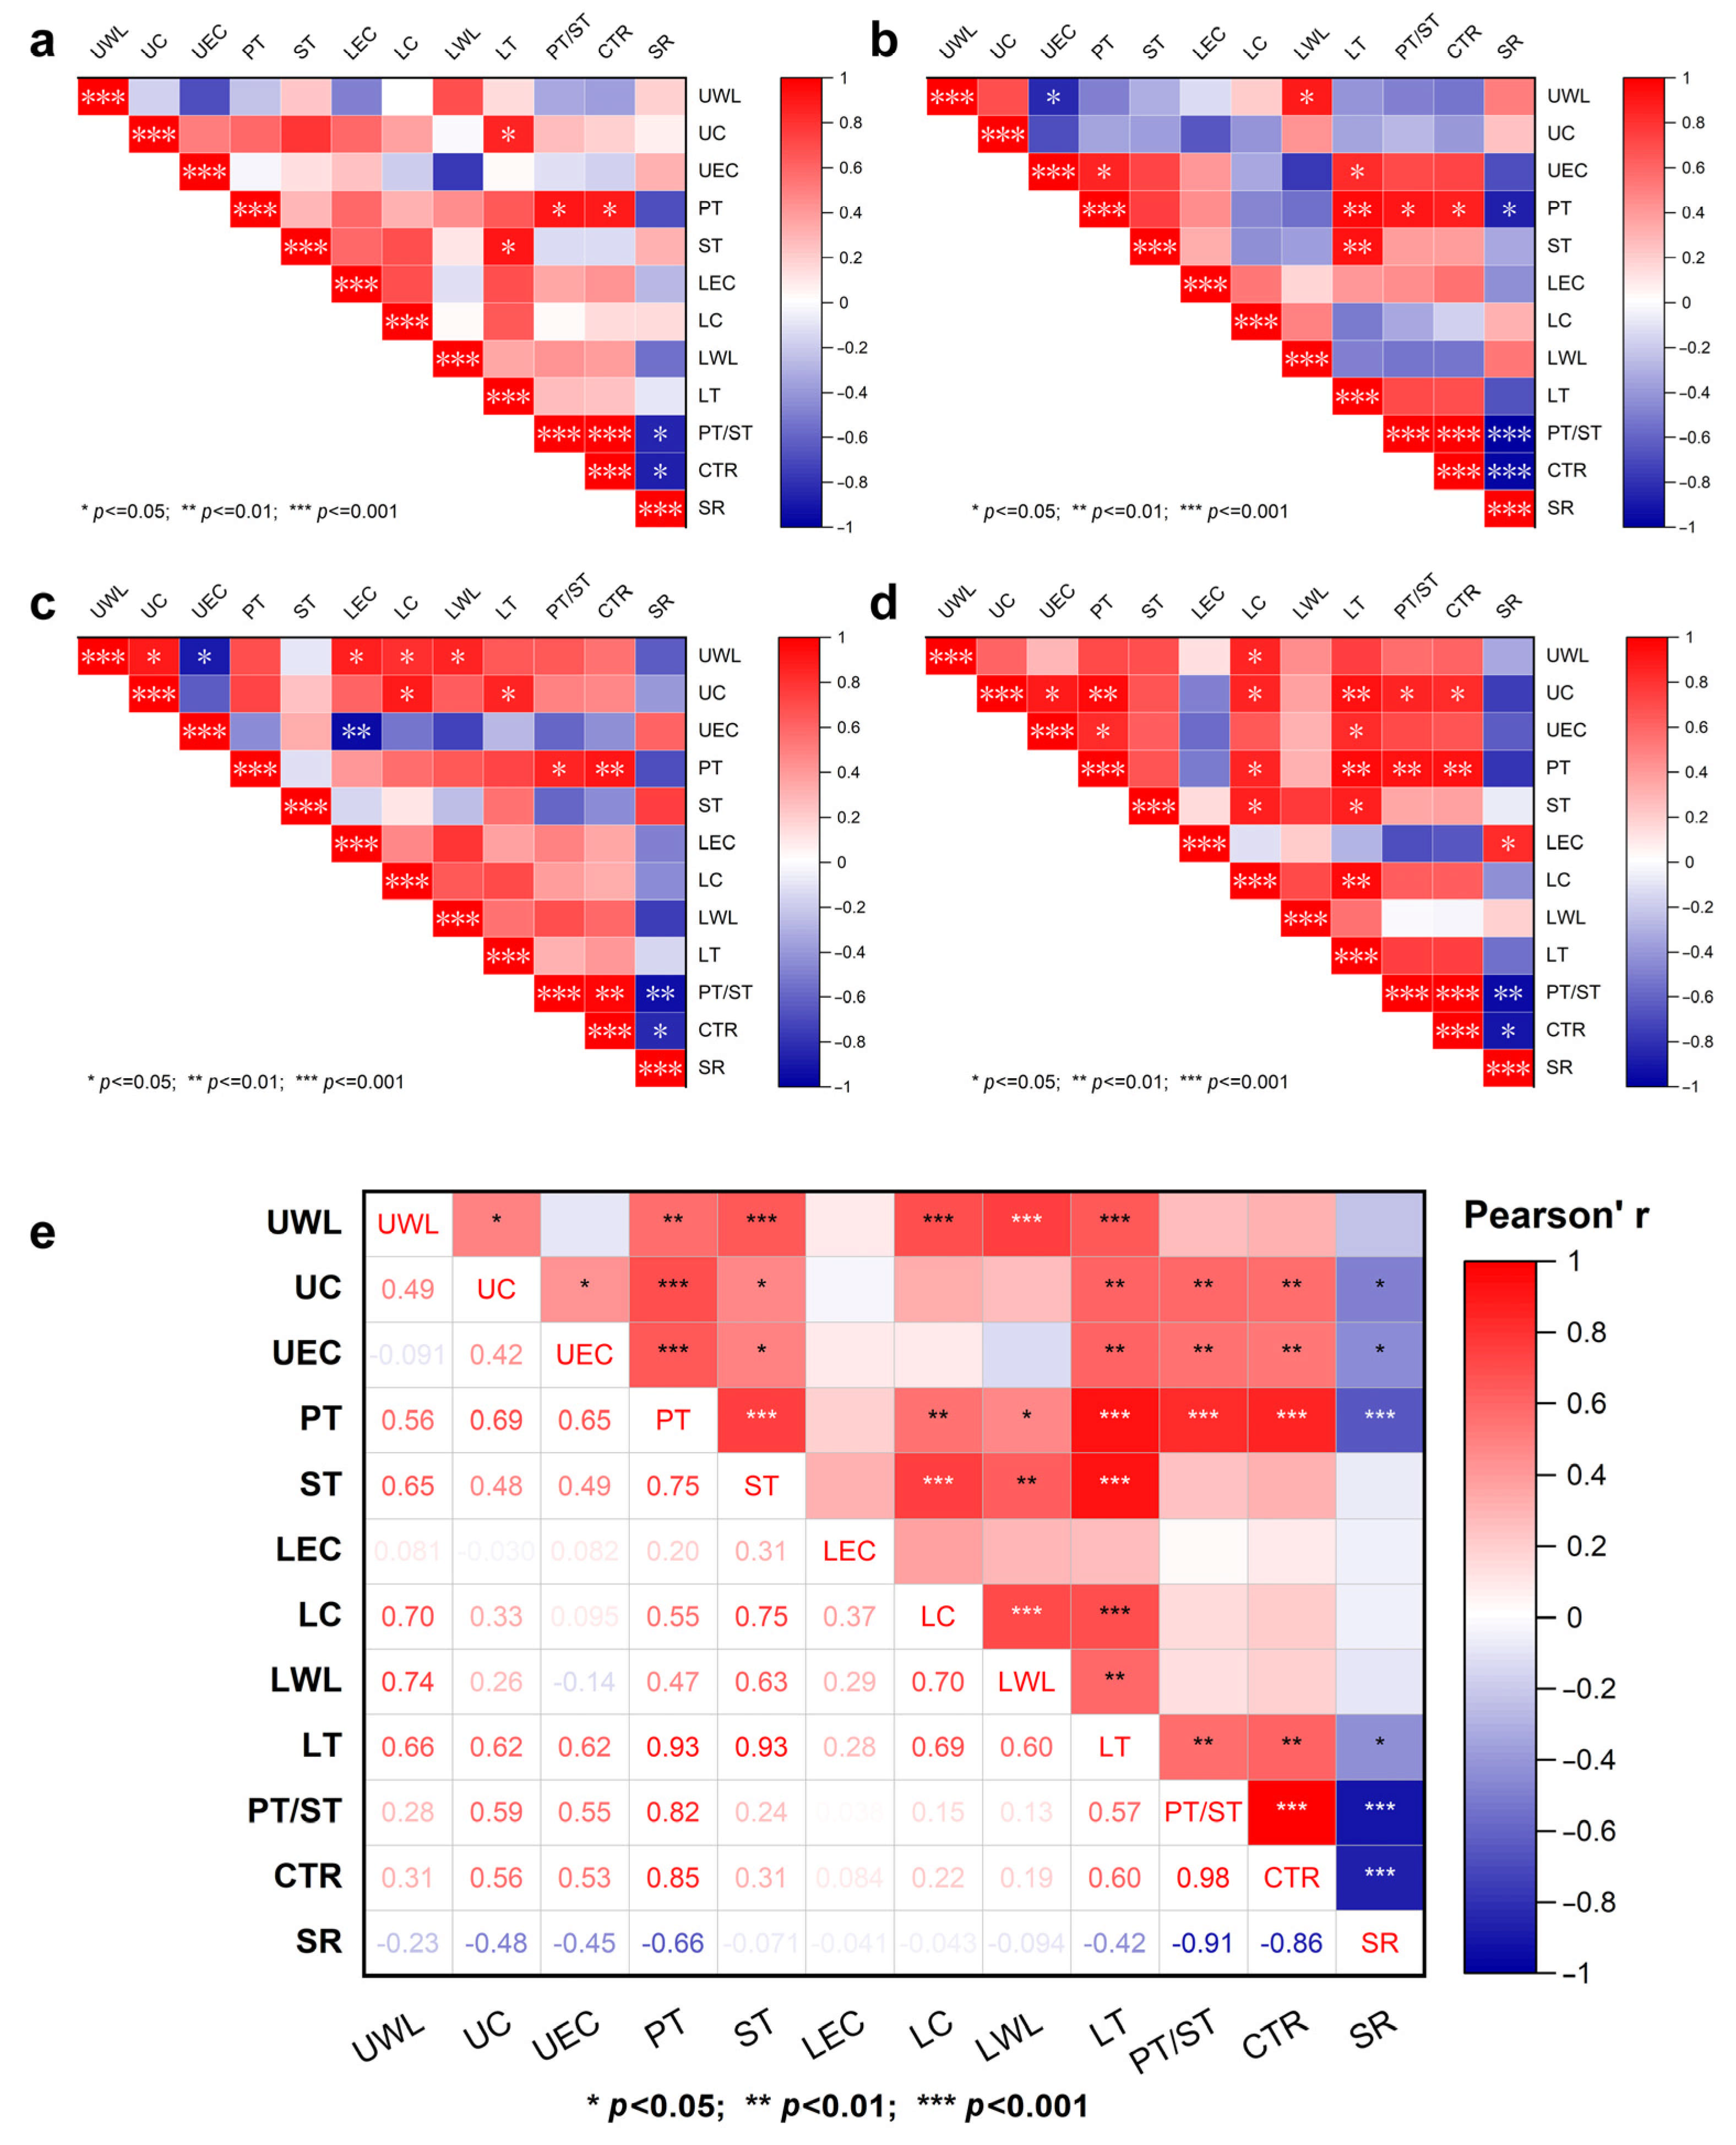
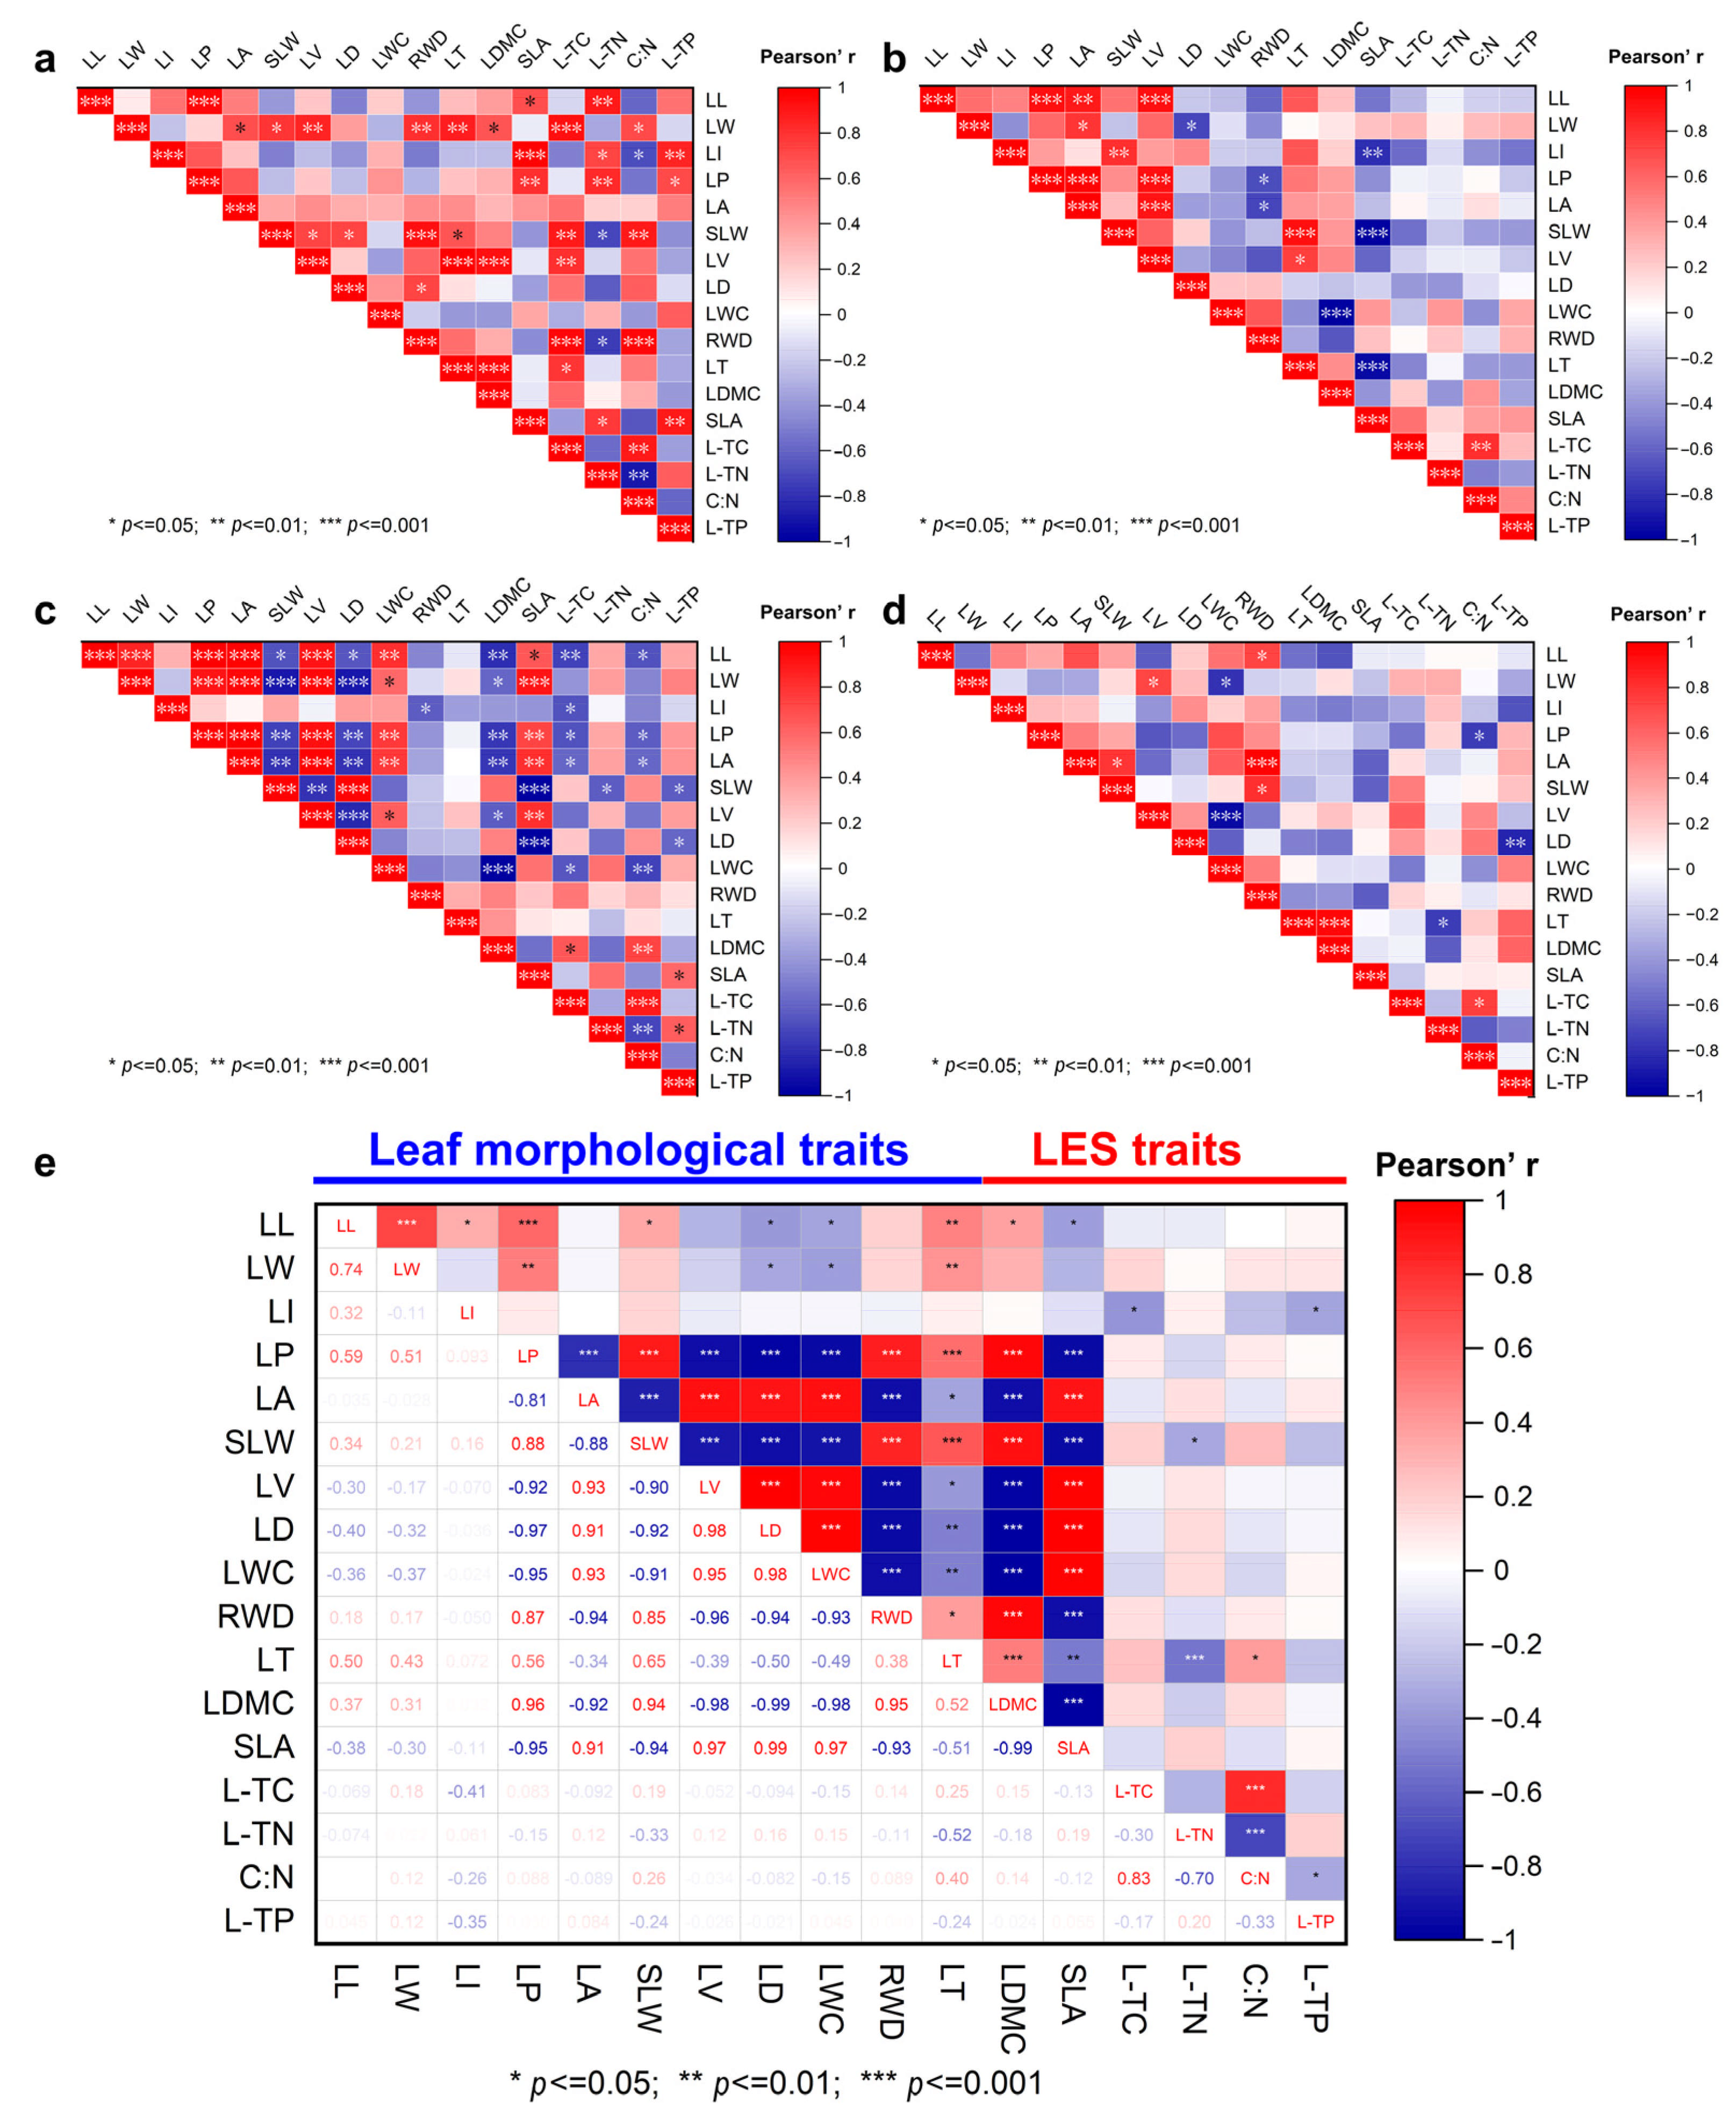
Across the pooled dataset, most leaf trait pairs showed significant positive or negative correlations (Figure 3 and Figure 4), but these associations were highly inconsistent among islands (Figure 3a–d and Figure 4a–d). For example, LT was significantly positively correlated with ST, LEC, LC, PT, UEC, UWL, LWL, UC, and PT/ST in the metapopulation (Supplementary Figure S3), and was also positively correlated with LDMC and C:N and negatively correlated with SLA and L-TN. Within individual islands, however, most of these correlations were no longer significant; only the LT–LDMC and LT–SLA relationships remained relatively stable, though not always statistically significant (Figure 4). This pattern is consistent with scale-dependent trait associations, but it should be interpreted cautiously: within-island correlations are based on only six plots per island and therefore have lower statistical power and a narrower range of trait values than the pooled analysis, so the loss of significance may reflect reduced power and restricted variance in addition to any biological decoupling.
Figure 3.
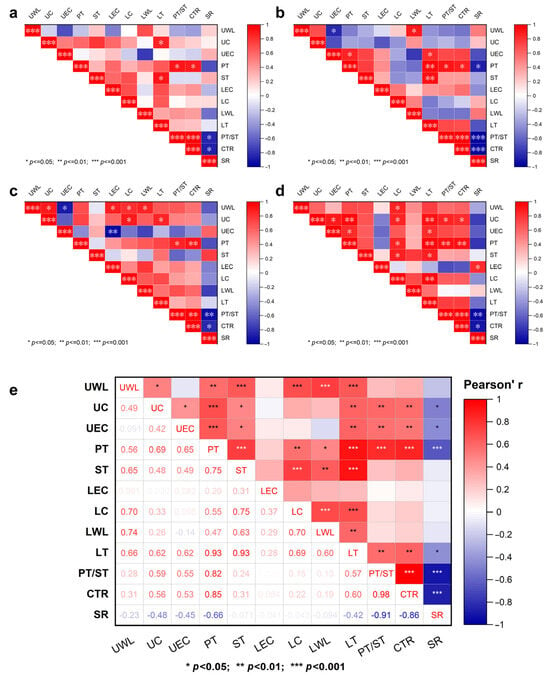
Pearson correlation analysis of relationships among 12 leaf anatomical traits (LATs) at the local population level in (a) Dahuai Islet (DHY), (b) Jiangshan Island (JSD), (c) Longmu Islet (LMY), and (d) Beiguan Islet (BGY), and at the (e) metapopulation level. Squares along the diagonal show the Pearson correlation coefficients; red squares indicate positive correlations and blue squares negative correlations. The traits are: upper wax layer thickness (UWL, µm), upper epidermis thickness (UEC, µm), palisade tissue thickness (PT, µm), spongy tissue thickness (ST, µm), lower epidermis thickness (LEC, µm), lower cuticle thickness (LC, µm), lower wax layer thickness (LWL, µm), leaf thickness (LT, µm), palisade-to-spongy ratio (PT/ST), upper cuticle thickness (UC, µm), leaf compactness (CTR), and spongy-to-leaf-thickness ratio (SR).
Figure 4.
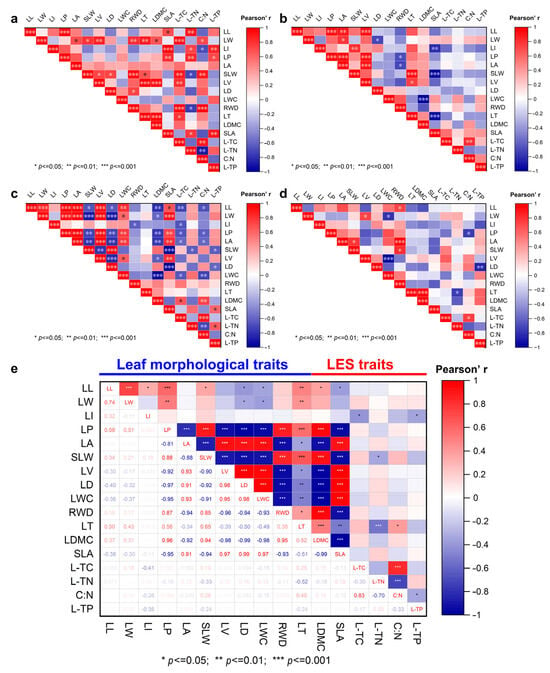
Pearson correlation analysis of relationships among 17 leaf morphological and LES traits at the local population level in (a) Dahuai Islet (DHY), (b) Jiangshan Island (JSD), (c) Longmu Islet (LMY), and (d) Beiguan Islet (BGY), and at the (e) metapopulation level. Squares along the diagonal show the Pearson correlation coefficients; red squares indicate positive correlations and blue squares negative correlations. The traits are: LL (leaf length), LW (leaf width), LI (leaf index), LT (leaf thickness), LP (leaf perimeter), LA (leaf area), SLA (specific leaf area), LDMC (leaf dry matter content), SLW (specific leaf weight), LV (leaf volume), LD (leaf tissue density), LWC (leaf water content), RWD (relative water deficit), L-TC (leaf total carbon), L-TN (leaf total nitrogen), C:N (L-TC/L-TN), and L-TP (leaf total phosphorus).
3.3. Light Is Mainly Associated with Structural Traits, Whereas Soil Nutrients Are Mainly Associated with LES Traits
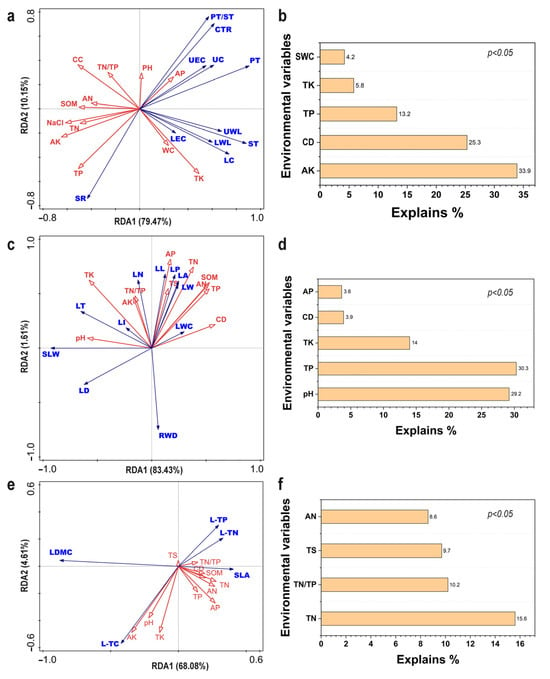
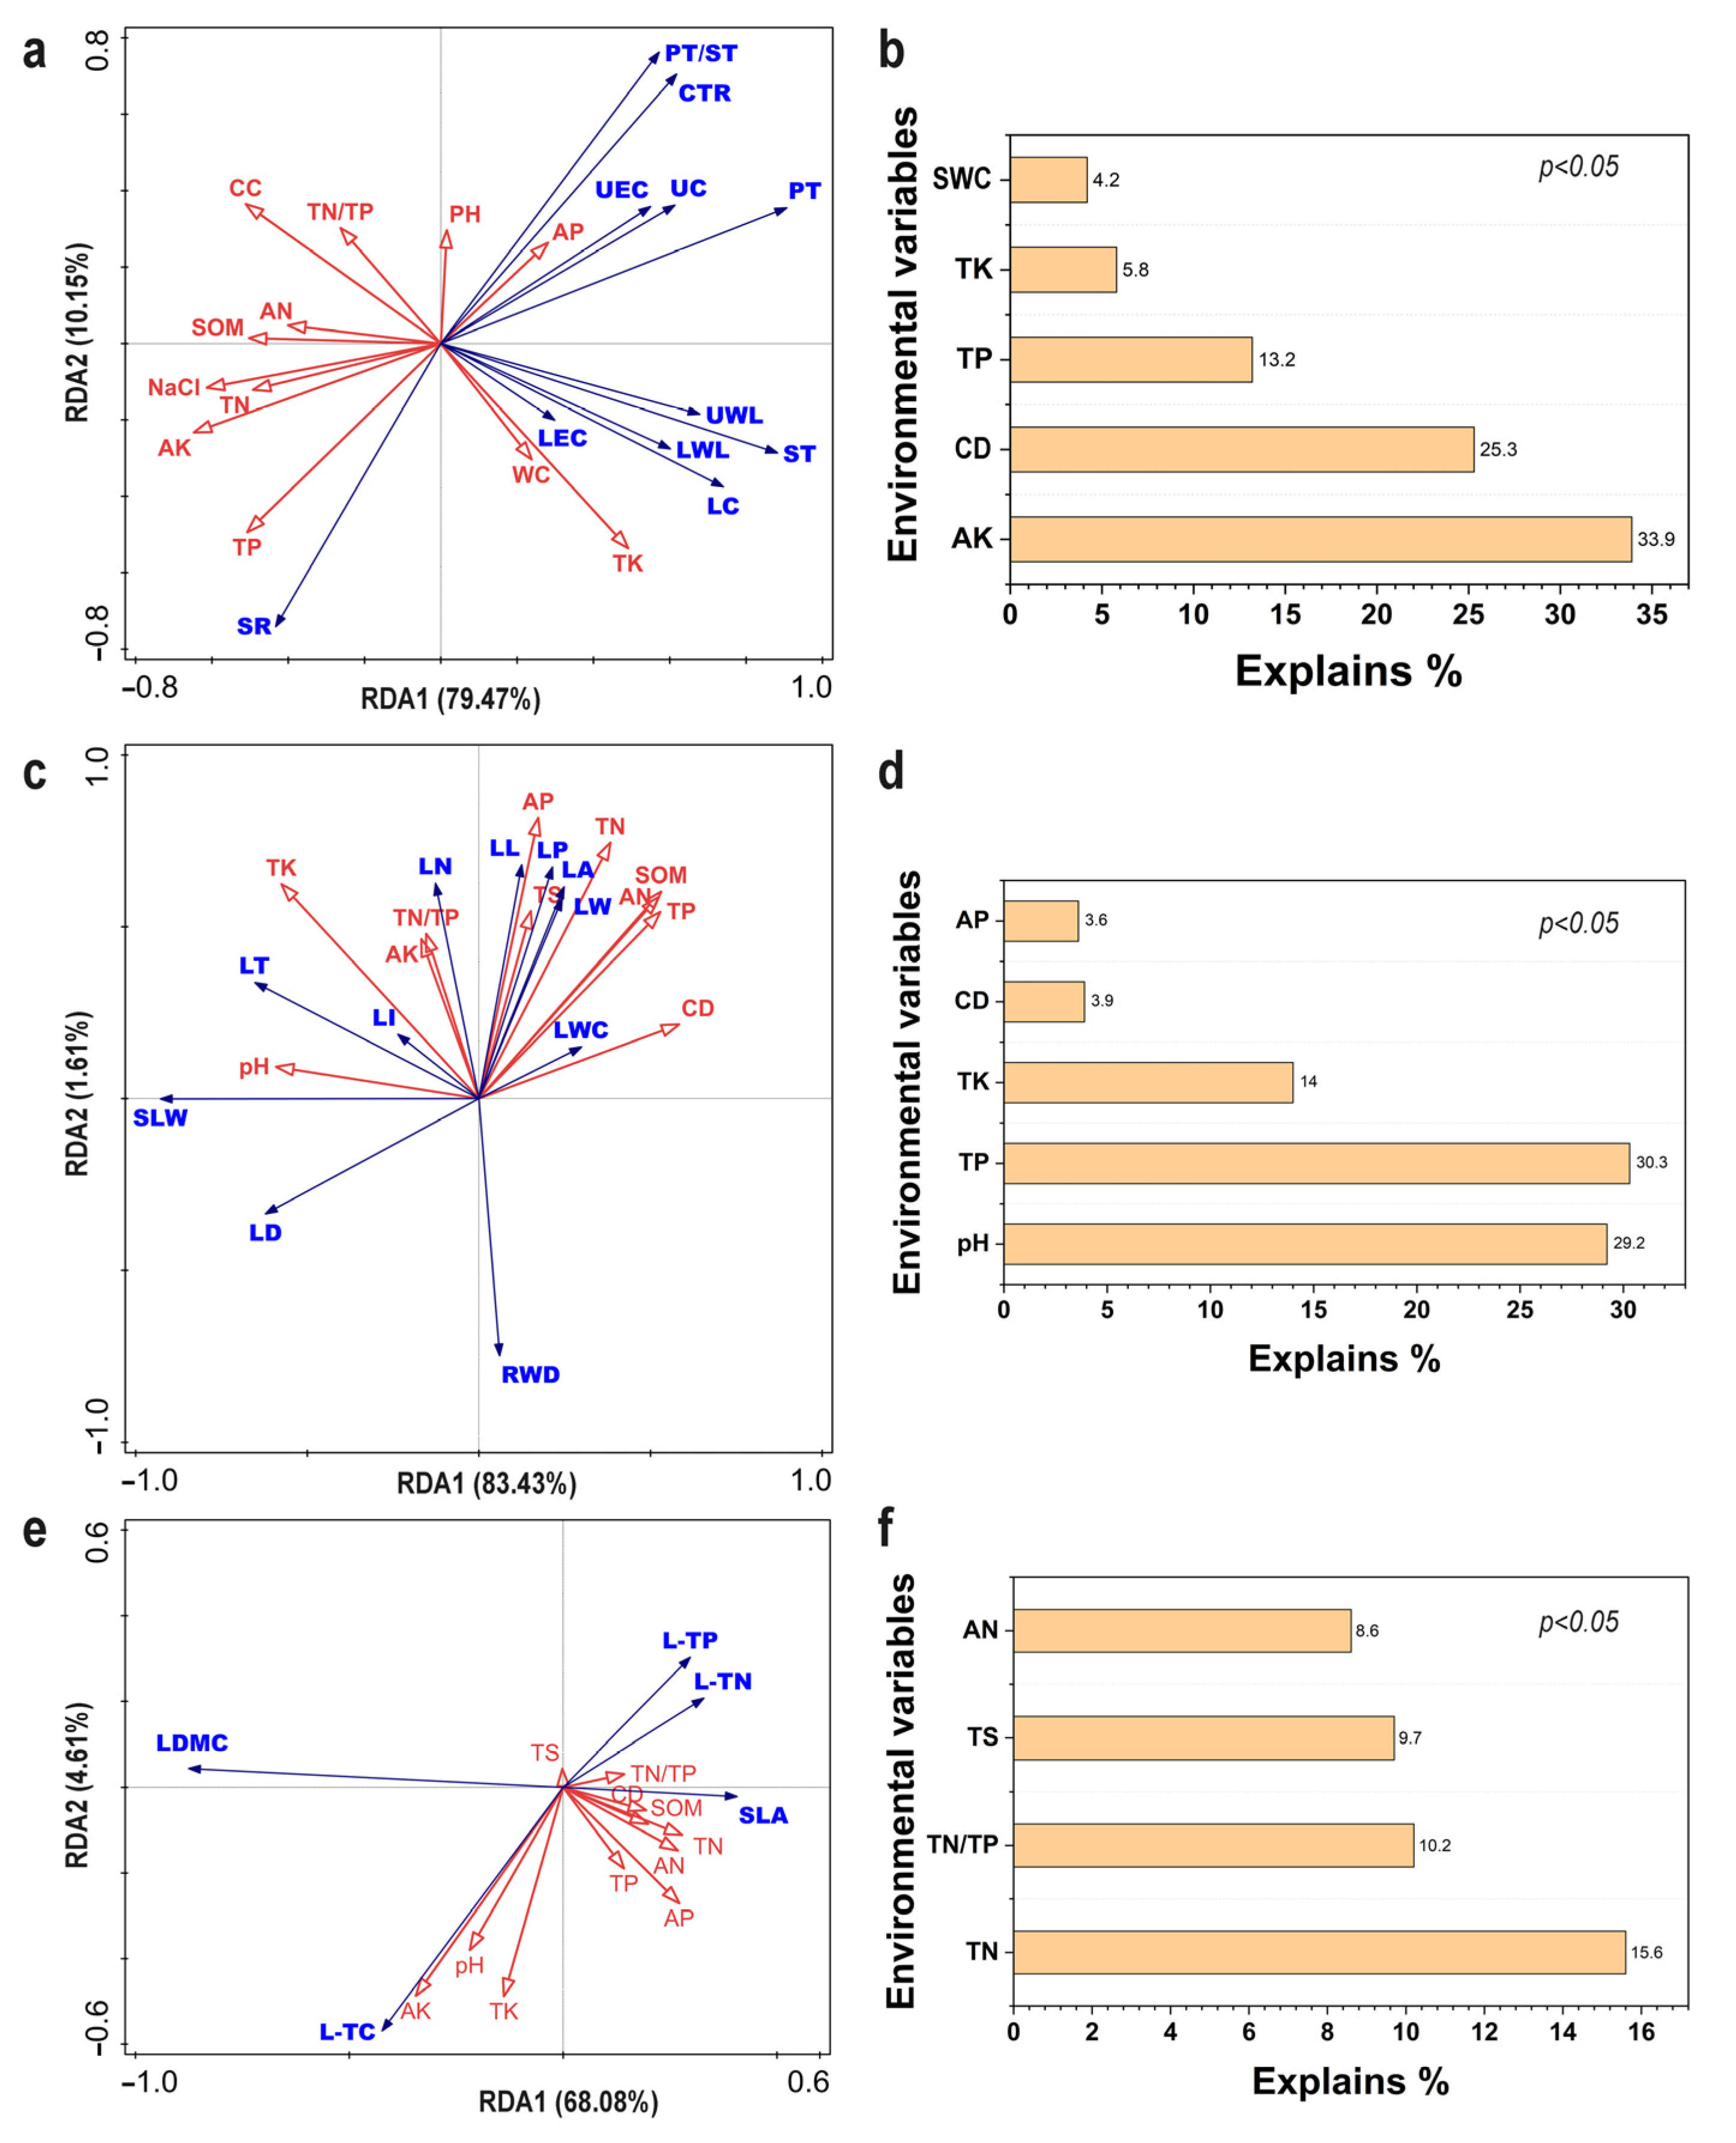
We performed redundancy analysis (RDA) to test whether light is associated mainly with structural and anatomical traits and soil nutrients mainly with LES traits. For anatomical traits, five environmental variables (AK, CD, TP, SWC, TK) were significantly related to trait variation (p < 0.05) and together explained 89.62% of the variation, with canopy density (CD) as one of the strongest single predictor (p < 0.01), consistent with a dominant role of light (Figure 5a,b). For the leaf morphological traits (LMTs), pH, TP, TK, AP, and CD explained 85.04% of the variance (Figure 5c,d). In a separate analysis restricted to LES traits, soil nutrients (TN, TS, AN, and TN/TP) were the leading predictors, explaining 72.69% of the variance (p = 0.002) (Figure 5e,f). These results indicate that light is primarily associated with structural and anatomical traits, whereas soil nutrients are primarily associated with LES traits.
Figure 5.
RDA ordination diagrams showing the environmental variables associated with leaf functional trait variation in the field survey. (a) RDA ordination of leaf anatomical traits (LATs) and environmental factors; the model explained 91.39% of the variation. (b) Contributions of canopy density and soil nutrients (AK, TP, TK, SOM) to morphological trait variation. (c) RDA ordination of LMTs and environmental variables; the model explained 85.07% of the variation. (d) Contributions of canopy density and soil nutrients (AK, AP, TK, TP, TS, SOM) to combined morphological and LES trait variation. Monte Carlo permutation tests confirmed the significance of the environmental factors (p < 0.01). (e) RDA ordination of LES traits and environmental factors; the model explained 72.68% of the variation. (f) Contributions of nutrients (TN, TN/TP, TS, AN) to LES trait variation. The p value was obtained from a Monte Carlo permutation test for incremental significance, indicating whether the additional explanatory power of each environmental factor for community structure variation, beyond that of the variables already selected, was significant (p < 0.05 was considered significant and retained in the RDA model).
3.4. Shading Experiments Validate Light-Driven Plasticity in Leaf Traits
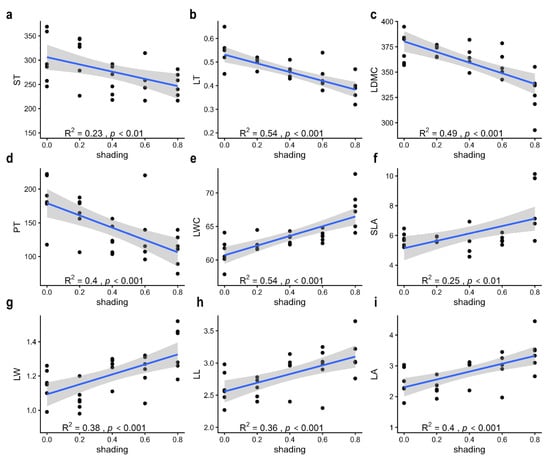
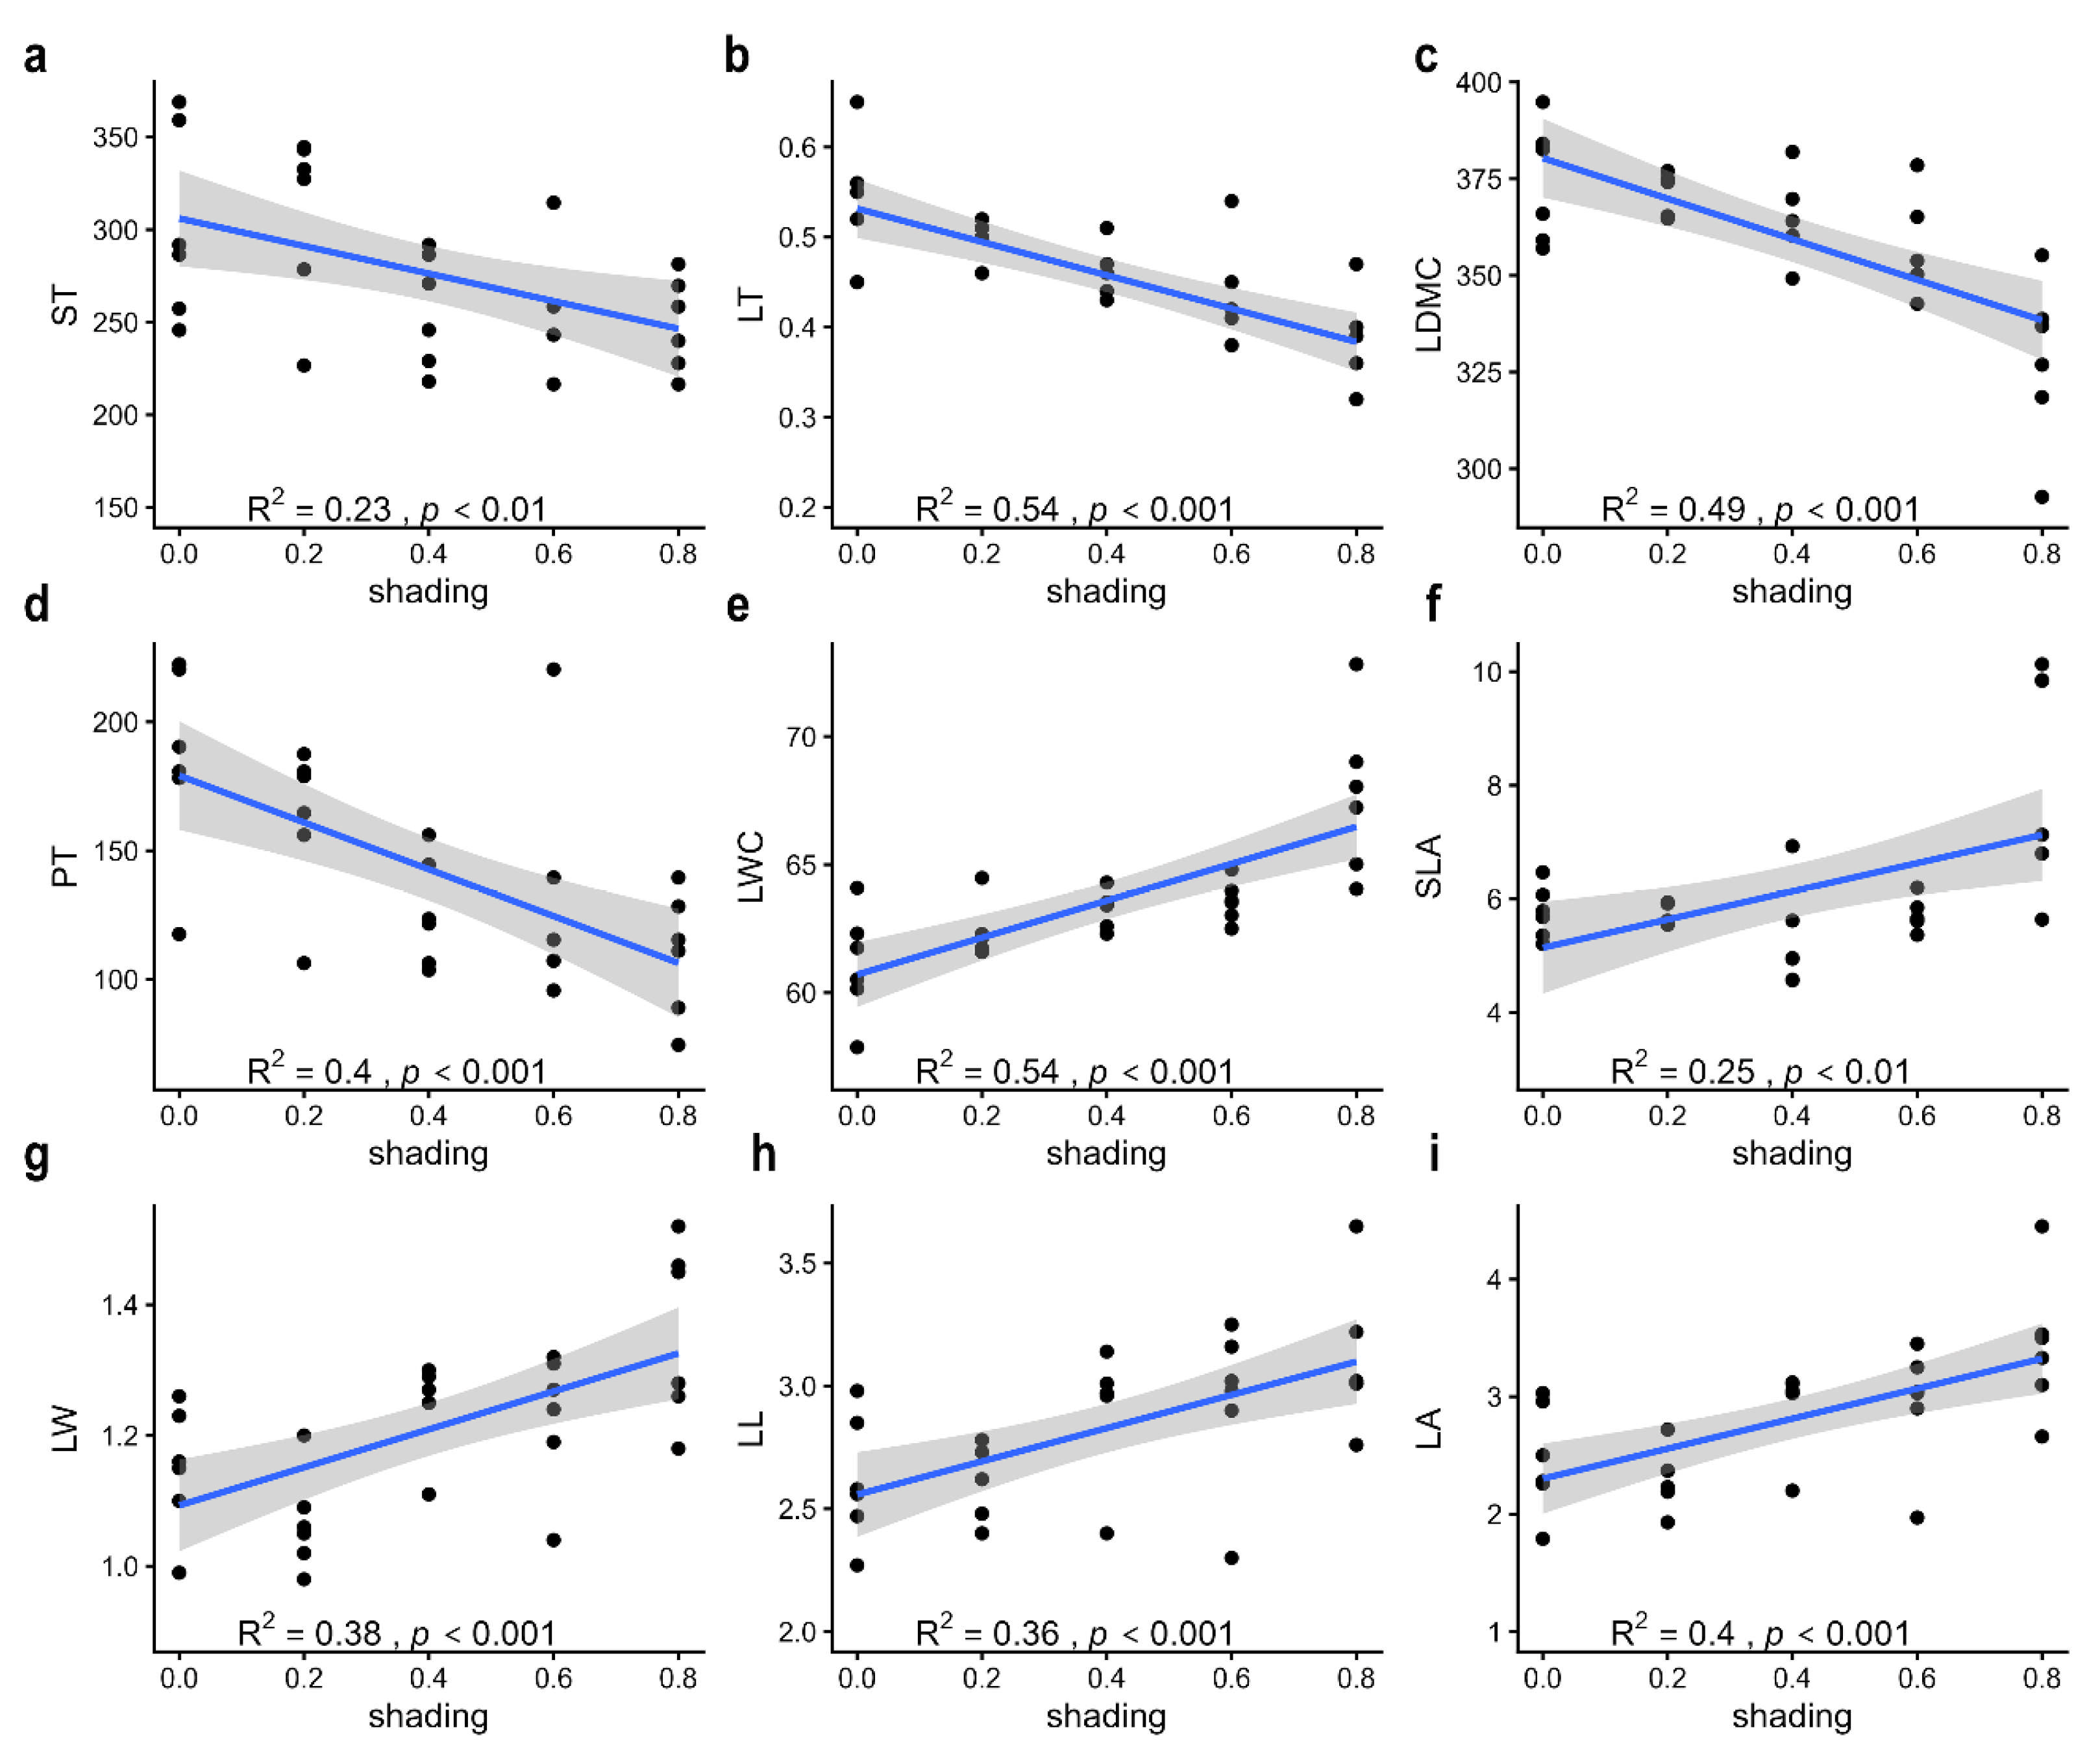
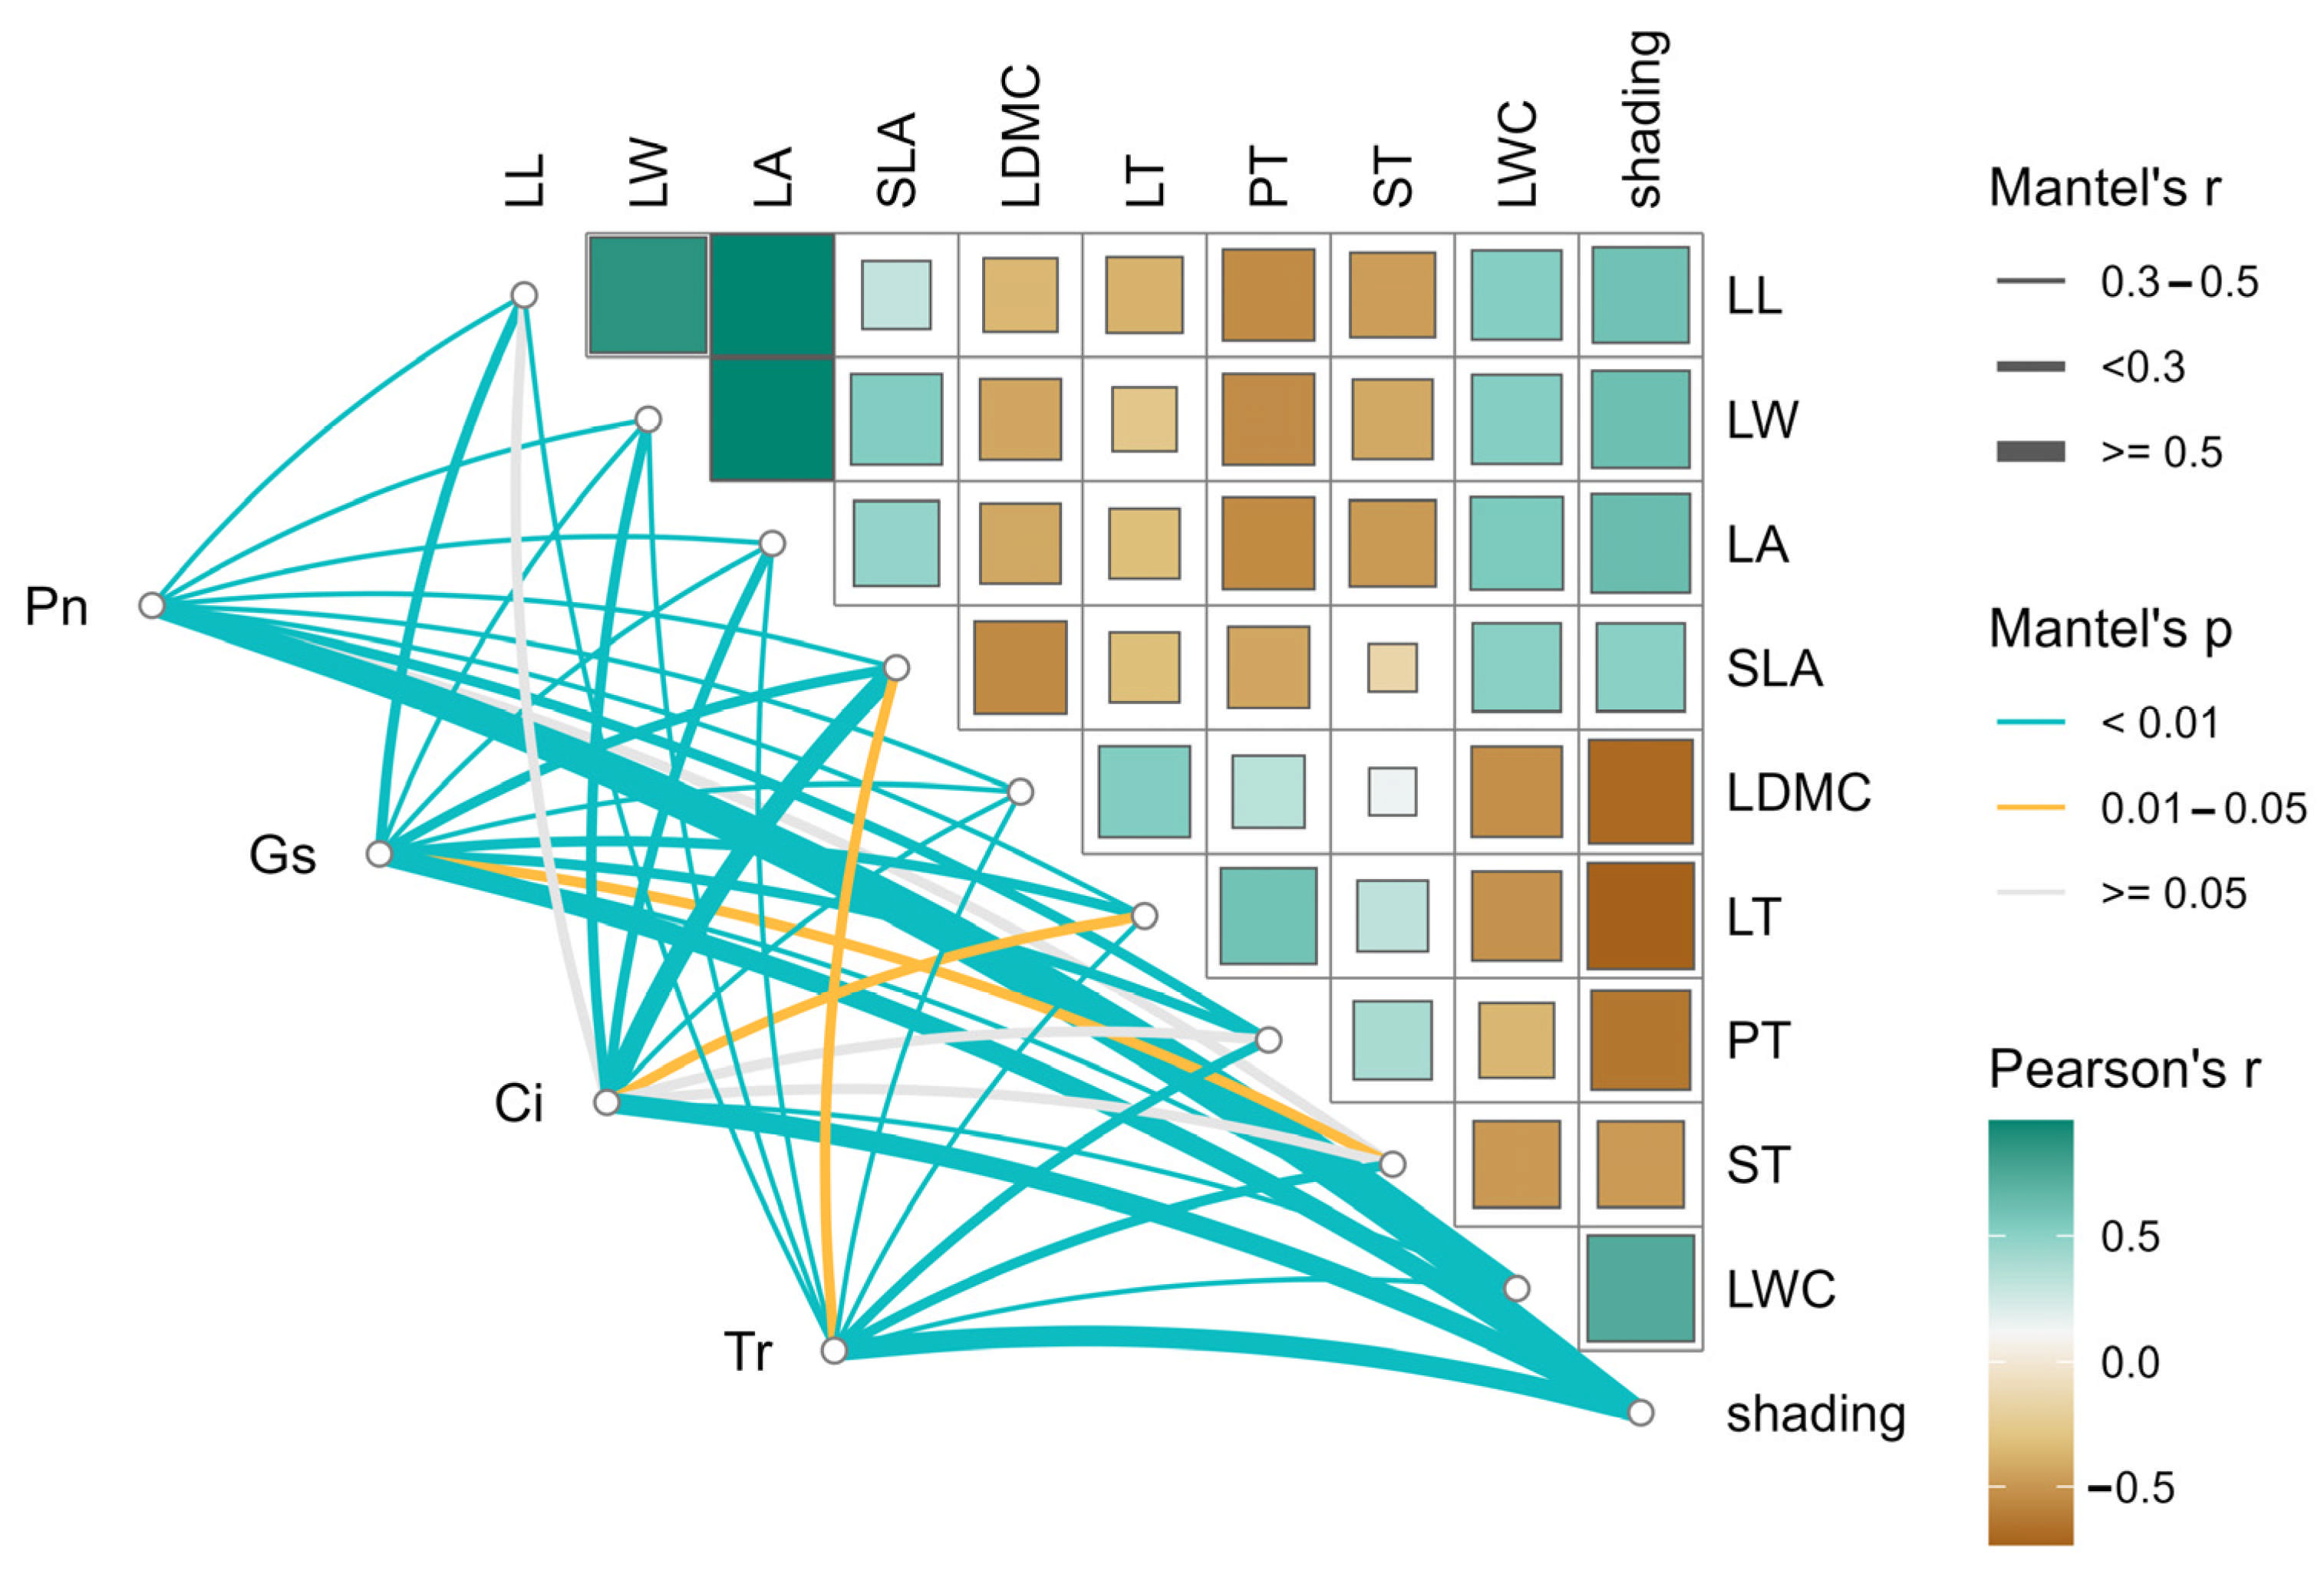
Consistent with the observed plasticity along canopy density gradients (Figure 5 and Supplementary Figure S3), a shading experiment confirmed that shading levels were positively correlated with leaf water content, leaf area, specific leaf area, leaf width, and leaf length, and negatively correlated with spongy tissue thickness, leaf thickness, leaf dry matter content (LDMC), and palisade tissue thickness (Figure 6). Shading also significantly affected photosynthetic parameters, including net photosynthetic rate, stomatal conductance, intercellular CO2 concentration, and transpiration rate (Figure 7 and Table 4). These experimental results align with the field survey trends, collectively demonstrating substantial phenotypic plasticity in leaf functional traits.
Figure 6.
Effects of shading on leaf traits. The traits investigated are: (a) ST (spongy tissue thickness). (b) LT (leaf thickness). (c) LDMC (leaf dry matter content). (d) PT (palisade tissue thickness). (e) LWC (leaf water content). (f) SLA (specific leaf area). (g) LW (leaf width). (h) LL (leaf length). (i) LA (leaf area). Blue lines represent the fitted responses, with 95% confidence intervals shaded in gray.
Figure 7.
Correlation between photosynthesis parameters and leaf functional traits. Blue lines represent the fitted responses, with 95% confidence intervals shaded in gray. The square charts displayed in Figure 7 along the diagonal illustrate the values of the Pearson correlation coefficients. Orange square charts represent a negative correlation between the two traits (the larger area of the square, the stronger the correlation), whereas the green charts indicate a positive correlation.
Table 4.
Daily mean value of photosynthesis parameters of E. emarginata leaves under shading.
4. Discussion
4.1. Greater Variability of LATs than LES Traits, and Scale-Dependent Trait Correlations
Environmental conditions shape plant morphology throughout growth and development [51], and morphological traits in turn reflect adaptive responses to the environment. Because leaves have the largest surface area of any organ, they are especially sensitive to light, temperature, and moisture [52,53], with most leaf adjustments expressed through external morphology and internal anatomy [54]. Consistent with our hypothesis, LATs varied more strongly than LES traits across the insular environmental gradients (Figure 2h; Kruskal–Wallis, p = 0.001), and metapopulation-level variation generally exceeded local population-level variation except for the more conservative LES traits (Figure 2a–g). These findings suggest that anatomical variability is a primary way in which this species copes with the heterogeneous stresses of island habitats—aridity, saline–alkaline soils, high irradiance, and persistent sea winds [28,32].
Leaf responses to stress involve both external morphology and internal anatomy [55]. Leaves of plants in arid, saline environments often adopt a conservative, ‘thick and small’ strategy [56,57,58]. Mature leaves of E. emarginata are small, narrow, and densely arranged, which improves light-use efficiency while limiting water loss, in line with adaptation to xeric and saline conditions. Anatomically, the leaves show well-defined upper and lower wax layers, cuticles, epidermises, palisade mesophyll, and spongy mesophyll. Among these tissues, palisade tissue showed the highest variability (largest CV and PI; Table 3), followed by the wax layers and the palisade-to-spongy ratio, underscoring the role of anatomical traits in adjusting leaf function to local light and water regimes [59,60].
A further finding is the scale-dependence of trait correlations (Figure 3 and Figure 4). Many leaf trait pairs were significantly correlated at the metapopulation level (Supplementary Figure S3), but most of these associations became non-significant within local island populations, with only the LT–LDMC and LT–SLA relationships remaining relatively stable (Figure 4). We interpret this cautiously: local populations contained only six plots, so their lower statistical power and narrower trait ranges may contribute to the loss of significance, and non-significance here should not be read as proof that the associations are absent. Nevertheless, the pattern suggests that the tight trait network of the interspecific LES does not automatically transfer to within-species populations under heterogeneous insular stress [34,35,36]; instead, local environmental filters may reconfigure trait relationships. The high anatomical variability of E. emarginata likely contributes to its ability to persist across diverse microhabitats, which is directly relevant to island restoration.
4.2. Light Is Associated with Structural/Anatomical Traits, Soil Nutrients with LES Traits
Plant growth is influenced by many factors: climate largely determines life form, whereas soil fertility strongly shapes leaf traits [61,62]. Our results reveal a modular pattern in which light (canopy density) was mainly associated with leaf morphological and anatomical traits, whereas soil nutrients were mainly associated with LES traits. Specifically, RDA showed that canopy density was the leading predictor for LMTs and LATs, which, together with soil factors (AK, TP, TK, SOM), accounted for 80.80% of the variation (Figure 5a,b); by contrast, LES traits were best explained by soil nutrients (TN, TS, AN, TN/TP), which accounted for 73.23% of the variance. Because soil nutrients were measured rather than manipulated in the field, these nutrient–trait relationships are observational, whereas the light effect was additionally tested experimentally (Section 3.4). Overall, light and soil nutrients appear to be associated with different trait groups, arguing against a single integrated resource-use axis.
E. emarginata showed a strong positive correlation between tissue CV and PI (R2 = 0.92), with palisade tissue displaying the highest variability (largest PI and CV) and therefore the most prominent role in island adaptation [63]; the upper/lower wax layers and the palisade-to-spongy ratio were also highly variable (Table 3). The shading experiment corroborated these field patterns: shading increased leaf water content, SLA, and leaf area while reducing LT, LDMC, palisade tissue thickness, and spongy tissue thickness, and it significantly affected net photosynthetic rate, stomatal conductance, intercellular CO2 concentration, and transpiration rate (Figure 6 and Table 3). These experimental results align with the field trends and indicate that the light-related trait variation observed in the field is, at least in part, phenotypic plasticity.
Cluster analysis and RDA identify light (canopy cover) as a key factor associated with leaf phenotypic divergence (Supplementary Figure S3 and Figure 5). Palisade tissue contributes to photosynthetic efficiency by regulating light and water use; under high irradiance it limits water loss and chlorophyll degradation in the mesophyll, sustaining photosynthesis under thermal stress [64]. Increased leaf thickness likewise reduces heat damage and transpiration, conserving water [65]. Accordingly, leaves of E. emarginata in high-light habitats (Group A) showed greater palisade and total thickness, whereas shaded plants (Groups B and C) produced thinner leaves with higher SLA—a conservative-to-acquisitive shift along the intraspecific light gradient. Excessive thickness, however, can impede CO2 diffusion and photosynthate transport [66,67], so E. emarginata appears to balance these trade-offs to maximise photosynthetic efficiency across irradiance levels. Finally, the observation that soil nutrients—rather than light—were most closely associated with LES traits (e.g., leaf N, P, C:N) suggests that resource economics and structural adaptation are governed by different environmental filters, which refines the application of the LES framework to intraspecific variation in stress-tolerant species.
5. Conclusions
Across four island populations of Eurya emarginata, light and soil conditions were associated with different leaf trait groups, and trait correlations that were significant at the metapopulation level were often not maintained within local populations, where anatomical traits also varied more than LES traits. A shading experiment confirmed that light availability induces plastic changes in structural and photosynthetic traits. Together, these results indicate that the interspecific LES framework does not automatically scale down to within-species populations under heterogeneous stress, and that environmental filtering acts on multiple, partly independent trait dimensions. The high anatomical variability of E. emarginata likely underlies its persistence across diverse microhabitats and supports its use in island restoration. Future studies should incorporate anatomical traits into the LES framework to improve predictions of plant responses to global change, and should test nutrient effects experimentally to complement the field associations reported here.
Supplementary Materials
The following supporting information can be downloaded at: https://www.mdpi.com/article/10.3390/d18110697/s1, Figure S1: Comparison of leaf traits in 4 islands; Figure S2: The relationship between Leaf thickness (LT) and the main leaf anatomical traits; Figure S3: Canopy density (CD) explaining the leaf plasticity and variation coefficients in E. emarginata.
Author Contributions
Conceptualization, G.-L.X. and J.C.; methodology, G.-L.X.; software, G.-L.X.; validation, J.C., M.-L.Y. and G.-L.X.; formal analysis, G.-L.X. and J.C.; investigation, J.C., M.-L.Y. and G.-L.X.; data curation, G.-L.X. and J.C.; writing—original draft preparation, G.-L.X.; writing—review and editing, J.C., M.-L.Y. and G.-L.X.; visualization, G.-L.X. and J.C.; supervision, G.-L.X.; project administration, G.-L.X. All authors have read and agreed to the published version of the manuscript.
Funding
This research was funded by Research Startup Foundation of Yancheng Teachers University grant number [204670012].
Data Availability Statement
The analyzed locality data and results of the analysis are available within the main text of the paper or in the supporting information (Supplementary Materials).
Conflicts of Interest
The authors declare no conflicts of interest.
References
- Cornelissen, J.H.C.; Lavorel, S.; Garnier, E.; Díaz, S.; Buchmann, N.; Gurvich, D.E.; Reich, P.B.; ter Steege, H.; Morgan, H.D.; van den Heijden, M.G.A.; et al. A handbook of protocols for standardised and easy measurement of plant functional traits worldwide. Aust. J. Bot. 2003, 51, 335–380. [Google Scholar] [CrossRef] [Scilit]
- Ackerly, D.D.; Cornwell, W.K. A trait-based approach to community assembly: Partitioning of species trait values into within- and among-community components. Ecol. Lett. 2007, 10, 135–145. [Google Scholar] [CrossRef] [Scilit]
- Poorter, L.; Bongers, F. Leaf traits are good predictors of plant performance across 53 rain forest species. Ecology 2006, 87, 1733–1743. [Google Scholar] [CrossRef] [Scilit]
- Poorter, L.; Castilho, C.V.; Schietti, J.; Oliveira, R.S.; Costa, F.R. Can traits predict individual growth performance? A test in a hyperdiverse tropical forest. New Phytol. 2018, 219, 109–121. [Google Scholar] [CrossRef] [Scilit]
- Zhu, Y.; Kang, H.; Xie, Q.; Wang, Z.; Yin, S.; Liu, C. Pattern of leaf vein density and climate relationship of Quercus variabilis populations remains unchanged with environmental changes. Trees 2012, 26, 597–607. [Google Scholar] [CrossRef] [Scilit]
- Violle, C.; Navas, M.-L.; Vile, D.; Kazakou, E.; Fortunel, C.; Hummel, I.; Garnier, E. Let the concept of trait be functional! Oikos 2007, 116, 882–892. [Google Scholar] [CrossRef] [Scilit]
- He, N.; Liu, C.; Piao, S.; Sack, L.; Xu, L.; Luo, Y.; He, J.; Han, X.; Zhou, G.; Zhou, X.; et al. Ecosystem Traits Linking Functional Traits to Macroecology. Trends Ecol. Evol. 2019, 34, 200–210. [Google Scholar] [CrossRef] [Scilit]
- Huxley, J.D.; White, C.T.; Humphries, H.C.; Weber, S.E.; Spasojevic, M.J. Plant functional traits are dynamic predictors of ecosystem functioning in variable environments. J. Ecol. 2023, 111, 2597–2613. [Google Scholar] [CrossRef] [Scilit]
- Aguirre-Gutiérrez, J.; Díaz, S.; Rifai, S.W.; Corral-Rivas, J.J.; Nava-Miranda, M.G.; González-M, R.; Hurtado-M, A.B.; Revilla, N.S.; Vilanova, E.; Almeida, E.; et al. Tropical forests in the Americas are changing too slowly to track climate change. Science 2025, 387, eadl5414. [Google Scholar] [CrossRef] [Scilit]
- Yan, P.; He, N.; Fernández-Martínez, M.; Yang, X.; Zuo, Y.; Zhang, H.; Wang, J.; Chen, S.; Song, J.; Li, G.; et al. Plant Acquisitive Strategies Promote Resistance and Temporal Stability of Semiarid Grasslands. Ecol. Lett. 2025, 28, e70110. [Google Scholar] [CrossRef] [Scilit]
- Faucon, M.P.; Houben, D.; Lambers, H. Plant Functional Traits: Soil and Ecosystem Services. Trends Plant Sci. 2017, 22, 385–394. [Google Scholar] [CrossRef] [Scilit]
- Hanisch, M.; Schweiger, O.; Cord, A.F.; Volk, M.; Knapp, S. Plant functional traits shape multiple ecosystem services, their trade-offs and synergies in grasslands. J. Appl. Ecol. 2020, 57, 1535–1550. [Google Scholar] [CrossRef] [Scilit]
- Dong, N.; Prentice, I.C.; Wright, I.J.; Evans, B.J.; Togashi, H.F.; Caddy-Retalic, S.; McInerney, F.A.; Sparrow, B.; Leitch, E.; Lowe, A.J. Components of leaf-trait variation along environmental gradients. New Phytol. 2020, 228, 82–94. [Google Scholar] [CrossRef] [Scilit]
- Gong, H.; Cui, Q.; Gao, J. Latitudinal, soil and climate effects on key leaf traits in northeastern China. Glob. Ecol. Conserv. 2020, 22, e00904. [Google Scholar] [CrossRef] [Scilit]
- Reich, P.B.; Oleksyn, J. Global patterns of plant leaf N and P in relation to temperature and latitude. Proc. Natl. Acad. Sci. USA 2004, 101, 11001–11006. [Google Scholar] [CrossRef] [Scilit]
- Valladares, F.; Bastias, C.C.; Godoy, O.; Granda, E.; Escudero, A. Species coexistence in a changing world. Front. Plant Sci. 2015, 6, 866. [Google Scholar] [CrossRef] [Scilit]
- Wright, I.J.; Reich, P.B.; Westoby, M.; Ackerly, D.D.; Baruch, Z.; Bongers, F.; Cavender-Bares, J.; Chapin, T.; Cornelissen, J.H.C.; Diemer, M.; et al. The worldwide leaf economics spectrum. Nature 2004, 428, 821–827. [Google Scholar] [CrossRef] [Scilit]
- Sun, K.; Ma, Q.; Ji, H.; Wang, A.; Li, Y.; Sun, R.; Liu, L.; Chen, Y.; Yu, H.; Zhang, F.; et al. Plant trait spectrum and its climatic drivers across global realms and biomes. Glob. Planet. Change 2026, 256, 105136. [Google Scholar] [CrossRef] [Scilit]
- Reich, P.B. The world-wide ‘fast–slow’ plant economics spectrum: A traits manifesto. J. Ecol. 2014, 102, 275–301. [Google Scholar] [CrossRef] [Scilit]
- Mueller, K.E.; Kray, J.A.; Blumenthal, D.M. Coordination of leaf, root, and seed traits shows the importance of whole plant economics in two semiarid grasslands. New Phytol. 2024, 241, 2410–2422. [Google Scholar] [CrossRef] [Scilit]
- Violle, C.; Enquist, B.J.; McGill, B.J.; Jiang, L.; Albert, C.H.; Hulshof, C.; Jung, V.; Messier, J. The return of the variance: Intraspecific variability in community ecology. Trends Ecol. Evol. 2012, 27, 244–252. [Google Scholar] [CrossRef] [Scilit]
- Siefert, A.; Violle, C.; Chalmandrier, L.; Albert, C.H.; Taudiere, A.; Fajardo, A.; Aarssen, L.W.; Baraloto, C.; Carlucci, M.B.; Cianciaruso, M.V.; et al. A global meta-analysis of the relative extent of intraspecific trait variation in plant communities. Ecol. Lett. 2015, 18, 1406–1419. [Google Scholar] [CrossRef] [Scilit]
- Westerband, A.C.; Funk, J.L.; Barton, K.E. Intraspecific trait variation in plants: A renewed focus on its role in ecological processes. Ann. Bot. 2021, 127, 397–410. [Google Scholar] [CrossRef] [Scilit]
- Jung, V.; Violle, C.; Mondy, C.; Hoffmann, L.; Muller, S. Intraspecific variability and trait-based community assembly. J. Ecol. 2010, 98, 1134–1140. [Google Scholar] [CrossRef] [Scilit]
- Pritzkow, C.; Williamson, V.; Szota, C.; Trouvé, R.; Arndt, S.K. Phenotypic plasticity and genetic adaptation of functional traits influences intra-specific variation in hydraulic efficiency and safety. Tree Physiol. 2020, 40, 215–229. [Google Scholar] [CrossRef] [Scilit]
- Han, M.; Chen, Y.; Gan, D.; Yu, M.; Li, R.; Han, Y.; Gu, J.; Li, S.; Su, J.; McCormack, M.L.; et al. The latitudinal pattern of fine root intraspecific trait variation among species in plant communities. Nat. Commun. 2025, 16, 9340. [Google Scholar] [CrossRef] [Scilit]
- Ottaviani, G.; Keppel, G.; Götzenberger, L.; Harrison, S.; Opedal, Ø.H.; Conti, L.; Liancourt, P.; Klimešová, J.; Silveira, F.A.O.; Jiménez-Alfaro, B.; et al. Linking Plant Functional Ecology to Island Biogeography. Trends Plant Sci. 2020, 25, 329–339. [Google Scholar] [CrossRef] [Scilit]
- Zhang, A.; Wu, D.; Wang, Z.; Yu, M.; Mao, L. Intraspecific trait variation and whole-plant economics spectrum drive the abundance distributions of woody plants in island communities. J. Ecol. 2025, 113, 1304–1314. [Google Scholar] [CrossRef] [Scilit]
- Schrader, J.; Wright, I.J.; Kreft, H.; Westoby, M. A roadmap to plant functional island biogeography. Biol. Rev. 2021, 96, 2851–2870. [Google Scholar] [CrossRef] [Scilit]
- Schrader, J.; Westoby, M.; Wright, I.J.; Kreft, H. Disentangling direct and indirect effects of island area on plant functional trait distributions. J. Biogeogr. 2021, 48, 2098–2110. [Google Scholar] [CrossRef] [Scilit]
- Xie, Y.; Wang, Y.; He, P.; Zhang, H.; Liu, N.; Ren, H.; Liu, D.; Liu, H.; Lu, H.; Jian, S.; et al. Plant key functional traits in species adaptation and screening for vegetation restoration on coral islands. J. Environ. Manag. 2025, 376, 124545. [Google Scholar] [CrossRef] [Scilit]
- Li, J.; Prentice, I.C. Global patterns of plant functional traits and their relationships to climate. Commun. Biol. 2024, 7, 1136. [Google Scholar] [CrossRef] [Scilit]
- Wang, H.; Liu, S.; Zhang, X.; Mao, Q.; Li, X.; You, Y.; Wang, J.; Zheng, M.; Zhang, W.; Lu, X.; et al. Nitrogen addition reduces soil bacterial richness, while phosphorus addition alters community composition in an old-growth N-rich tropical forest in southern China. Soil Biol. Biochem. 2018, 127, 22–30. [Google Scholar] [CrossRef] [Scilit]
- Stanford, G.; English, L. Use of the Flame Photometer in Rapid Soil Tests for K and Ca. Agron. J. 1949, 41, 446–447. [Google Scholar] [CrossRef] [Scilit]
- Bremner, J.M. Determination of nitrogen in soil by the Kjeldahl method. J. Agric. Sci. 1960, 55, 11–33. [Google Scholar] [CrossRef] [Scilit]
- Biswas, S.R.; He, D.; Li, J.; Gong, L.; Biswas, P.L.; Zhuo, Z.; Xu, M.; Yang, X.D.; Yan, E.R. Putting space into trait ecology: Trait, environment and biodiversity relationships at multiple spatial scales. J. Ecol. 2024, 112, 613–628. [Google Scholar] [CrossRef] [Scilit]
- Ashton, P.M.S.; Olander, L.P.; Berlyn, G.P.; Thadani, R.; Cameron, I.R. Changes in leaf structure in relation to crown position and tree size of Betula papyrifera within fire-origin stands of interior cedar-hemlock. Can. J. Bot. 1998, 76, 1180–1187. [Google Scholar] [CrossRef] [Scilit]
- Smart, S.M.; Glanville, H.C.; Blanes, M.d.C.; Mercado, L.M.; Emmett, B.A.; Jones, D.L.; Cosby, B.J.; Marrs, R.H.; Butler, A.; Marshall, M.R.; et al. Leaf dry matter content is better at predicting above-ground net primary production than specific leaf area. Funct. Ecol. 2017, 31, 1336–1344. [Google Scholar] [CrossRef] [Scilit]
- Niinemets, Ü.; Kull, K. Leaf weight per area and leaf size of 85 Estonian woody species in relation to shade tolerance and light availability. For. Ecol. Manag. 1994, 70, 1–10. [Google Scholar] [CrossRef] [Scilit]
- Meng, Y.-Y.; Xiang, W.; Wen, Y.; Huang, D.-L.; Cao, K.-F.; Zhu, S.-D. Correlations between leaf economics, mechanical resistance and drought tolerance across 41 cycad species. Ann. Bot. 2022, 130, 345–354. [Google Scholar] [CrossRef] [Scilit]
- Ennajeh, M.; Vadel, A.; Cochard, H.; Khemira, H. Comparative impacts of water stress on the leaf anatomy of a drought-resistant and a drought-sensitive olive cultivar. J. Hortic. Sci. Biotechnol. 2010, 85, 289–294. [Google Scholar] [CrossRef] [Scilit]
- Boughalleb, F.; Hajlaoui, H. Physiological and anatomical changes induced by drought in two olive cultivars (cv Zalmati and Chemlali). Acta Physiol. Plant. 2011, 33, 53–65. [Google Scholar] [CrossRef] [Scilit]
- Liao, Y.; Min, X.; Yang, Z.; Chai, L.; Zhang, S.; Wang, Y. Physicochemical and biological quality of soil in hexavalent chromium-contaminated soils as affected by chemical and microbial remediation. Environ. Sci. Pollut. Res. 2014, 21, 379–388. [Google Scholar] [CrossRef] [Scilit]
- Bogunovic, I.; Trevisani, S.; Seput, M.; Juzbasic, D.; Durdevic, B. Short-range and regional spatial variability of soil chemical properties in an agro-ecosystem in eastern Croatia. Catena 2017, 154, 50–62. [Google Scholar] [CrossRef] [Scilit]
- Bogunovic, I.; Pereira, P.; Brevik, E.C. Spatial distribution of soil chemical properties in an organic farm in Croatia. Sci. Total Environ. 2017, 584–585, 535–545. [Google Scholar] [CrossRef] [Scilit]
- Wilke, B.-M. Determination of Chemical and Physical Soil Properties. In Monitoring and Assessing Soil Bioremediation; Margesin, R., Schinner, F., Eds.; Springer: Berlin/Heidelberg, Germany, 2005; pp. 47–95. [Google Scholar]
- Kabacoff, R. R in Action: Data Analysis and Graphics with R and Tidyverse; Simon and Schuster: New York, NY, USA, 2022. [Google Scholar]
- Pearson, K., VII. Mathematical contributions to the theory of evolution.—III. Regression, heredity, and panmixia. Philos. Trans. R. Soc. Lond. Ser. A 1896, 187, 253–318. [Google Scholar] [CrossRef] [Scilit]
- Yang, J.; Ma, C.; Zhou, L.; Gui, Q.; Gong, M.; Yang, H.; Liu, J.; Chai, Y.; Sun, Y.; Wu, X. Intraspecific Variation and Environmental Determinants of Leaf Functional Traits in Polyspora chrysandra Across Yunnan, China. Plants 2025, 14, 2953. [Google Scholar] [CrossRef] [Scilit]
- Su, B.; Zi, Y.; Xu, W.; Wang, Y.; Su, Z. Water Availability Modulates Leaf Functional Trait Responses of Robinia pseudoacacia L. Seedlings to Nitrogen–Phosphorus Supply. Agronomy 2026, 16, 1479. [Google Scholar] [CrossRef] [Scilit]
- Tian, M.; Yu, G.; He, N.; Hou, J. Leaf morphological and anatomical traits from tropical to temperate coniferous forests: Mechanisms and influencing factors. Sci. Rep. 2016, 6, 19703. [Google Scholar] [CrossRef] [Scilit]
- Oguchi, R.; Onoda, Y.; Terashima, I.; Tholen, D. Leaf Anatomy and Function. In The Leaf: A Platform for Performing Photosynthesis; Adams, W.W., III, Terashima, I., Eds.; Springer International Publishing: Cham, Switzerland, 2018; pp. 97–139. [Google Scholar]
- Gratani, L. Plant Phenotypic Plasticity in Response to Environmental Factors. Adv. Bot. 2014, 2014, 208747. [Google Scholar] [CrossRef] [Scilit]
- Bano, C.; Amist, N.; Singh, N.B. Morphological and Anatomical Modifications of Plants for Environmental Stresses. In Molecular Plant Abiotic Stress; Wiley: Hoboken, NJ, USA, 2019; pp. 29–44. [Google Scholar]
- P’yankov, V.I.; Kondrachuk, A.V. Basic Types of Structural Changes in the Leaf Mesophyll during Adaptation of Eastern Pamir Plants to Mountain Conditions. Russ. J. Plant Physiol. 2003, 50, 28–35. [Google Scholar] [CrossRef] [Scilit]
- Wang, L.; Zhao, G.; Li, M.; Zhang, M.; Zhang, L.; Zhang, X.; An, L.; Xu, S. C:N:P Stoichiometry and Leaf Traits of Halophytes in an Arid Saline Environment, Northwest China. PLoS ONE 2015, 10, e0119935. [Google Scholar] [CrossRef] [Scilit]
- Chernetskyy, M.; Woźniak, A.; Skalska-Kamińska, A.; Żuraw, B.; Blicharska, E.; Rejdak, R.; Donica, H.; Weryszko-Chmielewska, E. Structure of leaves and phenolic acids in Kalanchoë daigremontiana Raym.-Hamet & H. Perrier. ACTA Sci. Pol. Cultus Hortorum 2018, 17, 137–155. [Google Scholar] [CrossRef] [Scilit]
- Quanying, D.; Zhi, L.; Shurun, L.; Hongyan, L. Dynamics of species diversity and characteristics of halophytic plant communities around saline lakes in arid and semi-arid regions of Inner Mongolia. Biodivers. Sci. 2007, 15, 271–281. [Google Scholar] [CrossRef] [Scilit]
- Nawazish, S.; Hameed, M.; Naurin, S. Leaf anatomical adaptations of Cenchrus ciliaris L., from the Salt Range, Pakistan against drought stress. Pak. J. Bot. 2006, 38, 1723–1730. [Google Scholar]
- Shepherd, T.; Wynne Griffiths, D. The effects of stress on plant cuticular waxes. New Phytol. 2006, 171, 469–499. [Google Scholar] [CrossRef] [Scilit]
- Zhang, J.; Liang, M.; Tong, S.; Qiao, X.; Li, B.; Yang, Q.; Chen, T.; Hu, P.; Yu, S. Response of leaf functional traits to soil nutrients in the wet and dry seasons in a subtropical forest on an island. Front. Plant Sci. 2023, 14, 1236607. [Google Scholar] [CrossRef] [Scilit]
- Xing, K.; Niinemets, Ü.; Rengel, Z.; Onoda, Y.; Xia, J.; Chen, H.Y.; Zhao, M.; Han, W.; Li, H. Global patterns of leaf construction traits and their covariation along climate and soil environmental gradients. New Phytol. 2021, 232, 1648–1660. [Google Scholar] [CrossRef] [Scilit]
- Guo, Y.; Guo, N.; He, Y.; Gao, J. Cuticular waxes in alpine meadow plants: Climate effect inferred from latitude gradient in Qinghai-Tibetan Plateau. Ecol. Evol. 2015, 5, 3954–3968. [Google Scholar] [CrossRef] [Scilit]
- Cabrita, P.J.V. Water exchange between the Chlorenchyma and the Hydrenchyma and its physiological role in leaves with Crassulacean acid metabolism. Physiol. Plant. 2024, 176, e14221. [Google Scholar] [CrossRef] [Scilit]
- Liu, M.-H.; Xin, Z.-M.; Xu, J.; Sun, F.; Dou, L.-J.; Li, Y.-H. Influence of leaf size of plant on leaf transpiration and temperature in arid regions. Chin. J. Plant Ecol. 2013, 37, 436. [Google Scholar] [CrossRef] [Scilit]
- Fujii, S.; Nishida, K.; Akitsu, T.K.; Kume, A.; Hanba, Y.T. Variation in leaf mesophyll anatomy of fern species imposes significant effects on leaf gas exchange, light capture, and leaf hydraulic conductance. Photosynthetica 2023, 61, 225–235. [Google Scholar] [CrossRef] [Scilit]
- Valladares, F.; Martinez-Ferri, E.; Balaguer, L.; Perez-Corona, E.; Manrique, E. Low leaf-level response to light and nutrients in Mediterranean evergreen oaks: A conservative resource-use strategy? New Phytol. 2000, 148, 79–91. [Google Scholar] [CrossRef] [Scilit]

Disclaimer/Publisher’s Note: The statements, opinions and data contained in all publications are solely those of the individual author(s) and contributor(s) and not of MDPI and/or the editor(s). MDPI and/or the editor(s) disclaim responsibility for any injury to people or property resulting from any ideas, methods, instructions or products referred to in the content. |
© 2026 by the authors. Licensee MDPI, Basel, Switzerland. This article is an open access article distributed under the terms and conditions of the Creative Commons Attribution (CC BY) license.