


Abstract
Selecting shrubs that maintain photosynthesis under salinity is essential for revegetating saline land in the Qaidam Basin, northwestern China. Potted seedlings of Nitraria tangutorum, Tamarix chinensis, Haloxylon ammodendron and Potentilla fruticosa were irrigated with 0, 100, 200, 400 or 600 mmol L−1 NaCl for 30 days, and leaf gas exchange (diurnal courses, temporal changes and light responses), growth, leaf water status and salt injury were measured. NaCl significantly reduced the net photosynthetic rate (Pn), stomatal conductance and transpiration rate of all species (repeated-measures ANOVA, p < 0.001), increasingly with salt concentration and treatment duration. After 30 days at 600 mmol L−1, Pn was 61.2%, 72.2%, 79.9% and 92.1% lower than in the control in T. chinensis, N. tangutorum, H. ammodendron and P. fruticosa, respectively (p < 0.05). Early declines were accompanied by a lower intercellular CO2 concentration and a higher stomatal limitation value, whereas after 25–30 days the stomatal limitation value of P. fruticosa and H. ammodendron under high salinity fell below that of the control, a pattern consistent with an increasing contribution of non-stomatal limitation. Salinity decreased the maximum net photosynthetic rate and apparent quantum yield and increased the light compensation point. N. tangutorum retained the highest absolute photosynthetic rates, whereas T. chinensis showed the smallest relative decline. A membership-function index ranked the short-term salt tolerance of the seedlings as T. chinensis > N. tangutorum > H. ammodendron > P. fruticosa; this ranking was reproduced by principal component analysis and in 92–100% of the alternative indicator weightings, indicator subsets and uncertainty simulations tested, with P. fruticosa ranking last in all cases. These results support T. chinensis and N. tangutorum as priority species for revegetating saline land, pending field validation.
1. Introduction
Soil salinization is a major constraint on vegetation restoration and land use in arid and semi-arid regions [1,2,3]. Salts accumulating in the root zone lower the soil water potential and first impose an osmotic stress on plants, which is followed by a slower ionic phase in which Na+ and Cl− accumulate in the leaves and accelerate their senescence [4,5,6]. In drylands, salinity commonly occurs together with water deficit, so that root water uptake, leaf water status, stomatal behavior and carbon assimilation are affected simultaneously [7,8]. The ability to sustain photosynthesis under saline conditions is therefore an important component of plant salt tolerance [9,10].
The Qaidam Basin, located in the northeastern Qinghai–Tibetan Plateau, is a high-altitude inland basin in which salt lakes and saline soils are widespread [11,12,13]. Precipitation is scarce and evaporation is strong, and water shortage and soil salt accumulation jointly restrict afforestation, shelterbelt construction and the development of shrub communities [14,15]. The soil salts of the basin are dominated by Na+, Ca2+, Cl− and SO42−; NaCl is concentrated in surface crusts, and strongly saline topsoils contain on average about 15 g kg−1 of soluble salts [13,16]. Identifying shrub species that can maintain physiological function in such soils is therefore essential for improving the success of revegetation and the use of saline land in the region [17,18].
Photosynthesis is one of the processes most sensitive to salinity [7,9]. Its decline can result from stomatal limitation, when stomatal closure restricts the diffusion of CO2 to the chloroplasts, or from non-stomatal limitation, when mesophyll conductance, photochemistry or carboxylation capacity are impaired [19,20,21]. Stomatal limitation is generally considered to dominate under mild or short-term stress, whereas non-stomatal limitation becomes increasingly important as salt accumulates in the leaves [5,7,21]. Because these limitations change with the intensity and duration of stress and with the diurnal course of light, temperature and evaporative demand, a single measurement rarely characterizes the photosynthetic response of a species [10,22]. Diurnal courses reveal how stomatal regulation interacts with daytime environmental fluctuations, repeated measurements during the stress period reveal how the response develops with time, and light-response curves describe photosynthetic capacity and light-use efficiency under controlled conditions [23,24].
Nitraria tangutorum, Tamarix chinensis and Haloxylon ammodendron are widely used to stabilize sand and to revegetate degraded land in arid northwestern China. N. tangutorum is a succulent-leaved xerophyte that dominates sandy deserts of the eastern Qaidam Basin [14,25]; T. chinensis is a salt-secreting shrub of saline lowlands [26,27]; and H. ammodendron is a C4 xero-halophyte that photosynthesizes through green assimilating shoots [28,29,30]. Potentilla fruticosa (=Dasiphora fruticosa), in contrast, is a cold-tolerant shrub of alpine meadows and shrublands on the Qinghai–Tibetan Plateau [31]; it is also used in local revegetation, but its tolerance of saline soils has rarely been tested. Although the responses of some of these species to salinity or drought have been examined separately [27,32,33,34], the four species have not been compared under identical conditions. Moreover, studies differ in whether salt tolerance is judged from absolute photosynthetic rates or from the relative decline compared with the control, which can lead to contrasting rankings [10]. Integrating several indicators into one index, for example, by membership functions or principal component analysis, reduces the dependence of a ranking on any single variable [35,36], but the result can still depend on how the indicators are selected and weighted, so its robustness should be tested [37].
In this study, potted seedlings of the four species were exposed to five NaCl levels (0–600 mmol L−1) for 30 days at an experimental site in the Qaidam Basin. We measured the diurnal courses of leaf gas exchange, the changes in gas exchange during the treatment period and the light-response curves, together with seedling growth, leaf water status and visible salt injury. The objectives were (1) to quantify the short-term photosynthetic responses of the four species to NaCl; (2) to determine whether the decline in photosynthesis was mainly stomatal or non-stomatal and how this changed with salt concentration and stress duration; and (3) to rank the salt tolerance of the species with an explicitly defined integrated index based on their performance relative to the control and to test whether this ranking is robust to the weighting and selection of the indicators. We hypothesized that the three species from arid or saline habitats (T. chinensis, N. tangutorum and H. ammodendron) would maintain photosynthesis better than the alpine P. fruticosa, and that stomatal limitation would predominate at low salinity and early in the treatment, whereas non-stomatal limitation would increase at high salinity and with time. The data reported here have not been published previously.
2. Materials and Methods
2.1. Study Site
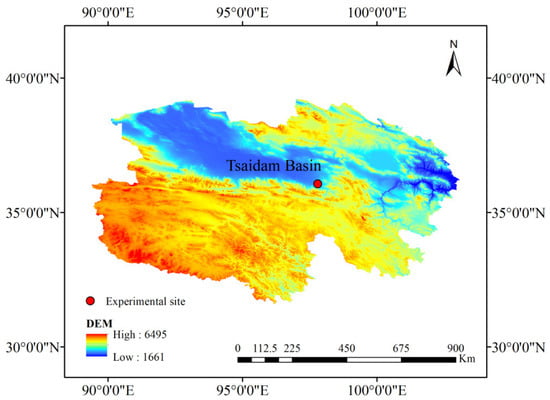
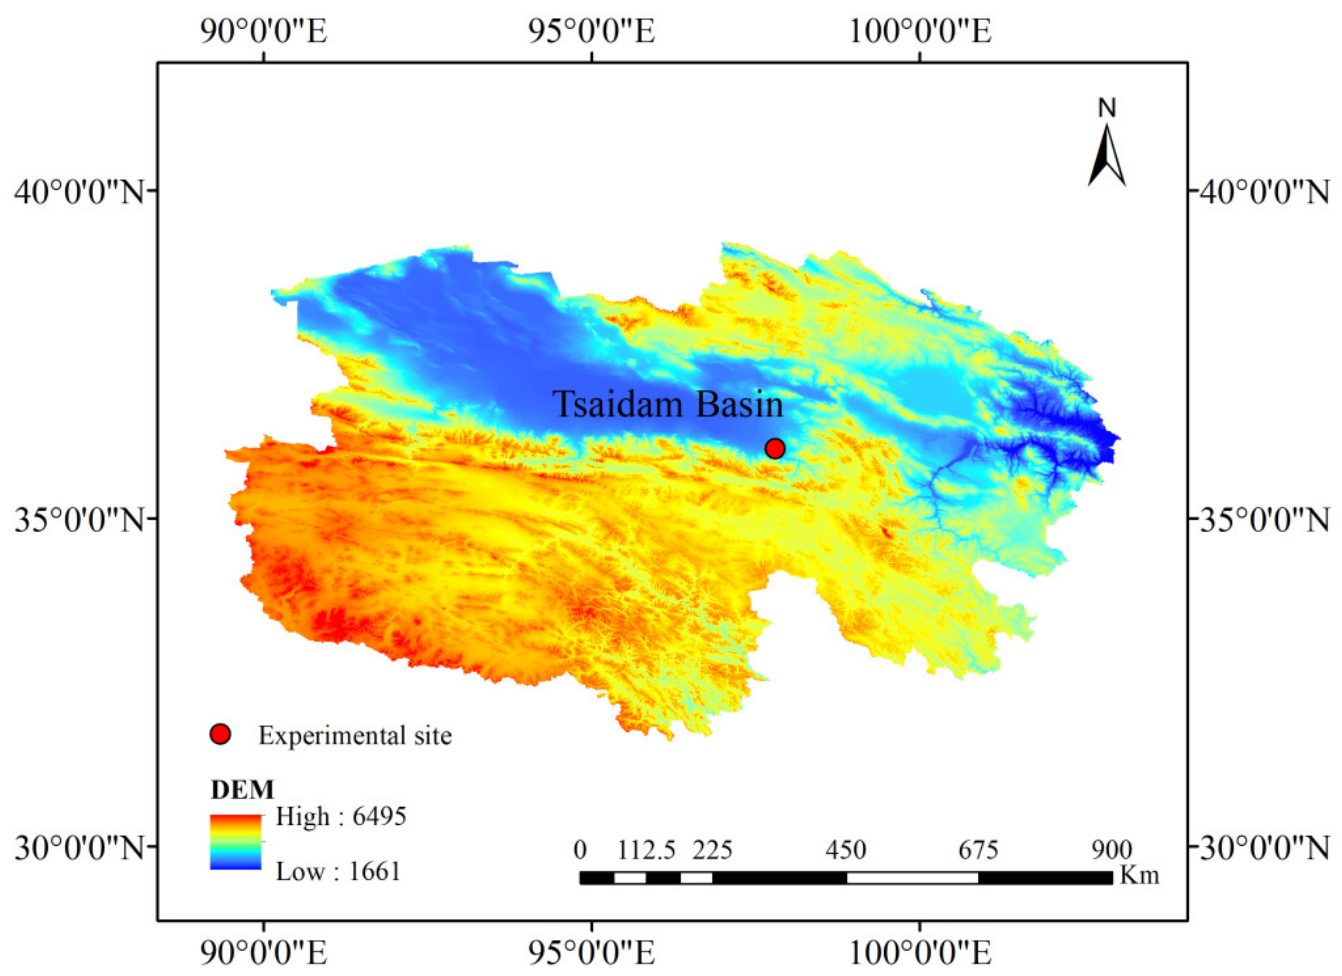
The experiment was conducted at the experimental base of the Xiangride Irrigation Area (36°04′ N, 97°48′ E; 2973–3045 m a.s.l.), Dulan County, Qinghai Province, on the southeastern margin of the Qaidam Basin (Figure 1). The irrigation area is about 10 km wide from east to west and 20 km long from north to south, covering approximately 200 km2. The climate is arid with strong solar radiation: the mean annual air temperature is 3.1–4.4 °C, the frost-free period is 89–109 d, the annual precipitation is 66.8–248.3 mm, the annual evaporation is 2285.4 mm, and the humidity coefficient is 0.20–0.49 (data from the Dulan County Meteorological Station).
Figure 1.
Location of the experimental site (red dot; Xiangride Irrigation Area, Dulan County) in the Qaidam (Tsaidam) Basin, shown on a digital elevation model (DEM, m a.s.l.) of Qinghai Province, China.
2.2. Plant Material and Experimental Design
Four shrub species were studied (Table 1): Nitraria tangutorum Bobrov, Tamarix chinensis Lour., Haloxylon ammodendron (C.A.Mey.) Bunge and Potentilla fruticosa L. [syn. Dasiphora fruticosa (L.) Rydb.]. H. ammodendron is a C4 species [28,29], whereas the other three species are C3 plants. Uniform two-year-old seedlings raised from seed in the nursery of the experimental base were transplanted in late April 2024 into plastic pots (30 cm in diameter and 35 cm deep; one seedling per pot) filled with 20 kg of air-dried local sandy loam collected at the experimental base and sieved through a 5 mm mesh; the substrate was non-saline, with a soluble salt content below 1.0 g kg−1. The pots were kept outdoors at the experimental base under natural light and temperature and were protected from rainfall by a movable transparent rain shelter. Before the treatments, all seedlings were watered regularly for about 15 weeks to allow establishment.
Table 1.
Characteristics of the four shrub species studied.
Five NaCl treatments were applied: CK (0 mmol L−1), Y1 (100 mmol L−1), Y2 (200 mmol L−1), Y3 (400 mmol L−1) and Y4 (600 mmol L−1). Analytical-grade NaCl was dissolved in tap water, and 500 mL of solution was applied to each pot every 5 days (on days 0, 5, 10, 15, 20 and 25), starting on 9 August 2024 (day 0); the CK pots received the same volume of tap water. The solutions were applied at their final concentrations from the first application. Between salt applications, the pots were watered with tap water as required, and the soil volumetric water content, monitored by time-domain reflectometry (TDR 300, Spectrum Technologies, Aurora, IL, USA), was kept above 16.8% so that the treatments differed in salinity but not in water supply. The treatment lasted 30 days (9 August–8 September 2024). Each species × treatment combination comprised three pots (n = 3) arranged in a completely randomized design. Because the salt was added repeatedly, the salinity of the soil solution probably increased during the experiment; the treatment concentrations therefore denote the concentrations of the applied solutions rather than the soil salinity actually reached [10].
2.3. Gas Exchange Measurements
Leaf gas exchange was measured with an LI-6400 portable photosynthesis system (LI-COR, Lincoln, NE, USA) equipped with a standard 2 cm × 3 cm leaf chamber and a red/blue LED light source (6400-02B, LI-COR Biosciences, Lincoln, NE, USA). Recently matured, fully expanded, sun-exposed leaves in the upper crown were measured (green scale-leaved branchlets in T. chinensis and assimilating shoots in H. ammodendron); one leaf per seedling was measured on three seedlings per treatment (n = 3). The air flow rate through the chamber was 500 μmol s−1. Because the leaflets of P. fruticosa, the scale-leaved branchlets of T. chinensis and the cylindrical shoots of H. ammodendron did not completely fill the chamber window, the enclosed tissue was marked, excised after the measurements, and its projected area was determined from digital photographs taken against a white background with a scale bar and analyzed with ImageJ 1.8.0 (National Institutes of Health, Bethesda, MD, USA) [39]; all fluxes were recalculated per unit projected area [40]. The net photosynthetic rate (Pn, μmol m−2 s−1), transpiration rate (E, mmol m−2 s−1), stomatal conductance to water vapor (gs, mol m−2 s−1) and intercellular CO2 concentration (Ci, μmol mol−1) were recorded.
2.3.1. Diurnal Courses
Diurnal courses were measured on clear days from 4 to 7 September 2024 (days 26–29 of the NaCl treatment; one or two species per day) at 2 h intervals from 07:00 to 19:00 (Beijing time): T. chinensis and H. ammodendron on 4 September (day 26), P. fruticosa on 5 September (day 27) and N. tangutorum on 7 September (day 29), with all five NaCl treatments of a species measured on the same day (Table S1). The leaves were measured under ambient light, temperature, humidity and CO2 concentration (reference CO2 concentration 371–389 μmol mol−1) using the clear-top leaf chamber (6400-08, LI-COR Biosciences, Lincoln, NE, USA) under natural light. The weather on each measurement day and the microclimate recorded on 4 September are given in Table S1. Because each species was measured on a single day, differences among species in the diurnal data cannot be separated from day-to-day differences in weather. The diurnal data were therefore used to compare the NaCl treatments within each species, whereas absolute differences among species were assessed mainly from the multi-day measurements, which were made on the same days for all species at a fixed PPFD, and from the light-response curves, which were measured under controlled chamber conditions (Section 2.3.2 and Section 2.3.3).
2.3.2. Changes During the Treatment Period
Gas exchange was measured on days 5, 10, 15, 20, 25 and 30 after the first NaCl application, between 09:00 and 11:00 on clear mornings, on the same marked leaves, at a photosynthetic photon flux density (PPFD) of 1200 μmol m−2 s−1 supplied by the LED light source and ambient reference CO2 concentration (≈380 μmol mol−1). On the days of salt application, the measurements were made before the solutions were applied.
2.3.3. Light-Response Curves
Light-response curves were measured on days 21–23 of the treatment (30 August–1 September 2024) between 09:00 and 11:30 on the same seedlings as used for the diurnal measurements. After the leaves had been acclimated at a PPFD of 1800 μmol m−2 s−1 for 15 min, Pn was recorded at PPFDs of 2500, 2200, 2000, 1800, 1600, 1400, 1200, 1000, 800, 600, 400, 200, 150, 100, 50 and 0 μmol m−2 s−1, in descending order, with a waiting time of 120–200 s at each step. The reference CO2 concentration was maintained at 400 μmol mol−1 with a CO2 injector (6400-01), leaf temperature at 25 ± 1 °C and the relative humidity of the reference air at 50–60%.
2.4. Growth, Leaf Water Status and Salt Injury
Plant height and basal stem diameter were measured at the beginning and the end of the treatment with a ruler and a digital caliper, and their increments over the 30 days were calculated. Because the shoots for the leaf water-potential measurements were taken from one seedling per treatment (from two seedlings in H. ammodendron, whose assimilating shoots are few and thin), the increments were obtained from the remaining two seedlings per treatment (n = 2) and from one seedling (n = 1) in H. ammodendron. Visible salt injury was scored for each treatment (three pots together) on days 15, 20, 25 and 30 on a 0–5 scale (0, no symptoms; 1, chlorosis or necrosis at the tips or margins of a few leaves; 2, symptoms on less than 25% of the leaves; 3, symptoms on 25–50% of the leaves; 4, symptoms on more than 50% of the leaves or marked leaf shedding; 5, plant death). Leaf relative water content (RWC) was determined at the end of the treatment on one composite sample of fully expanded leaves from the three seedlings of each treatment as RWC = (FW − DW)/(TW − DW) × 100, where FW, TW and DW are the fresh, turgid (after rehydration in deionized water for 12 h at 4 °C in darkness) and oven-dry (70 °C, 48 h) weights [41]. Leaf water potential was measured at dawn (07:00) and at 2 h intervals during the diurnal measurements on one shoot per treatment at each time with a pressure chamber (Model 1000, PMS Instrument Company, Albany, OR, USA); the dawn value and the daily mean are reported. Because RWC, leaf water potential and the injury score were thus determined once per treatment, they are reported without SE, and their influence on the salt-tolerance ranking was examined separately (Section 2.5). The survival of all seedlings was recorded at the end of the experiment.
2.5. Data Analysis
Instantaneous water use efficiency was calculated as WUE = Pn/E (μmol mmol−1) [42]. The stomatal limitation value was calculated as Ls = 1 − Ci/Ca [43], where Ca is the reference CO2 concentration (≈380 μmol mol−1). Following Farquhar and Sharkey [19], a decrease in Pn accompanied by decreasing Ci and increasing Ls was interpreted as predominantly stomatal limitation, whereas a decrease in Pn with unchanged or increasing Ci and decreasing Ls was interpreted as an increasing contribution of non-stomatal limitation. Because Ci estimates become unreliable when gs is very low [40] and Ci is less diagnostic in C4 plants, which concentrate CO2 in the bundle sheath [44], Ls was used as an indicator only, and the values of H. ammodendron were interpreted with caution. Ls was calculated from the multi-day measurements, in which Ci was available for all species and dates, and averaged over the early (days 5–15) and late (days 25–30) phases of the treatment.
Light-response curves were fitted with the modified rectangular hyperbola model [23]: Pn = α(1 − βI)I/(1 + γI) − Rd, where I is the PPFD, α is the initial slope, β and γ are coefficients describing photoinhibition and saturation, and Rd is the dark respiration rate. The light saturation point (LSP) and the maximum net photosynthetic rate (Pnmax) were derived from the fitted parameters as LSP = [((β + γ)/β)1/2 − 1]/γ and Pnmax = α[((β + γ)1/2 − β1/2)/γ]2 − Rd [23]. Because the light compensation point (LCP) and Rd obtained from non-linear models depend strongly on the fit at high PPFD [24], the apparent quantum yield (AQY) and Rd were estimated as the slope and the absolute value of the intercept of a linear regression of Pn on PPFD over 0–200 μmol m−2 s−1, LCP was calculated as Rd/AQY [24], and this Rd was used in the non-linear fit. The models were fitted to the treatment means by non-linear least squares, and the standard errors (SEs) of the parameters were obtained by parametric bootstrapping (1000 resamples, each mean being drawn from a normal distribution defined by its mean and SE) [45]. Differences between each NaCl treatment and CK were tested with z-tests based on the bootstrap SEs. The gs, E, WUE and Ci values recorded during the light-response measurements were not analyzed, because gs responds to step changes in PPFD about an order of magnitude more slowly than Pn [46,47] and therefore did not reach a steady state during the short light steps.
Gas-exchange data are presented as means ± SE (n = 3 seedlings); the sample sizes of the growth and water-status variables are given in Section 2.4. Because the same seedlings were measured repeatedly during the day and during the treatment period, the diurnal and multi-day measurements were analyzed by repeated-measures (split-plot) ANOVA with the seedling as the subject, NaCl treatment and, for the multi-day data, species as between-seedling factors and time (time of day or day of treatment) as the within-seedling factor [48]; for balanced data, this model is equivalent to a linear mixed model with a random intercept for each seedling [49]. Because the species were measured on different days in the diurnal courses (Section 2.3.1), the diurnal data were analyzed separately for each species, whereas the multi-day data, which were recorded on the same days for all species, were analyzed with a three-way model (species × NaCl × time). The gas-exchange data were available as the mean and SE of the three seedlings for each species, treatment and measurement time, which do not allow the between- and within-seedling error terms to be estimated separately. Both error terms were therefore set to their upper limits: between-seedling effects were tested on the seedling means over time, whose SE was taken as the mean of the SEs at the individual times (the maximum, reached when the repeated measurements of a seedling are perfectly correlated), and within-seedling effects were tested against the pooled variance among seedlings at each time (the maximum for non-negative within-seedling correlations), with the degrees of freedom reduced by the Greenhouse–Geisser lower-bound correction, ε = 1/(t − 1), where t is the number of measurement times [50]. The resulting tests are conservative. Within each species, the daily means of the diurnal measurements, which are seedling-level summary measures [51], were compared among NaCl treatments by one-way ANOVA followed by Tukey’s honestly significant difference (HSD) test using the same conservative SE, and the values on day 30, which involve no repeated measurements, were compared by one-way ANOVA followed by Tukey’s HSD test. Differences were considered significant at p < 0.05. The analyses were performed with SciPy 1.17 [52] and statsmodels 0.14 [53] in Python 3.12.
Salt tolerance was defined as the ability of a species to maintain photosynthetic function, growth and water status under NaCl relative to its own control [5,10], so that species with different absolute photosynthetic capacities could be compared. For each species and NaCl level (Y1–Y4), 11 indicators were expressed relative to CK: the daily means of Pn and gs in the diurnal measurements, Pn and gs on day 30, Pnmax, AQY, LCP, the increments in height and basal diameter, RWC, and the salt injury score on day 30. WUE was not included, because an increase in WUE under stress may result from stomatal closure rather than from improved performance [42]. The membership value of each indicator was calculated as μ = (X − Xmin)/(Xmax − Xmin) for indicators positively related to tolerance and as μ = 1 − (X − Xmin)/(Xmax − Xmin) for indicators negatively related to tolerance (LCP and salt injury), where Xmin and Xmax are the minimum and maximum values across all species and NaCl levels [35,54]. The comprehensive evaluation value (D) of a species was the mean membership value over the 11 indicators and four NaCl levels, so that all indicators were weighted equally. Equal weighting was used because no independent information on the relative importance of the indicators was available; however, 7 of the 11 indicators describe leaf gas exchange and are likely to be correlated, which gives this process a larger implicit weight. A principal component analysis (PCA) of the standardized relative values [36] was therefore used as a complementary summary of the same indicators that takes their correlations into account, and the robustness of the ranking was evaluated in three ways [37]. First, D was recalculated with alternative weights: equal weights for three groups of indicators (gas exchange, growth, and water status and salt injury), objective weights from the CRITIC method, which reduces the weight of indicators that are strongly correlated with the others [55], entropy weights [56], and 10,000 sets of random weights drawn from a flat Dirichlet distribution. Second, D was recalculated for each of the 11 subsets that omit one indicator and for all 1981 subsets of at least three indicators, including those without the growth or water-status variables and those without the two indicators from the diurnal measurements, in which species were confounded with measurement date. Third, measurement uncertainty was propagated by 10,000 Monte Carlo simulations in which each indicator was resampled from a normal distribution defined by its mean and SE; for the single H. ammodendron seedling, the pooled coefficient of variation in the growth increments of the other three species was used, and RWC and the injury score, for which no SE was available, were kept constant. For each analysis, the proportion of cases that reproduced the ranking based on D was recorded.
3. Results
3.1. Diurnal Courses of Leaf Gas Exchange
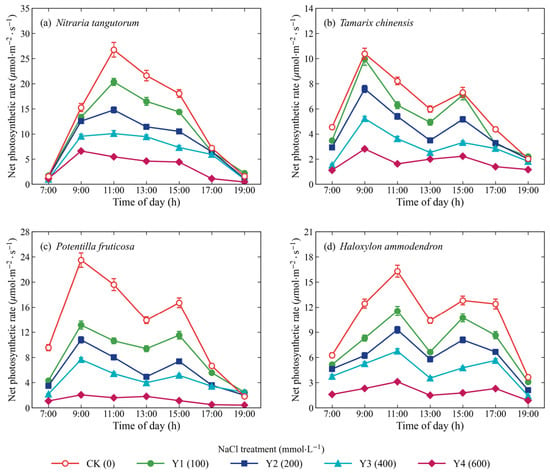
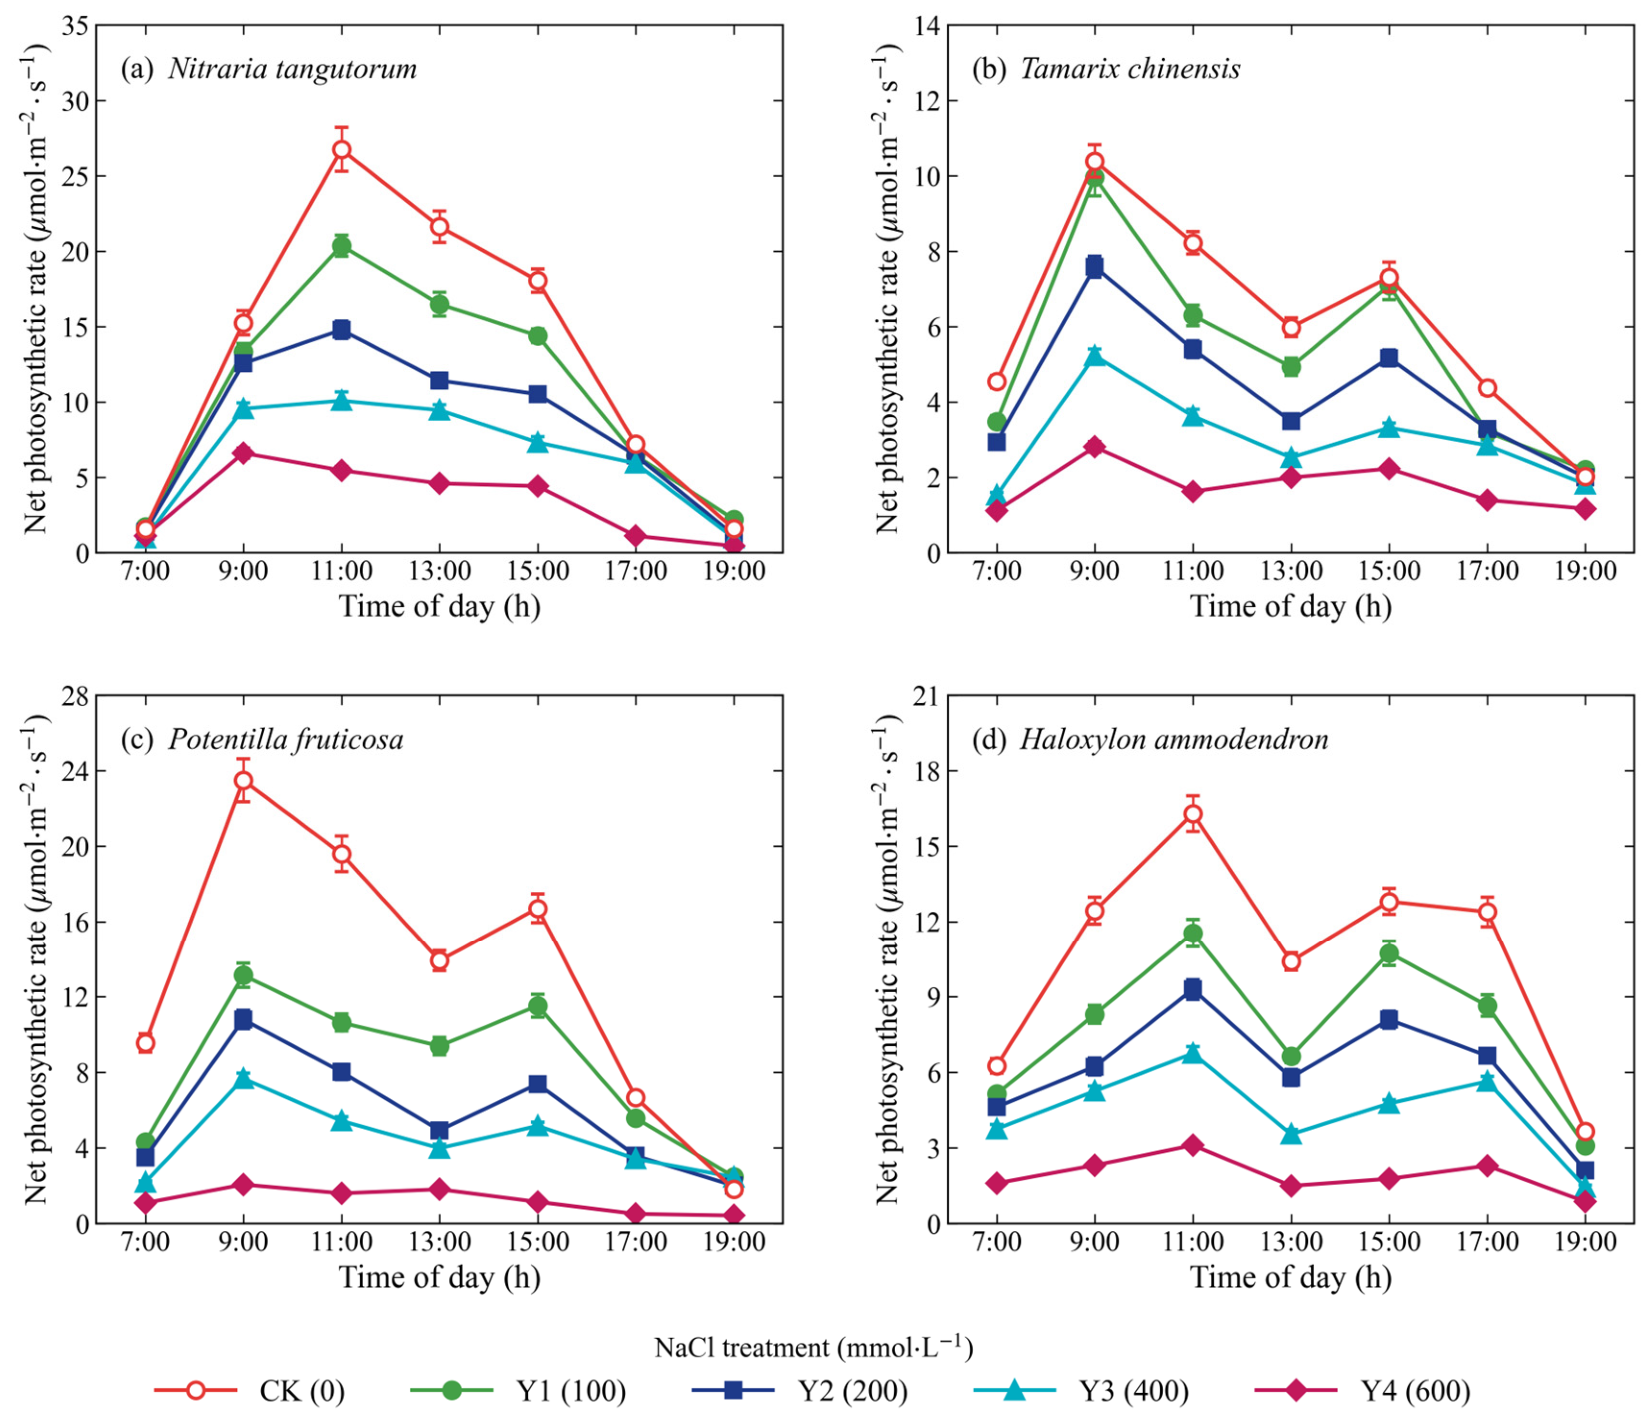
Within each species, Pn, E and gs were significantly affected by NaCl treatment, time of day and their interaction (p < 0.01), whereas WUE changed significantly with time of day in all species but was affected by NaCl only in P. fruticosa (repeated-measures ANOVA; Table 2). In N. tangutorum, Pn showed a single-peaked diurnal course with a maximum at 11:00 under CK and Y1–Y3, whereas under Y4 the peak advanced to 09:00 (Figure 2a). The other three species showed bimodal courses with a midday depression at 13:00; the peaks occurred at 09:00 and 15:00 in T. chinensis and P. fruticosa and at 11:00 and 15:00 in H. ammodendron (Figure 2b–d). Under Y4, the diurnal courses of all species became flat, and Pn of P. fruticosa remained below 2.1 μmol m−2 s−1 throughout the day.
Table 2.
Daily mean net photosynthetic rate (Pn), transpiration rate (E), stomatal conductance (gs) and water use efficiency (WUE) of the four species under five NaCl treatments, and repeated-measures ANOVA of the diurnal measurements within each species.
Figure 2.
Diurnal courses of the net photosynthetic rate (Pn) of seedlings of (a) Nitraria tangutorum, (b) Tamarix chinensis, (c) Potentilla fruticosa and (d) Haloxylon ammodendron under five NaCl treatments (CK, 0; Y1, 100; Y2, 200; Y3, 400; Y4, 600 mmol L−1). Measurements were made at 2 h intervals on clear days on days 26–29 of the treatment (T. chinensis and H. ammodendron on day 26, P. fruticosa on day 27 and N. tangutorum on day 29; Table S1). Values are means ± SE (n = 3).
The daily mean Pn decreased with increasing NaCl concentration in all species and was significantly lower than CK under all NaCl treatments except Y1 in T. chinensis (Table 2). Compared with CK, the daily mean Pn under Y1–Y4 decreased by 13.3–71.2% in T. chinensis, 18.5–74.1% in N. tangutorum, 27.2–81.9% in H. ammodendron and 37.9–90.6% in P. fruticosa, and the daily maxima declined in the same order (by 4.1–73.0%, 23.8–75.3%, 29.2–81.0% and 44.2–91.2%, respectively). N. tangutorum nevertheless had the highest daily mean Pn at every NaCl level (13.15 μmol m−2 s−1 under CK and 3.40 μmol m−2 s−1 under Y4), whereas P. fruticosa, whose daily mean Pn under CK was similar to that of N. tangutorum, had the lowest value under Y4 (1.24 μmol m−2 s−1). Because the species were measured on different days, these absolute differences among species may partly reflect differences in weather; however, the same pattern was found in the multi-day and light-response measurements (Section 3.2 and Section 3.3).
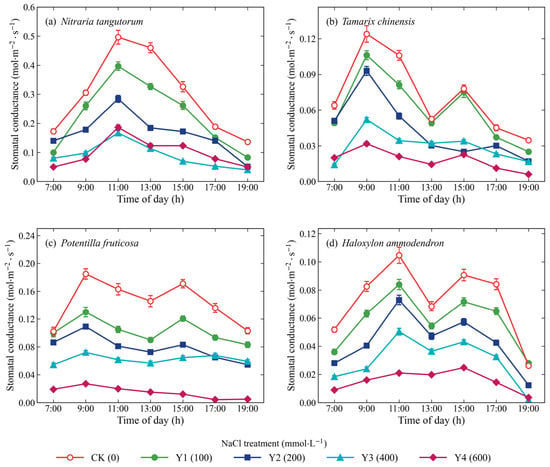
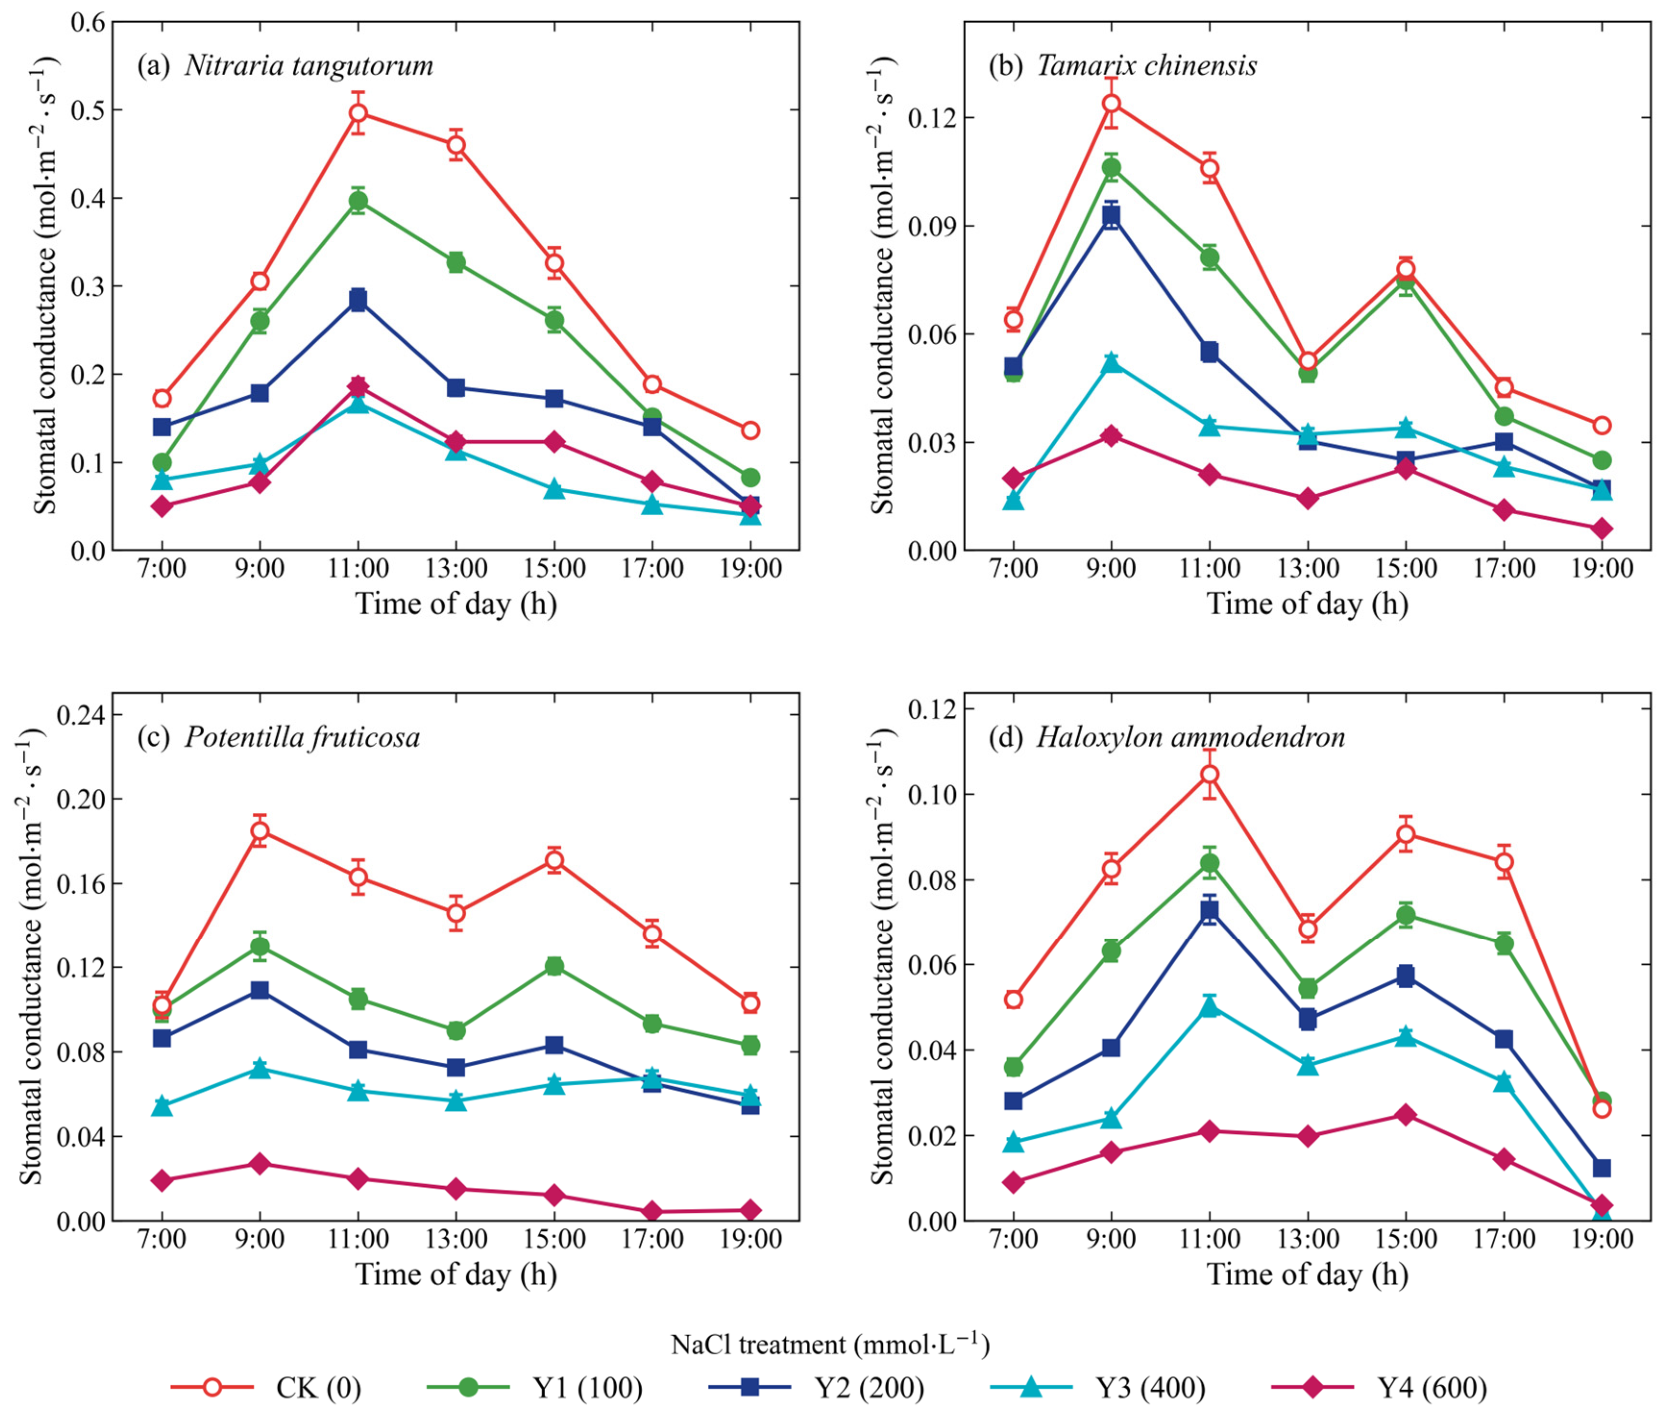
The diurnal courses of gs paralleled those of Pn (Figure 3), and those of E showed the same pattern (Figure S1). The daily mean gs was significantly lower than CK under all NaCl treatments, by 16.1–74.8% in T. chinensis, 20.9–78.6% in H. ammodendron, 24.3–67.1% in N. tangutorum and 28.2–89.8% in P. fruticosa; it did not differ significantly between Y3 and Y4 in N. tangutorum or between Y2 and Y3 in P. fruticosa (Table 2). The daily mean E decreased by 12.8–71.8%, 17.0–73.8%, 19.7–81.8% and 28.0–86.4% in T. chinensis, N. tangutorum, H. ammodendron and P. fruticosa, respectively, significantly so under all NaCl treatments except Y1 in T. chinensis.
Figure 3.
Diurnal courses of stomatal conductance (gs) of seedlings of (a) Nitraria tangutorum, (b) Tamarix chinensis, (c) Potentilla fruticosa and (d) Haloxylon ammodendron under five NaCl treatments (CK, 0; Y1, 100; Y2, 200; Y3, 400; Y4, 600 mmol L−1). Values are means ± SE (n = 3).
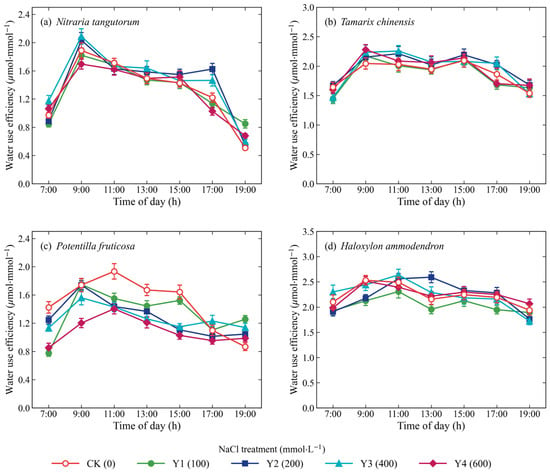
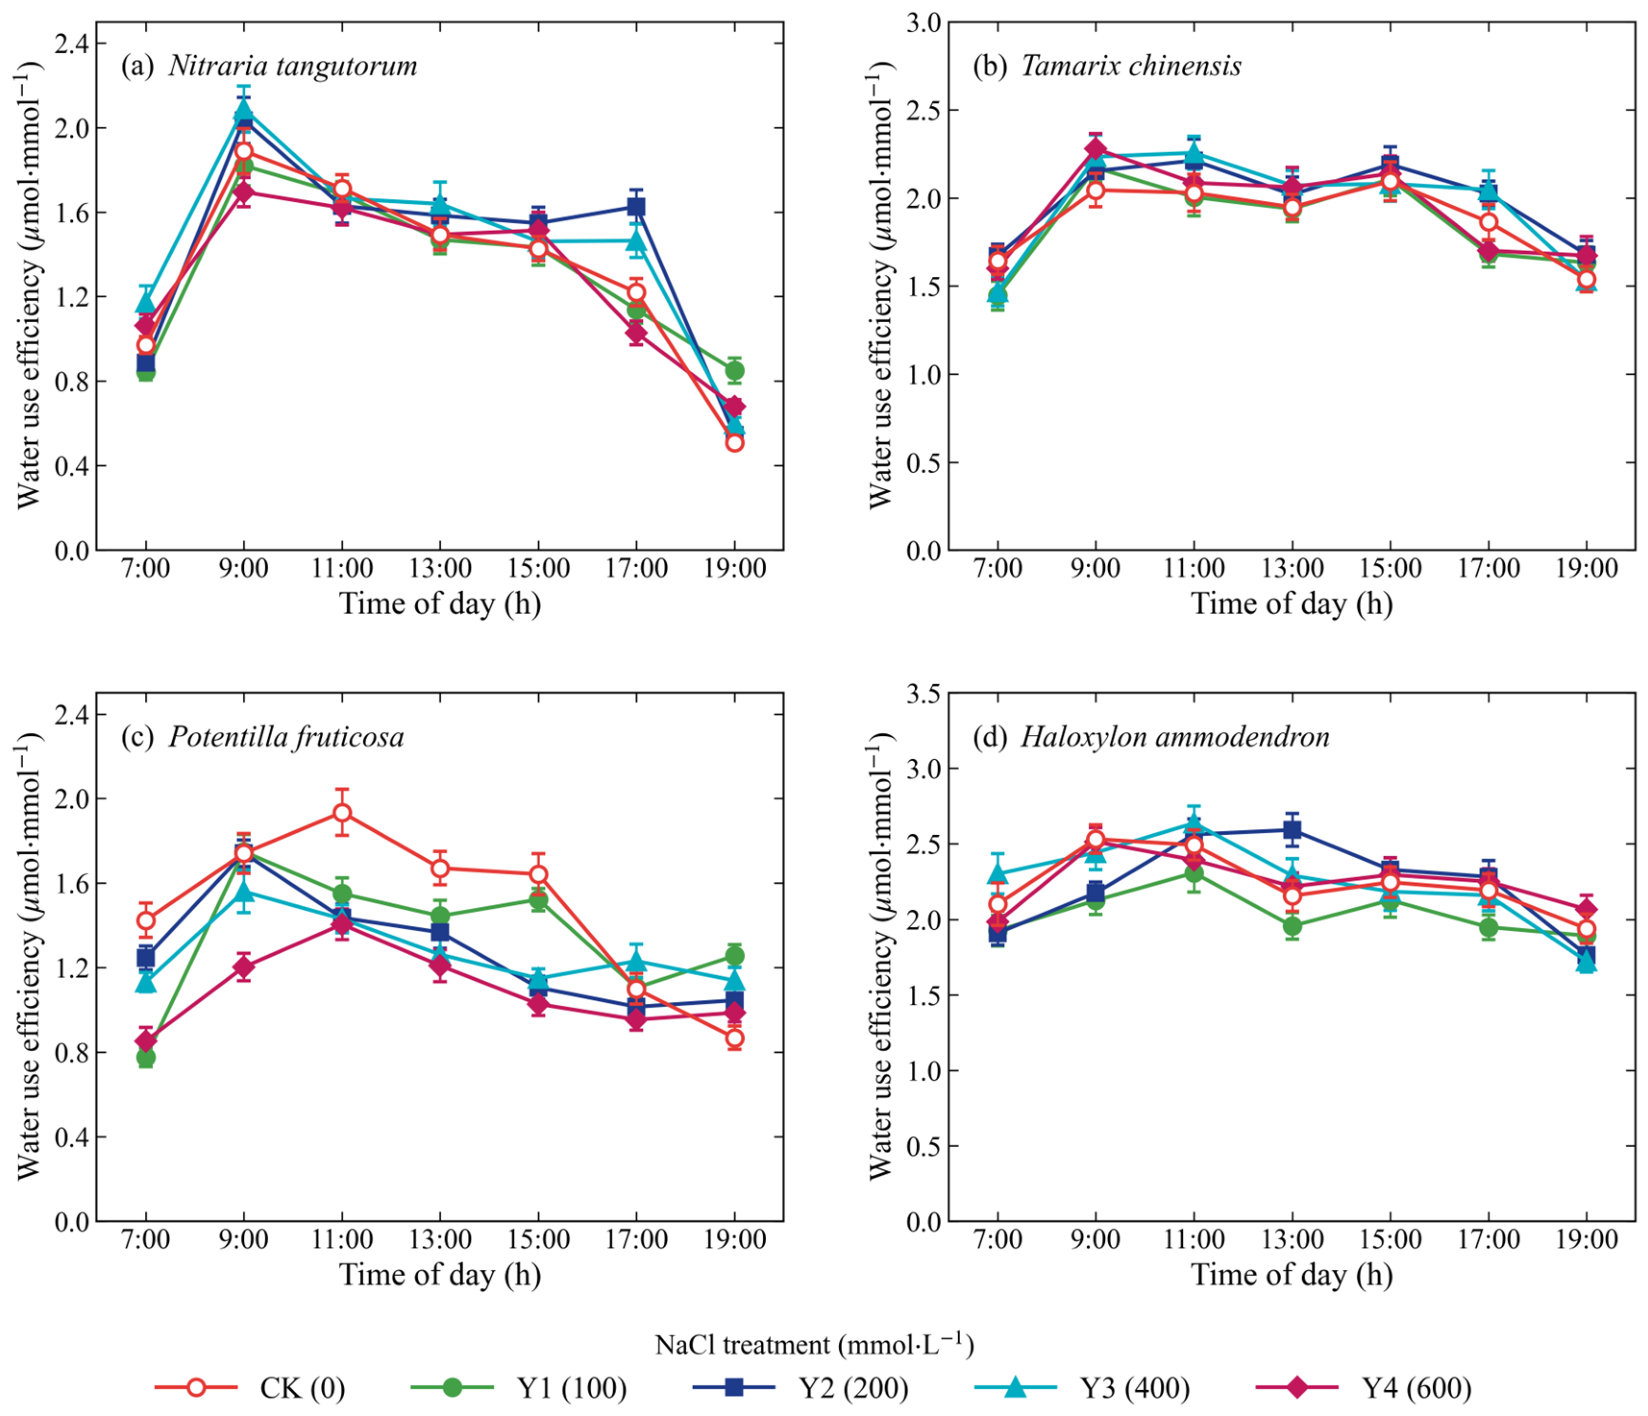
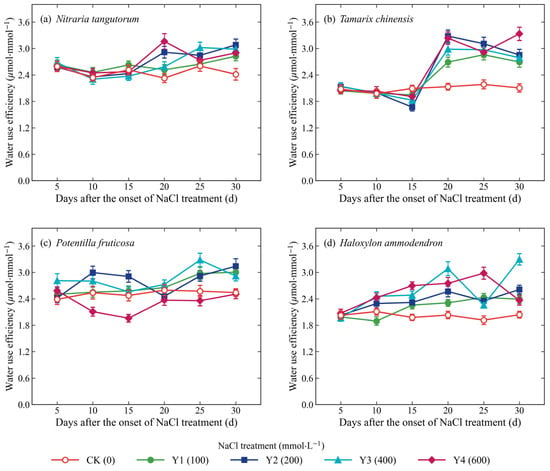
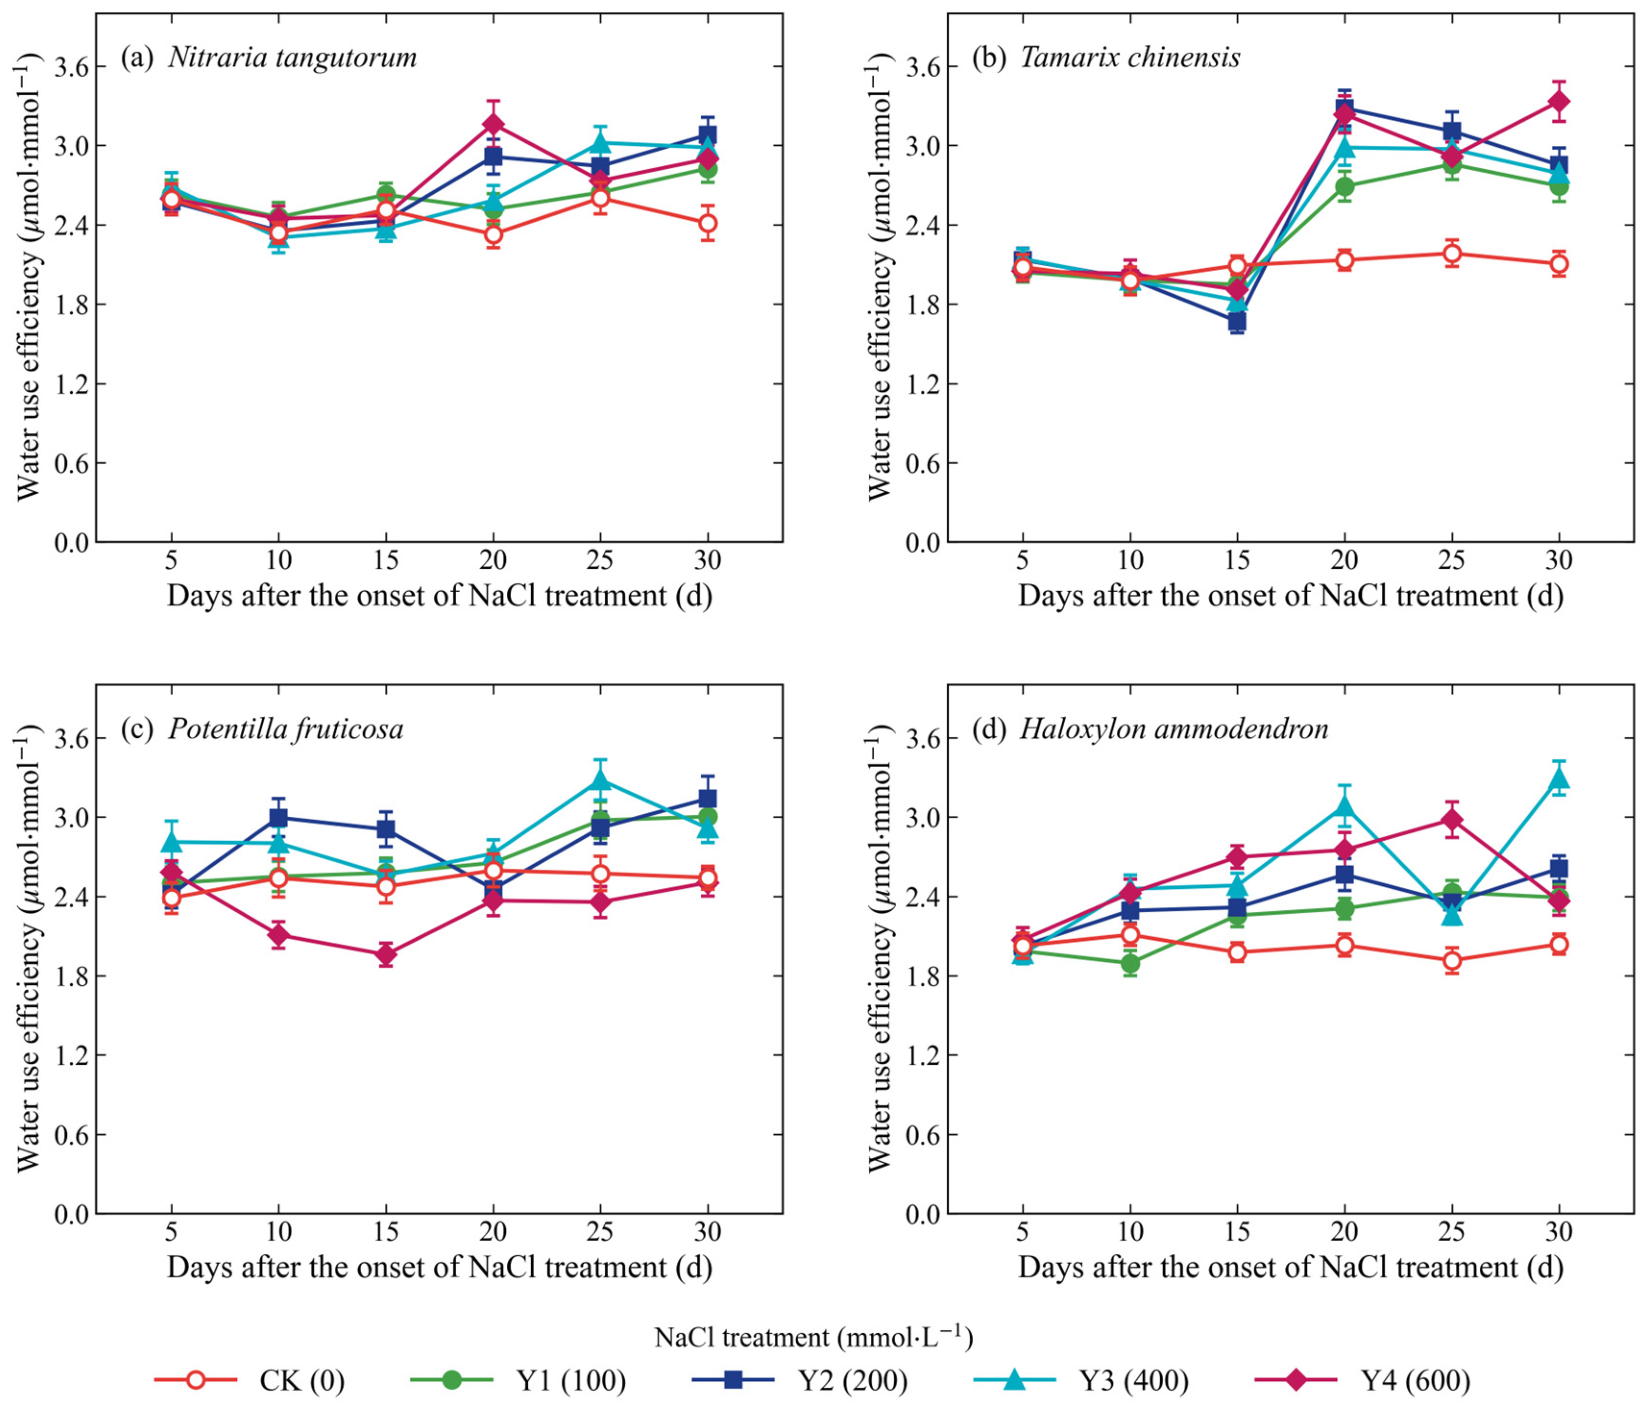
In contrast to Pn and gs, the daily mean WUE was only weakly affected by NaCl (Table 2; Figure 4). It did not differ significantly among NaCl treatments in N. tangutorum, T. chinensis and H. ammodendron (changes of −8.8% to +9.4% relative to CK), whereas in P. fruticosa it decreased by 9.4–26.4%, significantly so under Y4.
Figure 4.
Diurnal courses of instantaneous water use efficiency (WUE = Pn/E) of seedlings of (a) Nitraria tangutorum, (b) Tamarix chinensis, (c) Potentilla fruticosa and (d) Haloxylon ammodendron under five NaCl treatments (CK, 0; Y1, 100; Y2, 200; Y3, 400; Y4, 600 mmol L−1). Values are means ± SE (n = 3).
3.2. Changes in Leaf Gas Exchange During 30 Days of NaCl Treatment
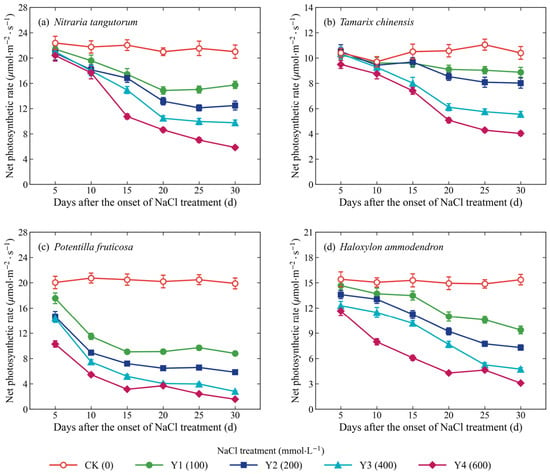
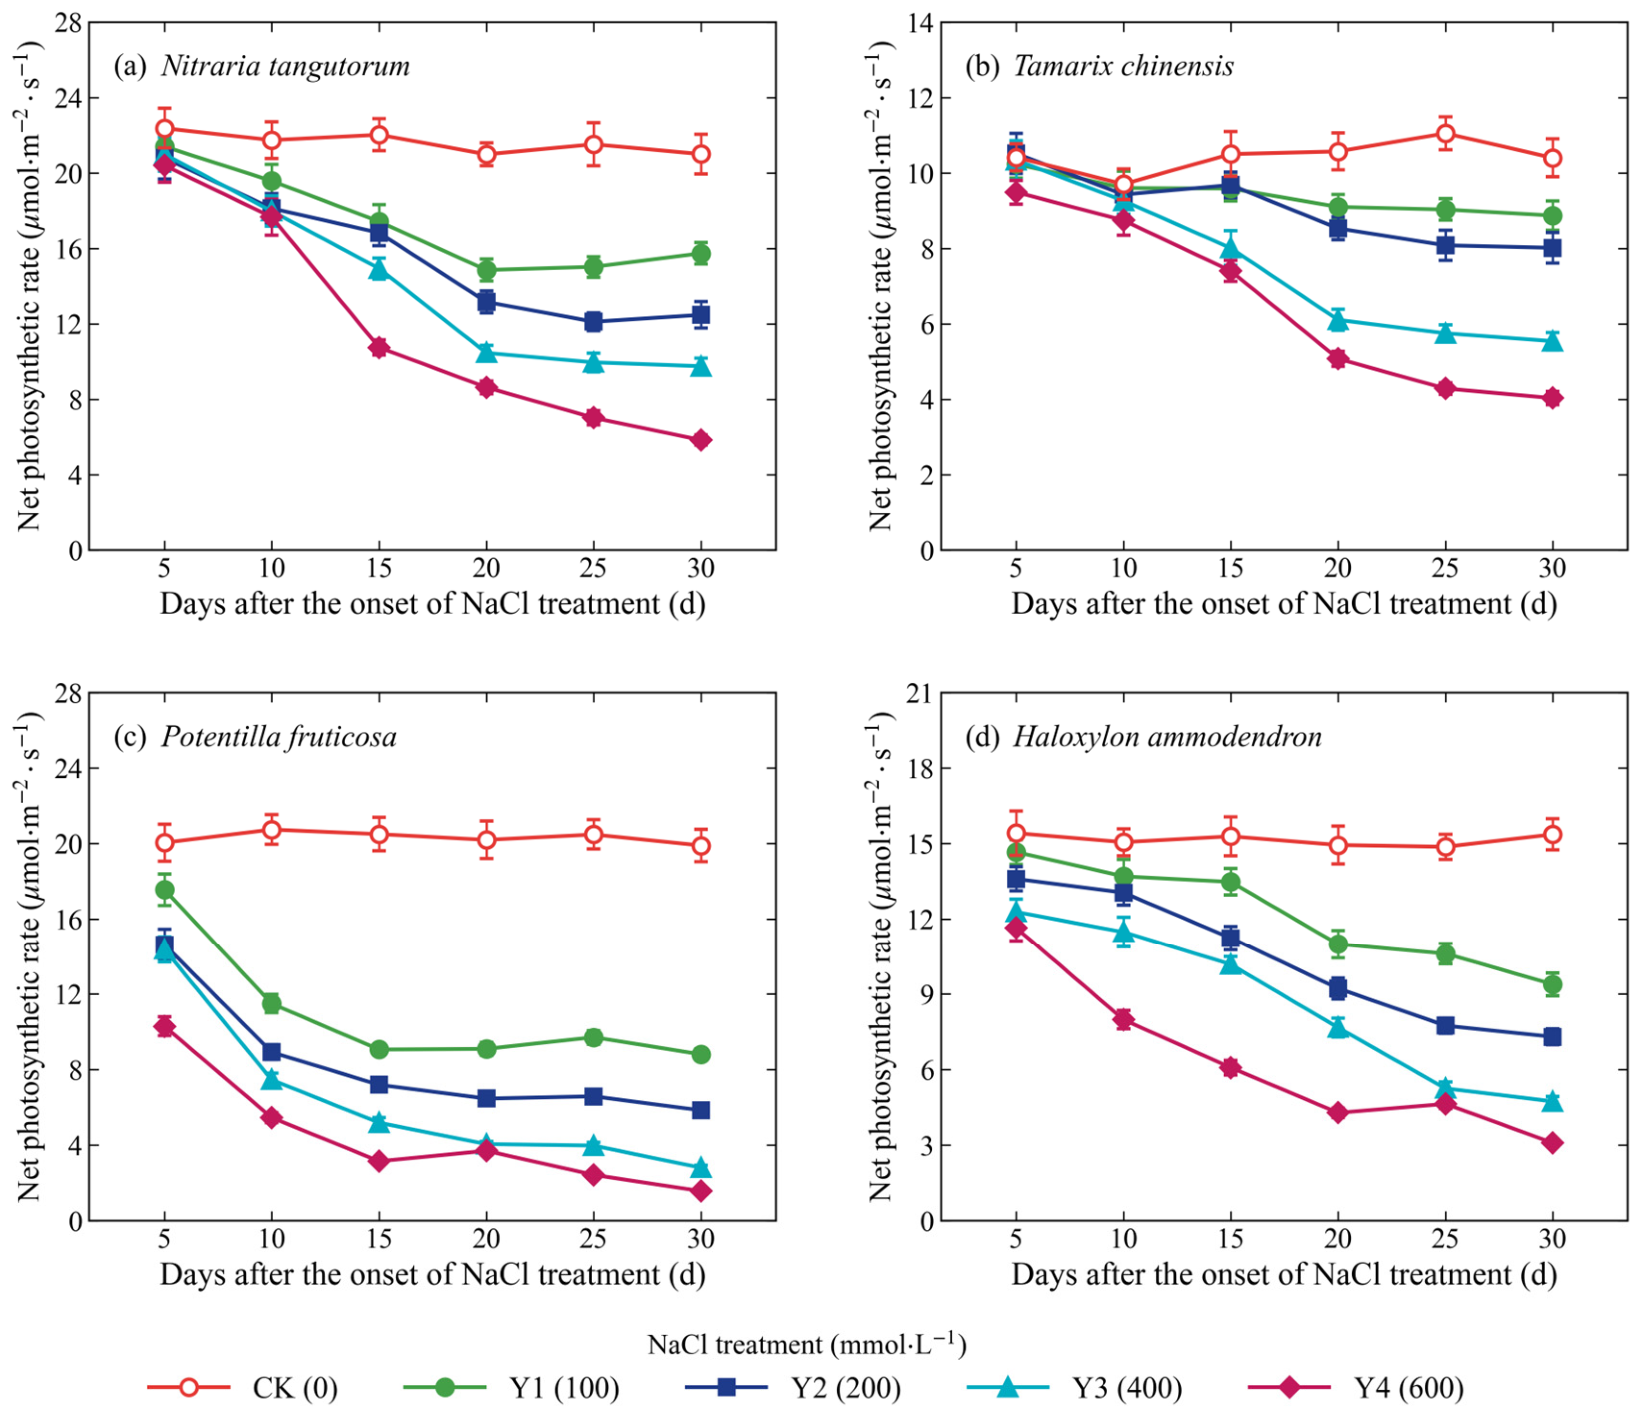
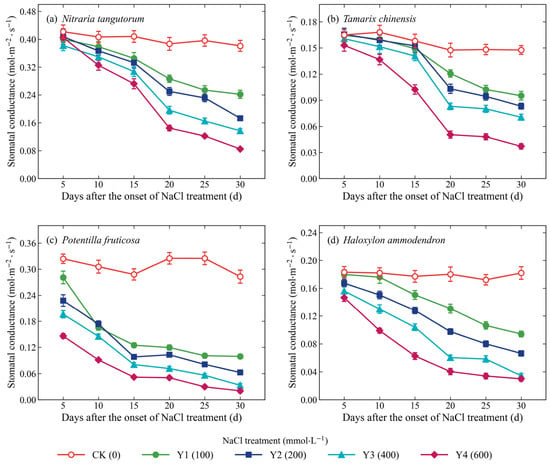
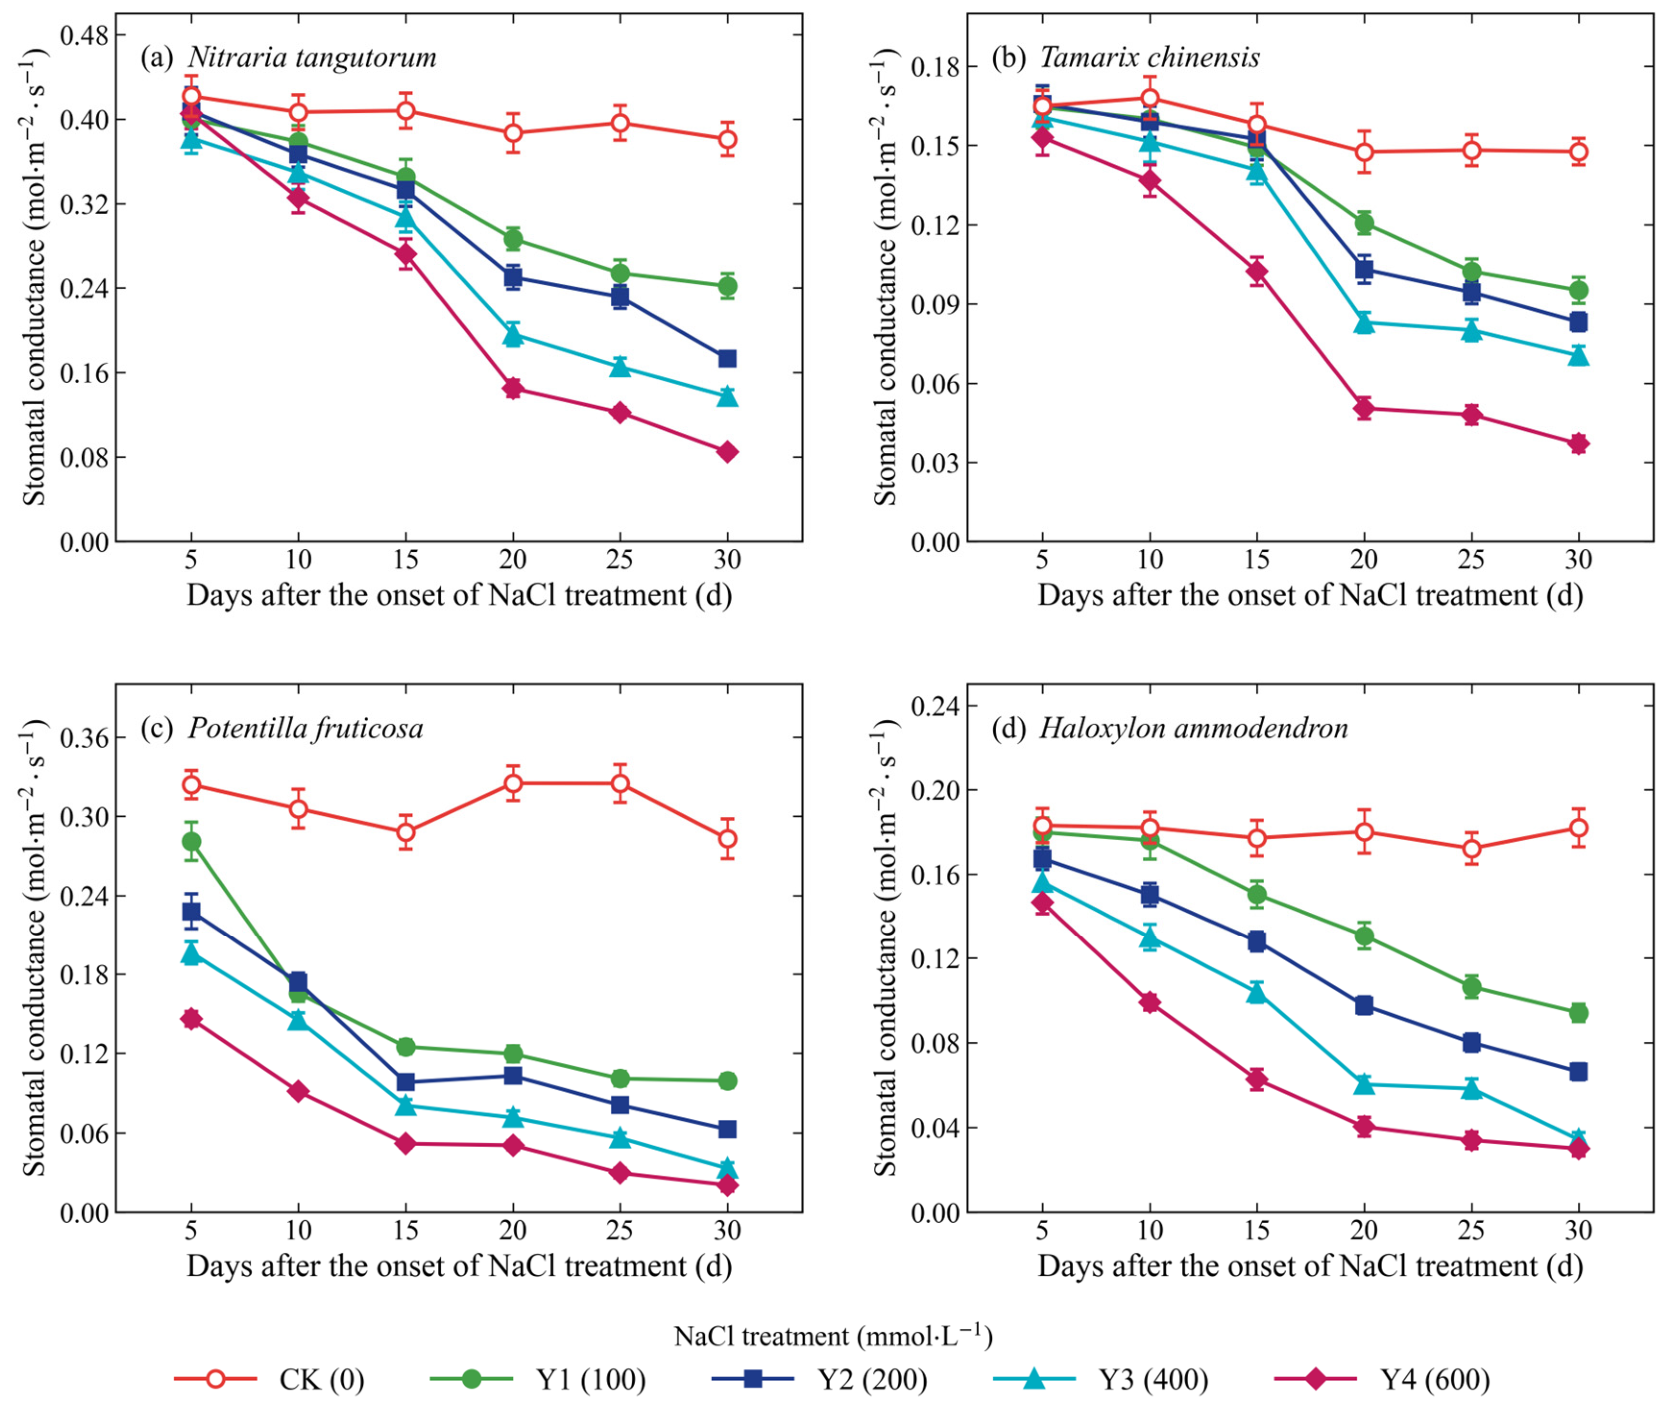
Under CK, Pn, gs, E and WUE remained stable throughout the 30 days, whereas under NaCl they changed with time; in the repeated-measures ANOVA, the NaCl × time interaction was significant for all four variables (p < 0.01), and all main effects and interactions were significant for Pn, E and gs (Figure 5, Figure 6, Figure 7 and Figure S2; Table 3). The time course of the decline differed among species (Figure 5). In N. tangutorum and T. chinensis, Pn under Y1–Y4 did not differ significantly from CK on days 5 and 10 (reductions of ≤18.8% and ≤9.9%, respectively). Thereafter, Pn of N. tangutorum declined mainly between days 10 and 20 and then stabilized, and under Y1 it tended to recover slightly after day 20; Pn of T. chinensis declined under Y3 and Y4 from day 15 onward, whereas under Y1 it remained within 18.3% of CK throughout. In contrast, Pn of P. fruticosa under Y2–Y4 was already 27.1–48.7% lower than CK on day 5 and fell to 44.7–73.7% below CK under Y1–Y4 by day 10, after which it changed little. In H. ammodendron, Pn under Y3 and Y4 was 20.4–24.5% lower than CK on day 5 and continued to decline until day 30.
Figure 5.
Changes in the net photosynthetic rate (Pn) of seedlings of (a) Nitraria tangutorum, (b) Tamarix chinensis, (c) Potentilla fruticosa and (d) Haloxylon ammodendron during 30 days of NaCl treatment (CK, 0; Y1, 100; Y2, 200; Y3, 400; Y4, 600 mmol L−1). Measurements were made between 09:00 and 11:00 on days 5–30 after the first NaCl application. Values are means ± SE (n = 3).
Figure 6.
Changes in stomatal conductance (gs) of seedlings of (a) Nitraria tangutorum, (b) Tamarix chinensis, (c) Potentilla fruticosa and (d) Haloxylon ammodendron during 30 days of NaCl treatment (CK, 0; Y1, 100; Y2, 200; Y3, 400; Y4, 600 mmol L−1). Values are means ± SE (n = 3).
Figure 7.
Changes in instantaneous water use efficiency (WUE = Pn/E) of seedlings of (a) Nitraria tangutorum, (b) Tamarix chinensis, (c) Potentilla fruticosa and (d) Haloxylon ammodendron during 30 days of NaCl treatment (CK, 0; Y1, 100; Y2, 200; Y3, 400; Y4, 600 mmol L−1). Values are means ± SE (n = 3).
Table 3.
Net photosynthetic rate (Pn), transpiration rate (E), stomatal conductance (gs) and water use efficiency (WUE) on day 30, mean stomatal limitation value (Ls) in the early (days 5–15) and late (days 25–30) phases of the NaCl treatment, and three-way repeated-measures ANOVA of the multi-day measurements.
On day 30, Pn was significantly lower than CK under all NaCl treatments except Y1 in T. chinensis (Table 3). The reductions under Y1–Y4 were 14.7–61.2% in T. chinensis, 25.0–72.2% in N. tangutorum, 39.0–79.9% in H. ammodendron and 55.8–92.1% in P. fruticosa. The time courses of gs and E were similar to those of Pn (Figure 6 and Figure S2). On day 30, gs was reduced by 35.6–74.9% in T. chinensis, 36.5–77.7% in N. tangutorum, 48.3–83.5% in H. ammodendron and 64.9–92.7% in P. fruticosa (Table 3).
Because the relative reduction in gs generally exceeded that in Pn, WUE on day 30 was higher under most NaCl treatments than under CK (Figure 7; Table 3). WUE increased to 1.17–1.28 times the CK value in N. tangutorum (significant under Y2), 1.28–1.58 times in T. chinensis (significant under all treatments) and 1.16–1.62 times in H. ammodendron (significant under Y2 and Y3). In P. fruticosa, WUE under Y1–Y3 was 1.15–1.23 times the CK value (significant under Y2), whereas under Y4 it did not differ from CK.
In the early phase of the treatment (days 5–15), the decline in Pn under NaCl was accompanied by lower Ci and higher Ls than under CK in all four species (Table 3): the mean Ls increased from 0.28 under CK to 0.31–0.37 under NaCl in N. tangutorum, from 0.29 to 0.34–0.45 in T. chinensis, from 0.31 to 0.41–0.49 in P. fruticosa and from 0.39 to 0.47–0.58 in H. ammodendron. In the late phase (days 25–30), Ls under NaCl was similar to that under CK in N. tangutorum (0.27–0.30 vs. 0.28) and remained higher than CK under Y1, Y3 and Y4 in T. chinensis (0.38–0.44 vs. 0.28), whereas it fell below CK in P. fruticosa (0.26–0.36 vs. 0.37) and decreased progressively with NaCl concentration in H. ammodendron (from 0.39 under Y1 to 0.20 under Y4, vs. 0.36 under CK). Accordingly, on day 30, Ci under Y3 and Y4 was higher than under CK in P. fruticosa (280–283 vs. 247 μmol mol−1) and H. ammodendron (319–343 vs. 219 μmol mol−1), although Pn in these treatments was 69.2–92.1% lower than in CK.
3.3. Light-Response Characteristics
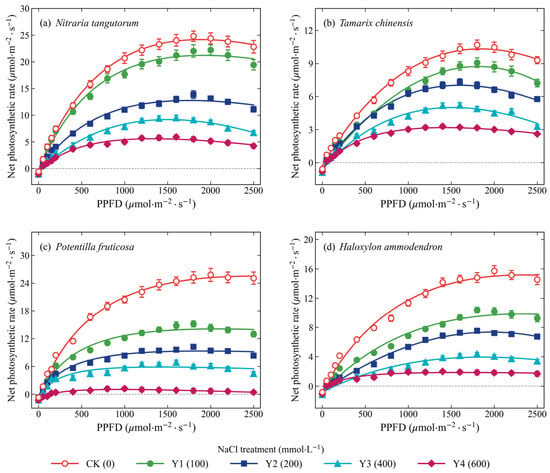
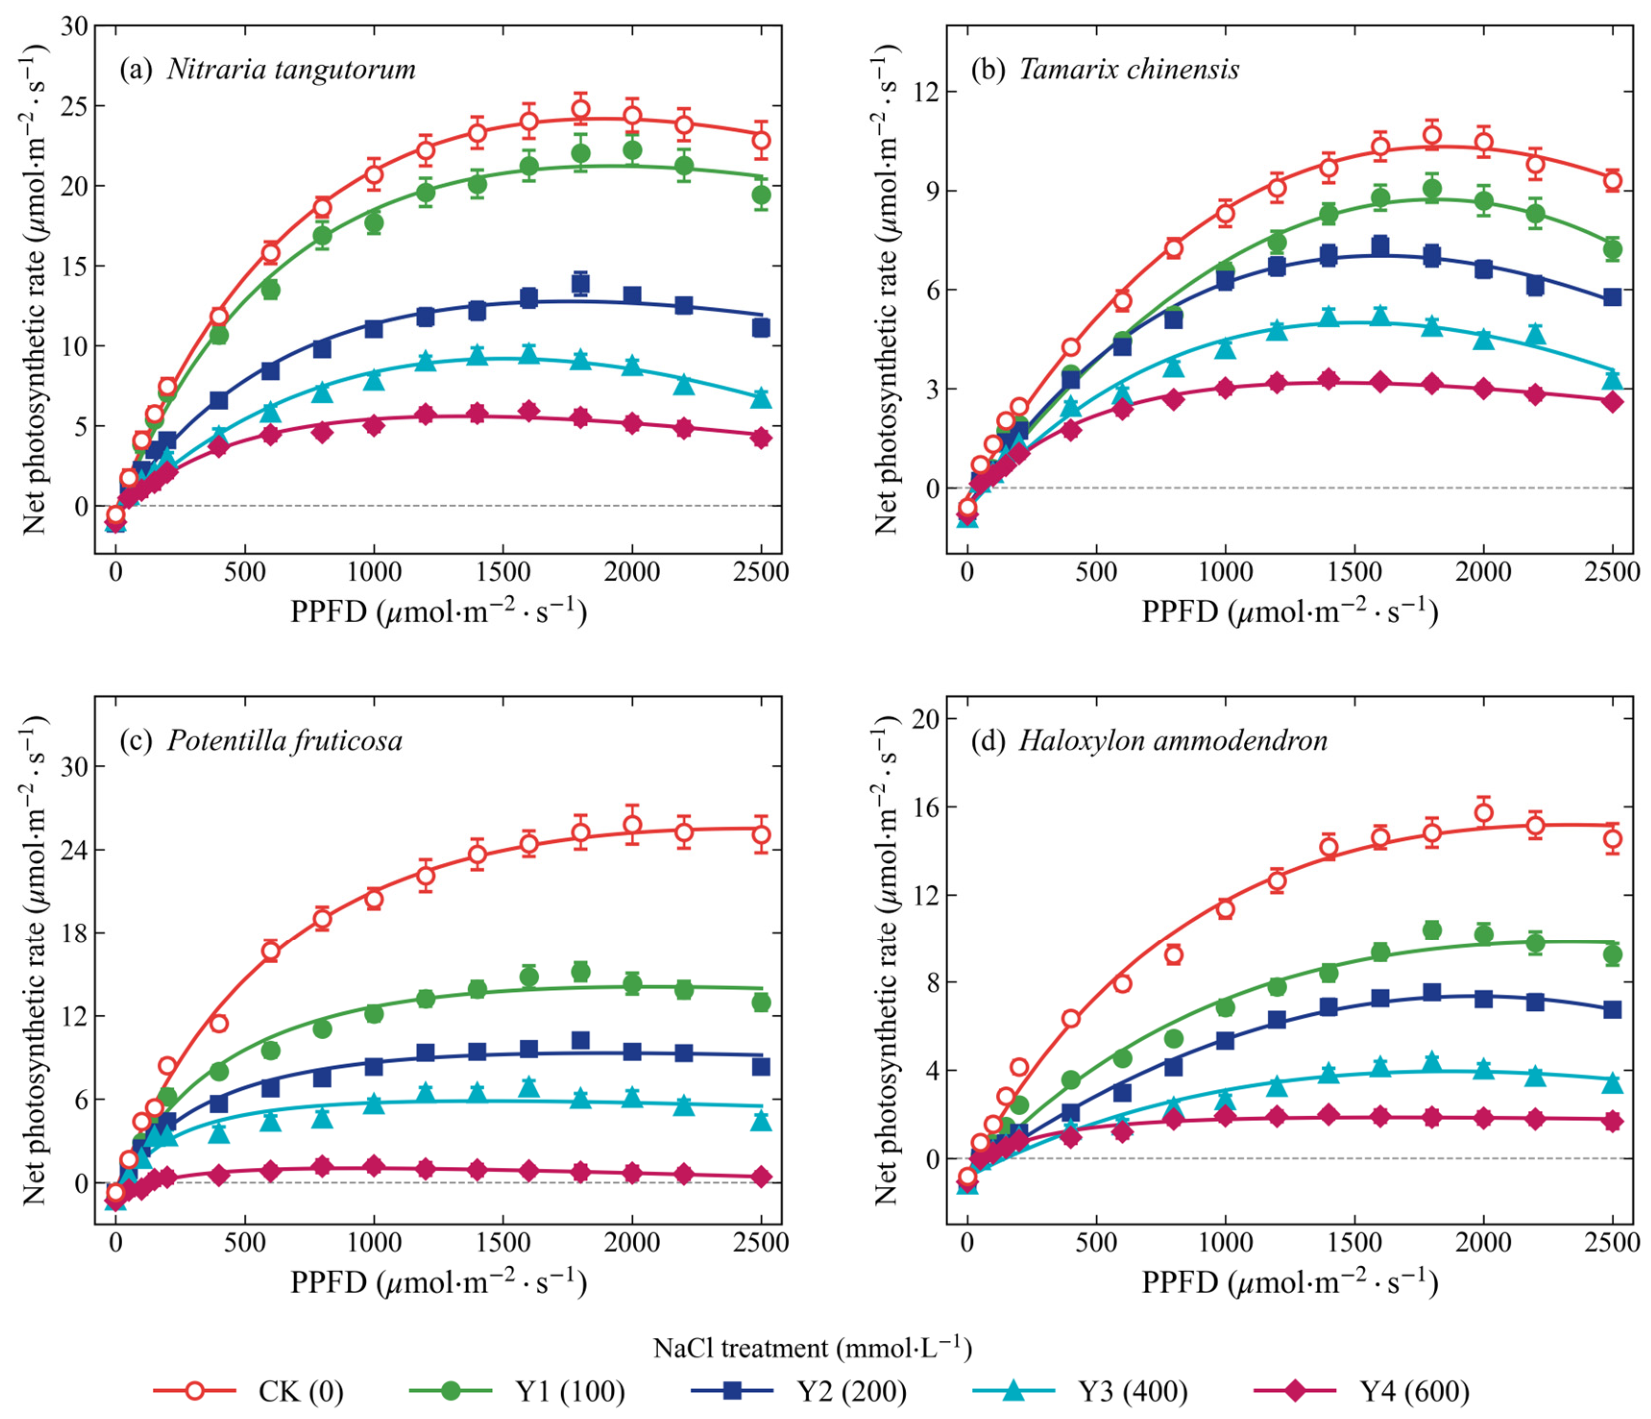
The light-response curves were well described by the modified rectangular hyperbola (R2 = 0.92–1.00; Figure 8; Table 4). Pn increased almost linearly up to 200 μmol m−2 s−1, approached saturation at higher PPFD and declined slightly at the highest PPFDs, indicating mild photoinhibition. Under CK, Pnmax was highest in P. fruticosa (25.51 μmol m−2 s−1), followed by N. tangutorum (24.16 μmol m−2 s−1), H. ammodendron (15.18 μmol m−2 s−1) and T. chinensis (10.32 μmol m−2 s−1), whereas under Y1–Y4 N. tangutorum had the highest Pnmax. NaCl significantly decreased Pnmax of all species at all levels (p < 0.001), by 15.5–69.2% in T. chinensis, 12.2–76.9% in N. tangutorum, 35.2–87.8% in H. ammodendron and 44.9–96.0% in P. fruticosa (Table 4).
Figure 8.
Light-response curves of the net photosynthetic rate (Pn) of seedlings of (a) Nitraria tangutorum, (b) Tamarix chinensis, (c) Potentilla fruticosa and (d) Haloxylon ammodendron under five NaCl treatments (CK, 0; Y1, 100; Y2, 200; Y3, 400; Y4, 600 mmol L−1), measured on days 21–23 of the treatment. Symbols are means ± SE (n = 3); lines are fits of the modified rectangular hyperbola model [23]. PPFD, photosynthetic photon flux density. The fitted parameters are given in Table 4.
Table 4.
Light-response parameters of the four species under five NaCl treatments.
AQY decreased with increasing NaCl concentration in all species; the decrease was not significant under Y1 in N. tangutorum and under Y1 and Y2 in T. chinensis but was significant under all NaCl levels in H. ammodendron and P. fruticosa (Table 4). Rd ranged from 0.29 to 1.17 μmol m−2 s−1 and tended to increase under NaCl, although no difference from CK was significant. Consequently, LCP increased with NaCl concentration, significantly so under all NaCl levels in T. chinensis (from 19.8 μmol m−2 s−1 under CK to 43.0–67.1 μmol m−2 s−1) and H. ammodendron (from 30.2 to 56.7–89.6 μmol m−2 s−1) and under Y3 and Y4 in P. fruticosa (from 12.5 to 37.5 and 141.9 μmol m−2 s−1); in N. tangutorum, the increase in LCP (from 7.4 to 15.0–44.3 μmol m−2 s−1) was not significant because of the large uncertainty of the Rd estimates. LSP decreased significantly under Y3 and Y4 in N. tangutorum, under Y2–Y4 in T. chinensis and under Y4 in P. fruticosa, but not in H. ammodendron.
3.4. Characteristics of Growth, Leaf Water Status and Salt Injury
All seedlings survived the 30-day treatment. The increments in height and basal diameter, which were determined on two seedlings per treatment (one in H. ammodendron) and are therefore described without statistical tests, decreased with increasing NaCl concentration in all species (Table 5). Under Y4, the height increment was 70.0% lower than CK in T. chinensis, 71.1% in N. tangutorum, 78.3% in H. ammodendron and 97.7% in P. fruticosa, in which basal diameter growth ceased. Under Y4, RWC decreased by 13.9% in H. ammodendron, 18.4% in T. chinensis, 22.2% in N. tangutorum and 44.9% in P. fruticosa. The dawn leaf water potential decreased with NaCl concentration in all species, from −0.71 to −1.11 MPa under CK to −1.76 to −2.52 MPa under Y4. Visible salt injury appeared first in P. fruticosa and H. ammodendron (on day 15 under Y4); on day 30, the injury score under Y4 was 2 in N. tangutorum and T. chinensis, 3 in H. ammodendron and 4 in P. fruticosa.
Table 5.
Growth, leaf water status and visible salt injury of the four species after 30 days of NaCl treatment.
3.5. Integrated Evaluation of Salt Tolerance
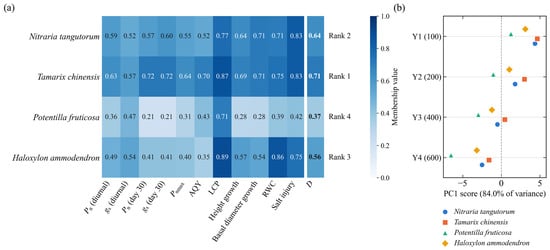
The membership values of the 11 indicators differed among species (Figure 9a). T. chinensis had the highest D value (0.71), followed by N. tangutorum (0.64), H. ammodendron (0.56) and P. fruticosa (0.37), and the same order was obtained at each NaCl level (e.g., D = 0.98, 0.95, 0.84 and 0.68 under Y1 and 0.43, 0.35, 0.29 and 0.00 under Y4 for T. chinensis, N. tangutorum, H. ammodendron and P. fruticosa, respectively). The 11 relative indicators were positively intercorrelated (r = 0.51–0.98, median 0.84; Table S2). Accordingly, in the PCA, the first principal component (PC1) explained 84.0% of the total variance, and all indicators loaded positively on it (loadings 0.71–0.98), so that PC1 represented the overall relative performance under NaCl. The PC1 scores, which summarize the same indicators as D, ranked the species in the same order as D at every NaCl level (Figure 9b), with mean scores of 1.62 for T. chinensis, 0.78 for N. tangutorum, −0.07 for H. ammodendron and −2.33 for P. fruticosa. H. ammodendron ranked below N. tangutorum mainly because of its larger relative reductions in Pn, gs, Pnmax and AQY, although it had the highest membership value for RWC (0.86).
Figure 9.
Integrated evaluation of the salt tolerance of the four species. (a) Mean membership values of 11 indicators (expressed relative to CK and averaged over Y1–Y4) and the comprehensive evaluation value D with the resulting rank. (b) Scores on the first principal component (PC1) of each species at each NaCl level (Y1, 100; Y2, 200; Y3, 400; Y4, 600 mmol L−1). Indicators: Pn and gs (daily means of the diurnal measurements and values on day 30), Pnmax, AQY, LCP, increments in height and basal diameter, RWC and salt injury score on day 30; LCP and salt injury were treated as negative indicators.
The ranking based on D was robust to the weighting and selection of the indicators (Table 6). The same order was obtained when the three groups of indicators were weighted equally, with CRITIC and entropy weights, after the omission of any one indicator or of the two indicators from the diurnal measurements, and when D was calculated from the seven gas-exchange indicators alone, i.e., without the growth, water-status and injury variables that were determined with low replication. Across all 1981 subsets of at least three indicators and 10,000 random weightings, the complete ranking was reproduced in 96.8% and 97.7% of cases, respectively. When measurement uncertainty was propagated, it was reproduced in 92.4% of 10,000 simulations, and the 95% intervals of D were 0.63–0.73 for T. chinensis, 0.55–0.66 for N. tangutorum, 0.50–0.59 for H. ammodendron and 0.33–0.40 for P. fruticosa. In all analyses, P. fruticosa ranked last, whereas T. chinensis ranked above N. tangutorum in 97.8–100% of cases and N. tangutorum above H. ammodendron in 94.6–97.7% of cases.
Table 6.
Sensitivity of the salt-tolerance ranking to the weighting and selection of the indicators and to measurement uncertainty.
4. Discussion
4.1. Gas-Exchange Patterns Suggest a Shift from Stomatal to Non-Stomatal Limitation of Photosynthesis
The NaCl-induced decline in Pn of all four species was closely associated with decreases in gs and E, which is consistent with the rapid osmotic phase of salt stress, in which a lower soil water potential induces stomatal closure before ions accumulate to toxic levels in the leaves [4,5]. The concurrent decrease in Ci and increase in Ls during the first 15 days (Table 3) are consistent with stomatal limitation as the main cause of the early decline [7,19]. Stomatal closure restricts CO2 supply but also reduces water loss, and it is regarded as a protective response that helps plants maintain leaf water status in saline soils [7,8].
With prolonged exposure, however, the decline in Pn of P. fruticosa and H. ammodendron at high salinity no longer appeared to be attributable to stomatal closure alone: by days 25–30, Ls had fallen below the CK value and Ci had risen, although Pn remained much lower than in CK (Table 3). According to the criteria of Farquhar and Sharkey [19], this pattern is consistent with an increasing contribution of non-stomatal limitation, which under salinity can result from reduced mesophyll conductance, impaired photochemistry and carboxylation, and chloroplast damage caused by the accumulation of Na+ and Cl− [20,21,57]. The decrease in AQY and the increase in LCP (Table 4) are consistent with a reduced efficiency of light use, and the earliest and most severe visible injury and the largest decrease in RWC in P. fruticosa (Table 5) suggest that ionic damage may have developed in this species. A predominance of mesophyll limitation under salinity has also been reported for seedlings of Tamarix elongata and H. ammodendron [32], whereas in field-grown H. ammodendron the relative importance of stomatal and non-stomatal limitation varied with soil water and salt conditions [33]. In T. chinensis, by contrast, Ls remained above the CK value at most NaCl levels until day 30, suggesting that its photosynthetic decline remained largely stomatal and that its photosynthetic apparatus was better protected.
Two caveats apply to this interpretation. First, Ci calculated from gas-exchange measurements is unreliable when gs is very low [40], as in P. fruticosa under Y4. Second, because H. ammodendron is a C4 species, its photosynthesis is saturated at a lower Ci and is less sensitive to changes in Ci than that of C3 species [44]; the rise in Ci in this species therefore indicates a reduced carboxylation demand rather than quantifying the non-stomatal component. The limitation analysis was consequently based on the steady-state multi-day measurements and is presented as indicative: the changes in Ci and Ls are consistent with, but do not by themselves demonstrate, an increase in non-stomatal limitation, and confirming and quantifying the mesophyll and biochemical components would require A–Ci curves or chlorophyll fluorescence measurements [20,40].
4.2. Diurnal Regulation of Gas Exchange Under Salinity
Under natural conditions, the effects of NaCl were superimposed on daily changes in light, temperature and evaporative demand. The midday depression of Pn in T. chinensis, P. fruticosa and H. ammodendron coincided with a decrease in gs at 13:00 (Figure 2 and Figure 3), when the relative humidity fell below 20% and the atmospheric water potential declined sharply (Table S1); stomatal closure induced by a high vapor pressure deficit is a common cause of midday depression [58]. NaCl intensified this regulation. The peak of Pn in N. tangutorum advanced from 11:00 to 09:00 under Y4, and the diurnal courses of all species were flattened under Y4 (Figure 2). Earlier daily peaks of Pn under water deficit have also been reported for T. chinensis seedlings [27], and salinity combined with high temperature or high light further decreases gs [59,60]. Thus, under saline conditions, the seedlings restricted water loss during the warmest and driest part of the day at the expense of carbon gain [7]. The single-peaked course and high gs of N. tangutorum suggest that it kept its stomata open through midday under low and moderate salinity, which is consistent with the hydraulically efficient leaves reported for this species in the eastern Qaidam Basin [14]. However, because N. tangutorum was measured on 7 September and the other species on 4 and 5 September (Table S1), this difference in the shape of the diurnal course may partly reflect day-to-day differences in weather, and comparisons of diurnal patterns among species should be regarded as tentative. The effects of NaCl within each species are not affected by this limitation, because all NaCl treatments of a species were measured on the same day, and the salt-tolerance ranking was unchanged when the two indicators derived from the diurnal measurements were omitted (Table 6).
4.3. Responses of Water Use Efficiency Depend on the Time Scale
WUE responded less consistently to NaCl than Pn and gs. On day 30, WUE was higher under most NaCl treatments than under CK because gs and E decreased more than Pn (Table 3), a typical response to mild osmotic stress [8,42]. In the diurnal measurements, however, the daily mean WUE was not significantly affected by NaCl in N. tangutorum, T. chinensis and H. ammodendron and decreased under Y4 in P. fruticosa (Table 2). This difference between datasets arises because the multi-day measurements were made in the morning, when the evaporative demand was low and Pn was close to its daily maximum, whereas the daily means also integrate the midday and afternoon hours, when a high vapor pressure deficit, stomatal closure and photoinhibition reduce Pn relative to E [46,58]. In P. fruticosa, the lower daily WUE indicates that salt-stressed leaves could not maintain carbon gain relative to water loss during the warm part of the day. Moreover, increases in WUE under stress often reflect reduced stomatal opening and carbon gain rather than improved performance [42,61]; for example, the highest WUE of T. chinensis on day 30 occurred under Y4, when its Pn was 61.2% lower than in CK. For these reasons, WUE was not used as a criterion of salt tolerance. Under CK, the daily WUE of H. ammodendron was higher than that of T. chinensis, which was measured on the same day (2.24 vs. 1.88 μmol mmol−1; Table 2), consistent with the generally higher water use efficiency of C4 species [44,62]; this difference was not apparent in the morning measurements on day 30 (Table 3), however, and should therefore be interpreted with caution.
4.4. Interspecific Differences in Salt Tolerance and Their Ecological Basis
Absolute and relative measures of photosynthetic performance ranked the species differently, which shows why the definition of the tolerance criterion matters [10]. N. tangutorum maintained the highest absolute Pn and Pnmax under all NaCl levels, whereas T. chinensis had the lowest absolute rates under CK but the smallest relative declines. These absolute differences were consistent between the diurnal measurements, in which species were confounded with measurement date, and the multi-day and light-response measurements, which were made on the same days for all species or under controlled conditions (Table 2, Table 3 and Table 4). Because the photosynthetic capacity of a species under non-saline conditions reflects its leaf traits as well as its salt tolerance, salt tolerance was defined here by the performance of each species relative to its own control [5]. On this basis, the membership-function index, which integrated photosynthetic, growth and water-status indicators, ranked the species as T. chinensis > N. tangutorum > H. ammodendron > P. fruticosa at all four NaCl levels (Figure 9). The PCA reproduced this order; because it summarizes the same indicators, however, this agreement shows only that the ranking does not depend on the membership-function scaling, and it is not an independent validation. Stronger support comes from the sensitivity analyses (Table 6): the ranking did not depend on the predominance of gas-exchange indicators, on any single indicator or on the growth, water-status and injury variables determined with low replication, and it was largely unaffected by measurement uncertainty. The identification of P. fruticosa as the most sensitive species was unequivocal, and T. chinensis ranked above N. tangutorum in almost all cases, whereas the separation of N. tangutorum from H. ammodendron was less certain (94.6–97.7% of cases) and should be regarded as provisional.
The relatively high tolerance of T. chinensis is consistent with its ability to excrete Na+ and Cl− through leaf salt glands [26,63], which limits ion accumulation in photosynthetic tissues and may explain why its photosynthetic decline remained largely stomatal and progressed slowly. T. chinensis seedlings have been reported to die only when the added soil NaCl content reaches 16–20 g kg−1 [27]. N. tangutorum is a succulent xerophyte whose growth under drought is even promoted by a moderate Na+ supply [25], and its response to NaCl involves osmotic adjustment, antioxidant defense and the maintenance of ion homeostasis [34]. Its high photosynthetic capacity and the delayed onset of the photosynthetic decline (no significant reduction within 10 days) indicate that it can sustain carbon gain under moderate salinity.
The ranking of H. ammodendron below N. tangutorum requires comment, because H. ammodendron is a xero-halophyte that dominates extreme desert environments [28,30]. In our experiment, H. ammodendron maintained its leaf water status better than the other species (Table 5), in agreement with its succulent assimilating shoots and high drought resistance [30,38], but its Pn, gs and AQY decreased strongly at NaCl concentrations of 200 mmol L−1 and above, and visible injury appeared under Y4 by day 15. Several factors may reconcile this result with the ecology of the species. First, H. ammodendron dominates sandy and gravel deserts, where drought rather than high salinity is the main stress and established plants depend on deep roots and groundwater [28,38]; seedlings in pots exposed abruptly to high NaCl concentrations cannot use these resources and may therefore be more sensitive than established plants. Second, in succulent xerophytes, Na+ at low to moderate concentrations is beneficial for growth and water status [25,64], whereas the concentrations used here extended to the salinity of seawater (Section 4.5). Third, part of the strong relative decline in Pn may reflect the sensitivity of C4 photosynthesis to biochemical limitations under stress [29,44]; similarly, Tong et al. [32] found that NaCl reduced the photosynthesis of H. ammodendron seedlings mainly through mesophyll limitation. Our results therefore do not contradict the halophytic nature of H. ammodendron, but indicate that, at the seedling stage and under short-term exposure, its photosynthesis is more sensitive to high NaCl concentrations than that of T. chinensis and N. tangutorum.
P. fruticosa was the most salt-sensitive species: its Pn declined within 5 days, it showed the largest decreases in all photosynthetic variables, RWC and growth, it developed the most severe visible injury (Table 2, Table 3, Table 4 and Table 5), and it ranked last in every variant of the integrated evaluation (Table 6). This is consistent with its ecology as a shrub of cold alpine meadows and shrublands [31], which are not saline habitats, and suggests that it lacks efficient mechanisms of Na+ exclusion or compartmentation, which are typical of halophytes [5,65]. The high photosynthetic capacity of P. fruticosa under CK also shows that a high photosynthetic rate under non-saline conditions does not predict tolerance of salinity.
4.5. Implications for Revegetation and Limitations of the Study
The results provide a physiological basis for selecting species for saline land in the Qaidam Basin. T. chinensis and N. tangutorum, which combined the smallest relative declines with stable (T. chinensis) or high (N. tangutorum) photosynthetic performance, appear to be the most suitable of the four species for saline sites. H. ammodendron seedlings are better suited to sites with low to moderate salinity, and the performance of older plants on more saline sites should be tested. P. fruticosa should be restricted to non-saline or slightly saline sites. Comparable NaCl gradients have been used to estimate the salt-tolerance thresholds of other shrubs in the Qaidam Basin, for example, about 108 mmol L−1 for Elaeagnus angustifolia and 246 mmol L−1 for Lycium barbarum [18].
These conclusions should be interpreted within the limits of the experimental design. First, the study describes the short-term (30-day) responses of potted seedlings, and salt tolerance can change with plant age and with longer exposure [5,10]. Second, NaCl was applied repeatedly and the soil electrical conductivity was not measured, so the salinity actually experienced by the roots probably increased during the experiment [10]; nevertheless, the progressive decrease in dawn leaf water potential with NaCl concentration (Table 5) confirms that the treatments imposed a graded osmotic stress. Third, the soils of the Qaidam Basin contain sulfate and calcium salts as well as NaCl [13,16], so the responses to NaCl alone may not fully represent field conditions. The highest treatment (600 mmol L−1 NaCl, i.e., 35.1 g L−1) corresponds to the total salt content of seawater (about 35 g kg−1) [66]; because the salt concentration of the soil solution depends on soil water content, the applied concentrations cannot be converted directly into the soil salt contents measured in the field (e.g., about 9–15 g kg−1 in strongly saline topsoils of the basin [16]). Fourth, each species was measured on a single day in the diurnal courses, so interspecific differences in diurnal patterns cannot be separated from day-to-day differences in weather. Moreover, because the gas-exchange data were available only as treatment means and SEs, the repeated-measures analyses used conservative bounds for the error terms; these tests may have missed weak effects (e.g., of NaCl on the daily WUE) but are unlikely to have overstated the effects reported here. The growth increments, RWC, leaf water potential and injury scores were based on only one or two determinations per treatment; although the ranking was insensitive to their omission (Table 6), larger samples are needed to test these responses statistically. Fifth, leaf ion contents, chlorophyll fluorescence and A–Ci responses were not measured, so the inferred increase in non-stomatal limitation could not be confirmed, and its mechanisms remain to be determined. Long-term field trials along natural salinity gradients, with measurements of soil salinity, are needed to validate the ranking obtained here.
5. Conclusions
Short-term NaCl stress (100–600 mmol L−1 for 30 days) significantly reduced leaf gas exchange of seedlings of all four shrub species, and the reductions increased with salt concentration and treatment duration. The early decline in photosynthesis was accompanied by a lower Ci and a higher Ls, consistent with predominantly stomatal limitation, whereas by the end of the treatment the rise in Ci and fall in Ls at high salinity in P. fruticosa and H. ammodendron were consistent with an increasing contribution of non-stomatal limitation, which remains to be confirmed by A–Ci or chlorophyll fluorescence measurements. Salinity also lowered Pnmax and AQY and raised LCP, thereby reducing light-use capacity. N. tangutorum maintained the highest absolute photosynthetic rates, whereas T. chinensis showed the smallest relative decline. Based on an integrated index of photosynthetic, growth and water-status indicators, the short-term salt tolerance of the seedlings ranked T. chinensis > N. tangutorum > H. ammodendron > P. fruticosa; this ranking was robust to the weighting and selection of the indicators, and the position of P. fruticosa as the most sensitive species was the most certain. T. chinensis and N. tangutorum are therefore recommended as priority species for revegetating saline land in the Qaidam Basin, H. ammodendron for sites with low to moderate salinity, and P. fruticosa for non-saline sites; these recommendations should be validated in long-term field trials.
Supplementary Materials
The following supporting information can be downloaded at: https://www.mdpi.com/article/10.3390/d18110693/s1, Figure S1: Diurnal courses of the transpiration rate (E) of seedlings of (a) Nitraria tangutorum, (b) Tamarix chinensis, (c) Potentilla fruticosa and (d) Haloxylon ammodendron under five NaCl treatments (CK, 0; Y1, 100; Y2, 200; Y3, 400; Y4, 600 mmol L−1). Values are means ± SE (n = 3); Figure S2: Changes in the transpiration rate (E) of seedlings of (a) Nitraria tangutorum, (b) Tamarix chinensis, (c) Potentilla fruticosa and (d) Haloxylon ammodendron during 30 days of NaCl treatment (CK, 0; Y1, 100; Y2, 200; Y3, 400; Y4, 600 mmol L−1). Values are means ± SE (n = 3); Table S1: Allocation of the diurnal gas-exchange measurements to measurement days and weather on each measurement day (a), and microclimate during the diurnal measurements on 4 September 2024 at the experimental site (b); Table S2: Pearson correlation coefficients among the 11 relative indicators used in the integrated evaluation of salt tolerance (n = 16; four species × four NaCl levels).
Author Contributions
Conceptualization, H.L. and M.D.; methodology, L.Y., X.W. and M.D.; software, D.Z.; validation, D.Z. and M.D.; formal analysis, L.Y., H.L. and M.D.; investigation, X.W., D.Z. and M.D.; resources, H.L. and M.D.; data curation, H.L., M.D. and L.Y.; writing—original draft preparation, H.L., M.D. and X.W.; writing—review and editing, H.L. and M.D.; visualization, X.W. and D.Z.; supervision, H.L.; project administration, H.L.; funding acquisition, M.D. All authors have read and agreed to the published version of the manuscript.
Funding
This work was supported by the 2021 Fund Project of Yangling Vocational and Technical College (BG2021002) and the 2022 Fund Project of Yangling Vocational and Technical College (ZK22-56).
Data Availability Statement
The data presented in this study are available upon request from the corresponding author.
Conflicts of Interest
The authors declare no conflicts of interest.
Abbreviations
The following abbreviations are used in this manuscript: AQY, apparent quantum yield; Ca, ambient (reference) CO2 concentration; Ci, intercellular CO2 concentration; CK, control (0 mmol L−1 NaCl); CRITIC, criteria importance through intercriteria correlation; D, comprehensive evaluation value of the membership function; E, transpiration rate; gs, stomatal conductance; LCP, light compensation point; LSP, light saturation point; Ls, stomatal limitation value; PC1, first principal component; PCA, principal component analysis; Pn, net photosynthetic rate; Pnmax, maximum net photosynthetic rate; PPFD, photosynthetic photon flux density; Rd, dark respiration rate; RWC, relative water content; WUE, instantaneous water use efficiency; Y1–Y4, 100, 200, 400 and 600 mmol L−1 NaCl; Ψ, leaf water potential.
References
- Shokri, N.; Hassani, A.; Sahimi, M. Multi-Scale Soil Salinization Dynamics From Global to Pore Scale: A Review. Rev. Geophys. 2024, 62, e2023RG000804. [Google Scholar] [CrossRef] [Scilit]
- Tarolli, P.; Luo, J.; Park, E.; Barcaccia, G.; Masin, R. Soil salinization in agriculture: Mitigation and adaptation strategies combining nature-based solutions and bioengineering. iScience 2024, 27, 108830. [Google Scholar] [CrossRef] [Scilit] [PubMed]
- Wang, J.; Ding, J.; Wang, Y.; Ge, X.; Lizaga, I.; Chen, X. Soil salinization in drylands: Measure, monitor, and manage. Ecol. Indic. 2025, 175, 113608, Correction in Ecol. Indic. 2025, 179, 114288. [Google Scholar] [CrossRef] [Scilit]
- Munns, R. Comparative physiology of salt and water stress. Plant Cell Environ. 2002, 25, 239–250. [Google Scholar] [CrossRef] [Scilit] [PubMed]
- Munns, R.; Tester, M. Mechanisms of Salinity Tolerance. Annu. Rev. Plant Biol. 2008, 59, 651–681. [Google Scholar] [CrossRef] [Scilit] [PubMed]
- van Zelm, E.; Zhang, Y.; Testerink, C. Salt Tolerance Mechanisms of Plants. Annu. Rev. Plant Biol. 2020, 71, 403–433. [Google Scholar] [CrossRef] [Scilit] [PubMed]
- Chaves, M.M.; Flexas, J.; Pinheiro, C. Photosynthesis under drought and salt stress: Regulation mechanisms from whole plant to cell. Ann. Bot. 2009, 103, 551–560. [Google Scholar] [CrossRef] [Scilit] [PubMed]
- Liao, Q.; Gu, S.; Kang, S.; Du, T.; Tong, L.; Wood, J.D.; Ding, R. Mild water and salt stress improve water use efficiency by decreasing stomatal conductance via osmotic adjustment in field maize. Sci. Total Environ. 2022, 805, 150364. [Google Scholar] [CrossRef] [Scilit] [PubMed]
- Zahra, N.; Al Hinai, M.S.; Hafeez, M.B.; Rehman, A.; Wahid, A.; Siddique, K.H.M.; Farooq, M. Regulation of photosynthesis under salt stress and associated tolerance mechanisms. Plant Physiol. Biochem. 2022, 178, 55–69. [Google Scholar] [CrossRef] [Scilit] [PubMed]
- Negrão, S.; Schmöckel, S.M.; Tester, M. Evaluating physiological responses of plants to salinity stress. Ann. Bot. 2017, 119, 1–11. [Google Scholar] [CrossRef] [Scilit] [PubMed]
- Hui, R.; Tan, H.; Li, X.; Wang, B. Variation of soil physical-chemical characteristics in salt-affected soil in the Qarhan Salt Lake, Qaidam Basin. J. Arid Land 2022, 14, 341–355. [Google Scholar] [CrossRef] [Scilit]
- She, X.; Jing, C.; Liu, W.; Zhang, L.; Zhao, Z.; Wang, Z.; Li, W.; Zhang, Z. Dynamics and drivers of soil salinization in arid and semiarid regions from 2002 to 2021: A case study in the Qaidam Basin. Ecol. Front. 2025, 45, 1235–1247. [Google Scholar] [CrossRef] [Scilit]
- Wang, X.; Kong, F.; Kong, W.; Xu, W. Edaphic characterization and plant zonation in the Qaidam Basin, Tibetan Plateau. Sci. Rep. 2018, 8, 1822. [Google Scholar] [CrossRef] [Scilit] [PubMed]
- Liu, S.; Zheng, J. Adaptive strategies based on shrub leaf-stem anatomy and their environmental interpretations in the eastern Qaidam Basin. BMC Plant Biol. 2024, 24, 323. [Google Scholar] [CrossRef] [Scilit] [PubMed]
- Du, L.; Tian, S.; Zhao, N.; Zhang, B.; Mu, X.; Tang, L.; Zheng, X.; Li, Y. Climate and topography regulate the spatial pattern of soil salinization and its effects on shrub community structure in Northwest China. J. Arid Land 2024, 16, 925–942. [Google Scholar] [CrossRef] [Scilit]
- Wang, X.; Li, Y.; Ta, L.; Cao, Y.; Song, M. Soil Salinization Characteristics of Artificial Grassland in the Qaidam Basin and Their Impact on Soil Fertility. Land 2026, 15, 294. [Google Scholar] [CrossRef] [Scilit]
- Tang, H.; Du, L.; Xia, C.; Luo, J. Bridging gaps and seeding futures: A synthesis of soil salinization and the role of plant-soil interactions under climate change. iScience 2024, 27, 110804. [Google Scholar] [CrossRef] [Scilit] [PubMed]
- Zhang, T.; Zhang, Z.; Li, Y.; He, K. The Effects of Saline Stress on the Growth of Two Shrub Species in the Qaidam Basin of Northwestern China. Sustainability 2019, 11, 828. [Google Scholar] [CrossRef] [Scilit]
- Farquhar, G.D.; Sharkey, T.D. Stomatal Conductance and Photosynthesis. Annu. Rev. Plant Physiol. 1982, 33, 317–345. [Google Scholar] [CrossRef] [Scilit]
- Flexas, J.; Bota, J.; Loreto, F.; Cornic, G.; Sharkey, T.D. Diffusive and metabolic limitations to photosynthesis under drought and salinity in C3 plants. Plant Biol. 2004, 6, 269–279. [Google Scholar] [CrossRef] [Scilit] [PubMed]
- Pan, T.; Liu, M.; Kreslavski, V.D.; Zharmukhamedov, S.K.; Nie, C.; Yu, M.; Kuznetsov, V.V.; Allakhverdiev, S.I.; Shabala, S. Non-stomatal limitation of photosynthesis by soil salinity. Crit. Rev. Environ. Sci. Technol. 2021, 51, 791–825. [Google Scholar] [CrossRef] [Scilit]
- Asargew, M.F.; Masutomi, Y.; Kobayashi, K.; Aono, M. Water stress changes the relationship between photosynthesis and stomatal conductance. Sci. Total Environ. 2024, 907, 167886. [Google Scholar] [CrossRef] [Scilit] [PubMed]
- Ye, Z.P. A new model for relationship between irradiance and the rate of photosynthesis in Oryza sativa. Photosynthetica 2007, 45, 637–640. [Google Scholar] [CrossRef] [Scilit]
- de Lobo, F.A.; de Barros, M.P.; Dalmagro, H.J.; Dalmolin, Â.C.; Pereira, W.E.; de Souza, É.C.; Vourlitis, G.L.; Rodríguez Ortíz, C.E. Fitting net photosynthetic light-response curves with Microsoft Excel—A critical look at the models. Photosynthetica 2013, 51, 445–456, Correction in Photosynthetica 2014, 52, 479–480. [Google Scholar] [CrossRef] [Scilit]
- Kang, J.; Zhao, W.; Zhao, M.; Zheng, Y.; Yang, F. NaCl and Na2SiO3 coexistence strengthens growth of the succulent xerophyte Nitraria tangutorum under drought. Plant Growth Regul. 2015, 77, 223–232. [Google Scholar] [CrossRef] [Scilit]
- Thomson, W.W.; Berry, W.L.; Liu, L.L. Localization and secretion of salt by the salt glands of Tamarix aphylla. Proc. Natl. Acad. Sci. USA 1969, 63, 310–317. [Google Scholar] [CrossRef] [Scilit] [PubMed]
- Wang, W. Effects of salt and water stress on plant biomass and photosynthetic characteristics of Tamarisk (Tamarix chinensis Lour.) seedlings. Afr. J. Biotechnol. 2011, 10, 17981–17989. [Google Scholar] [CrossRef] [Scilit]
- Pyankov, V.I.; Black, C.C.; Artyusheva, E.G.; Voznesenskaya, E.V.; Ku, M.S.B.; Edwards, G.E. Features of Photosynthesis in Haloxylon species of Chenopodiaceae that are Dominant Plants in Central Asian Deserts. Plant Cell Physiol. 1999, 40, 125–134. [Google Scholar] [CrossRef] [Scilit]
- Su, P.; Cheng, G.; Yan, Q.; Liu, X. Photosynthetic regulation of C4 desert plant Haloxylon ammodendron under drought stress. Plant Growth Regul. 2007, 51, 139–147. [Google Scholar] [CrossRef] [Scilit]
- Kang, J.; Zhao, W.; Zheng, Y.; Zhang, D.M.; Zhou, H.; Sun, P. Calcium chloride improves photosynthesis and water status in the C4 succulent xerophyte Haloxylon ammodendron under water deficit. Plant Growth Regul. 2017, 82, 467–478. [Google Scholar] [CrossRef] [Scilit]
- Fan, B.; Ding, N.; Tian, T.; Gao, P.; Wan, Y.; Ma, M.; Sun, K. Different water and photosynthetic resource use strategies explain the widespread distribution of Dasiphora fruticosa in Qinghai-Tibet Plateau alpine meadows. Environ. Exp. Bot. 2025, 231, 106106. [Google Scholar] [CrossRef] [Scilit]
- Tong, Y.; Ma, J.; Min, X.; Tong, Y. Effect of Drought and Salinity on Water Relations and Photosynthetic Responses of Tamarix elongata and Haloxylon ammodendron in Wutonggou Desert Tourist Area, Northwest China. Diversity 2025, 17, 235. [Google Scholar] [CrossRef] [Scilit]
- Hu, D.; Lv, G.; Qie, Y.; Wang, H.; Yang, F.; Jiang, L. Response of Morphological Characters and Photosynthetic Characteristics of Haloxylon ammodendron to Water and Salt Stress. Sustainability 2021, 13, 388. [Google Scholar] [CrossRef] [Scilit]
- Gao, Z.; Gao, S.; Li, P.; Zhang, Y.; Ma, B.; Wang, Y. Exogenous methyl jasmonate promotes salt stress-induced growth inhibition and prioritizes defense response of Nitraria tangutorum Bobr. Physiol. Plant. 2021, 172, 162–175. [Google Scholar] [CrossRef] [Scilit] [PubMed]
- Liang, Z.; Pei, K.; Zhang, H.; Lai, X.; Meng, Y.; Jia, M.; Cao, D.; Zhang, C.; Song, Z.; Duan, J. A comprehensive evaluation of drought resistance in Hemerocallis fulva L. using membership function and principal component analysis. Sci. Rep. 2025, 15, 34812. [Google Scholar] [CrossRef] [Scilit] [PubMed]
- Jolliffe, I.T.; Cadima, J. Principal component analysis: A review and recent developments. Philos. Trans. R. Soc. A 2016, 374, 20150202. [Google Scholar] [CrossRef] [Scilit] [PubMed]
- Saisana, M.; Saltelli, A.; Tarantola, S. Uncertainty and sensitivity analysis techniques as tools for the quality assessment of composite indicators. J. R. Stat. Soc. Ser. A Stat. Soc. 2005, 168, 307–323. [Google Scholar] [CrossRef] [Scilit]
- Liu, S.; Xu, G.; Chen, T.; Wu, X.; Li, Y. Quantifying the effects of precipitation exclusion and groundwater drawdown on functional traits of Haloxylon ammodendron—How does this xeric shrub survive the drought? Sci. Total Environ. 2023, 904, 166945. [Google Scholar] [CrossRef] [Scilit] [PubMed]
- Schneider, C.A.; Rasband, W.S.; Eliceiri, K.W. NIH Image to ImageJ: 25 years of image analysis. Nat. Methods 2012, 9, 671–675. [Google Scholar] [CrossRef] [Scilit] [PubMed]
- Long, S.P. Gas exchange measurements, what can they tell us about the underlying limitations to photosynthesis? Procedures and sources of error. J. Exp. Bot. 2003, 54, 2393–2401. [Google Scholar] [CrossRef] [Scilit] [PubMed]
- Smart, R.E.; Bingham, G.E. Rapid Estimates of Relative Water Content. Plant Physiol. 1974, 53, 258–260. [Google Scholar] [CrossRef] [Scilit] [PubMed]
- Blum, A. Effective use of water (EUW) and not water-use efficiency (WUE) is the target of crop yield improvement under drought stress. Field Crops Res. 2009, 112, 119–123. [Google Scholar] [CrossRef] [Scilit]
- Berry, J.A.; Downton, W.J.S. Environmental regulation of photosynthesis. Photosynthesis 1982, 2, 263–343. [Google Scholar] [CrossRef] [Scilit]
- Ghannoum, O. C4 photosynthesis and water stress. Ann. Bot. 2009, 103, 635–644. [Google Scholar] [CrossRef] [Scilit] [PubMed]
- Efron, B.; Tibshirani, R.J. An Introduction to the Bootstrap; Springer: Boston, MA, USA, 1993. [Google Scholar] [CrossRef] [Scilit]
- Lawson, T.; Blatt, M.R. Stomatal size, speed, and responsiveness impact on photosynthesis and water use efficiency. Plant Physiol. 2014, 164, 1556–1570. [Google Scholar] [CrossRef] [Scilit] [PubMed]
- McAusland, L.; Vialet-Chabrand, S.; Davey, P.; Baker, N.R.; Brendel, O.; Lawson, T. Effects of kinetics of light-induced stomatal responses on photosynthesis and water-use efficiency. New Phytol. 2016, 211, 1209–1220. [Google Scholar] [CrossRef] [Scilit] [PubMed]
- Gurevitch, J.; Chester, S.T. Analysis of Repeated Measures Experiments. Ecology 1986, 67, 251–255. [Google Scholar] [CrossRef] [Scilit]
- Littell, R.C.; Henry, P.R.; Ammerman, C.B. Statistical analysis of repeated measures data using SAS procedures. J. Anim. Sci. 1998, 76, 1216–1231. [Google Scholar] [CrossRef] [Scilit] [PubMed]
- Greenhouse, S.W.; Geisser, S. On methods in the analysis of profile data. Psychometrika 1959, 24, 95–112. [Google Scholar] [CrossRef] [Scilit]
- Matthews, J.N.S.; Altman, D.G.; Campbell, M.J.; Royston, P. Analysis of serial measurements in medical research. BMJ 1990, 300, 230–235. [Google Scholar] [CrossRef] [Scilit] [PubMed]
- Virtanen, P.; Gommers, R.; Oliphant, T.E.; Haberland, M.; Reddy, T.; Cournapeau, D.; Burovski, E.; Peterson, P.; Weckesser, W.; Bright, J.; et al. SciPy 1.0: Fundamental algorithms for scientific computing in Python. Nat. Methods 2020, 17, 261–272, Correction in Nat. Methods 2020, 17, 352. [Google Scholar] [CrossRef] [Scilit] [PubMed]
- Seabold, S.; Perktold, J. Statsmodels: Econometric and Statistical Modeling with Python. In Proceedings of the 9th Python in Science Conference, Austin, TX, USA, 3 June–28 June 2010; pp. 92–96. [Google Scholar] [CrossRef] [Scilit]
- Zadeh, L.A. Fuzzy sets. Inf. Control 1965, 8, 338–353. [Google Scholar] [CrossRef] [Scilit]
- Diakoulaki, D.; Mavrotas, G.; Papayannakis, L. Determining objective weights in multiple criteria problems: The CRITIC method. Comput. Oper. Res. 1995, 22, 763–770. [Google Scholar] [CrossRef] [Scilit]
- Zou, Z.-H.; Yun, Y.; Sun, J.-N. Entropy method for determination of weight of evaluating indicators in fuzzy synthetic evaluation for water quality assessment. J. Environ. Sci. 2006, 18, 1020–1023. [Google Scholar] [CrossRef] [Scilit] [PubMed]
- Wang, X.; Chen, Z.; Sui, N. Sensitivity and responses of chloroplasts to salt stress in plants. Front. Plant Sci. 2024, 15, 1374086. [Google Scholar] [CrossRef] [Scilit] [PubMed]
- Iio, A.; Fukasawa, H.; Nose, Y.; Kakubari, Y. Stomatal closure induced by high vapor pressure deficit limited midday photosynthesis at the canopy top of Fagus crenata Blume on Naeba mountain in Japan. Trees 2004, 18, 510–517. [Google Scholar] [CrossRef] [Scilit]
- Li, Y.; Jiang, F.; He, Z.; Liu, Y.; Chen, Z.; Ottosen, C.-O.; Mittler, R.; Wu, Z.; Zhou, R. Higher Intensity of Salt Stress Accompanied by Heat Inhibits Stomatal Conductance and Induces ROS Accumulation in Tomato Plants. Antioxidants 2024, 13, 448. [Google Scholar] [CrossRef] [Scilit] [PubMed]
- Orzechowska, A.; Trtílek, M.; Tokarz, K.M.; Szymańska, R.; Niewiadomska, E.; Rozpądek, P.; Wątor, K. Thermal Analysis of Stomatal Response under Salinity and High Light. Int. J. Mol. Sci. 2021, 22, 4663. [Google Scholar] [CrossRef] [Scilit] [PubMed]
- Petrík, P.; Petek-Petrik, A.; Mukarram, M.; Schuldt, B.; Lamarque, L.J. Leaf physiological and morphological constraints of water-use efficiency in C3 plants. AoB Plants 2023, 15, plad047. [Google Scholar] [CrossRef] [Scilit] [PubMed]
- Ye, Z.P.; He, J.Q.; An, T.; Duan, S.H.; Kang, H.J.; Wang, F.B. Influences of residual stomatal conductance on the intrinsic water use efficiency of two C3 and two C4 species. Agric. Water Manag. 2024, 306, 109136. [Google Scholar] [CrossRef] [Scilit]
- Kleinkopf, G.E.; Wallace, A. Physiological basis for salt tolerance in Tamarix ramosissima. Plant Sci. Lett. 1974, 3, 157–163. [Google Scholar] [CrossRef] [Scilit]
- Ma, Q.; Yue, L.-J.; Zhang, J.-L.; Wu, G.-Q.; Bao, A.-K.; Wang, S.-M. Sodium chloride improves photosynthesis and water status in the succulent xerophyte Zygophyllum xanthoxylum. Tree Physiol. 2012, 32, 4–13. [Google Scholar] [CrossRef] [Scilit] [PubMed]
- Flowers, T.J.; Colmer, T.D. Salinity tolerance in halophytes. New Phytol. 2008, 179, 945–963. [Google Scholar] [CrossRef] [Scilit] [PubMed]
- Flowers, T.J.; Colmer, T.D. Plant salt tolerance: Adaptations in halophytes. Ann. Bot. 2015, 115, 327–331. [Google Scholar] [CrossRef] [Scilit] [PubMed]

Disclaimer/Publisher’s Note: The statements, opinions and data contained in all publications are solely those of the individual author(s) and contributor(s) and not of MDPI and/or the editor(s). MDPI and/or the editor(s) disclaim responsibility for any injury to people or property resulting from any ideas, methods, instructions or products referred to in the content. |
© 2026 by the authors. Licensee MDPI, Basel, Switzerland. This article is an open access article distributed under the terms and conditions of the Creative Commons Attribution (CC BY) license.