


Abstract
To examine differences in resource use and functional traits between the narrow-ranged Camellia longzhouensis and its widespread congener Camellia gigantocarpa, we compared their light and CO2 responses, leaf anatomy, stomatal traits, photosynthetic pigments, and trait correlations under common nursery conditions. In both species, net photosynthetic rate increased rapidly with increasing irradiance and then gradually approached a plateau. The maximum net photosynthetic rate of C. gigantocarpa was significantly higher and was 4.10 times that of C. longzhouensis, whereas apparent quantum yield, light saturation point, light compensation point, and dark respiration rate did not differ significantly between the two species. As intercellular CO2 concentration increased, net photosynthetic rate increased and then gradually leveled off in both species. Initial carboxylation efficiency was significantly higher in C. gigantocarpa, whereas the other CO2-response parameters showed no significant differences between species. Leaf thickness and lower epidermal thickness were similar between species, but C. gigantocarpa had a thicker upper epidermis and palisade tissue and a higher palisade-to-spongy tissue thickness ratio, whereas C. longzhouensis had thicker spongy tissue and higher stomatal density. Stomatal length, width, and area did not differ significantly between species. C. gigantocarpa had significantly higher chlorophyll a, chlorophyll b, total chlorophyll, and carotenoid contents, as well as a higher chlorophyll a-to-b ratio, whereas the ratio of carotenoids to total chlorophyll did not differ significantly between species. Trait correlations indicated coordinated variation among photosynthetic performance, leaf anatomy, stomatal characteristics, and photosynthetic pigments. Overall, the two species exhibited distinct combinations of leaf structural and photosynthetic functional traits under common nursery conditions, providing baseline ecophysiological information on their resource-use differences and for germplasm conservation of C. longzhouensis.
1. Introduction
Leaf structural and physiological traits provide an important functional basis for comparing resource acquisition and use among closely related plant species [1,2]. Camellia longzhouensis, a member of the golden Camellia group in the family Theaceae and genus Camellia, has a narrow natural distribution, and its closely related taxa have received considerable attention with respect to taxonomy and germplasm conservation [3]. Field surveys have shown that C. longzhouensis and related taxa occur mainly beneath forests in karst mountain areas of southwestern Guangxi. Their natural populations are small, and population persistence and regeneration are closely associated with habitat conditions such as understory light and soil environment [4]. Camellia gigantocarpa, also belonging to Camellia, occurs naturally in several regions of southern China and has a relatively broad geographic distribution [5]. Therefore, comparing leaf structure and physiological function between C. longzhouensis and C. gigantocarpa within a close phylogenetic framework can minimize the confounding effects of phylogenetic distance and help characterize interspecific differences in resource-use-related functional traits [6].
Light- and CO2-response curves provide complementary measures of light use, carbon-assimilation capacity, and photosynthetic performance and are therefore useful for comparing resource-use-related physiological differences among species [7,8,9]. Previous studies in Camellia have demonstrated substantial interspecific and light-dependent variation in photosynthetic capacity and irradiance responses [10,11,12]. Chai et al. further reported that Maoban golden Camellia had lower Pmax, AQY, and CO2-use capacity than tea and suggested that its narrower irradiance range and weaker carbon-assimilation capacity might be associated with its restricted distribution [6].
Leaf anatomical traits can influence photosynthetic performance through their effects on internal light distribution and CO2 diffusion. In particular, palisade and spongy tissue organization and stomatal size and density contribute to coordination between carbon acquisition and gas exchange [13,14,15,16]. Variation in these structural traits, together with photosynthetic resource allocation, can therefore provide complementary information on leaf resource-use strategies [17,18].
Studies in Camellia have documented interspecific variation in epidermal, stomatal, and mesophyll traits and associations between leaf structure and photosynthetic performance [19,20,21]. However, research on C. longzhouensis has focused mainly on taxonomy, natural population distribution, and conservation biology [3,4]. Integrated studies of its light response, CO2 response, photosynthetic pigments, leaf anatomy, and stomatal traits remain limited, and systematic comparisons of the relationship between leaf structure and photosynthetic function, together with trait coordination, between C. longzhouensis and C. gigantocarpa are still lacking.
Accordingly, this study compared C. longzhouensis and C. gigantocarpa under common nursery conditions to address three questions: (1) Do the two species differ in light- and CO2-use characteristics? (2) Do they differ in leaf anatomical, stomatal, and photosynthetic pigment traits? (3) How are these structural and physiological traits coordinated with photosynthetic performance? By integrating these trait dimensions, we aimed to characterize interspecific differences in resource-use-related functional traits and provide baseline ecophysiological information for future studies of habitat associations and geographic range, as well as for ex situ conservation of C. longzhouensis.
2. Materials and Methods
2.1. Plant Materials
The experiment was conducted in the nursery of the Guangxi Institute of Botany, Yanshan District, Guilin, Guangxi, China (25°01′ N, 110°17′ E; approximately 180 m a.s.l.). The experimental plants of Camellia longzhouensis and Camellia gigantocarpa were raised from seeds and cultivated for eight years in the same nursery before the experiment. Both species were maintained under the same nursery conditions, including the same cultivation substrate, irrigation, fertilization, and routine management practices. For each species, three healthy and vigorous individual plants without obvious pests or diseases were selected as independent biological replicates (n = 3 plants per species). For each measurement category, one fully expanded, mature functional leaf without mechanical damage, pests, or diseases was measured or sampled from the middle canopy of each individual plant. Leaves of similar age and from comparable canopy positions were selected from the same three plants of each species. Separate leaves from each plant were used for the light-response, CO2-response, leaf anatomical, stomatal, and photosynthetic pigment measurements.
2.2. Measurement of Light-Response Curves
Light-response measurements were conducted between 09:00 and 12:00 on clear days with an LI-6800 portable photosynthesis system fitted with a 6800-01 fluorescence leaf chamber (LI-COR Biosciences, Lincoln, NE, USA). One fully expanded mature leaf from each of three independent plants was used for each species (n = 3 plants per species). Before data collection, the selected leaves were allowed to equilibrate for 15–30 min under a PPFD of 1000 μmol·m−2·s−1 until photosynthetic gas exchange stabilized.
Chamber conditions were controlled at a reference CO2 concentration of 400 μmol·mol−1, a flow rate of 500 μmol·s−1, approximately 25 °C, approximately 60% relative humidity, and a fan speed of 10,000 r·min−1. The built-in “Light_Response” routine imposed PPFD levels in the sequence 1800, 1500, 1200, 900, 600, 300, 200, 150, 100, 70, 30, and 0 μmol·m−2·s−1. Pn was recorded only after gas-exchange variables had stabilized at each irradiance level. Pn–PPFD data were fitted to the modified rectangular hyperbola model [8] in Leaf Photosynthesis Modeling Software 4.1.1, treating PPFD as the independent variable and Pn as the response variable. In this formulation, AQY represents the initial slope of the response, β and γ are model coefficients, and Rd represents dark respiration. After confirming satisfactory model fit, LSP, Pmax, and LCP were derived from the equations below.
2.3. Measurement of CO2-Response Curves
CO2-response measurements were performed with the same LI-6800 system and the same three plants used for the light-response experiment, although a different leaf was measured on each plant. Sampling time and leaf-selection criteria were unchanged. Leaves were equilibrated for 15–30 min at 1000 μmol·m−2·s−1 PPFD before measurement. Chamber flow, temperature, relative humidity, fan speed, and PPFD were maintained at 500 μmol·s−1, approximately 25 °C, approximately 60%, 10,000 r·min−1, and 1000 μmol·m−2·s−1, respectively.
Using the “CO2_Response” routine, reference-air CO2 was adjusted sequentially to 400, 300, 200, 100, 50, 400, 600, 800, 1000, 1200, 1400, and 1600 μmol·mol−1, thereby covering both decreasing and increasing CO2 phases. Each step lasted 120–180 s, and Pn together with Ci was recorded after the gas-exchange signal became stable. The Pn–Ci relationship was fitted with the modified rectangular hyperbola model [8] in Leaf Photosynthesis Modeling Software 4.1.1, using Ci as the predictor and Pn as the response. In this model, α describes the initial carboxylation efficiency, β and γ are fitted coefficients, and Rp represents photorespiration. When Pn = 0, the CO2 compensation point (CDCP) can be obtained using the following equation:
2.4. Leaf Anatomical Measurements
Leaf cross sections were prepared using a paraffin-based procedure following Li [22]. One healthy leaf was obtained from the middle canopy of each of three independent plants per species, with leaf orientation, developmental status, and maturity kept as comparable as possible. A segment of approximately 10 mm × 10 mm was removed from the central lamina, excluding the midrib and margin, and immediately immersed in FAA [70% ethanol:formalin:glacial acetic acid = 90:5:5 (v/v/v)].
Fixed tissues were passed through graded ethanol for dehydration, cleared with xylene, infiltrated with molten paraffin, and embedded before transverse sectioning. The resulting sections were flattened and deparaffinized with xylene, rehydrated through decreasing ethanol concentrations, and stained with toluidine blue. After staining, sections were dehydrated again through increasing ethanol concentrations, cleared in xylene, mounted, and photographed under a light microscope. Leaf tissue structures were measured using CaseViewer 2.4 image-analysis software.
Measured traits included leaf thickness (LT), upper epidermal thickness (UET), lower epidermal thickness (LET), palisade tissue thickness (PT), and spongy tissue thickness (ST). The palisade-to-spongy tissue thickness ratio (PT/ST) was also calculated. Measurements were restricted to intact regions in which tissue boundaries were clearly visible. Several fields were selected randomly within each section, and field-level measurements from the same leaf were averaged so that each plant contributed a single value for each anatomical trait. Thus, microscopic fields served only as within-plant subsamples.
2.5. Leaf Epidermal and Stomatal Trait Measurements
Epidermal and stomatal morphology was examined using the procedure described by Pan et al. [23]. One mature, healthy leaf from the middle canopy of each independent plant was rinsed with deionized water. A 5 mm × 5 mm piece was then excised from the central lamina while avoiding the midrib and leaf edge, placed immediately in 2.5% glutaraldehyde (pH 7.2), and kept at 4 °C.
Dehydration was performed successively in 30%, 50%, 70%, 85%, and 90% ethanol, followed by two changes in absolute ethanol; each step lasted approximately 15 min. The dehydrated material was dried in an HCP-2 critical point dryer (Hitachi, Tokyo, Japan), attached to SEM stubs, and coated with gold using an IB-3 ion sputter coater (Eiko Engineering, Hitachinaka, Japan). Adaxial and abaxial epidermal surfaces and stomata were then examined using a ZEISS EVO18 scanning electron microscope(Carl Zeiss AG, Oberkochen, Germany). Ten fields of view were randomly selected from each leaf sample for imaging and measurement. Measurements from the ten fields were averaged to obtain one value for each stomatal trait for the corresponding plant, and the fields were not treated as independent biological replicates.
Stomatal length (SL), stomatal width (SW), stomatal area (SA), and stomatal density (SD) were measured using Axio Vision SE64 Rel. 4.8 image-analysis software. Stomatal density was calculated as the number of stomata per unit field area:
where N is the number of stomata in the field of view and S is the corresponding field area. Stomatal area was approximated as an ellipse:
where π = 3.14, and SL and SW are the stomatal length and width, respectively.
SD = N/S
SA = π × SL × SW/4
2.6. Determination of Photosynthetic Pigments
Photosynthetic pigment contents were determined using the ethanol extraction method of Li [24]. For each species, one healthy leaf of similar maturity, canopy position, and growth status was collected from each of the three independent plants (n = 3 plants per species). Each leaf sample was processed separately, and leaf tissues from different plants were not pooled. After the veins were removed, the leaf tissue was cut into small pieces and mixed thoroughly. Fresh leaf tissue (0.02 g) was weighed accurately, mixed with 1.5 mL of 95% ethanol, and extracted for 24 h in darkness until the tissue was largely decolorized. When necessary, the extract was diluted fivefold before spectrophotometric readings were obtained at 470, 649, and 665 nm. Chl a, Chl b, and Car concentrations were subsequently derived from these absorbance values according to Li [24]:
where A665, A649, and A470 are the absorbances at 665, 649, and 470 nm, respectively. Pigment contents per unit fresh mass were calculated from extract volume, sample fresh mass, and dilution factor and expressed as mg·g−1. Total chlorophyll content was calculated as Chl(a + b) = Chl a + Chl b. The Chl a/Chl b ratio and the ratio of carotenoids to total chlorophyll, Car/Chl(a + b), were also calculated.
Ca = 13.95A665 − 6.88A649
Cb = 24.96A649 − 7.32A665
Technical measurements were repeated within each plant sample. Their absorbance readings were first averaged at the plant level and this mean was used to calculate pigment content, ensuring that only one independent value per plant entered the statistical analysis.
2.7. Data Processing and Statistical Analysis
Data were organized in Microsoft Excel 2021 and summarized as mean ± SD. The experimental unit for all analyses was the individual plant, with three independent plants representing each species. One leaf per plant was used for each measurement category. Where multiple microscopic fields or technical measurements were available within a plant, these values were averaged before analysis rather than being counted as separate observations. Statistical analyses were performed using IBM SPSS Statistics 27.0. Normality and variance homogeneity were evaluated before testing for species differences. An independent-samples t-test was applied when the assumptions of normality and equal variance were satisfied; otherwise, Welch’s t-test was used for comparisons involving unequal variances. The significance threshold was p < 0.05. Different lowercase letters within the same trait indicate a significant difference between species (p < 0.05), whereas identical lowercase letters indicate no significant difference. Light- and CO2-response curves were fitted using Leaf Photosynthesis Modeling Software 4.1.1, and graphs and data visualizations were produced in OriginPro 2021 (Origin Lab Corporation, Northampton, MA, USA)and R version 4.5.3 (R Foundation for Statistical Computing, Vienna, Austria ). R2 values were calculated from the fitted group-mean response curves and were reported solely as model-fit statistics; they were not included in the inferential comparisons between species. Relationships among gas-exchange, anatomical, stomatal, and pigment traits were evaluated using Pearson correlation analysis. Because all measurement categories were obtained from the same three plants of each species, trait values were paired at the plant level. Field-level and technical measurements had already been averaged within plants and therefore did not contribute additional independent data points. Pearson’s r was used to quantify both the direction and magnitude of each association. Values of p < 0.05 and p < 0.01 were considered significant and highly significant, respectively. In the correlation plot, *, **, and *** indicate p < 0.05, p < 0.01, and p < 0.001, respectively.
3. Results
3.1. Light-Response Characteristics
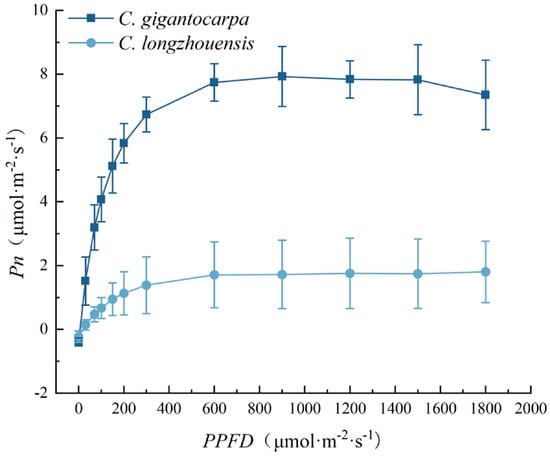
As shown in Figure 1, Pn of both species increased rapidly with increasing photosynthetic photon flux density (PPFD) and then gradually approached a plateau. At low irradiance, Pn increased rapidly as PPFD increased in both species. As irradiance increased further, the rate of increase in Pn declined and the curves gradually stabilized. The light-response curve of C. gigantocarpa was generally above that of C. longzhouensis, with more pronounced differences at medium and high PPFD.
Figure 1.
Light-response curves of C. longzhouensis and C. gigantocarpa. Pn, net photosynthetic rate; PPFD, photosynthetic photon flux density. Data are presented as mean ± SD (n = 3 independent plants per species).
Table 1 shows that Pmax of C. gigantocarpa was 7.94 μmol·m−2·s−1, significantly higher than the value of 1.94 μmol·m−2·s−1 in C. longzhouensis (p < 0.05), and approximately 4.10 times that in C. longzhouensis. AQY was 0.08 in C. gigantocarpa and 0.02 in C. longzhouensis, but the difference was not statistically significant. LSP values were 947.35 and 859.00 μmol·m−2·s−1, respectively, with no significant difference. LCP was higher in C. longzhouensis (17.24 μmol·m−2·s−1) than in C. gigantocarpa (5.88 μmol·m−2·s−1), but the difference was also not significant. Rd did not differ significantly between species. Thus, C. gigantocarpa exhibited a higher maximum net photosynthetic capacity, whereas the other light-response parameters differed relatively little between the two species.
Table 1.
Comparison of light-response parameters between C. longzhouensis and C. gigantocarpa.
3.2. CO2-Response Characteristics
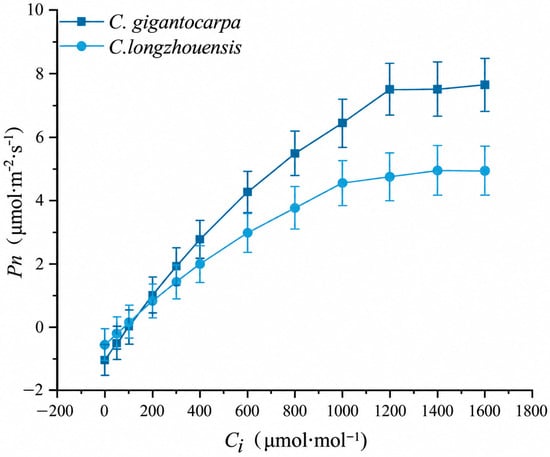
As shown in Figure 2, Pn of both species increased continuously with increasing intercellular CO2 concentration (Ci), and the increase gradually slowed at higher Ci. At low Ci, Pn increased rapidly with increasing Ci in both species; as Ci increased further, the response curves gradually flattened. Pn was generally higher in C. gigantocarpa than in C. longzhouensis, and the differences were more apparent at intermediate and high Ci.
Figure 2.
CO2-response curves of C. longzhouensis and C. gigantocarpa. Pn, net photosynthetic rate; Ci, intercellular CO2 concentration. Data are presented as mean ± SD (n = 3 independent plants per species).
According to Table 2, the initial slope (α) of the CO2-response curve was 1.10 × 10⁻² in C. gigantocarpa, significantly higher than 0.79 × 10⁻² in C. longzhouensis (p < 0.05). Amax was 7.72 μmol·m−2·s−1 in C. gigantocarpa and 4.96 μmol·m−2·s−1 in C. longzhouensis, but the difference was not statistically significant. CDSP values were 1590.42 and 1485.90 μmol·mol−1, CDCP values were 104.96 and 98.71 μmol·mol−1, and Rp values were 1.07 and 0.67 μmol·m−2·s−1 for C. gigantocarpa and C. longzhouensis, respectively; none of these traits differed significantly between species. C. gigantocarpa therefore showed higher initial carboxylation efficiency, whereas interspecific differences in Amax, CDSP, CDCP, and Rp were not significant.
Table 2.
CO2-response parameters of C. gigantocarpa and C. longzhouensis.
3.3. Leaf Anatomical Structure
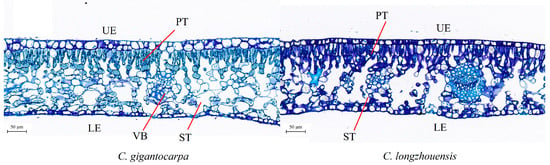
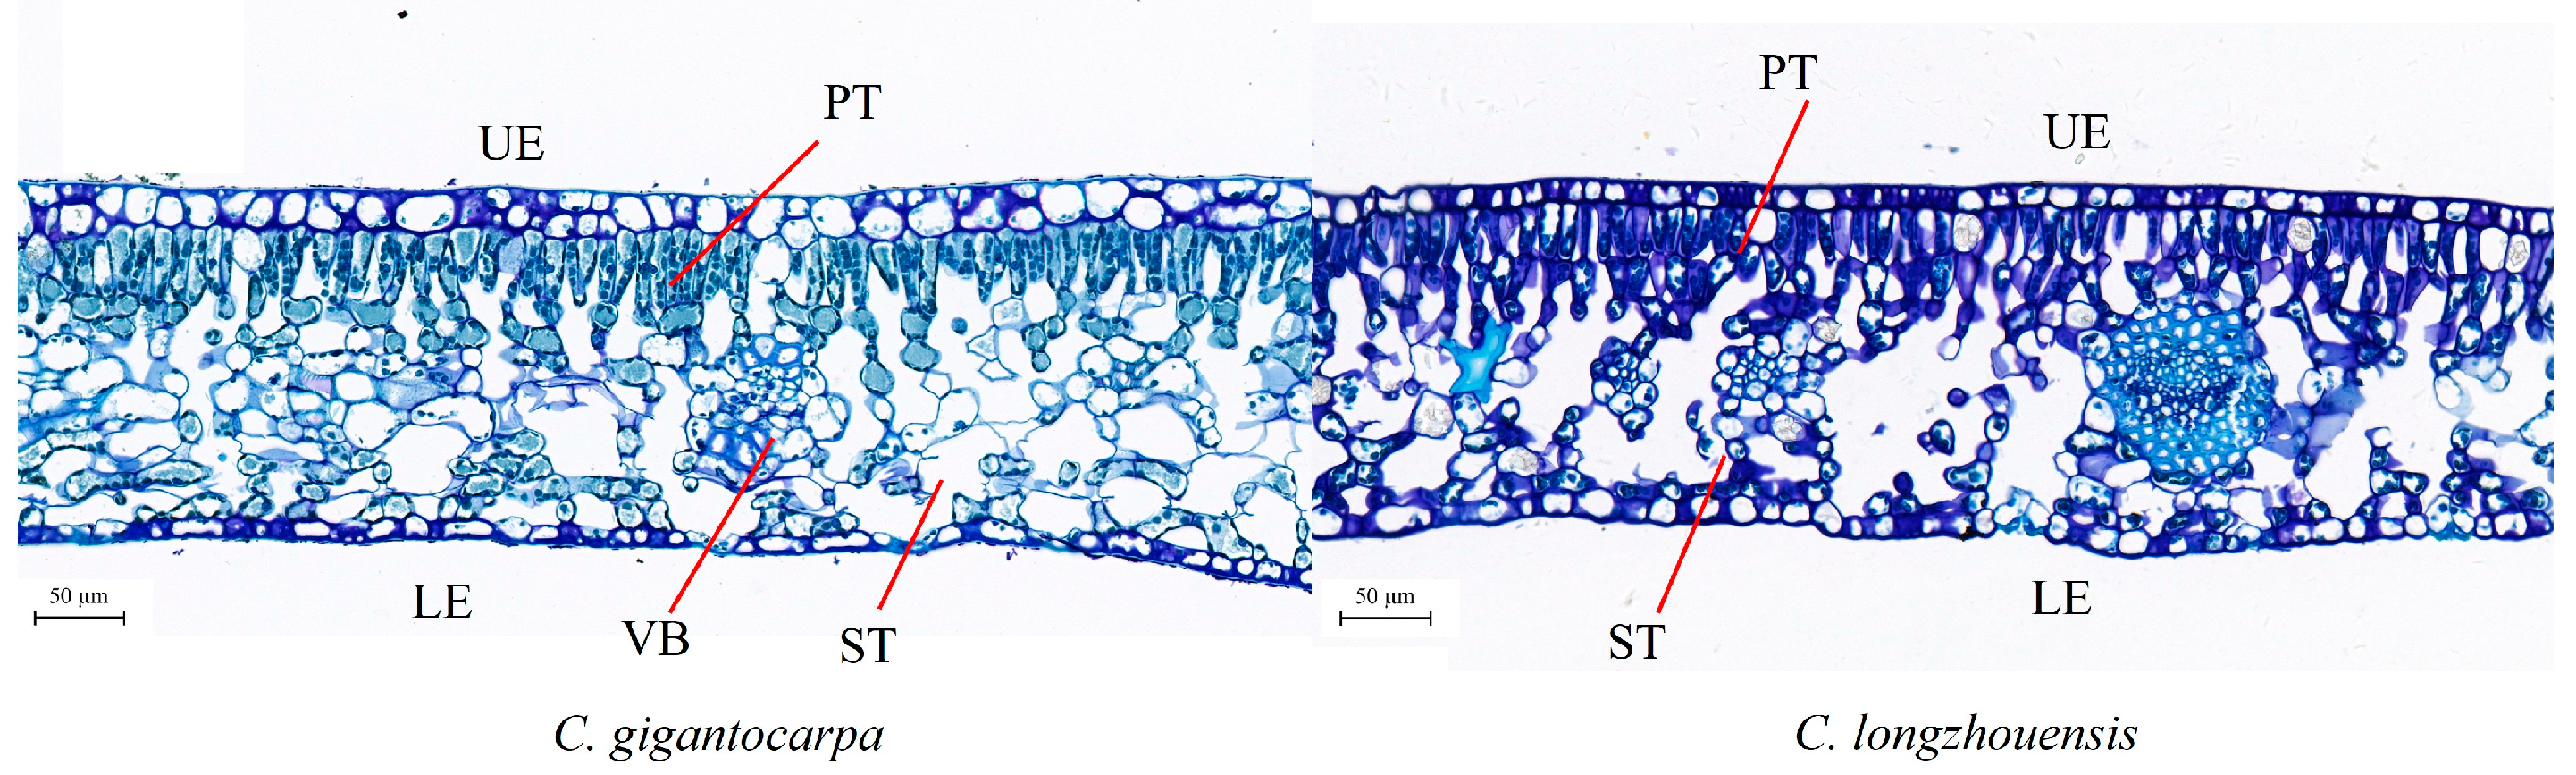
Figure 3 shows that leaves of both C. longzhouensis and C. gigantocarpa had well-defined upper and lower epidermis, palisade tissue, spongy tissue, and vascular bundles, with clear mesophyll differentiation. However, some differences in internal tissue configuration were observed between species. Palisade tissue was more developed in C. gigantocarpa, whereas spongy tissue occupied a relatively larger proportion in C. longzhouensis.
Figure 3.
Comparison of leaf anatomical structure between C. longzhouensis and C. gigantocarpa. UE, upper epidermis; LE, lower epidermis; PT, palisade tissue; ST, spongy tissue; VB, vascular bundle.
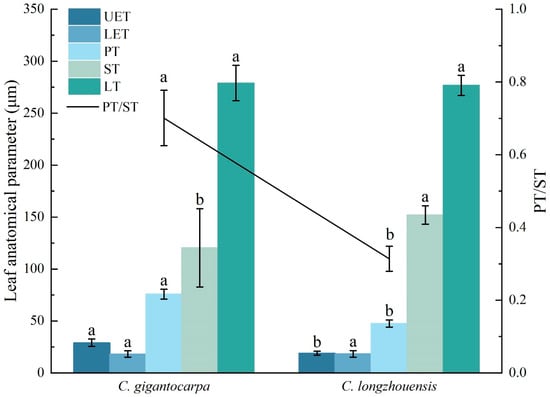
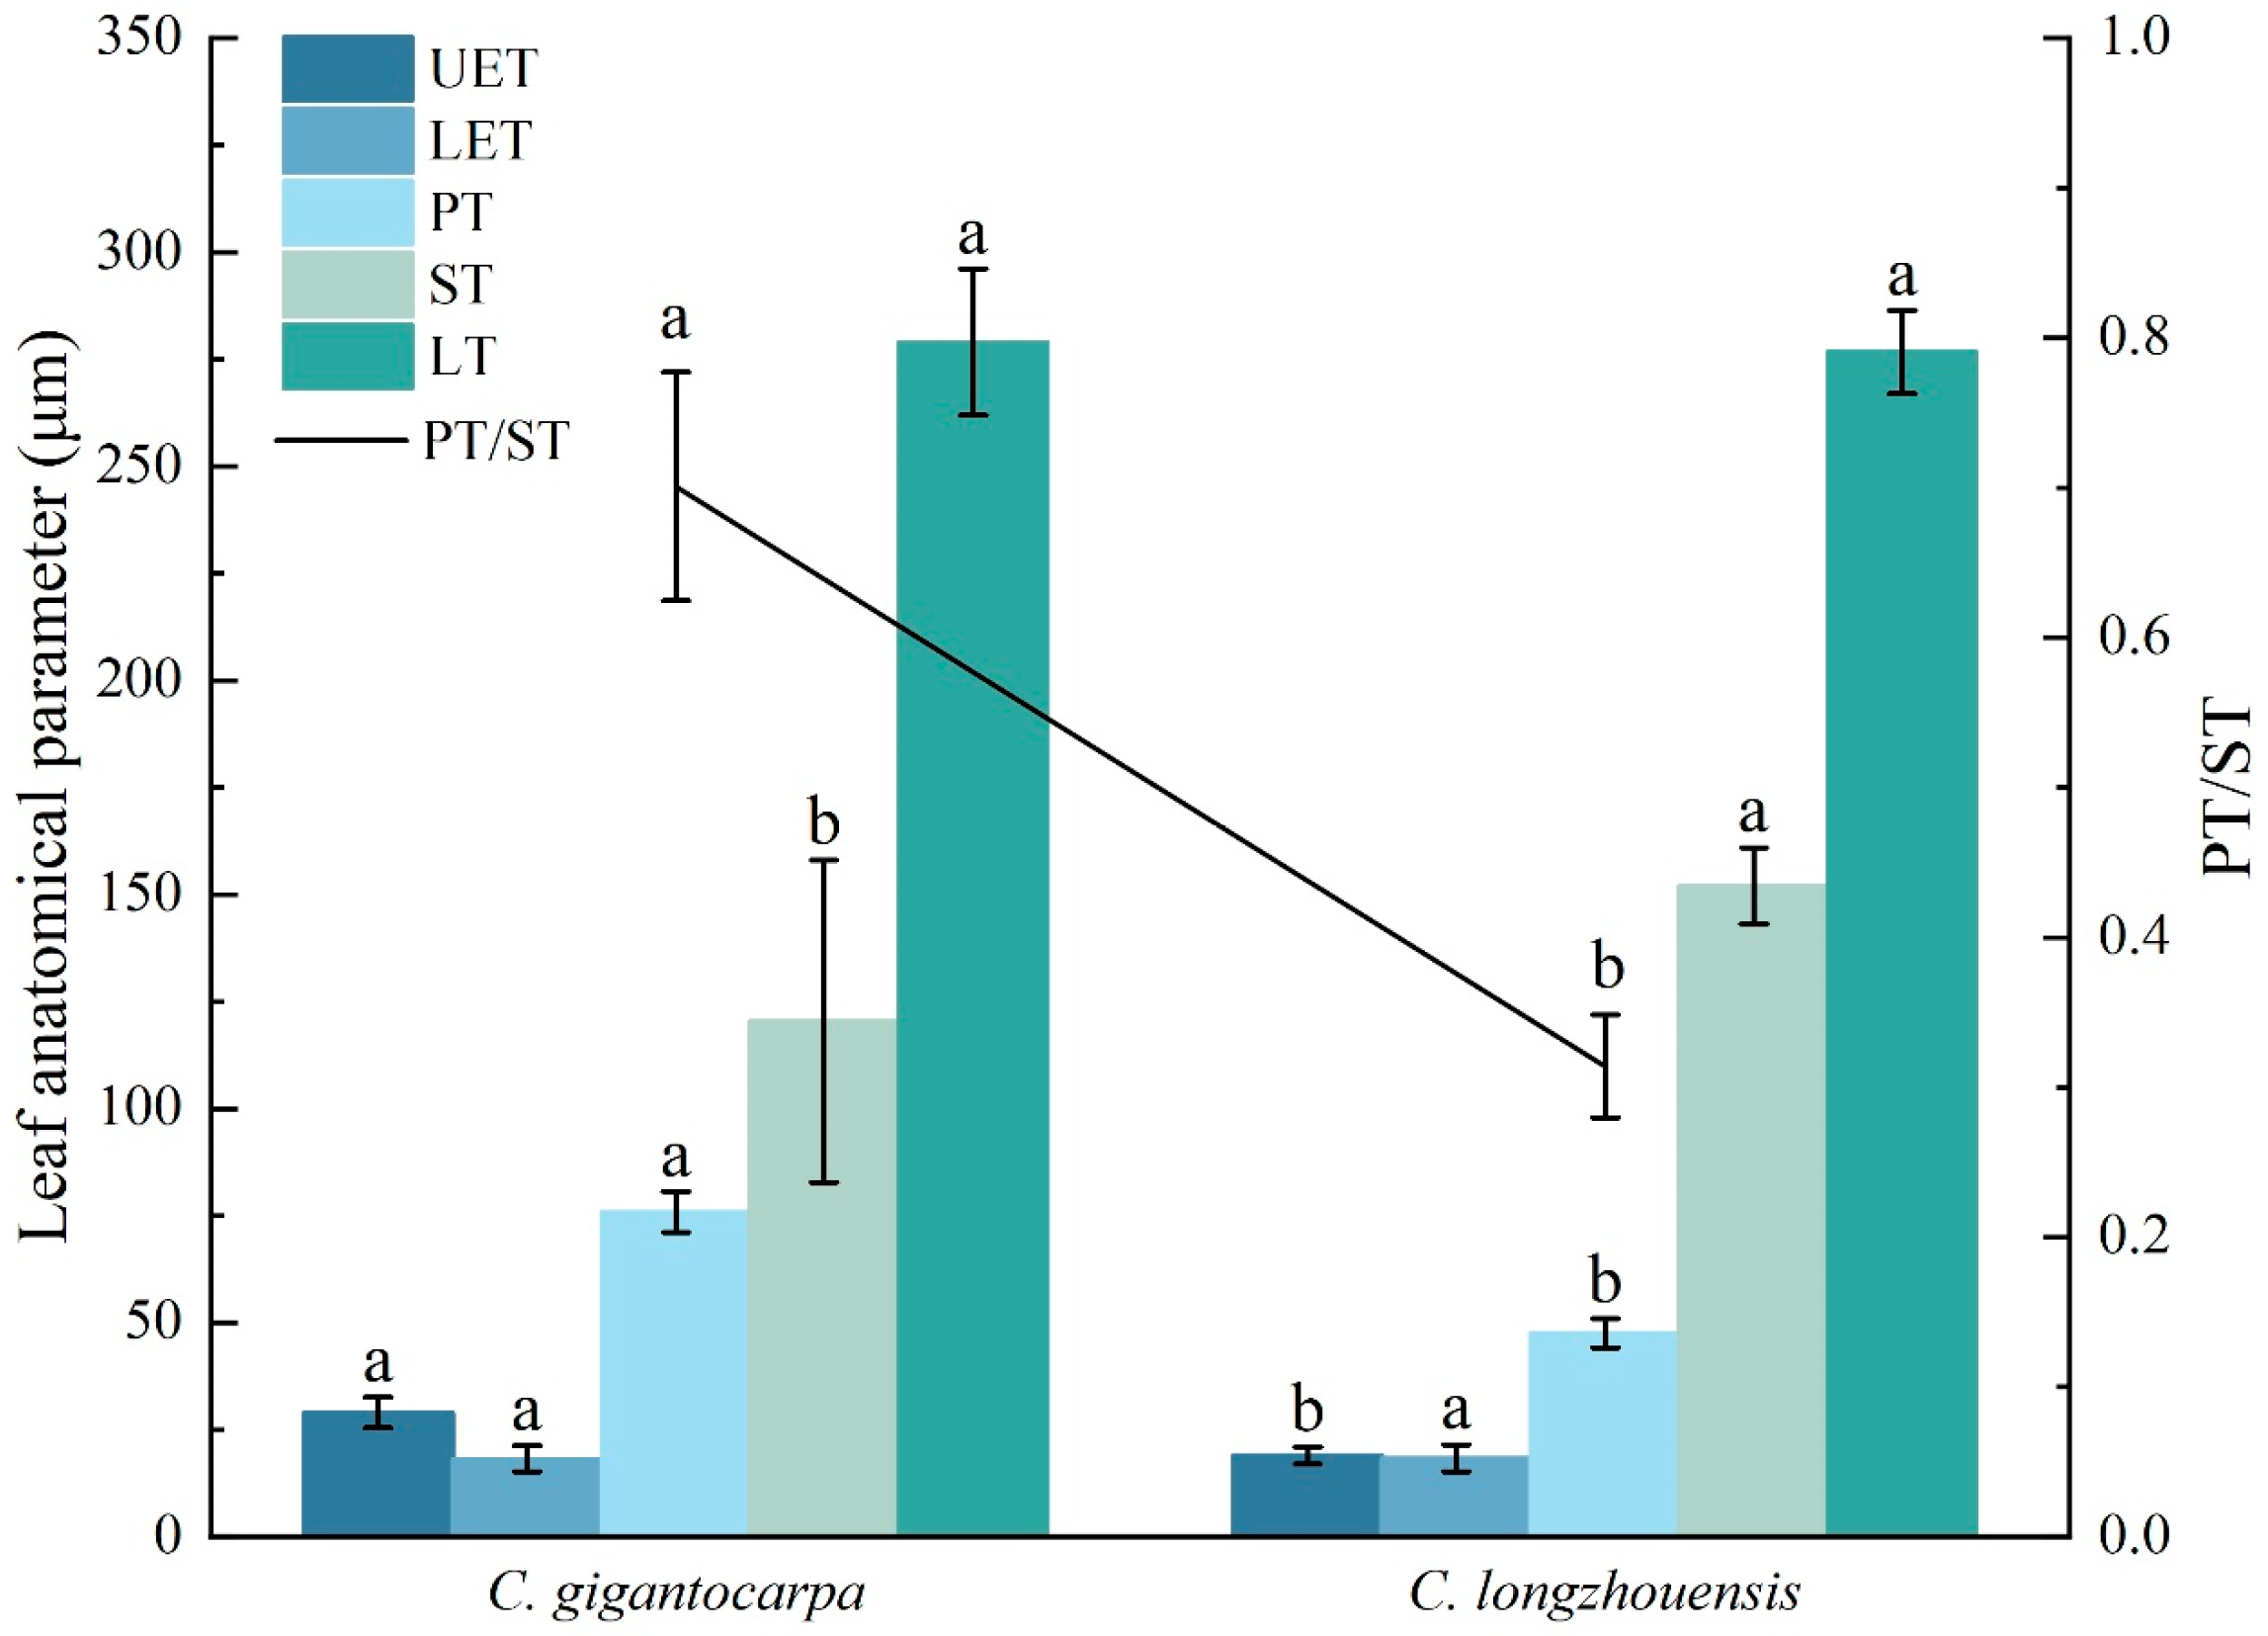
As shown in Figure 4 and Table 3, leaf thickness (LT) was 278.93 μm in C. gigantocarpa and 276.66 μm in C. longzhouensis, with no significant interspecific difference. Upper epidermal thickness (UET) was 28.94 μm in C. gigantocarpa, significantly greater than the 18.93 μm in C. longzhouensis (p < 0.05), whereas lower epidermal thickness (LET) did not differ significantly between species.
Figure 4.
Comparison of leaf anatomical parameters between C. longzhouensis and C. gigantocarpa. UET, upper epidermal thickness; LET, lower epidermal thickness; PT, palisade tissue thickness; ST, spongy tissue thickness; LT, leaf thickness; PT/ST, palisade-to-spongy tissue thickness ratio. Bars represent UET, LET, PT, ST, and LT, and the line represents PT/ST. Data are presented as mean ± SD (n = 3 independent plants per species). Different lowercase letters indicate a significant difference between species (p < 0.05), whereas identical lowercase letters indicate no significant difference.
Table 3.
Comparison of leaf tissue thicknesses and PT/ST between C. longzhouensis and C. gigantocarpa.
Mesophyll traits showed more pronounced interspecific differences. Palisade tissue thickness (PT) was 75.81 μm in C. gigantocarpa, significantly greater than the 47.49 μm in C. longzhouensis (p < 0.05). In contrast, spongy tissue thickness (ST) was 152.03 μm in C. longzhouensis, significantly greater than 120.42 μm in C. gigantocarpa (p < 0.05). PT/ST was 0.70 in C. gigantocarpa, significantly higher than 0.31 in C. longzhouensis (p < 0.05). Thus, overall leaf thickness was similar between species, but the relative allocation of palisade and spongy tissues differed between the two species.
3.4. Leaf Epidermal and Stomatal Traits
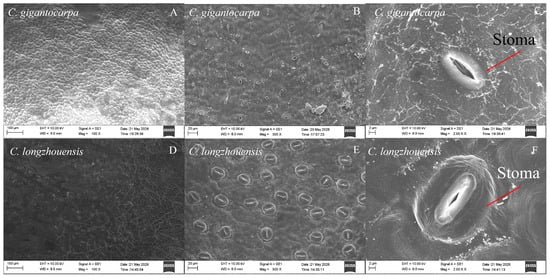
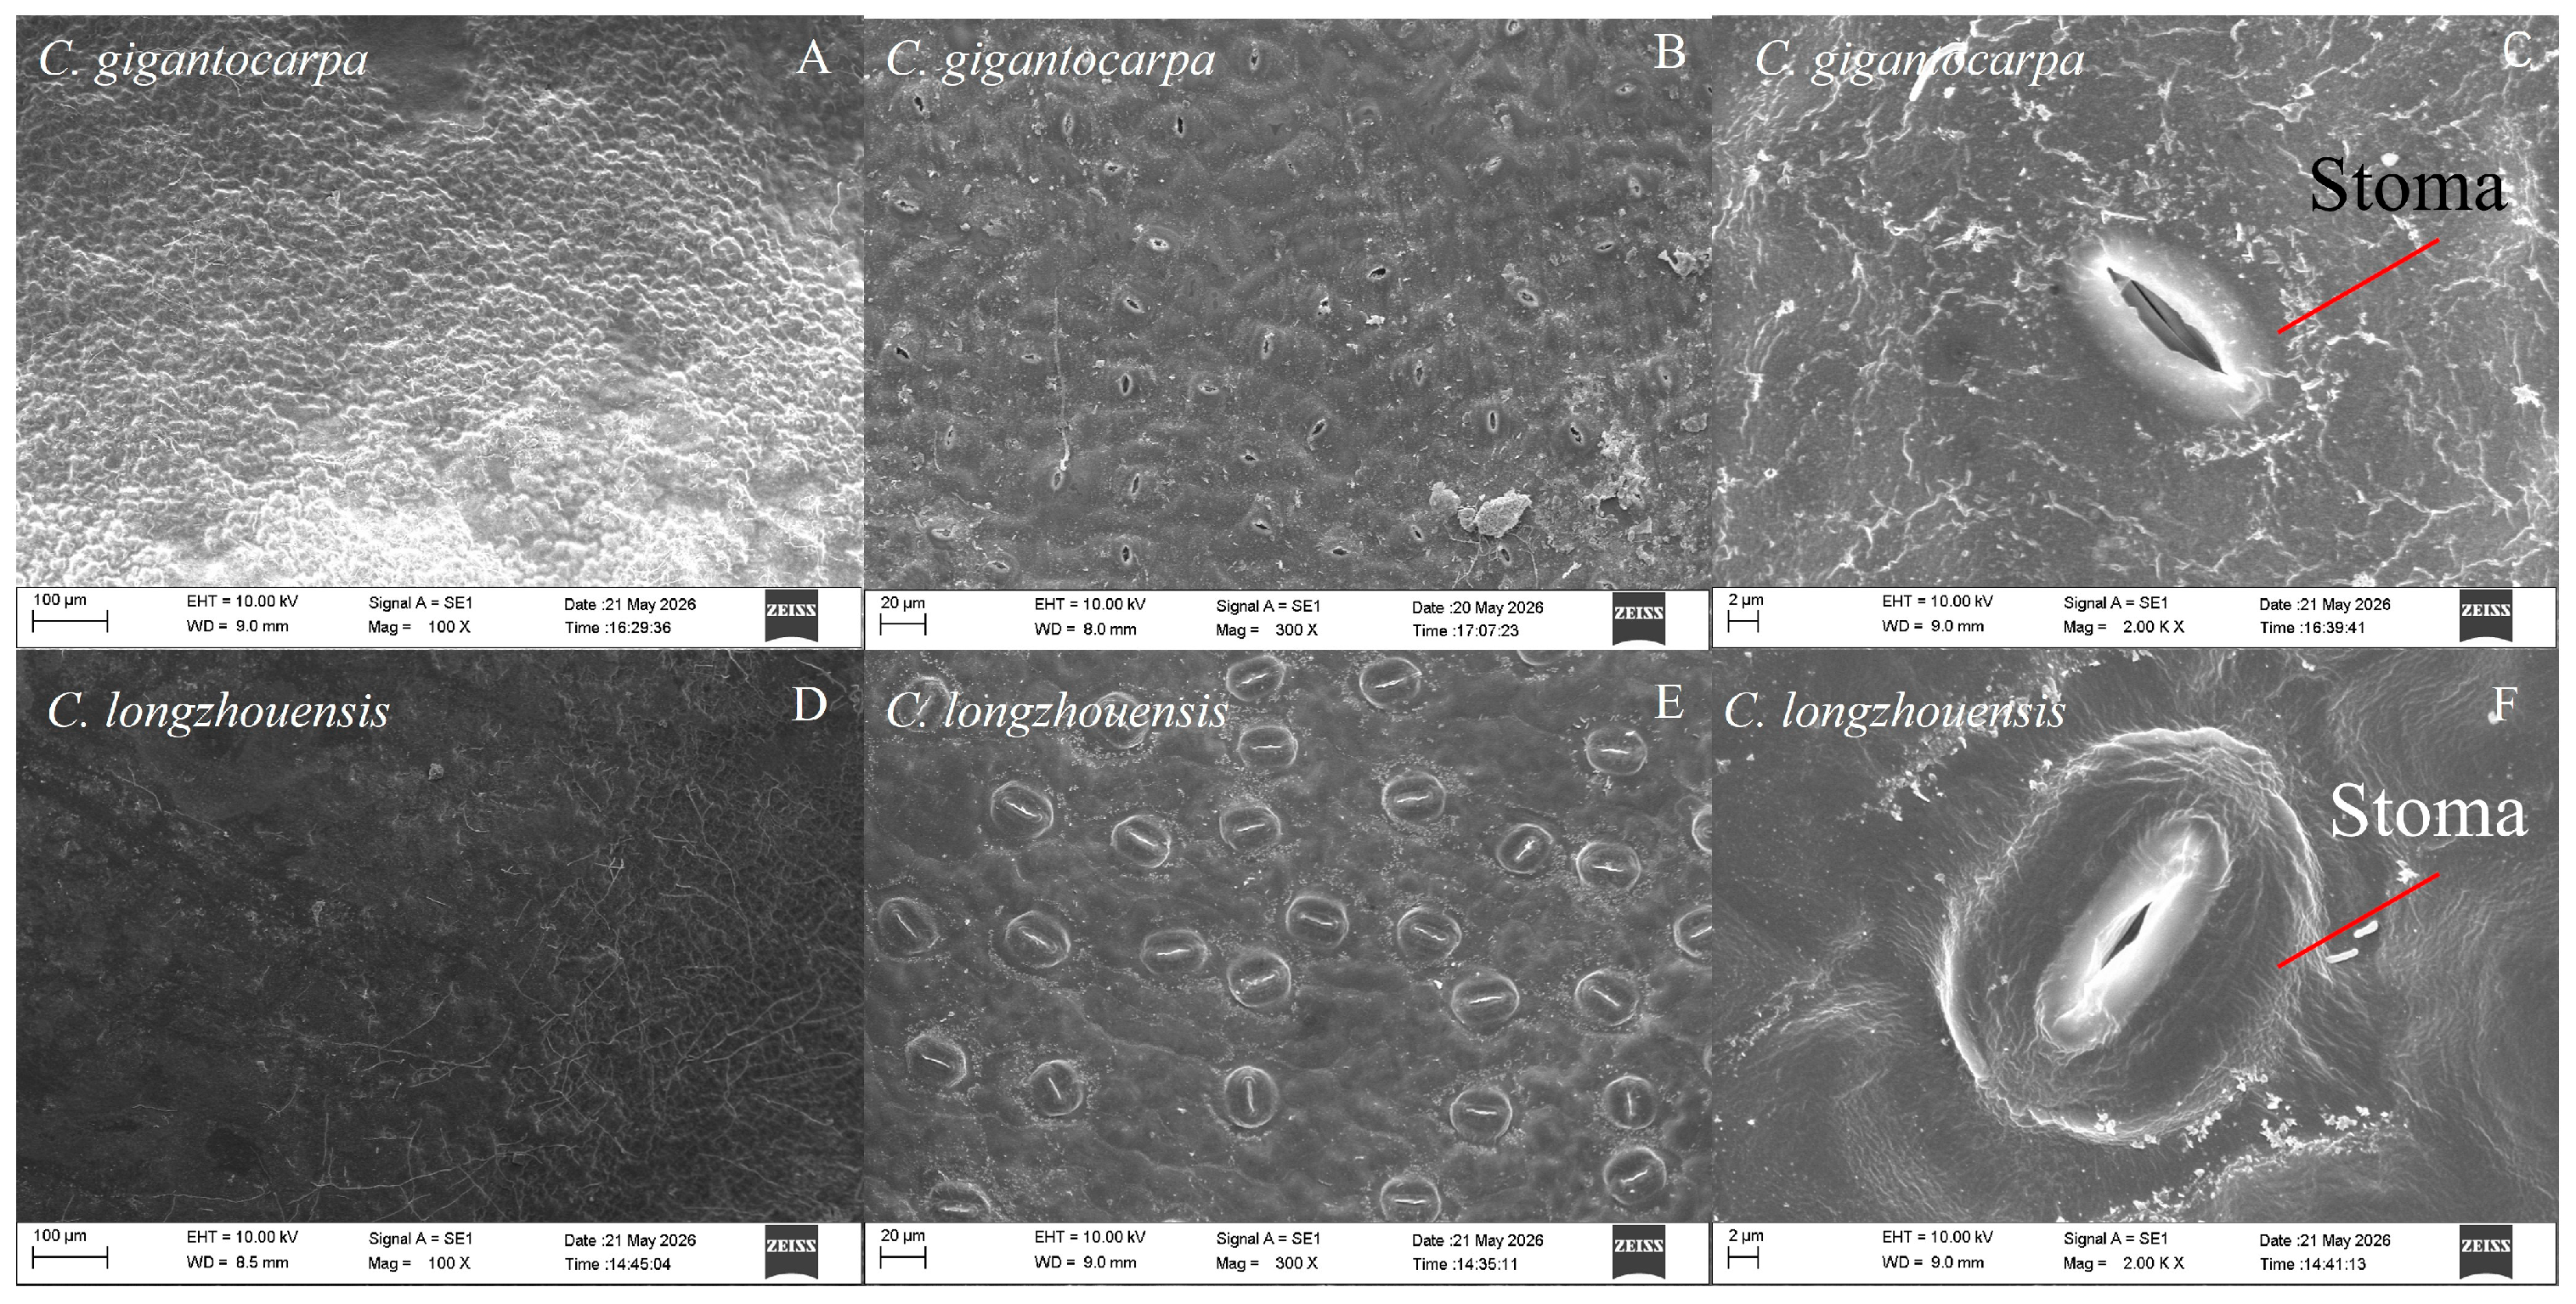
As shown in Figure 5, the leaf epidermis was intact in both species and stomata were clearly defined and generally elliptical. The morphology of individual stomata was similar between species, although stomatal abundance differed.
Figure 5.
Representative scanning electron micrographs of leaf epidermal characteristics in C. gigantocarpa and C. longzhouensis. (A–C), C. gigantocarpa; (D–F), C. longzhouensis. (A,D) show the adaxial epidermis, (B,E) show the abaxial epidermis, and (C,F) show enlarged views of stomata.
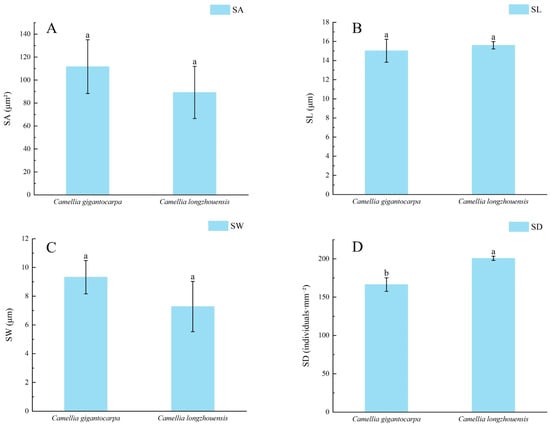
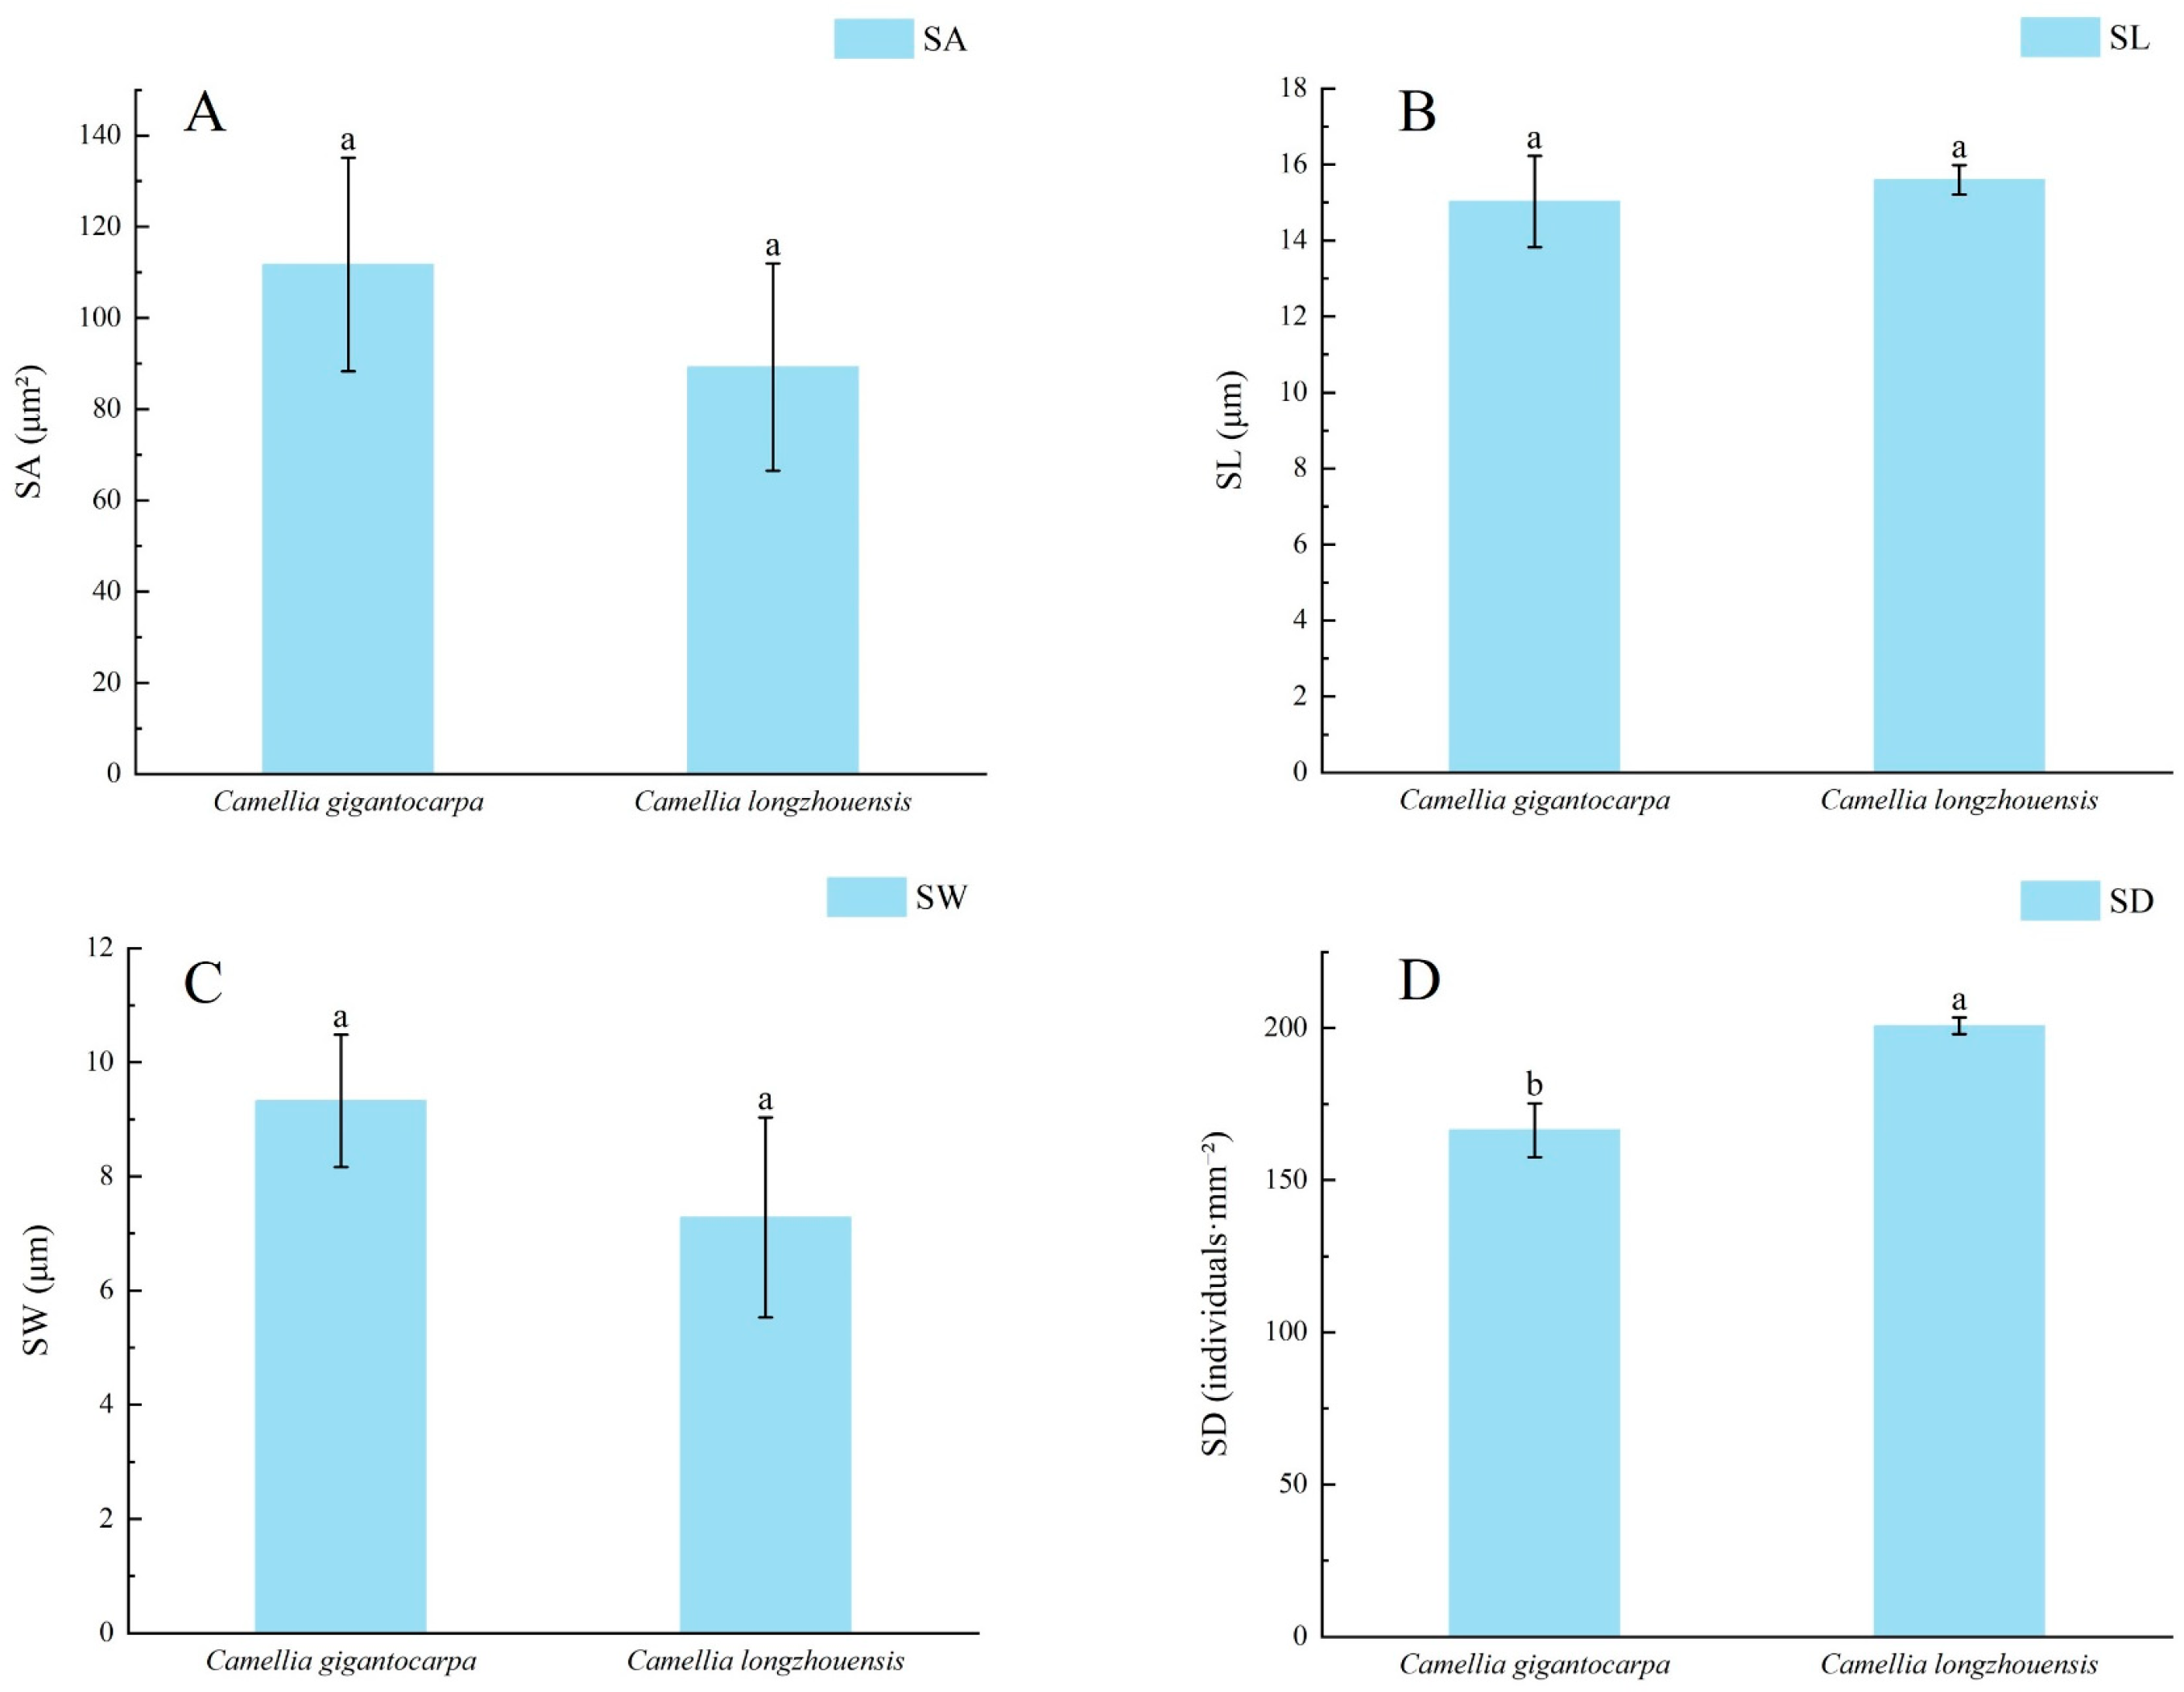
According to Figure 6 and Table 4, SL, SW, and SA were 15.02 μm, 9.32 μm, and 111.72 μm2, respectively, in C. gigantocarpa. The corresponding values in C. longzhouensis were 15.59 μm, 7.28 μm, and 89.26 μm2. None of these traits differed significantly between species. In contrast, stomatal density (SD) differed significantly: C. longzhouensis had 200.70 stomata·mm−2, significantly higher than 166.38 stomata·mm−2 in C. gigantocarpa (p < 0.05). Thus, interspecific differences in stomatal traits were mainly expressed as differences in stomatal density, whereas stomatal size was relatively stable.
Figure 6.
Comparison of stomatal traits between C. longzhouensis and C. gigantocarpa. (A) Stomatal area (SA); (B) stomatal length (SL); (C) stomatal width (SW); (D) stomatal density (SD). Data are presented as mean ± SD (n = 3 independent plants per species). Different lowercase letters indicate a significant difference between species (p < 0.05), whereas identical lowercase letters indicate no significant difference.
Table 4.
Comparison of stomatal parameters between C. longzhouensis and C. gigantocarpa.
3.5. Photosynthetic Pigment Contents
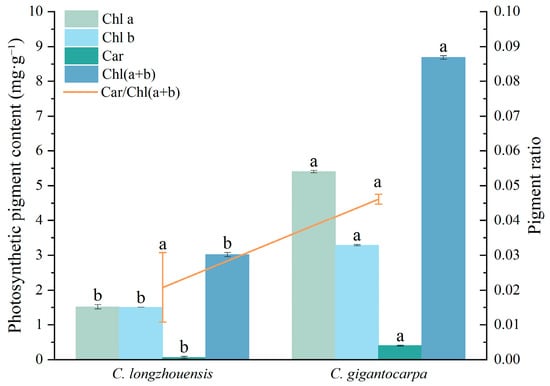
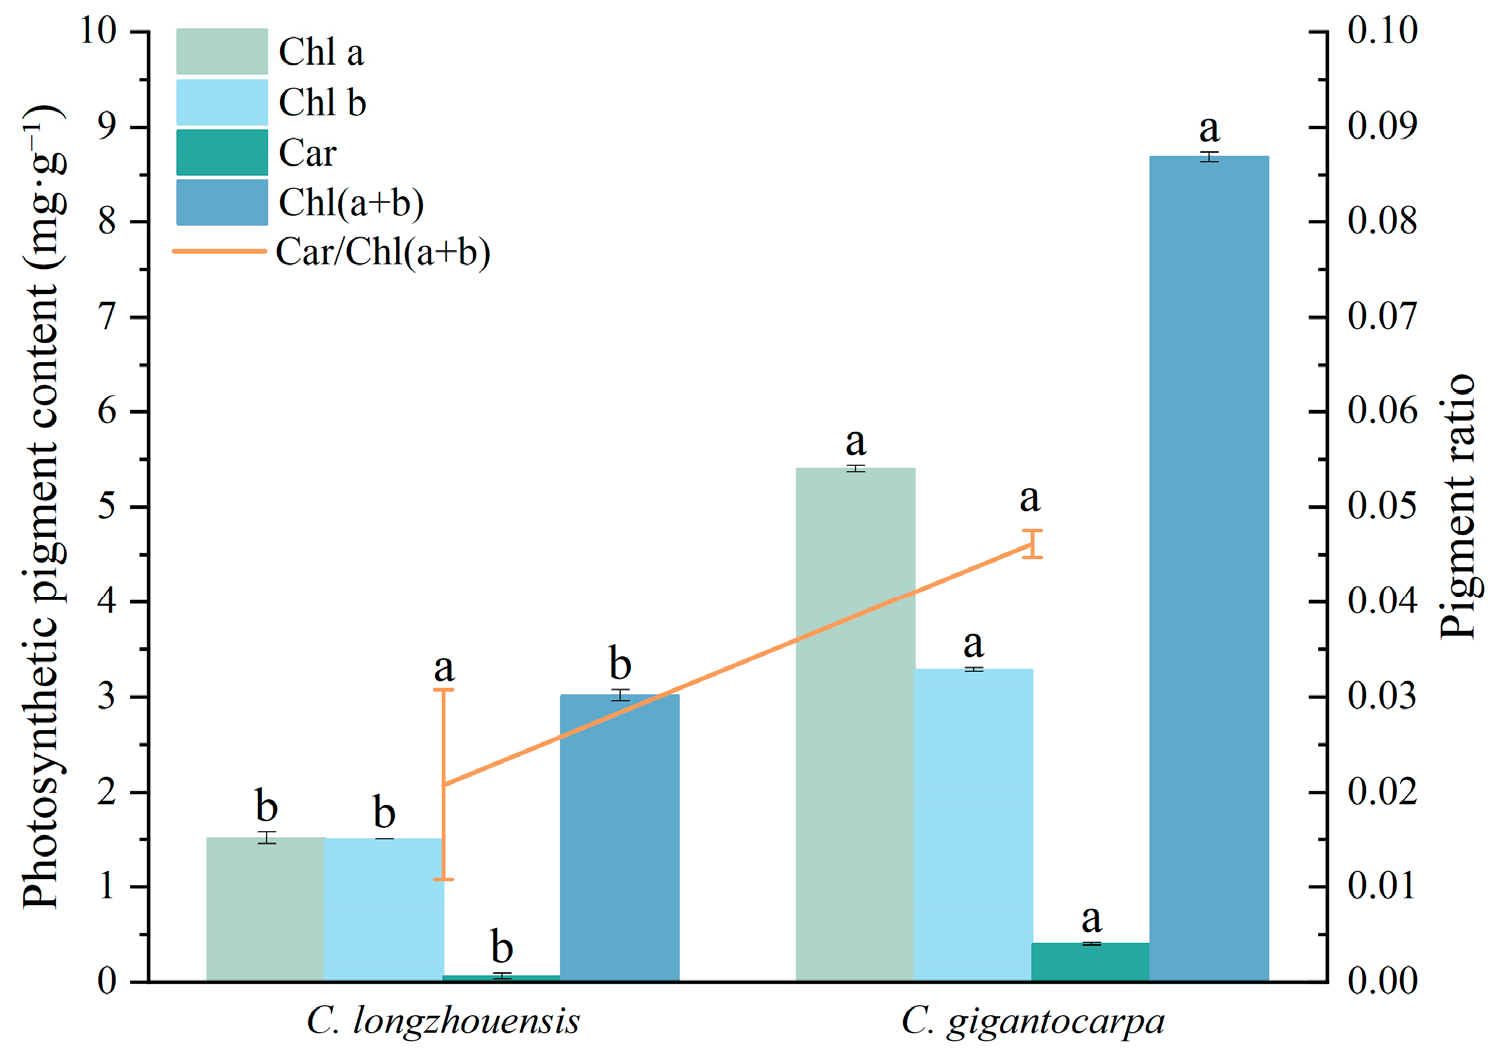
As shown in Figure 7 and Table 5, leaf photosynthetic pigment contents differed markedly between species. In C. gigantocarpa, chlorophyll a (Chl a), chlorophyll b (Chl b), carotenoids (Car), and total chlorophyll [Chl(a + b)] contents were 5.40, 3.29, 0.40, and 8.69 mg·g−1, respectively. Each value was significantly higher than the corresponding value of 1.51, 1.50, 0.06, and 3.02 mg·g−1 in C. longzhouensis (p < 0.05). Chl a and Chl(a + b) contents in C. gigantocarpa were approximately 3.57 and 2.88 times those in C. longzhouensis, respectively, while Car was approximately 6.37 times as high, indicating substantial interspecific differences in the accumulation of major photosynthetic pigments.
Figure 7.
Comparison of leaf photosynthetic pigment contents between C. longzhouensis and C. gigantocarpa. Note: Chl a, chlorophyll a content; Chl b, chlorophyll b content; Chl(a + b), total chlorophyll content; Car, carotenoid content; Car/Chl(a + b), ratio of carotenoid content to total chlorophyll content. Data are presented as mean ± SD (n = 3 independent plants per species). Different lowercase letters indicate a significant difference between species (p < 0.05), whereas identical lowercase letters indicate no significant difference.
Table 5.
Comparison of leaf photosynthetic pigment contents between C. longzhouensis and C. gigantocarpa.
Table 5 shows that Chl a/Chl b was 1.64 in C. gigantocarpa, significantly higher than 1.01 in C. longzhouensis (p < 0.05). Car/Chl(a + b) was 0.046 and 0.021, respectively, with no significant interspecific difference. Thus, the two species differed not only in the contents of major photosynthetic pigments but also in the relative composition of chlorophyll a and chlorophyll b, whereas the proportion of carotenoids relative to total chlorophyll was similar.
3.6. Correlations Among Leaf Microstructural Traits, Photosynthetic Pigments, and Photosynthetic Parameters
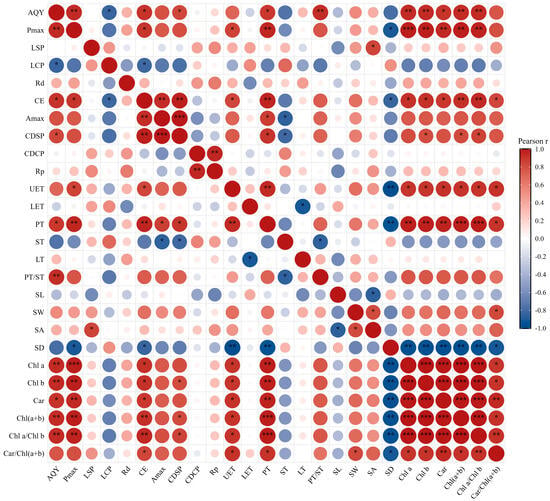
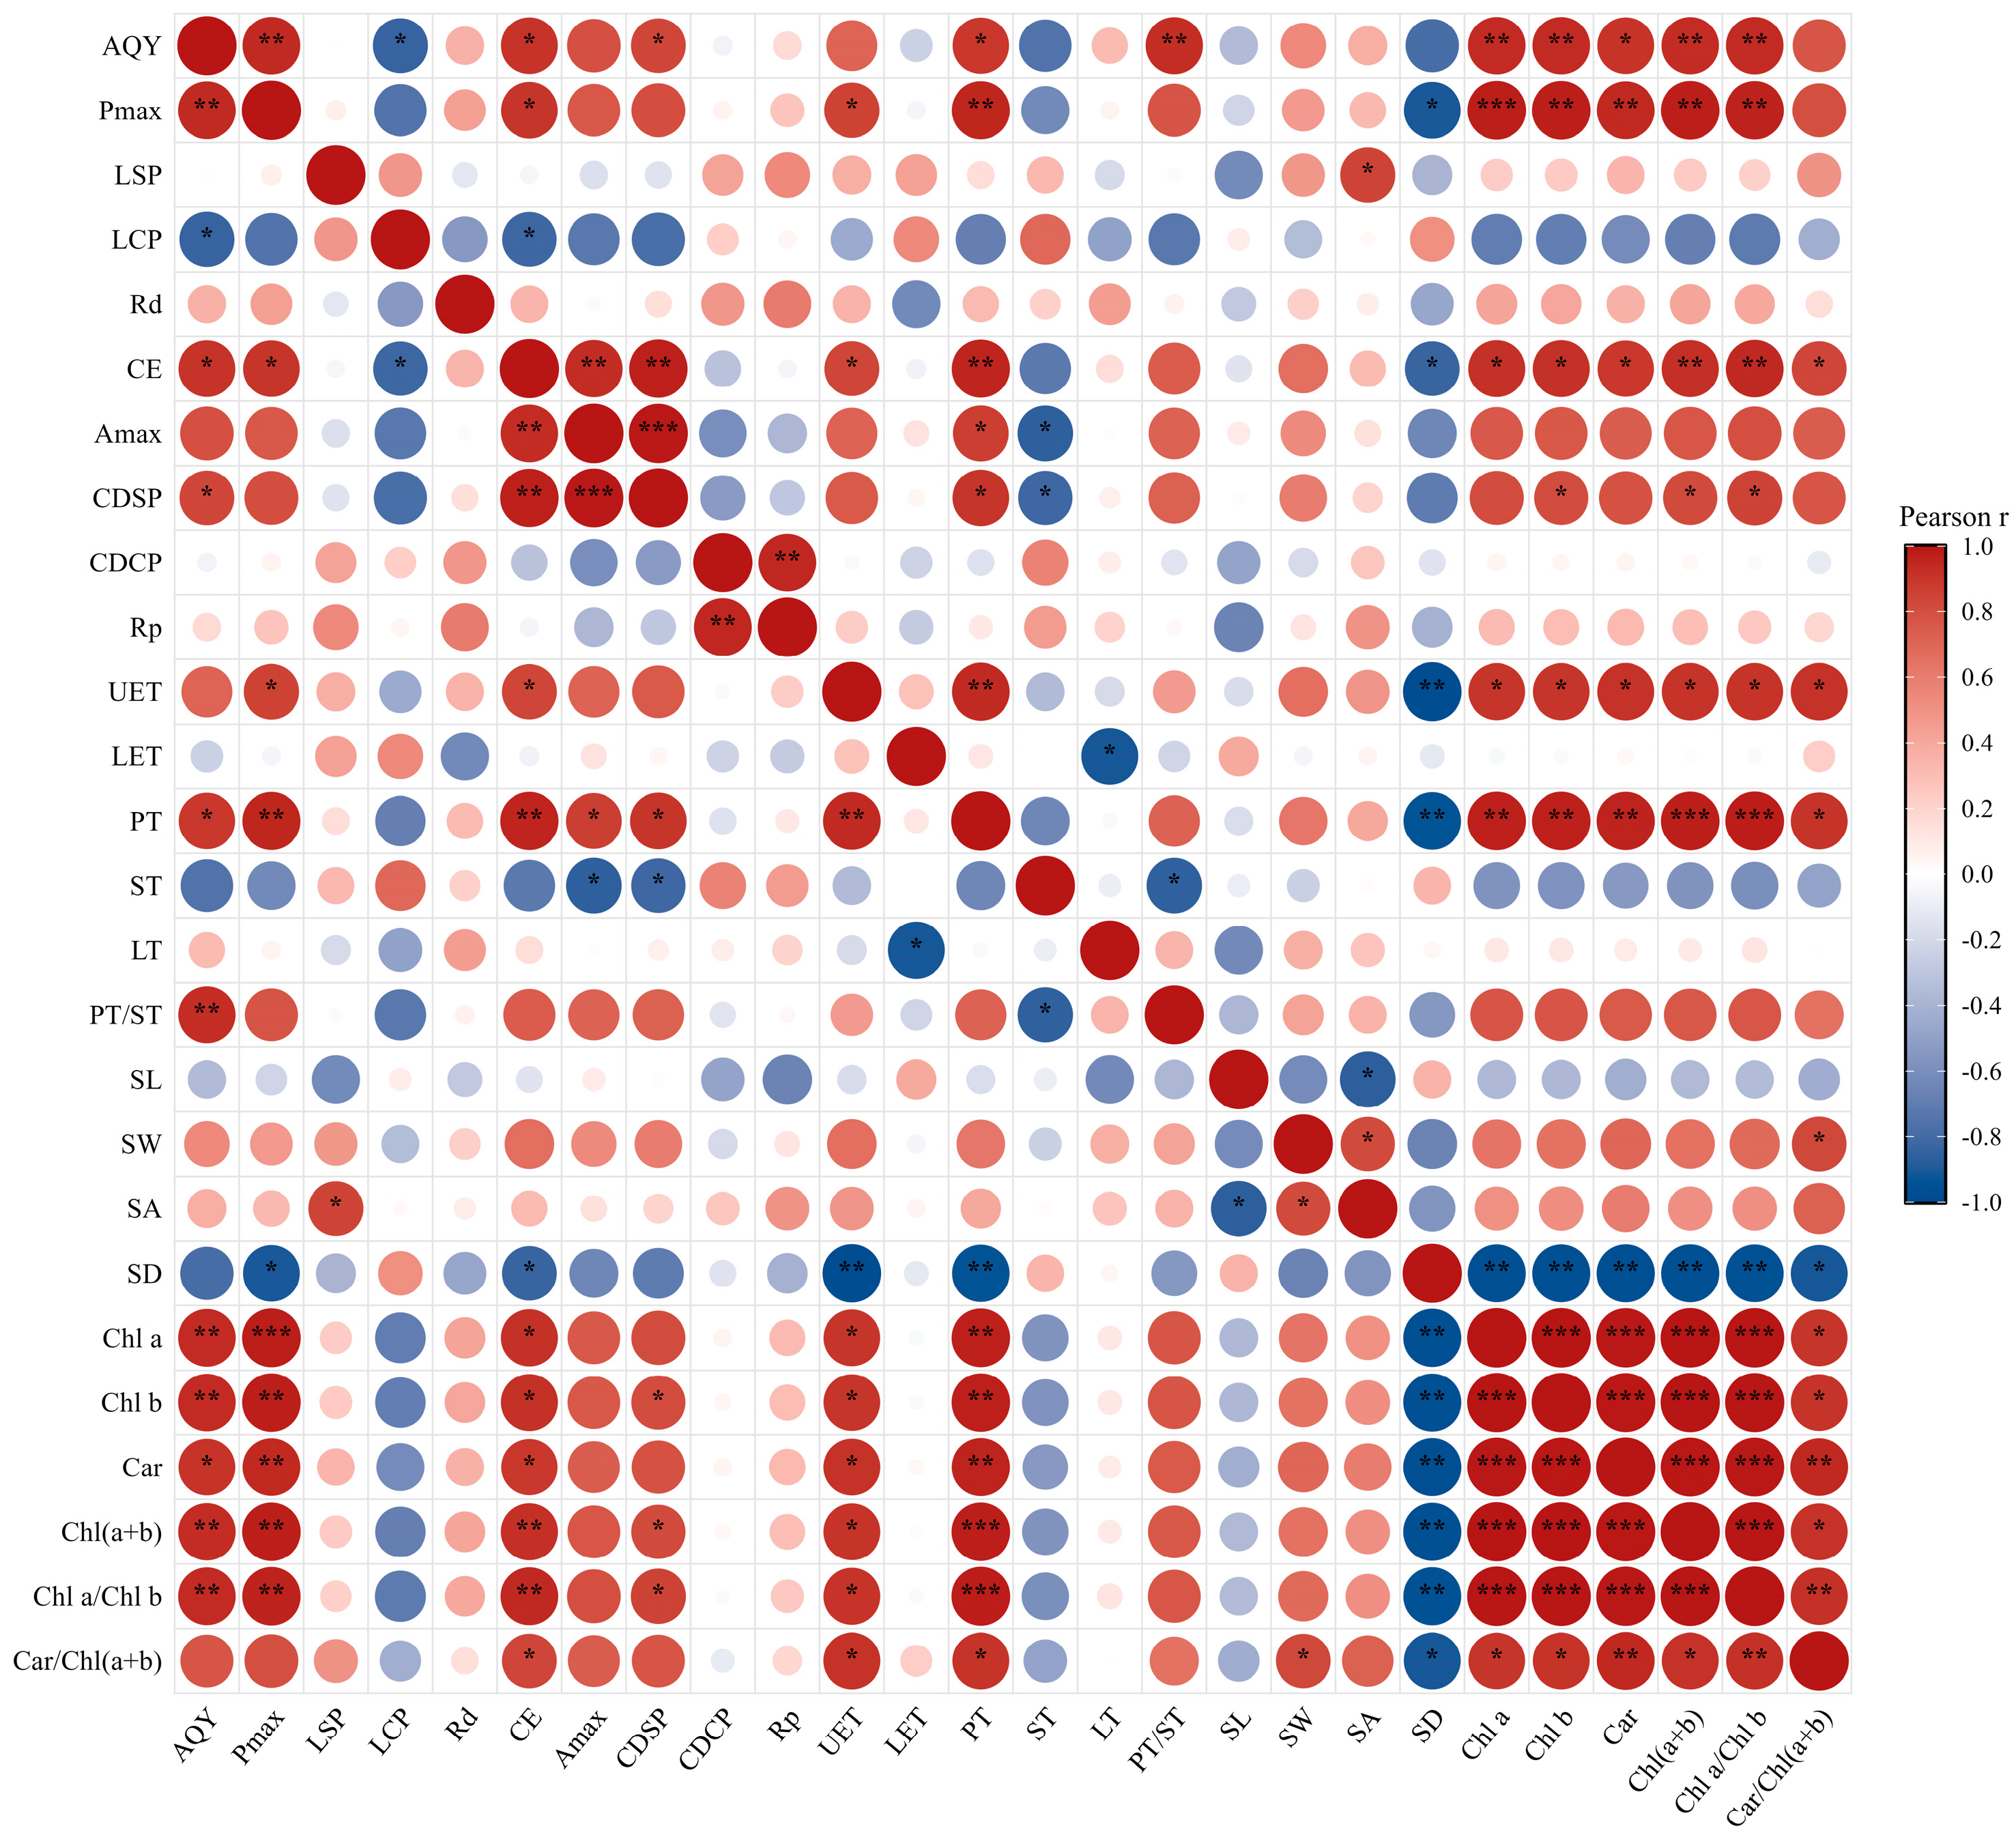
As shown in Figure 8, functional traits of C. longzhouensis and C. gigantocarpa exhibited correlations of varying strength. Among photosynthetic parameters, AQY was positively correlated with Pmax (p < 0.01). Initial carboxylation efficiency (α) was positively correlated with Amax, and Amax was also positively correlated with CDSP (p < 0.01). Pmax showed an overall positive trend with Amax. CDCP was positively correlated with Rp (p < 0.01), indicating relatively clear coordinated variation among CO2-response parameters.
Figure 8.
Correlation analysis of functional traits in C. longzhouensis and C. gigantocarpa. Red indicates positive correlations and blue indicates negative correlations; circle size and color intensity indicate the absolute value of Pearson’s correlation coefficient. * p < 0.05, ** p < 0.01, *** p < 0.001. AQY, apparent quantum yield; Pmax, maximum net photosynthetic rate from the light-response curve; LSP, light saturation point; LCP, light compensation point; Rd, dark respiration rate; α, initial carboxylation efficiency; Amax, maximum net photosynthetic rate from the CO2-response curve; CDSP, CO2 saturation point; CDCP, CO2 compensation point; Rp, photorespiration rate; SL, stomatal length; SW, stomatal width; SA, stomatal area; SD, stomatal density; UET, upper epidermal thickness; LET, lower epidermal thickness; PT, palisade tissue thickness; ST, spongy tissue thickness; LT, leaf thickness; PT/ST, palisade-to-spongy tissue thickness ratio; Chl a, chlorophyll a; Chl b, chlorophyll b; Car, carotenoids; Chl(a + b), total chlorophyll; Chl a/Chl b, ratio of chlorophyll a to chlorophyll b; Car/Chl(a + b), ratio of carotenoids to total chlorophyll.
Leaf anatomical traits also showed clear relationships with photosynthetic parameters. UET and PT were generally positively correlated with Pmax, α, and several photosynthetic pigments. The correlations of PT with Pmax, α, and UET were significant or highly significant. PT was also positively correlated with Amax and CDSP. PT/ST was generally positively correlated with AQY and several photosynthetic and pigment traits, whereas ST showed an inverse pattern relative to some photosynthetic-capacity traits.
Among stomatal traits, SW showed a significant positive correlation with SA, whereas SL showed a significant negative correlation with SA. SD was generally negatively correlated with Pmax, α, UET, PT, and the major photosynthetic pigment traits. Its correlations with Pmax, UET, PT, and several pigment traits were significant or highly significant. This pattern indicates that variation in stomatal density between the two species was opposite in direction to palisade tissue development, photosynthetic pigment accumulation, and some measures of photosynthetic capacity.
Photosynthetic pigment traits were closely interrelated. Chl a, Chl b, Car, Chl(a + b), and Chl a/Chl b generally showed significant or highly significant positive correlations with one another. These traits were also generally positively correlated with Pmax, α, UET, and PT, but showed significant or highly significant negative correlations with SD. Car/Chl(a + b) was also positively correlated with most major photosynthetic pigment traits. Overall, the higher photosynthetic pigment contents, more developed palisade tissue, and greater photosynthetic carbon-assimilation capacity of C. gigantocarpa showed a consistent pattern of trait variation.
4. Discussion
4.1. Differences in Photosynthetic Characteristics
Light- and CO2-use characteristics provide complementary information on leaf carbon acquisition [25]. Both species showed a similar overall light-response pattern, with Pn rising rapidly at low to moderate PPFD and approaching a plateau as irradiance increased. The principal interspecific difference was Pmax, which was significantly higher in C. gigantocarpa, whereas AQY, LSP, LCP, and Rd remained statistically similar.
Differences in photosynthetic performance have also been reported in comparisons between range-restricted plants and more widely distributed congeners. Among five Acacia species pairs, Pohlman et al. observed stronger carbon-acquisition capacity in some of the widespread taxa [26], while Xu et al. reported lower maximum photosynthetic and CO2-assimilation capacities in a range-restricted Geodorum relative to its more widespread congeners [27]. The lower Pmax observed for C. longzhouensis follows a similar pattern, although these cross-species comparisons do not by themselves establish a causal link with geographic range.
The CO2-response curves showed a progressive increase in Pn with Ci in both species, followed by a tendency toward saturation at higher Ci. Among the fitted parameters, α was the only one showing a significant interspecific difference, with a higher value in C. gigantocarpa. Amax, CDSP, CDCP, and Rp were comparable. This result indicates a difference primarily in the initial carboxylation phase rather than across the full set of CO2-response traits. Richards et al. compared narrow-ranged plants with widespread congeners and found varying degrees of differentiation in CO2-assimilation capacity among species pairs [28]. Our results show that differences between C. longzhouensis and C. gigantocarpa were expressed not only in Pmax under the light response but also in carboxylation efficiency during the initial phase of the CO2 response, whereas interspecific differences in Amax, CDSP, CDCP, and Rp were not significant.
Because Pmax integrates several leaf-level processes involved in carbon assimilation, including light interception, gas exchange, and mesophyll function [29], its association with other traits is informative. In C. gigantocarpa, the higher Pmax occurred together with greater PT and higher concentrations of the major photosynthetic pigments. Their generally positive correlations with Pmax suggest that structural and pigment differences covaried with photosynthetic performance across the sampled plants.
4.2. Differences in Leaf Microstructure
Internal leaf organization can influence both within-leaf light distribution and the diffusion pathway for CO2 [30]. Although total leaf thickness and lower epidermal thickness were similar in the two species, C. gigantocarpa had greater upper epidermal and palisade tissue thickness and a higher PT/ST, whereas C. longzhouensis had thicker spongy tissue. The anatomical contrast was therefore concentrated mainly in the relative organization of mesophyll tissues.
Variation in mesophyll organization has been documented previously within Camellia. Differences in palisade and spongy tissues and in their relative proportions have been reported among species [31], and PT, ST, and PT/ST also vary among C. oleifera germplasm accessions [32]. Our data extend this pattern by showing that the two study species can differ in mesophyll allocation despite having nearly identical total leaf thickness.
Palisade tissue consists of relatively compactly arranged cells and is an important tissue for receiving incident light and performing photosynthesis; more developed palisade tissue increases the proportion of photosynthetically active tissue [33]. Spongy tissue has more loosely arranged cells and larger intercellular spaces, which favor internal gas diffusion and light scattering [34]. In this study, C. gigantocarpa had greater PT and PT/ST, whereas C. longzhouensis had greater ST, reflecting different mesophyll tissue configurations. The more developed palisade tissue of C. gigantocarpa may represent a structural feature associated with its significantly higher Pmax and greater photosynthetic carbon-assimilation capacity.
Stomata are the primary pathway for CO2 entry into leaves, and their density and size jointly affect potential leaf gas-exchange capacity [35]. SL, SW, and SA did not differ significantly between the two species, whereas SD was significantly higher in C. longzhouensis than in C. gigantocarpa, indicating that interspecific differences in stomatal traits were expressed mainly as differences in stomatal number per unit leaf area. Studies of closely related plants with different distribution ranges have also identified stomatal density as a leaf structural trait that readily differentiates among species. Stomatal density may vary in coordination with mesophyll structure, contributing to distinct combinations of leaf functional traits [36].
Although C. longzhouensis had higher stomatal density in this study, its Pmax was significantly lower than that of C. gigantocarpa, and SD was generally negatively correlated with Pmax and Amax. This indicates that interspecific differences in photosynthetic capacity were associated with joint variation in stomatal number, mesophyll structure, pigment content, and other leaf traits. Among the structural traits measured, the higher PT and PT/ST of C. gigantocarpa were consistent with its higher Pmax.
4.3. Differences in Photosynthetic Pigments
Chlorophylls are the principal pigments responsible for light absorption and energy transfer in plants. Chl a is distributed in both reaction centers and light-harvesting complexes, whereas Chl b is mainly associated with light-harvesting complexes; carotenoids contribute to both light harvesting and photoprotection [37]. In this study, Chl a, Chl b, Chl(a + b), and Car contents were significantly higher in C. gigantocarpa than in C. longzhouensis, and Chl a/Chl b was also significantly higher, whereas Car/Chl(a + b) did not differ significantly between the two species. Notably, Chl a/Chl b in C. longzhouensis was 1.01, indicating a relatively high contribution of Chl b to its total chlorophyll pool. Lower Chl a/Chl b ratios are generally associated with increased investment in Chl-b-rich light-harvesting complexes, which can enhance light capture under low irradiance [37,38]. The pigment composition of C. longzhouensis therefore indicates a greater relative allocation to the light-harvesting antenna system, a pattern that may be relevant to light acquisition under low irradiance. However, because the plants were examined under common nursery conditions, this pattern cannot be interpreted as direct evidence of adaptation to its natural forest-understory habitat. Together with its lower Pmax, this pigment pattern further indicates that C. longzhouensis differs from C. gigantocarpa in the way photosynthetic resources are allocated and utilized.
Photosynthetic pigment contents vary markedly among Camellia species and germplasm. Vu et al. compared three Camellia species and found clear interspecific variation in total chlorophyll and carotenoid contents [39]. Comparisons among Camellia oleifera germplasm have also shown corresponding differences in chlorophyll content and net photosynthetic rate [40]. In the present study, both the major photosynthetic pigment contents and Pmax were significantly higher in C. gigantocarpa than in C. longzhouensis, broadly consistent with the results of these studies in Camellia.
Increased chlorophyll content can enhance leaf light absorption and provide more energy for subsequent photochemical reactions [38]. In this study, C. gigantocarpa had higher Chl a and Chl b contents together with a higher Pmax, and correlation analysis showed that Chl a, Chl b, and Chl(a + b) were generally positively correlated with Pmax and Amax. These patterns indicate consistent interspecific variation in photosynthetic pigment accumulation and photosynthetic capacity.
Carotenoids play important roles in light absorption and dissipation of excess energy, and variation in their content is an important component of the photosynthetic pigment system [41]. Car content was significantly higher in C. gigantocarpa than in C. longzhouensis, whereas Car/Chl(a + b) did not differ significantly. This indicates that interspecific variation in Car was consistent with variation in total photosynthetic pigment content and did not show a clear divergence in pigment proportions.
Integrating the photosynthetic, leaf structural, and pigment results, C. gigantocarpa was characterized by higher Pmax, thicker upper epidermis and palisade tissue, higher PT/ST, and higher Chl a, Chl b, Chl(a + b), and Car contents, whereas C. longzhouensis had thicker spongy tissue and higher stomatal density. Similar comparative studies of closely related plants have shown that differences between narrow-ranged species and more widely distributed congeners are usually expressed as combinations of multiple leaf functional traits rather than changes in a single trait [42]. Our results likewise show that C. longzhouensis and C. gigantocarpa formed distinct combinations of leaf structural and photosynthetic functional traits, reflected in carbon-assimilation capacity, mesophyll tissue configuration, stomatal density, and photosynthetic pigment accumulation.
4.4. Functional-Trait Differences in Relation to the Narrow Distribution of C. longzhouensis
Comparative studies of narrow-ranged and widespread congeners have shown that differences in geographic range are often associated with coordinated variation in multiple functional traits rather than with changes in a single trait [42]. In the present study, C. longzhouensis exhibited substantially lower Pmax and initial carboxylation efficiency, together with lower PT/ST and photosynthetic pigment contents, whereas C. gigantocarpa combined higher Pmax with more developed palisade tissue and greater pigment accumulation. These coordinated trait differences indicate that the two species exhibit distinct functional trait combinations in leaf carbon assimilation, mesophyll organization, and investment in photosynthetic resources. The relatively high stomatal density and greater spongy tissue thickness of C. longzhouensis further distinguish its leaf structural configuration from that of C. gigantocarpa. Taken together, these results reveal clear differentiation in leaf resource-use characteristics between the narrow-ranged and widespread congeners.
The natural populations of C. longzhouensis occur mainly in karst habitats of southwestern Guangxi. Karst ecosystems in southwestern China are generally characterized by shallow and spatially discontinuous soils, limited water availability, relatively high calcium concentrations, strong habitat heterogeneity, and nutrient constraints [43,44]. These environmental conditions can exert long-term influences on plant water use, mineral nutrition, carbon assimilation, and leaf functional traits. In C. longzhouensis, lower photosynthetic capacity occurred together with thicker spongy tissue, lower PT/ST, and reduced photosynthetic pigment accumulation. This combination of structural and physiological traits reflects a distinct pattern of leaf resource allocation under the common nursery conditions of this study. Although such traits may be relevant to plant performance in resource-limited environments, the present experiment did not compare plants across contrasting natural habitats and therefore does not provide direct evidence of adaptation to karst understory conditions. Greater spongy tissue development may enhance internal light scattering and CO2 diffusion within the leaf, while the relatively lower investment in palisade tissue and photosynthetic pigments corresponds to its lower maximum carbon-assimilation capacity.
In contrast, C. gigantocarpa showed greater PT/ST, higher photosynthetic pigment contents, higher Pmax, and greater initial carboxylation efficiency. The combination of more developed palisade tissue and greater photosynthetic pigment accumulation provides a structural and physiological basis for stronger light capture and carbon assimilation. These traits are consistent with the higher photosynthetic capacity observed for C. gigantocarpa under the present experimental conditions. The contrasting trait combinations of the two species therefore link leaf anatomy, pigment investment, and photosynthetic performance with differences in resource-use characteristics. For C. longzhouensis, the coordinated expression of lower carbon-assimilation capacity, distinct mesophyll organization, and reduced pigment investment identifies a functional-trait combination that may be relevant to future investigations of its habitat associations and geographic range. Together with existing knowledge of the natural habitat of C. longzhouensis, these findings may inform future evaluation of appropriate light, water, and soil conditions for its ex situ conservation and cultivation.
A major limitation of this study is the small sample size, with only three independent plants examined per species. Previous plant physiological studies have used three biological replicates to compare photosynthetic, physiological, and pigment traits [45,46]. However, the sample size required for reliable statistical inference depends on trait variability, effect size, and study objectives. Studies in plant ecophysiology have shown that small samples can provide preliminary information on certain traits, whereas larger samples generally improve representativeness and statistical power [47]. In the present study, the limited number of biological replicates may have reduced the ability to detect small differences and restricted the generalizability of the findings. This limitation is particularly relevant to the pooled correlation analysis, in which associations based on only six plants may be influenced by interspecific differences. Future studies should include more independent plants from multiple populations to determine whether the observed differences remain consistent across a broader range of individuals and natural habitats.
5. Conclusions
Under common nursery conditions, C. longzhouensis and C. gigantocarpa differed in several photosynthetic and leaf functional traits. C. gigantocarpa showed a higher maximum net photosynthetic rate and initial carboxylation efficiency, together with greater upper epidermal and palisade tissue thickness, a higher palisade-to-spongy tissue thickness ratio, and greater accumulation of major photosynthetic pigments. In contrast, C. longzhouensis had thicker spongy tissue and higher stomatal density, whereas overall leaf thickness, lower epidermal thickness, stomatal size, and several light- and CO2-response parameters were similar between species. Trait correlations suggested coordinated variation among photosynthetic performance, leaf anatomy, stomatal characteristics, and pigment accumulation. Together, these results address the study objectives by identifying distinct resource-use-related trait combinations in the two species under common nursery conditions and provide baseline ecophysiological information for future studies testing their relationships with natural habitat conditions or geographic range, as well as for ex situ conservation of C. longzhouensis.
Author Contributions
Conceptualization, L.G. (Lin Gou), S.S., X.W. and L.G. (Limei Gao); methodology, L.G. (Lin Gou), S.S., R.Z., C.Z., S.C. and L.L.; investigation, L.G. (Lin Gou), S.S., R.Z., C.Z., S.C. and L.L.; data curation, L.G. (Lin Gou) and S.S.; formal analysis, L.G. (Lin Gou) and S.S.; visualization, L.G. (Lin Gou) and S.S.; writing—original draft preparation, L.G. (Lin Gou) and S.S.; writing—review and editing, L.G. (Lin Gou), S.S., R.Z., C.Z., S.C., L.L., X.W. and L.G. (Limei Gao); supervision, X.W. and L.G. (Limei Gao); project administration, X.W.; funding acquisition, L.G. (Limei Gao). All authors have read and agreed to the published version of the manuscript.
Funding
This research was funded by the National Natural Science Foundation of China (Grant Nos. 32460103, 32160091, and 32560330); the Guangxi Natural Science Foundation (Project Nos. 2024GXNSFAA010452 and 2023GXNSFAA026253); the Autonomous Projects of the Guangxi Key Laboratory of Functional Phytochemicals Research and Sustainable Utilisation (Project Nos. ZRJJ2024-3 and ZRJJ2024-11); the Hechi Municipal Science and Technology Base and Talent Programme (HeKe AC231113); and the 2022 Guilin Municipal Technology Application and Promotion Programme (20220134-3 and 20230102-3). The funders had no role in the design of the study; in the collection, analyses, or interpretation of data; in the writing of the manuscript; or in the decision to publish the results.
Data Availability Statement
The data supporting the findings of this study are available from the corresponding authors upon reasonable request.
Acknowledgments
The authors thank the Guangxi Institute of Botany, Guangxi Zhuang Autonomous Region, and Chinese Academy of Sciences for providing the experimental facilities.
Conflicts of Interest
The authors declare no conflicts of interest.
References
- Zhang, W.H.; Zu, Y.G.; Liu, G.B. Population ecological characteristics and analysis on endangered cause of ten endangered plant species. Acta Ecol. Sin. 2002, 22, 1512–1520. (In Chinese) [Google Scholar]
- Wright, I.J.; Reich, P.B.; Westoby, M.; Ackerly, D.D.; Baruch, Z.; Bongers, F.; Cavender-Bares, J.; Chapin, T.; Cornelissen, J.H.C.; Diemer, M.; et al. The worldwide leaf economics spectrum. Nature 2004, 428, 821–827. [Google Scholar] [CrossRef] [Scilit] [PubMed]
- Chen, H.; Liu, S.; Ye, Q.; Lu, Y.; Tang, S. Inferring species relationships among Camellia chrysanthoides and its closely related species for developing conservation strategies. Plant Species Biol. 2021, 36, 390–398. [Google Scholar] [CrossRef] [Scilit]
- Xu, Z.H.; Ren, H.; Wei, X.; Ouyang, K.T.; Li, D.X.; Guo, Y.L.; Wen, S.J.; Long, J.F.; Wang, J.; Hui, D.F. Distribution and conservation status of Camellia longzhouensis (Theaceae), a critically endangered plant species endemic to southern China. Glob. Ecol. Conserv. 2021, 27, e01585. [Google Scholar] [CrossRef] [Scilit]
- Chang, H.T.; Ren, S.X. Flora Reipublicae Popularis Sinicae; Volume 49, Part 3; Science Press: Beijing, China, 1998. (In Chinese) [Google Scholar]
- Chai, S.F.; Zhuang, X.Y.; Wang, M.L.; Jiang, Y.S.; Zou, R.; Wei, X. Comparison of photosynthetic characteristics between an endangered species Camellia pubipetala and its widespread congener C. sinensis. Guihaia 2015, 35, 623–630. (In Chinese) [Google Scholar] [CrossRef]
- Long, S.P.; Bernacchi, C.J. Gas exchange measurements, what can they tell us about the underlying limitations to photosynthesis? Procedures and sources of error. J. Exp. Bot. 2003, 54, 2393–2401. [Google Scholar] [CrossRef] [Scilit] [PubMed]
- Ye, Z.P. A review on modeling of responses of photosynthesis to light and CO2. Chin. J. Plant Ecol. 2010, 34, 727–740. (In Chinese) [Google Scholar] [CrossRef]
- Coste, S.; Roggy, J.C.; Imbert, P.; Born, C.; Bonal, D.; Dreyer, E. Leaf photosynthetic traits of 14 tropical rain forest species in relation to leaf nitrogen concentration and shade tolerance. Tree Physiol. 2005, 25, 1127–1137. [Google Scholar] [CrossRef] [Scilit] [PubMed]
- Wei, X.; Jiang, Y.S.; Jiang, S.Y.; Qi, X.X.; Xiong, Z.C.; Ye, W.H.; Wang, Z.M. Photosynthetic characteristics of an endangered species Camellia nitidissima and its widespread congener Camellia sinensis. Photosynthetica 2008, 46, 312–314. [Google Scholar] [CrossRef] [Scilit]
- Chai, S.F.; Tang, J.M.; Mallik, A.; Shi, Y.C.; Zou, R.; Li, J.T.; Wei, X. Eco-physiological basis of shade adaptation of Camellia nitidissima, a rare and endangered forest understory plant of Southeast Asia. BMC Ecol. 2018, 18, 5. [Google Scholar] [CrossRef] [Scilit] [PubMed]
- Barman, T.S.; Baruah, U.; Saikia, J.K. Irradiance influences tea leaf (Camellia sinensis L.) photosynthesis and transpiration. Photosynthetica 2008, 46, 618–621. [Google Scholar] [CrossRef] [Scilit]
- Terashima, I.; Hanba, Y.T.; Tholen, D.; Niinemets, Ü. Leaf functional anatomy in relation to photosynthesis. Plant Physiol. 2011, 155, 108–116. [Google Scholar] [CrossRef] [Scilit] [PubMed]
- Flexas, J.; Barbour, M.M.; Brendel, O.; Cabrera, H.M.; Carriquí, M.; Díaz-Espejo, A.; Douthe, C.; Dreyer, E.; Ferrio, J.P.; Gago, J.; et al. Mesophyll diffusion conductance to CO2: An unappreciated central player in photosynthesis. Plant Sci. 2012, 193–194, 70–84. [Google Scholar] [CrossRef] [Scilit] [PubMed]
- Franks, P.J.; Beerling, D.J. Maximum leaf conductance driven by CO2 effects on stomatal size and density over geologic time. Proc. Natl. Acad. Sci. USA 2009, 106, 10343–10347. [Google Scholar] [CrossRef] [Scilit] [PubMed]
- Brodribb, T.J.; Jordan, G.J.; Carpenter, R.J. Unified changes in cell size permit coordinated leaf evolution. New Phytol. 2013, 199, 559–570. [Google Scholar] [CrossRef] [Scilit] [PubMed]
- Evans, J.R.; Poorter, H. Photosynthetic acclimation of plants to growth irradiance: The relative importance of specific leaf area and nitrogen partitioning in maximizing carbon gain. Plant Cell Environ. 2001, 24, 755–767. [Google Scholar] [CrossRef] [Scilit]
- Poorter, H.; Niinemets, Ü.; Poorter, L.; Wright, I.J.; Villar, R. Causes and consequences of variation in leaf mass per area (LMA): A meta-analysis. New Phytol. 2009, 182, 565–588. [Google Scholar] [CrossRef] [Scilit] [PubMed]
- Lin, X.Y.; Peng, Q.F.; Lu, H.F.; Du, Y.Q.; Tang, B.Y. Leaf anatomy of Camellia sect. Oleifera and sect. Paracamellia (Theaceae) with reference to their taxonomic significance. J. Syst. Evol. 2008, 46, 183–193. Available online: https://www.jse.ac.cn/EN/Y2008/V46/I2/183 (accessed on 20 October 2026).
- Pi, E.; Peng, Q.F.; Lu, H.F.; Shen, J.B.; Du, Y.Q.; Huang, F.L.; Hu, H. Leaf morphology and anatomy of Camellia section Camellia (Theaceae). Bot. J. Linn. Soc. 2009, 159, 456–476. [Google Scholar] [CrossRef] [Scilit]
- Wang, J.H.; Cai, Y.F.; Li, S.F.; Zhang, S.B. Differences in leaf physiological and morphological traits between Camellia japonica and Camellia reticulata. Plant Divers. 2020, 42, 181–188. [Google Scholar] [CrossRef] [Scilit] [PubMed]
- Li, Z.L. Plant Microtechnique, 2nd ed.; Science Press: Beijing, China, 1978. (In Chinese) [Google Scholar]
- Pan, L.P.; Tang, J.M.; Chen, T.G.; Zhu, S.J.; Zou, R.; Wei, X. Comparison of photosynthetic function and structure of leaves between Kmeria septentrionalis seedlings and adult plants. Guangxi Sci. 2023, 30, 1163–1170. (In Chinese) [Google Scholar]
- Li, H.S. Principles and Techniques of Plant Physiological and Biochemical Experiments; Higher Education Press: Beijing, China, 2000. (In Chinese) [Google Scholar]
- Lawlor, D.W. Photosynthesis, productivity and environment. J. Exp. Bot. 1995, 46, 1449–1461. [Google Scholar] [CrossRef] [Scilit]
- Pohlman, C.L.; Nicotra, A.B.; Murray, B.R. Geographic range size, seedling ecophysiology and phenotypic plasticity in Australian Acacia species. J. Biogeogr. 2005, 32, 341–351. [Google Scholar] [CrossRef] [Scilit]
- Xu, A.Z.; Jiang, H.D.; Pu, Q.K.; Wei, X.; Wei, Y.J.; Luo, Y.J.; Chai, S.F. Comparative study on leaf anatomical structures and photosynthetic characteristics of three Geodorum species. Guihaia 2024, 44, 113–125. (In Chinese) [Google Scholar] [CrossRef]
- Richards, A.E.; Shapcott, A.; Playford, J.; Morrison, B.; Critchley, C.; Schmidt, S. Physiological profiles of restricted endemic plants and their widespread congenors in the North Queensland wet tropics, Australia. Biol. Conserv. 2003, 111, 41–52. [Google Scholar] [CrossRef] [Scilit]
- Evans, J.R. Improving photosynthesis. Plant Physiol. 2013, 162, 1780–1793. [Google Scholar] [CrossRef] [Scilit] [PubMed]
- Nobel, P.S. Physicochemical and Environmental Plant Physiology, 4th ed.; Elsevier: Amsterdam, The Netherlands, 2009. [Google Scholar]
- Hu, Y.; Yang, L.; Gao, C.; Liao, D.S.; Long, L.; Qiu, J.; Wei, H.L.; Deng, Q.A.; Zhou, Y.C. A comparative study on the leaf anatomical structure of Camellia oleifera in a low-hot valley area in Guizhou Province, China. PLoS ONE 2022, 17, e0262509. [Google Scholar] [CrossRef] [Scilit] [PubMed]
- Deng, Q.; Li, J.; Gao, C.; Cheng, J.; Deng, X.; Jiang, D.; Li, L.; Yan, P. New perspective for evaluating the main Camellia oleifera cultivars in China. Sci. Rep. 2020, 10, 20676. [Google Scholar] [CrossRef] [Scilit] [PubMed]
- Vogelmann, T.C.; Nishio, J.N.; Smith, W.K. Leaves and light capture: Light propagation and gradients of carbon fixation within leaves. Trends Plant Sci. 1996, 1, 65–70. [Google Scholar] [CrossRef] [Scilit]
- Terashima, I.; Saeki, T. Light environment within a leaf I. Optical properties of paradermal sections of Camellia leaves with special reference to differences in the optical properties of palisade and spongy tissues. Plant Cell Physiol. 1983, 24, 1493–1501. [Google Scholar] [CrossRef] [Scilit]
- Hetherington, A.M.; Woodward, F.I. The role of stomata in sensing and driving environmental change. Nature 2003, 424, 901–908. [Google Scholar] [CrossRef] [Scilit] [PubMed]
- Cao, J.T.; Zhu, S.D.; Wen, Y.; Cao, K.F. Eco-physiological traits of leaves from basal angiosperm Machilus species with localized and widespread distribution. Plant Sci. J. 2016, 34, 790–797. (In Chinese) [Google Scholar] [CrossRef]
- Lichtenthaler, H.K. Chlorophylls and carotenoids: Pigments of photosynthetic biomembranes. Methods Enzymol. 1987, 148, 350–382. [Google Scholar] [CrossRef] [Scilit]
- Croce, R.; van Amerongen, H. Natural strategies for photosynthetic light harvesting. Nat. Chem. Biol. 2014, 10, 492–501. [Google Scholar] [CrossRef] [Scilit] [PubMed]
- Vu, D.C.; Nguyen, T.H.D.; Tran-Trung, H.; Tuan, N.H.; Nguyet, N.T.M. Comparative analysis of pigments, phenolics, and bioactivities of three Camellia species growing in Vietnam. Nat. Prod. Commun. 2024, 19, 1–8. [Google Scholar] [CrossRef] [Scilit]
- Yuan, J.; Tan, X.F.; Jiang, Z.N.; Yang, Q.L.; Li, Z. Photosynthetic characteristics in three Camellia oleifera cultivars. J. Zhejiang A&F Univ. 2012, 29, 527–532. (In Chinese) [Google Scholar] [CrossRef]
- Havaux, M. Carotenoid oxidation products as stress signals in plants. Plant J. 2014, 79, 597–606. [Google Scholar] [CrossRef] [Scilit] [PubMed]
- Lavergne, S.; Thompson, J.D.; Garnier, E.; Debussche, M. The biology and ecology of narrow endemic and widespread plants: A comparative study of trait variation in 20 congeneric pairs. Oikos 2004, 107, 505–518. [Google Scholar] [CrossRef] [Scilit]
- Liu, C.; Huang, Y.; Wu, F.; Liu, W.J.; Ning, Y.Q.; Huang, Z.R.; Tang, S.Q.; Liang, Y. Plant adaptability in karst regions. J. Plant Res. 2021, 134, 889–906. [Google Scholar] [CrossRef] [Scilit] [PubMed]
- Wang, K.; Zhang, C.; Chen, H.; Yue, Y.; Zhang, W.; Zhang, M.; Qi, X.; Fu, Z. Karst landscapes of China: Patterns, ecosystem processes and services. Landsc. Ecol. 2019, 34, 2743–2763. [Google Scholar] [CrossRef] [Scilit]
- Liu, H.; Liu, X.; Zhao, Y.; Nie, J.; Yao, X.; Lv, L.; Yang, J.; Ma, N.; Guo, Y.; Li, Y.; et al. Alkaline α-galactosidase 2 (CsAGA2) plays a pivotal role in mediating source–sink communication in cucumber. Plant Physiol. 2022, 189, 1501–1518. [Google Scholar] [CrossRef] [Scilit] [PubMed]
- Da, Q.; Wang, P.; Wang, M.; Sun, T.; Jin, H.; Liu, B.; Wang, J.; Grimm, B.; Wang, H.B. Thioredoxin and NADPH-Dependent Thioredoxin Reductase C Regulation of Tetrapyrrole Biosynthesis. Plant Physiol. 2017, 175, 652–666. [Google Scholar] [CrossRef] [Scilit] [PubMed]
- Pérez-Llorca, M.; Fenollosa, E.; Salguero-Gómez, R.; Munné-Bosch, S. What Is the Minimal Optimal Sample Size for Plant Ecophysiological Studies? Plant Physiol. 2018, 178, 953–955. [Google Scholar] [CrossRef] [Scilit] [PubMed]

Disclaimer/Publisher’s Note: The statements, opinions and data contained in all publications are solely those of the individual author(s) and contributor(s) and not of MDPI and/or the editor(s). MDPI and/or the editor(s) disclaim responsibility for any injury to people or property resulting from any ideas, methods, instructions or products referred to in the content. |
© 2026 by the authors. Licensee MDPI, Basel, Switzerland. This article is an open access article distributed under the terms and conditions of the Creative Commons Attribution (CC BY) license.