


Abstract
One of the unresolved issues in modern fungal molecular systematics is the lack of criteria for distinguishing intraspecific from interspecific variability of genetic markers. This paper discusses the results of an analysis of 69 original ITS sequences obtained from fungi collected in the Altai, the Urals, and northern Kazakhstan regions, and 42 sequences retrieved from GenBank and UNITE, belonging to two cryptic, sympatric polypore species: Fomes fomentarius (L.) Fr. and Fomes inzengae (Ces. & De Not.) Cooke. The sequences were divided into geographic groups reflecting a wide range of climatic conditions (from subarctic to subtropical) and geographic distances between sampling locations. Both species are characterized by low intragroup nucleotide diversity of ITS sequences and high nucleotide similarity, indicating low individual variability. A high, nearly complete identity in the ITS region of rDNA is also characteristic at the intergroup level, expressed in very low nucleotide divergence and high nucleotide similarity of ITS sequences from different geographic groups. The fixation index, calculated from the ratio of nucleotide diversity to divergence of ITS sequences, indicates a complete absence of genetic differentiation between local populations of F. inzengae and moderate differentiation in F. fomentarius. However, between populations of these two species, even in areas of their joint distribution, complete or very high genetic isolation occurs, confirming the validity of dividing F. fomentarius sensu lato into two cryptic sympatric species—F. fomentarius and F. inzengae.
1. Introduction
The main problem with the morphological species concept currently dominating in mycology is largely due to the limited number of anatomical and morphological characters relevant to fungal taxonomy, and to their significant variability. Therefore, considerable attention has been given to molecular genetic approaches, in particular DNA barcoding and phylogenetic analyses, which increasingly serve as a core complement to morphology-based identification across fungal groups [1].
While the description of new fungal taxa increasingly relies on multi-gene or genome-scale approaches, a single, widely standardized locus remains widely used for species-level identification and barcoding. The most popular genetic marker for taxon differentiation is the internal transcribed spacer (ITS) of the nuclear ribosomal repeating unit [2,3]. It is recommended as the main fungal DNA barcode [4], and its choice is justified by several important advantages over alternative genetic markers. Firstly, the ITS region of rDNA demonstrates high resolution at the species level. Thus, the probability of correct identification of basidiomycetes is 0.79, which is significantly higher than that of protein-coding genes (rpb1, rpb2): 0.55–0.67. Secondly, there is a wide range of primers for use as both universal [5] and taxon-specific [6] markers. Thirdly, it offers the opportunity to obtain large numbers of rDNA copies (50–250 copies per genome) and work with DNA from herbarium and metagenomic samples. Finally, the international GenBank and UNITE databases offer significant opportunities for comparative ITS analysis.
The ITS barcoding of fungi is based on the concept of the barcoding gap—the excess of interspecific differences over intraspecific variability [7]. Intraspecific ITS variability differs substantially among different groups of fungi [1,8,9,10]; for fungi of the division Basidiomycota R.T. Moore, the average intraspecific variability is 3.33%. However, such thresholds vary considerably even within Basidiomycota, differing markedly among individual families and genera, and a division-wide average therefore cannot be reliably extrapolated to any single taxon [1].
In fact, this determined the aim of the present work—to obtain an independent, large-sample estimate of the intraspecific and interspecific ITS variability of two sympatric and cryptic species: Fomes fomentarius (L.) Fr. and Fomes inzengae (Ces. & De Not.) Cooke (Polyporales, Agaricomycetes). Their delimitation occurred over the last 15 years: in 2012, F. fomentarius sensu lato was found to have two species-level phylogenetic lineages [11], which were later identified as two cryptic species: F. fomentarius sensu stricto and F. inzengae (Ces. & De Not.) Cooke [12]. This was subsequently confirmed in the works by Pristas et al. [13], Gáper et al. [14], Zhuykova and Mukhin [15], Tomšovský et al. [16], and Badalyan et al. [17,18], but without a proper study of intraspecific and interspecific ITS variability.
The relevance of studying fungi of the genus Fomes (Fr.) Fr. is determined not only by the need to clarify their phylogenetic relationships, but also by their exceptional role in the carbon cycle of forest ecosystems. In Eurasia, F. fomentarius s.l. is one of the main decomposers of deciduous woody debris [19,20,21,22]; F. fomentarius s.l. and F. fasciatus (Sw.) Cooke play the same role in the deciduous forests of North America [23,24]. The study of intraspecific genetic diversity of fungi of the genus Fomes is also a necessary condition for their biotechnological use and for metagenomic studies of biological diversity [14,25,26,27,28,29,30].
2. Materials and Methods
2.1. Study Subjects
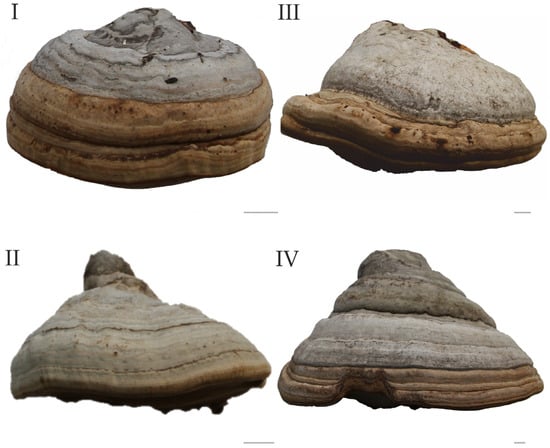
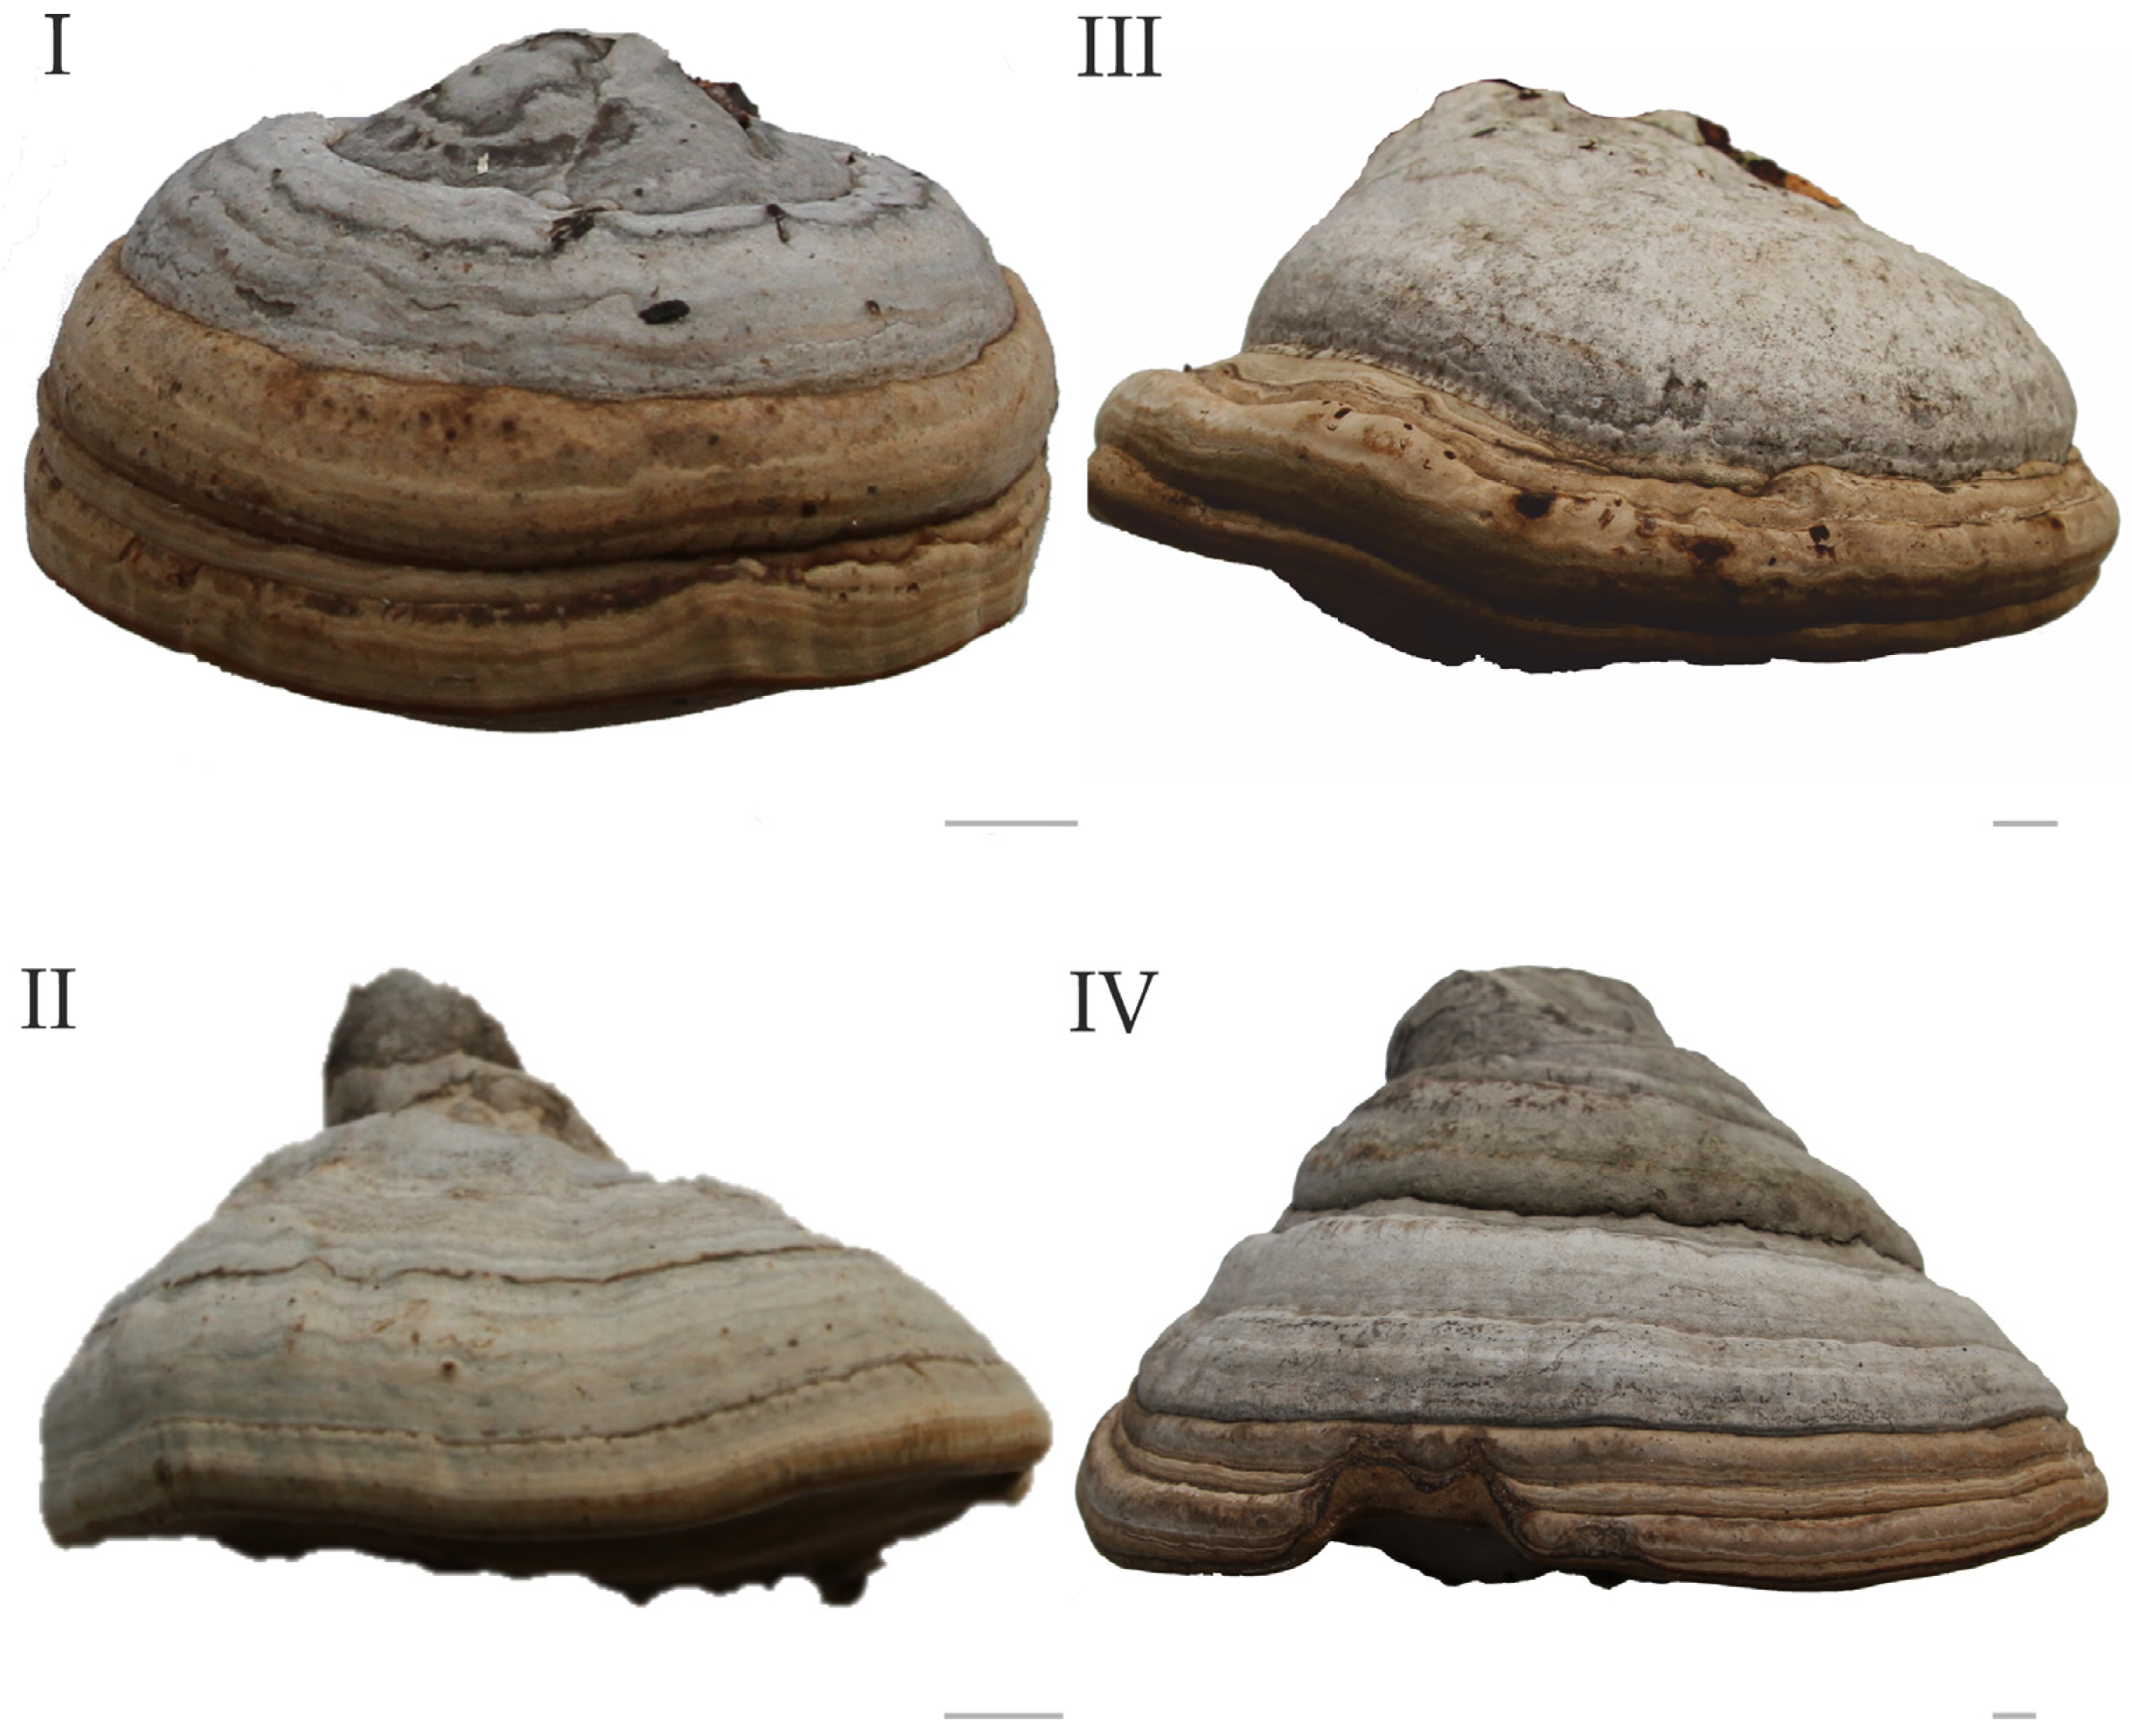
The research subjects were Fomes fomentarius (L.) Fr. sensu stricto and Fomes inzengae (Ces. & De Not.) Cooke (Figure 1). The molecular genetic analysis was carried out using fungal basidiocarps collected by the authors in various regions of the Urals, Siberia, Altai and Kazakhstan (Table S1). One basidiocarp was collected from each substrate, with substrates spaced at least 100 m apart. The collection is deposited in the herbarium of the Institute of Plant and Animal Ecology, Ural Branch of the Russian Academy of Sciences (Yekaterinburg, SVER).
Figure 1.
The basidiocarps of Fomes fomentarius: I—OL580758, II—OL580756, and Fomes inzengae: III—OL555781, IV—OL555782. GenBank accession numbers are indicated; bars are 1 cm [17].
2.2. DNA Isolation and PCR
DNA extraction from basidiocarps and PCR with visualization were performed in the Laboratory of Molecular Studies of Plants and Fungi, Department of Biodiversity and Bioecology, Institute of Natural Sciences and Mathematics, Ural Federal University named after the first President of Russia B.N. Yeltsin (Yekaterinburg, Russia).
DNA extraction was performed using a diaGene plant tissue DNA extraction kit (diaGene, Moscow, Russia), followed by DNA dilution in deionized water. Two primers, ITS1-F and ITS4-B (Evrogen, Moscow, Russia) [6], were used to amplify internal transcribed spacers 1 and 2 and the 5.8S ribosomal DNA gene (ITS1-5.8S-ITS2 or ITS). PCR was performed using a C1000 Touch Amplifier (Bio-Rad Laboratories, Hercules, CA, USA) in a 25 μL reaction mixture containing a buffer solution with 2.5 mM MgCl2, 0.2 mM dNTPs, 0.1 μM of each primer, 0.08 units/μL Taq DNA polymerase (Evrogen, Russia), and 5 μL of DNA solution.
PCR included pre-denaturation at 95 °C for 5 min, 35 cycles of denaturation at 95 °C for 30 s, primer annealing at 55 °C for 45 s, extension at 72 °C for 45 s, and a final extension at 72 °C for 10 min. PCR results were visually detected on a 1.2% agarose gel stained with ethidium bromide. Fragment lengths were verified against the 100+ bp DNA Ladder (Evrogen, Russia) as a length marker using the Gel Doc XR+ documentation system (Bio-Rad Laboratories, USA).
Enzymatic or agarose gel electrophoresis-based purification of PCR products, as well as sequencing in both the forward and reverse directions, were performed at Syntol LLC (Moscow, Russia). Primary sequencing data were processed using Sequencing Analysis Software v. 5 (Applied Biosystems, Foster City, CA, USA), Finch TV v. 1.4 (Geospiza, Inc., Seattle, WA, USA), and MEGA v. 7 [31]. Preliminary identification of sequences was carried out based on the results of a search for similar sequences in the GenBank database using the BLAST algorithm [32].
2.3. Formation of Geographic Groups
A total of 69 complete ITS1–5.8S–ITS2 sequences were isolated: 38 from F. fomentarius and 31 from F. inzengae. Of these, 16 were obtained for the first time in this study; the rest were obtained previously and used in published works by Mukhin et al. [33], Zhuykova and Mukhin [15], and Badalyan et al. [18], and deposited in GenBank. An additional 42 sequences (17 from F. fomentarius and 25 from F. inzengae) were retrieved from the public databases GenBank and UNITE. The selection was carried out according to the criteria of completeness and sufficient annotation of the data: only complete ITS1–5.8S–ITS2 sequences were included, the boundaries of the regions were taken according to the annotation of the HQ189534 and HQ189535 sequences [11].
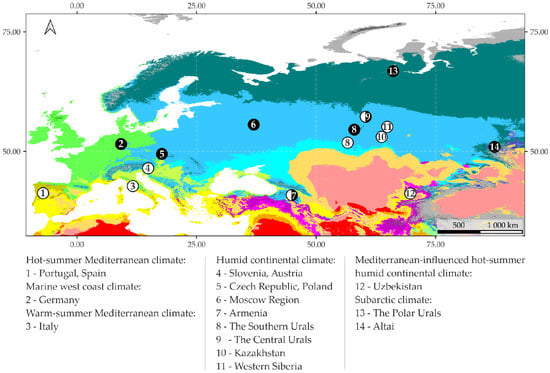
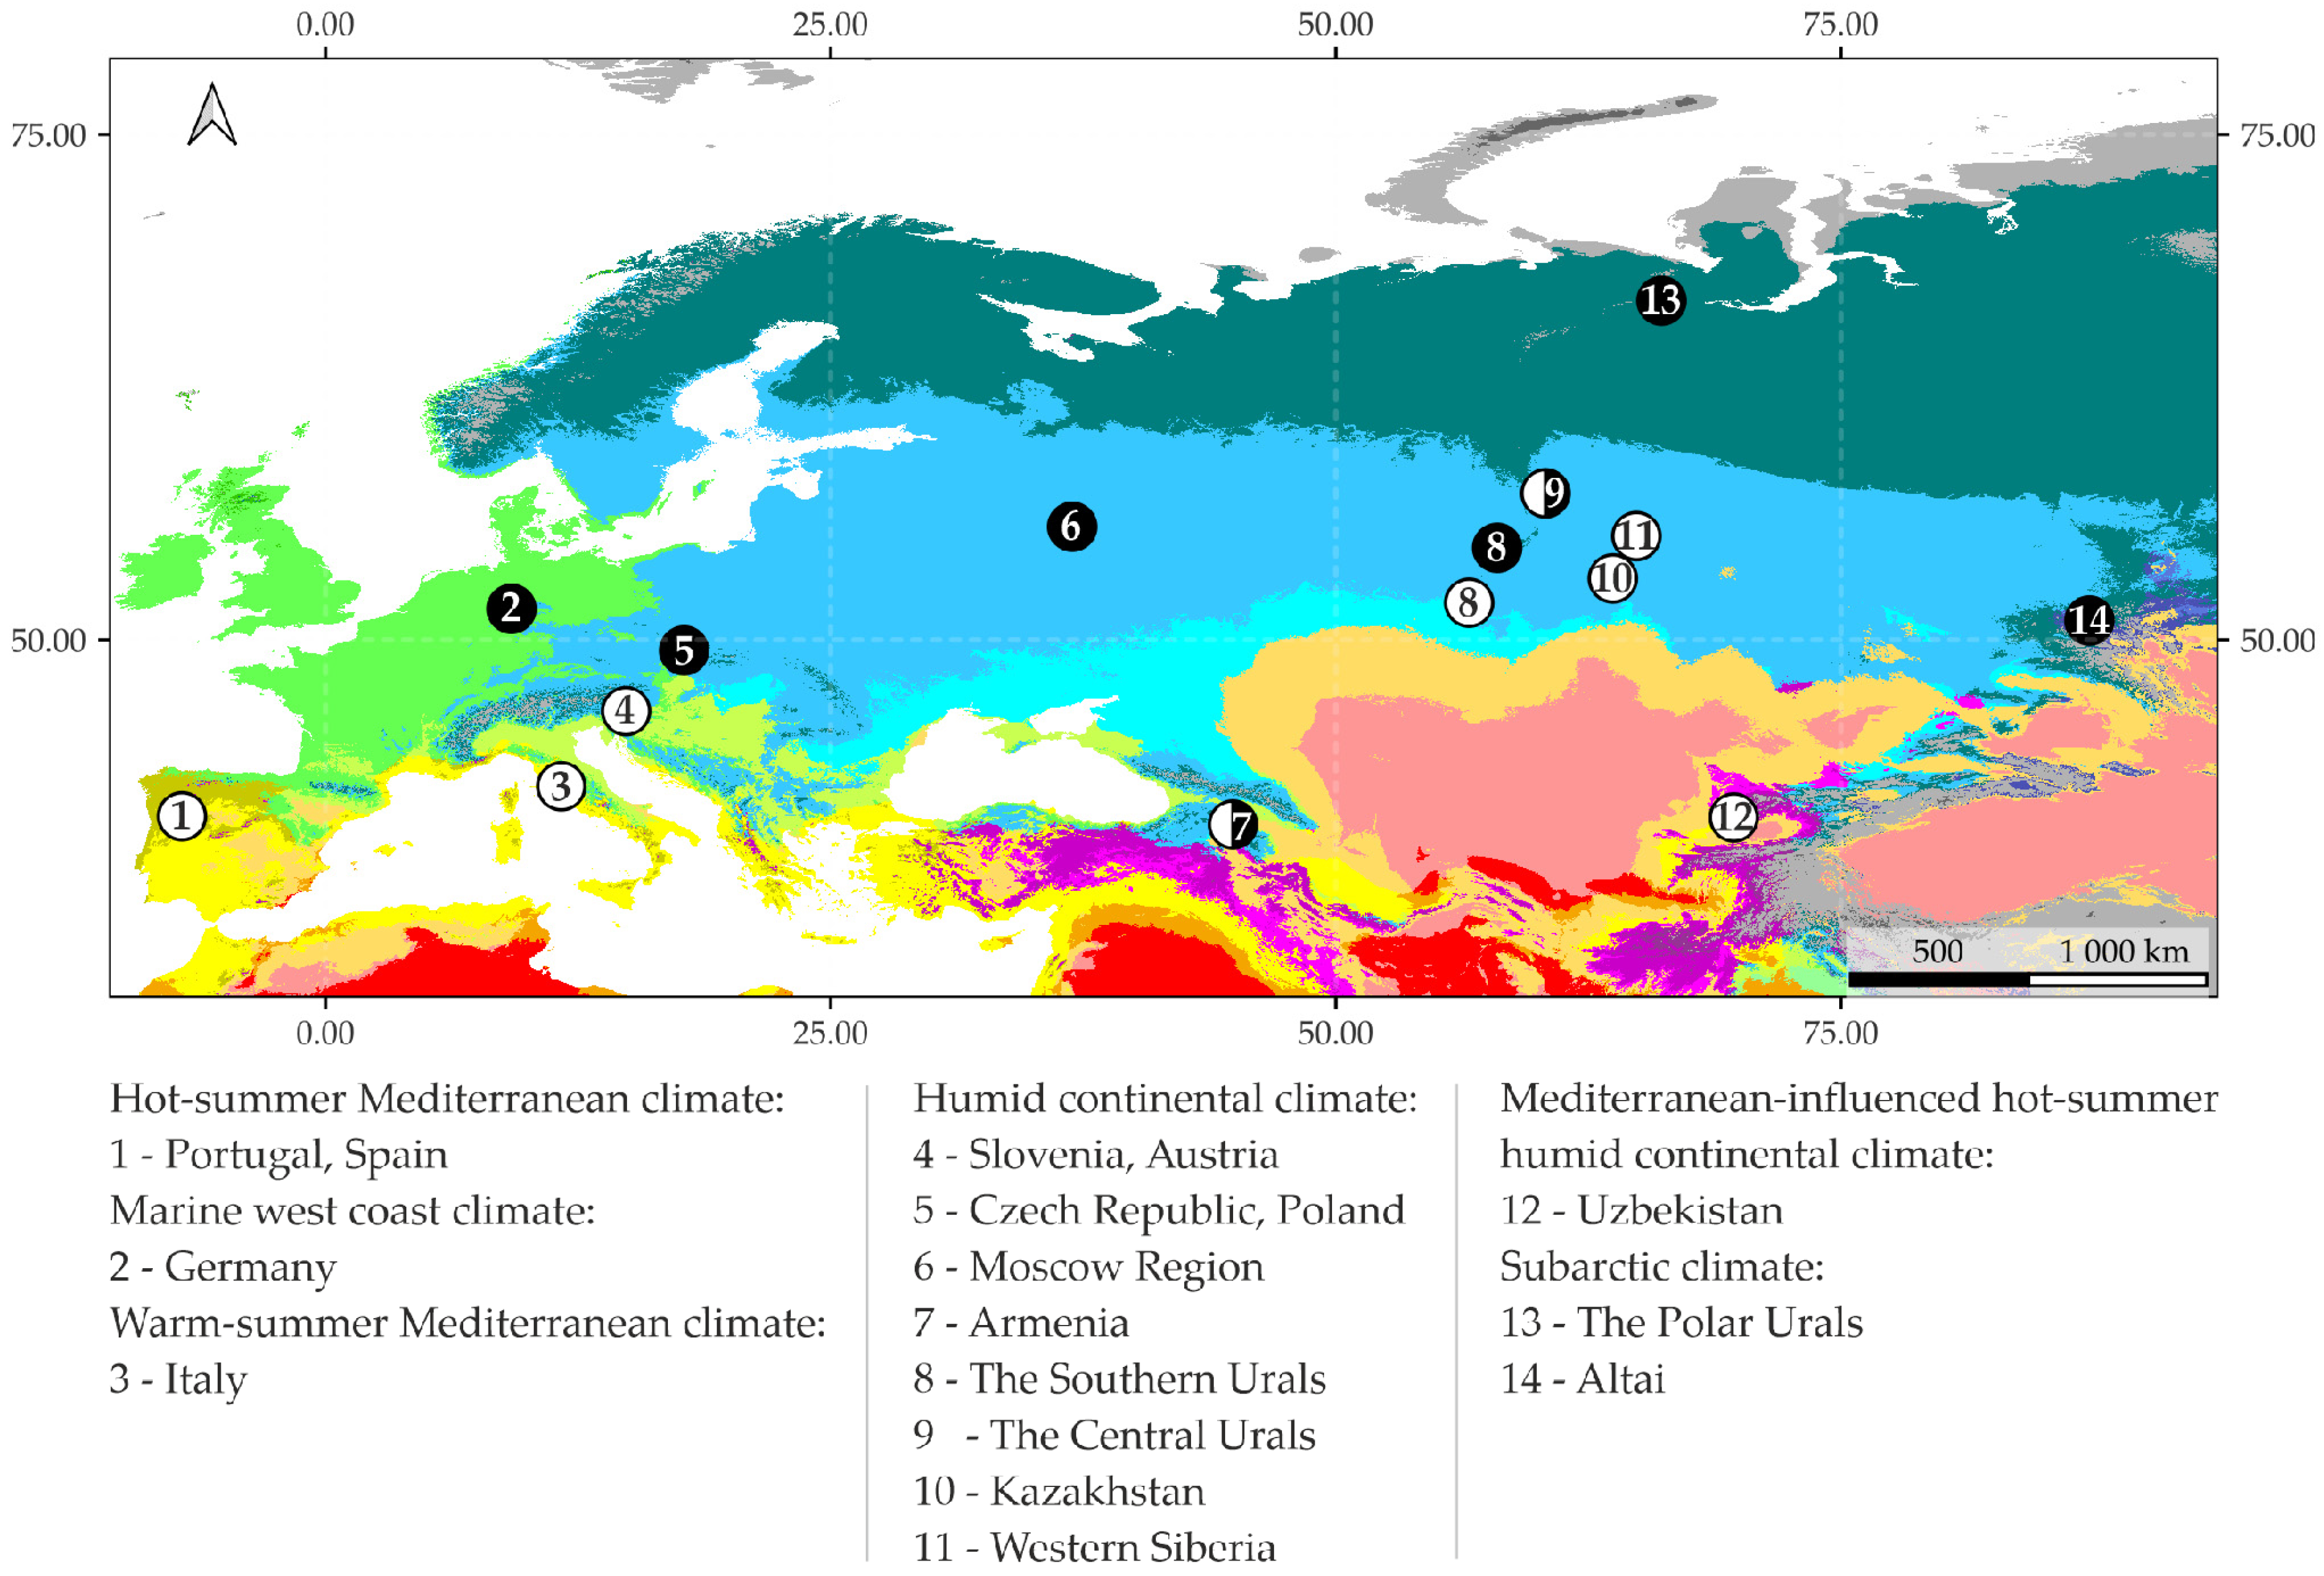
The geographic location of the included sequences was established based on GenBank annotations, GBIF data [34], the articles by Peintner et al. [12], Gafforov et al. [35], Tomšovský et al. [16], and Gáperová et al. [36]. For F. fomentarius, 8 geographic groups were formed from 55 sequences (Table 1), and for F. inzengae, 9 geographic groups were formed from 56 sequences (Table 2). Geogroups include 3–10 sequences obtained from localities no more than 300 km apart from one another. Geographic distances between sequences were calculated using Python 3.12 (geopy v. 2 library, haversine formula, R = 6371 km). The easternmost and westernmost geogroups are approximately 7000 km apart, while the northernmost and southernmost geogroups are approximately 3000 km apart. These geogroups represent regions and countries with different climates: from subarctic in the Polar Urals to subtropical in Portugal (Figure 2).
Table 1.
Geographic groups of ITS sequences of Fomes fomentarius.
Table 2.
Geographic groups of ITS sequences of Fomes inzengae.
Figure 2.
Geographic groups of Fomes fomentarius (black dots) and Fomes inzengae (white dots) sequences based on the Köppen–Geiger climate classification map.
The geographic distribution of geogroups was visualized using QGIS 3.44.13 software. The coordinates of the geographic group centroids were calculated as the arithmetic means of the coordinates of the samples included in each group. The points on the map are colored by species (black for F. fomentarius, white for F. inzengae). The map was constructed in the WGS 84 (EPSG:4326) geographic coordinate system. The Köppen–Geiger climate classification global map [37], version 2, with a spatial resolution of 1 km (historical period 1991–2020), was used as a background.
2.4. Phylogenetic Analysis and Assessment of Genetic Differentiation
Original and database-derived ITS sequences were aligned using the MUSCLE algorithm in MEGA v. 12 [38], cross-checked using the MAFFT algorithm implemented in PhyloSuite v. 2 for the two target species, and manually refined where necessary [39,40]. The species affiliation of the analyzed sequences was determined and/or confirmed based on the results of general clustering with reference sequences previously assigned to the corresponding species based on comparison with the type sequences [15,18]. Eleven ITS sequences of the North American species Fomes fasciatus (Sw.) Cooke, allopatric to F. fomentarius and F. inzengae, were used as an outgroup. These sequences were deposited in GenBank under accession numbers AM269766, JX126900, JX126901, JX126902, JX126903, JX126904, JX126905, JX126906, JX126907, JX126908, and MF074787.
The phylogeny was inferred using the Maximum Likelihood method and the Kimura 2-parameter model with a proportion of invariant sites [41]. The best-fitting nucleotide substitution model was selected using ModelFinder under the Bayesian Information Criterion (BIC) [42]. Evolutionary analysis was performed in MEGA v. 12 [38]. Bootstrap analysis (1000 repetitions) was performed using the Subtree-Pruning-Regrafting algorithm at level 5. The percentage of trees in which the associated taxa clustered together is shown next to the branches (BS% > 70%). The initial tree for the heuristic search was obtained automatically by applying the Maximum Parsimony method. The tree is drawn to scale, with branch lengths measured in the number of substitutions per site. The analysis involved 122 nucleotide sequences. All positions with less than 95% site coverage were eliminated. There was a total of 551 positions in the final dataset.
Bayesian phylogenetic analysis was performed using MrBayes v. 3.2.7 [43]. ITS sequences (alignment length 605 bp) were analyzed under the Kimura 2-parameter model with a proportion of invariant sites, with equal base frequencies. Two independent Markov chain Monte Carlo (MCMC) runs, each with four chains, were conducted for 10,000,000 generations, sampling trees every 5000 generations. Default prior settings were used for all parameters. The first 25% of sampled trees from each run were discarded as burn-in, and the remaining samples were summarized using the sump and sumt commands to obtain posterior distributions of parameters and a majority-rule consensus tree with posterior probabilities (PP). Convergence diagnostics yielded potential scale reduction factors (PSRF) close to 1 for all parameters (maximum PSRF ≈ 1.001) and effective sample sizes (ESS) exceeding 980 for all monitored parameters (minimum ESS = 983.01). The final average standard deviation of split frequencies between the two independent MCMC runs was approximately 0.015. Trees were visualized and edited using FigTree v. 1.4.4.
Nucleotide similarity, nucleotide diversity, and nucleotide divergence were calculated as indicators of genetic polymorphism. The nucleotide similarity is the percentage of identical base pairs; similarity matrix was calculated based on alignments with indels and polymorphic positions in the EMBL-EBI Multiple Sequence Alignment web service [44]. In addition, three other indicators were calculated based on a separate alignment: nucleotide diversity (π), the average number of nucleotide differences per site between two sequences in all possible pairs in the sample; nucleotide divergence (Dxy), the average proportion of nucleotide differences between two groups of sequences; and the average number of nucleotide differences (k), the absolute (not normalized to sequence length) average number of different positions between all possible pairs of sequences in the sample [45]. The matrix for these three indicators was calculated from aligned sequence arrays in which ambiguous bases (ambiguity codes) were replaced by n; indels were removed automatically using DnaSP v. 6 [46].
Along with genetic diversity indices, a fixation index was calculated:
where is the arithmetic mean of the nucleotide diversity of ITS sequences within the two geogroups being compared (intragroup variability), and Dxy is the average nucleotide divergence of the ITS sequences of the geogroups being compared (intergroup, geographic variability). The fixation index reflects the proportion of genetic variability due to differences between groups and typically ranges from 0 (no genetic differentiation, complete panmixia) to 1 (complete isolation) [47]. Calculations were performed using DnaSP v. 6 [46].
To assess the relationship between genetic and geographic differentiation, the Mantel test was used [48]. The Mantel test was applied to assess the correlation between pairwise geographic distance matrices and matrices of nucleotide similarity, nucleotide divergence, and fixation indices. The statistical significance of the Mantel correlation was assessed using 9999 permutations in GenAlEx v. 6.5 [49].
3. Results
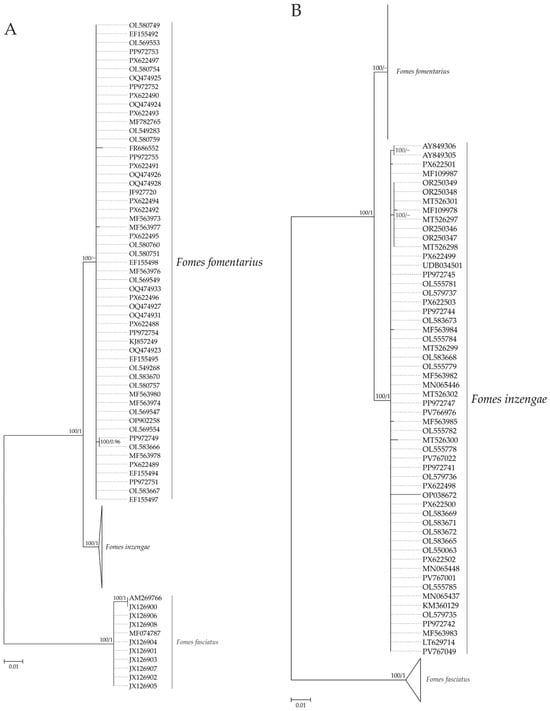
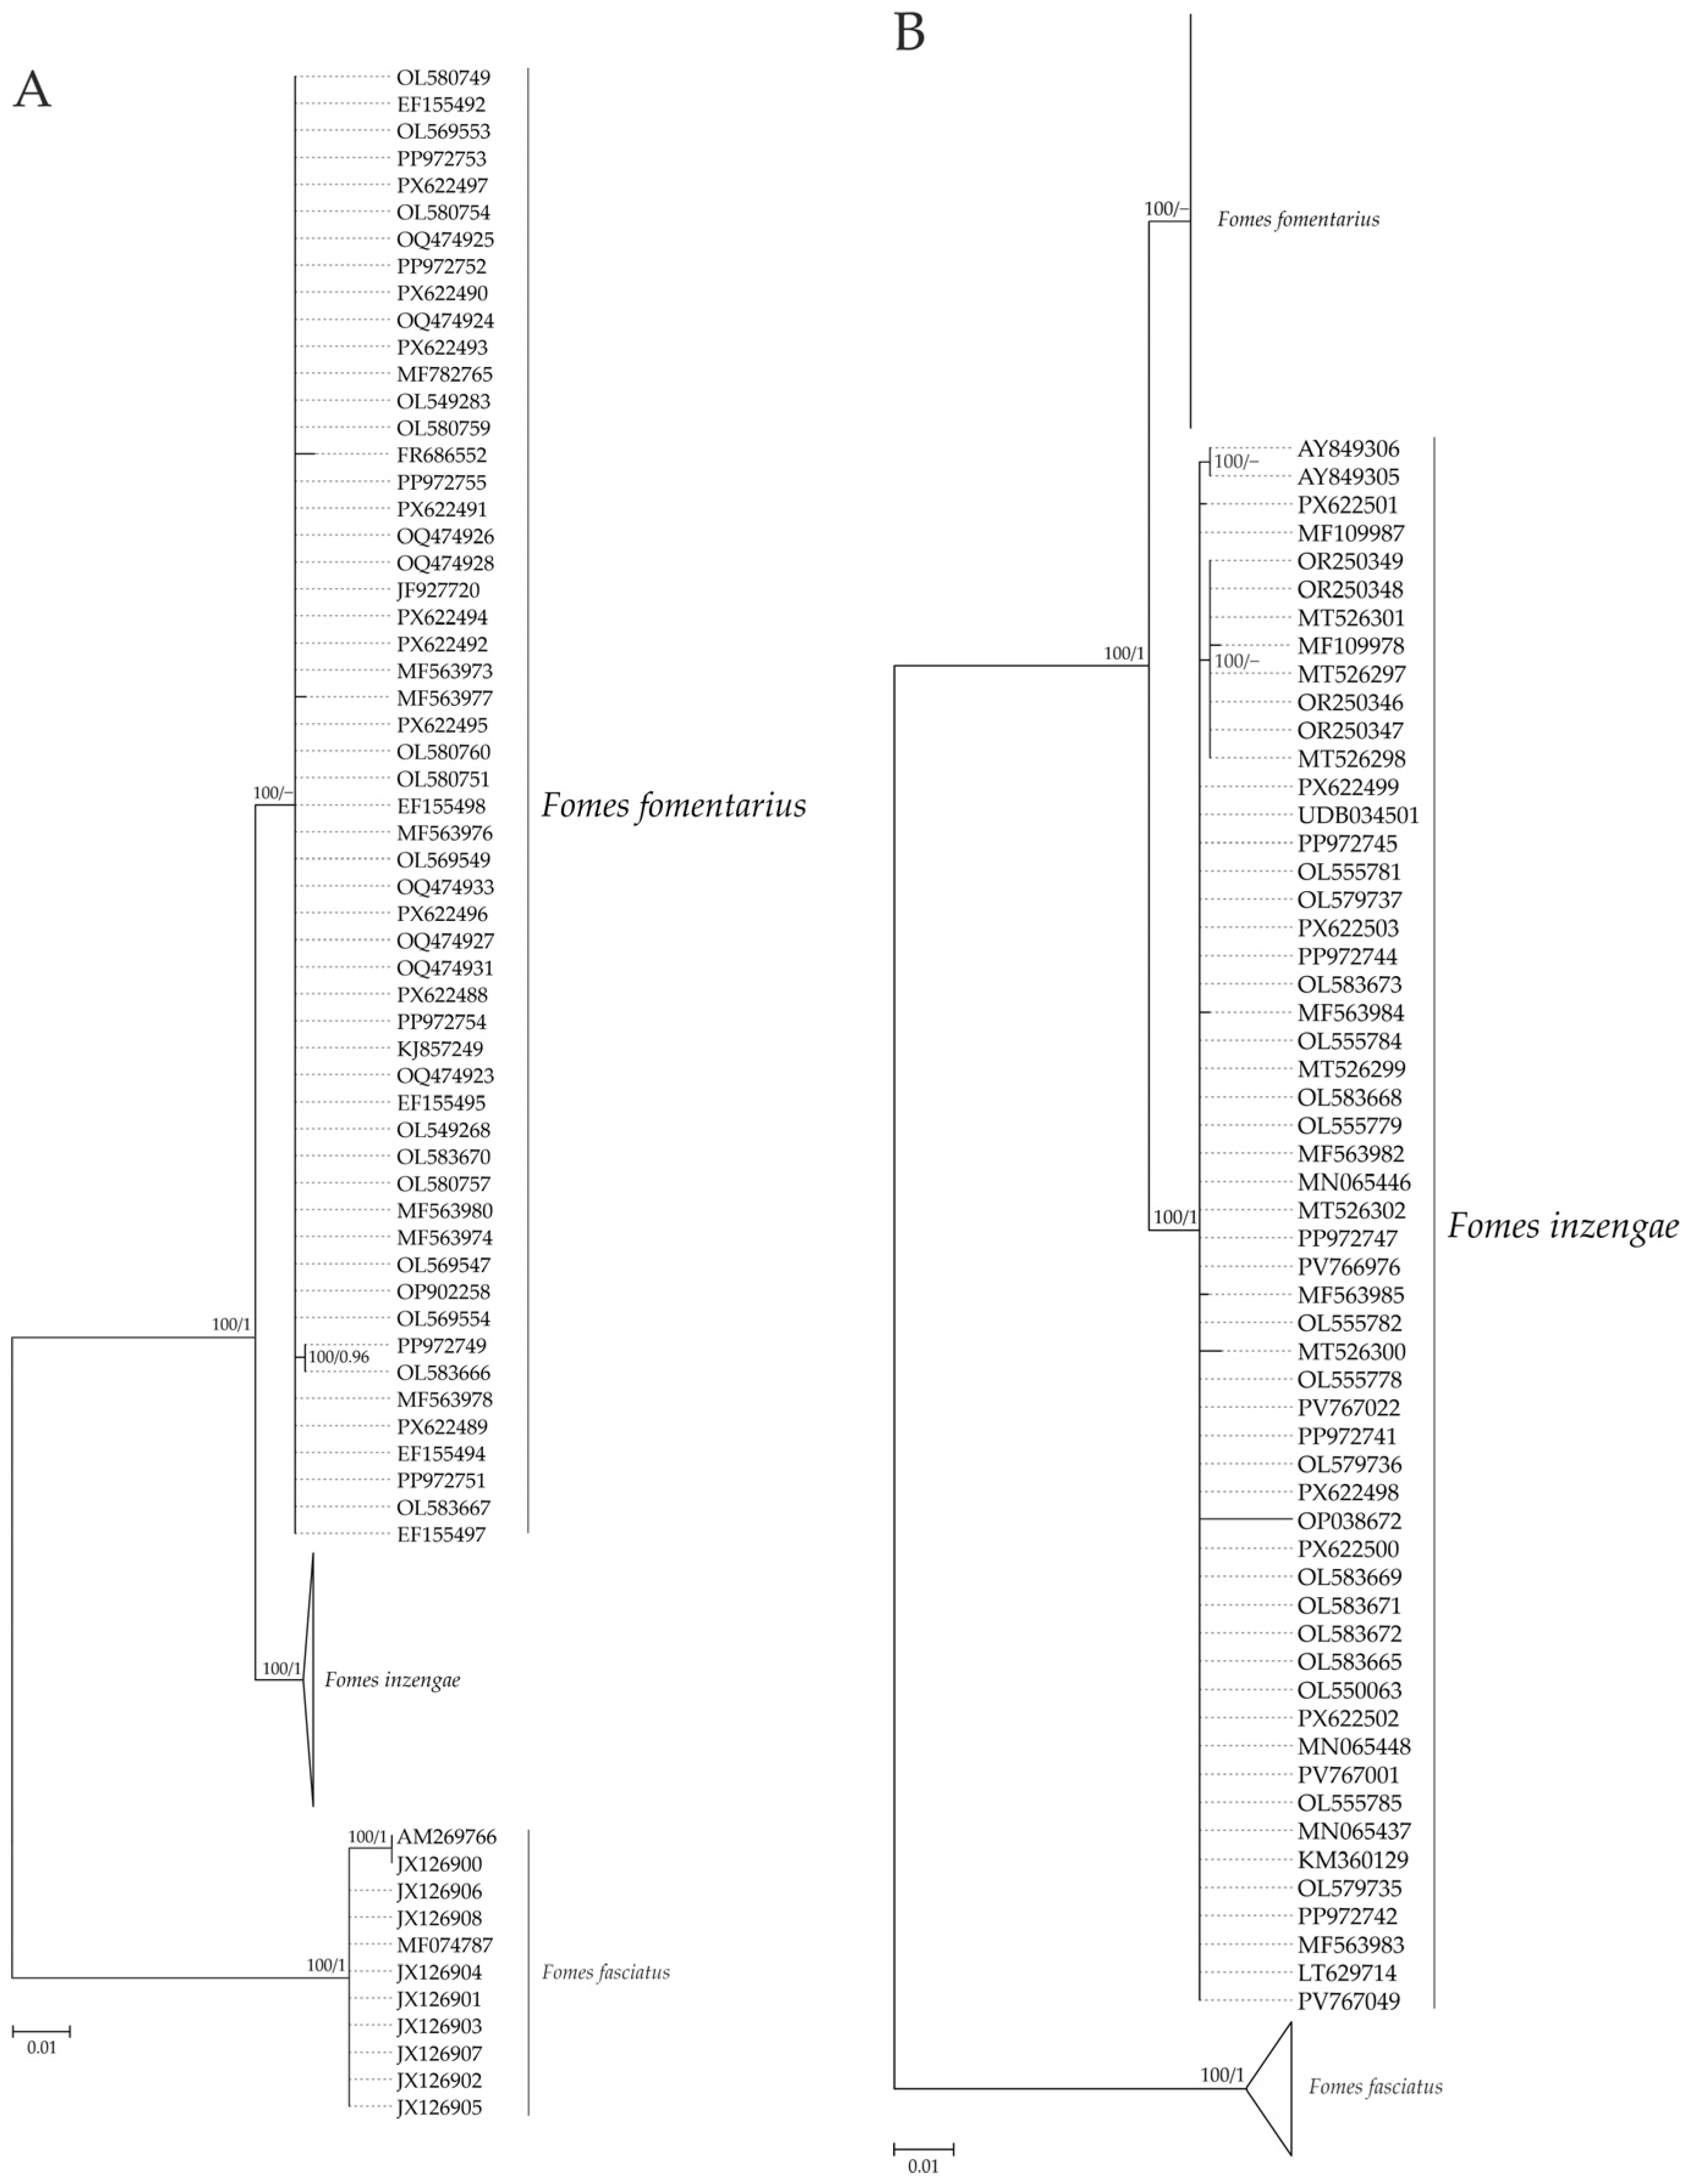
Phylogenetic analysis of 122 complete ITS1–5.8S–ITS2 sequences shows that F. fomentarius and F. inzengae form two monophyletic clusters: 100%/0.76 BS%/PP and 100%/1 BS%/PP, respectively (Figure 3). The nucleotide similarity (96.50 ± 0.01%) and nucleotide divergence (1.01% on average) indicate significant differentiation between them. The North American species F. fasciatus was recovered as a distinct lineage basal to F. fomentarius and F. inzengae. The nucleotide similarity of F. fasciatus with F. inzengae and F. fomentarius is 80.42 ± 0.04% and 80.60 ± 0.03%, while the nucleotide divergence is 8.02% and 7.80%, respectively. In both F. fomentarius and F. inzengae, the clusters, despite the wide geographic range of the ITS sequences, are quite homogeneous: the nucleotide similarity of the ITS sequences is on average 99.62 ± 0.01% in F. fomentarius and 99.61 ± 0.01% in F. inzengae.
Figure 3.
ITS-based Maximum Likelihood phylogeny of Fomes fomentarius (A) and Fomes inzengae (B), rooted with Fomes fasciatus. Node support values are shown as Maximum Likelihood bootstrap percentages (≥70%) and Bayesian posterior probabilities (≥0.95).
Detailed data on nucleotide similarity and diversity within and between geogroups of ITS sequences of F. fomentarius and F. inzengae are presented in Table 3 and Table 4. They show that in F. fomentarius the nucleotide similarity of ITS sequences in geogroups varies from 99.35 to 100%, and nucleotide diversity from 0 to 0.124%. Nucleotide diversity is zero in approximately 60% of cases, and the highest values occur in sequences from Germany (0.124%). The nucleotide similarity of ITS sequences of F. inzengae, as in F. fomentarius, is also high (99.36–99.79%), and nucleotide diversity in 5 geogroups out of 9 (56%) is zero. The highest nucleotide diversity (0.585%) is found in sequences from Austria and Slovenia (Table 4).
Table 3.
Intraspecific ITS variability (%) within (nucleotide similarity/nucleotide diversity, bold) and between (nucleotide similarity/nucleotide divergence) geogroups of Fomes fomentarius.
Table 4.
Intraspecific ITS variability (%) within (nucleotide similarity/nucleotide diversity, bold) and between (nucleotide similarity/nucleotide divergence) geogroups of Fomes inzengae.
Intragroup nucleotide similarity and diversity of ITS sequences show no relationship with climatic conditions. For example, zero nucleotide diversity is recorded for F. fomentarius geogroups from the Polar Urals (subarctic continental climate) and from Poland and the Czech Republic (temperate continental-oceanic climate). They also have very close nucleotide similarity: 99.63 and 99.80%, respectively (Table 3). The same pattern—zero nucleotide diversity and high nucleotide similarity (99.54–99.76%)—is observed for ITS sequences of F. inzengae from the Central Urals (temperate continental climate) and Italy (Mediterranean climate) (Table 4).
Intraspecific ITS variability in F. fomentarius is determined by four polymorphic sites among the 536 analyzed sites in the sequences. Three of these are single substitutions occurring in a single specimen (singletons), while one is repeated across multiple specimens (a parsimony-informative site). In F. inzengae, of the 547 analyzed sites, 12 are polymorphic, all of which are singletons.
In both F. fomentarius and F. inzengae, the differences between the ITS sequence geogroups are not significant. Thus, nucleotide similarity of the F. fomentarius geogroups from the Altai, Polar, Central and Southern Urals, Moscow region, Armenia, Poland and the Czech Republic, and Germany differs by a maximum of 0.63% (Table 3). In F. inzengae, nucleotide similarity differs by a maximum of 0.42% among the ITS sequences of all 9 geogroups (Table 4). In both species, the Mantel test reveals no significant relationship between the nucleotide similarity of sequence geogroups and their geographic distance: Rxy = −0.171, p = 0.140 for F. fomentarius and Rxy = −0.013, p = 0.407 for F. inzengae.
Analysis of the nucleotide divergence of geogroups distant from each other and located in different climatic conditions shows that in F. fomentarius it is zero in about 40% of cases, and in the rest, it ranges from 0.037 to 0.137% (Table 3). In F. inzengae, nucleotide divergence between geogroups is zero in 30% of cases, in the remaining it ranges from 0.030 to 0.329% (Table 4). For F. fomentarius geogroups, the Mantel test does not reveal a significant relationship between the nucleotide divergence and their geographic distance (Rxy = −0.461, p = 0.660), while for F. inzengae geogroups, a significant relationship was found: Rxy = −0.367, p = 0.010.
Genetic differentiation between all geogroups of F. inzengae ITS sequences, as indicated by a zero fixation index (FST ≤ 0.01), is absent. This is also true in most cases for F. fomentarius geogroups (Table 5). Only F. fomentarius sequences from Armenia exhibit significant genetic isolation from the other geogroups: FST = 0.137–0.250.
Table 5.
Fixation index (FST) between geogroups of Fomes fomentarius based on ITS sequences.
In areas of sympatric distribution of F. fomentarius and F. inzengae, the fixation index between their geogroups varies from 0.79 (Europe—western part of the range) to 0.97–1.00 (the Urals, Armenia—eastern part of the range). This indicates complete genetic isolation between these two species in the Urals and Armenia, and high but incomplete genetic isolation in Europe. In all cases, the nucleotide similarity of the ITS sequences of the geogroups of F. fomentarius and F. inzengae is below 97% (96.36–96.57%), and the nucleotide divergence is above 1% (1.145–1.450%), which corresponds to 10–12.4 bp (Table 6).
Table 6.
Genetic differentiation of Fomes fomentarius and Fomes inzengae in areas of their joint distribution.
4. Discussion
Our data show that in F. fomentarius and F. inzengae, the ITS region of rDNA is a stable, weakly variable genetic marker. This is expressed, first of all, in a very high or complete intragroup nucleotide similarity of ITS sequences (99.35–100%) and, accordingly, in a complete absence or an extremely low level of their individual differences: 0–0.63%. The weak individual variability of ITS sequences is also indicated by their nucleotide diversity: 0–0.124% (F. fomentarius) and 0–0.585% (F. inzengae). According to Peintner et al. [12], the nucleotide diversity of sequences in F. fomentarius is 0.01% and F. inzengae 0.02%.
In F. fomentarius and F. inzengae, not only the individual but also the geographic variability of ITS sequences is very weak. Geogroups of sequences from geographically distant regions with different climatic conditions differ only slightly in nucleotide similarity (0.63 and 0.42%) and nucleotide divergence (0.030–0.329%). No geographic or climatic pattern was found for either individual or geographic ITS variability. Only in the ITS sequences of F. inzengae geogroups is a relationship between nucleotide divergence and distance observed, but this relationship is absent in the case of nucleotide similarity.
All the above demonstrate that intraspecific individual and geographic ITS variability in F. fomentarius and F. inzengae is not determined by climatic and geographic factors. Instead, this low level of ITS variability is directly reflected in the small number of polymorphic sites detected (up to 12). Even lower, often zero, individual-level ITS variability has been reported for more geographically restricted samples of F. fomentarius and F. inzengae [15,18,25]. Singleton-dominated polymorphism patterns can, in principle, arise from PCR or sequencing artifacts rather than true biological variation; this risk is best minimized through bidirectional sequencing covering the full-length ITS1–5.8S–ITS2 amplicon, combined with sufficiently large and representative sampling. At the geographic scale, a similarly low level of ITS variability is associated with the lack of genetic differentiation and the free genetic exchange between local populations of F. fomentarius and F. inzengae. This eliminates the differences between local populations and leads to the formation of panmictic populations, geographically undifferentiated by the ITS rDNA region.
As sympatric species, F. fomentarius and F. inzengae develop in the same areas and biotopes [11,15,16,18]. In the Urals and Armenia, F. fomentarius and F. inzengae are completely genetically isolated (fixation index: 0.97–1.0). Tomšovský et al. [16] showed a similarly complete level of isolation between them in South Moravia, the Czech Republic (fixation index is 0.991). However, our data indicate that, in Central Europe, the level of isolation between these species is very high (fixation index is 0.79) but may not preclude genetic exchange.
During sympatric development, the ITS sequences of F. fomentarius and F. inzengae show significant differences in nucleotide similarity (less than 97%) and nucleotide divergence (more than 1%). This suggests that the ITS sequence can serve as a species-level genetic marker for F. fomentarius and F. inzengae, with nucleotide similarity and divergence serving as the corresponding diagnostic parameters for research on their biodiversity and phylogenetic relationships, as well as for their biotechnological applications.
5. Conclusions
F. fomentarius and F. inzengae are characterized by very low levels of individual and geographic ITS variability. This low variability is reflected in the limited number of polymorphic sites and is accompanied by the absence of intraspecific genetic differentiation among local populations, with no consistent geographic or climatic pattern. When sympatry occurs, local populations of F. fomentarius and F. inzengae in different parts of their vast ranges are either, as a rule, completely genetically isolated or, less commonly, exhibit very high but incomplete isolation. Differences between F. fomentarius and F. inzengae in both nucleotide similarity and divergence significantly exceed their intraspecific ITS variability, confirming that the ITS marker draws a clear boundary between these two species. This indicates that the ITS region alone can serve as a sufficient species-specific marker for reliably identifying this pair of cryptic species.
Supplementary Materials
The following supporting information can be downloaded at: https://www.mdpi.com/article/10.3390/d18100644/s1, Table S1: List of ITS sequences isolated from basidiocarps collected by the authors, indicating collection locations and coordinates.
Author Contributions
Conceptualization, V.A.M. and E.V.Z.; methodology, V.A.M. and E.V.Z.; software, E.V.Z.; validation, E.V.Z.; formal analysis, E.V.Z.; investigation, E.V.Z.; resources, E.V.Z.; data curation, E.V.Z.; writing—original draft preparation, V.A.M. and E.V.Z.; writing—review and editing, V.A.M. and E.V.Z.; visualization, E.V.Z.; supervision, V.A.M.; project administration, V.A.M. and E.V.Z.; funding acquisition, V.A.M. All authors have read and agreed to the published version of the manuscript.
Funding
This research was funded by the Russian Science Foundation, grant number 24-24-00404.
Institutional Review Board Statement
Not applicable.
Informed Consent Statement
Not applicable.
Data Availability Statement
Data are contained within the article.
Acknowledgments
We thank three anonymous reviewers for their valuable comments and suggestions, which helped to improve this paper.
Conflicts of Interest
The authors declare no conflicts of interest. The funders had no role in the design of the study; in the collection, analyses, interpretation of data; in the writing of the manuscript; in the decision to publish the results.
Abbreviations
The following abbreviations are used in this manuscript:
| ITS | Internal Transcribed Spacer |
| UNITE | Unified System for the DNA-based Fungal Species Linked to the Classification |
| rDNA | Ribosomal DNA |
| FST | Fixation Index (Wright’s F-statistic) |
| DNA | Deoxyribonucleic Acid |
| rpb1 | Gene encoding the largest subunit of RNA polymerase II |
| rpb2 | Gene encoding the second-largest subunit of RNA polymerase II |
| s.l. | sensu lato |
| SVER | Herbarium code of the Institute of Plant and Animal Ecology (Yekaterinburg) |
| IPAE | Institute of Plant and Animal Ecology (voucher specimen prefix) |
| PCR | Polymerase Chain Reaction |
| dNTPs | Deoxynucleotide Triphosphates |
| BLAST | Basic Local Alignment Search Tool |
| GBIF | Global Biodiversity Information Facility |
| Geogroup | Geographic group of ITS sequences |
| QGIS | Quantum Geographic Information System |
| WGS 84 | World Geodetic System 1984 |
| EPSG | European Petroleum Survey Group |
| MUSCLE | Multiple Sequence Comparison by Log-Expectation |
| MEGA | Molecular Evolutionary Genetics Analysis |
| MAFFT | Multiple Alignment using Fast Fourier Transform |
| BIC | Bayesian Information Criterion |
| BS | Bootstrap (support value) |
| MCMC | Markov Chain Monte Carlo |
| PP | Posterior Probability |
| PSRF | Potential Scale Reduction Factor |
| ESS | Effective Sample Size |
| DnaSP | DNA Sequence Polymorphism (Analysis) |
| GenAlEx | Genetic Analysis in Excel |
References
- Nilsson, R.H.; Kristiansson, E.; Ryberg, M.; Hallenberg, N.; Larsson, K.-H. Intraspecific ITS Variability in the Kingdom Fungi as Expressed in the International Sequence Databases and Its Implications for Molecular Species Identification. Evol. Bioinform. 2008, 4, 193–201. [Google Scholar] [CrossRef] [Scilit] [PubMed]
- Horton, T.R.; Bruns, T.D. The Molecular Revolution in Ectomycorrhizal Ecology: Peeking into the Black-box. Mol. Ecol. 2001, 10, 1855–1871. [Google Scholar] [CrossRef] [Scilit] [PubMed]
- Bridge, P.D.; Spooner, B.M.; Roberts, P.J. The Impact of Molecular Data in Fungal Systematics. In Advances in Botanical Research; Callow, J.A., Ed.; Academic Press: Cambridge, MA, USA, 2005; Volume 42, pp. 33–67. [Google Scholar]
- Schoch, C.L.; Seifert, K.A.; Huhndorf, S.; Robert, V.; Spouge, J.L.; Levesque, C.A.; Chen, W.; Fungal Barcoding Consortium; Fungal Barcoding Consortium Author List; Bolchacova, E.; et al. Nuclear Ribosomal Internal Transcribed Spacer (ITS) Region as a Universal DNA Barcode Marker for Fungi. Proc. Natl. Acad. Sci. USA 2012, 109, 6241–6246. [Google Scholar] [CrossRef] [Scilit] [PubMed]
- White, T.J.; Bruns, T.; Lee, S.; Taylor, J. Amplification and Direct Sequencing of Fungal Ribosomal RNA Genes for Phylogenetics. In PCR Protocols; Innis, M.A., Gelfand, D.H., Sninsky, J.J., White, T.J., Eds.; Academic Press: San Diego, CA, USA, 1990; pp. 315–322. ISBN 978-0-12-372180-8. [Google Scholar]
- Gardes, M.; Bruns, T.D. ITS Primers with Enhanced Specificity for Basidiomycetes—Application to the Identification of Mycorrhizae and Rusts. Mol. Ecol. 1993, 2, 113–118. [Google Scholar] [CrossRef] [Scilit] [PubMed]
- Meyer, C.P.; Paulay, G. DNA Barcoding: Error Rates Based on Comprehensive Sampling. PLoS Biol. 2005, 3, e422. [Google Scholar] [CrossRef] [Scilit] [PubMed]
- Izzo, A.; Agbowo, J.; Bruns, T.D. Detection of Plot-Level Changes in Ectomycorrhizal Communities across Years in an Old-Growth Mixed-Conifer Forest. New Phytol. 2005, 166, 619–629. [Google Scholar] [CrossRef] [Scilit] [PubMed]
- Ciardo, D.E.; Schär, G.; Böttger, E.C.; Altwegg, M.; Bosshard, P.P. Internal Transcribed Spacer Sequencing versus Biochemical Profiling for Identification of Medically Important Yeasts. J. Clin. Microbiol. 2006, 44, 77–84. [Google Scholar] [CrossRef] [Scilit] [PubMed]
- Smith, M.E.; Douhan, G.W.; Rizzo, D.M. Intra-Specific and Intra-Sporocarp ITS Variation of Ectomycorrhizal Fungi as Assessed by rDNA Sequencing of Sporocarps and Pooled Ectomycorrhizal Roots from a Quercus Woodland. Mycorrhiza 2007, 18, 15–22. [Google Scholar] [CrossRef] [Scilit] [PubMed]
- Judova, J.; Dubikova, K.; Gaperova, S.; Gaper, J.; Pristas, P. The Occurrence and Rapid Discrimination of Fomes fomentarius Genotypes by ITS-RFLP Analysis. Fungal Biol. 2012, 116, 155–160. [Google Scholar] [CrossRef] [Scilit] [PubMed]
- Peintner, U.; Kuhnert-Finkernagel, R.; Wille, V.; Biasioli, F.; Shiryaev, A.; Perini, C. How to Resolve Cryptic Species of Polypores: An Example in Fomes. IMA Fungus 2019, 10, 17. [Google Scholar] [CrossRef] [Scilit] [PubMed]
- Pristas, P.; Gaperova, S.; Gaper, J.; Judova, J. Genetic Variability in Fomes fomentarius Reconfirmed by Translation Elongation Factor 1-α DNA Sequences and 25S LSU rRNA Sequences. Biologia 2013, 68, 816–820. [Google Scholar] [CrossRef] [Scilit]
- Gáper, J.; Gáperová, S.; Pristas, P.; Naplavova, K. Medicinal Value and Taxonomy of the Tinder Polypore, Fomes fomentarius (Agaricomycetes): A Review. Int. J. Med. Mushrooms 2016, 18, 851–859. [Google Scholar] [CrossRef] [Scilit] [PubMed]
- Zhuykova, E.V.; Mukhin, V.A. Diversity and Ecological Features of Phylogenetic Lineages of Tinder Fungus in the Urals. Russ. J. Ecol. 2022, 53, 366–372. [Google Scholar] [CrossRef] [Scilit]
- Tomšovský, M.; Kaeochulsri, S.; Kudláček, T.; Dálya, L.B. Ecological, Morphological and Phylogenetic Survey of Fomes fomentarius and F. inzengae (Agaricomycetes, Polyporaceae) Co-Occurring in the Same Geographic Area in Central Europe. Mycol. Progress. 2023, 22, 79. [Google Scholar] [CrossRef] [Scilit]
- Badalyan, S.M.; Vladykina, V.D.; Zhuykova, E.V.; Diyarova, D.K.; Mukhin, V.A. Genetic and Morphological Polymorphism in Wood-Decaying Fungi. In Ecology of Macrofungi: An Overview; Sridhar, K.R., Deshmukh, S.K., Eds.; Progress in mycological research; CRC Press: Boca Raton, FL, USA; Taylor & Francis Group: London, UK; New York, NY, USA, 2023; pp. 311–332. ISBN 978-1-003-42927-2. [Google Scholar]
- Badalyan, S.M.; Zhuykova, E.V.; Mukhin, V.A. The Eco-Geographical and Phylogenetic Analysis of Fomes fomentarius sensu lato (Polyporales, Agaricomycetes) in Armenia. Ital. J. Mycol. 2026, 55, 8–23. [Google Scholar] [CrossRef] [Scilit] [PubMed]
- Ryvarden, L.; Gilbertson, R.L. European Polypores: Abortiporus—Lindtneria; European Polypores; Fungiflora: Oslo, Norway, 1993; ISBN 978-82-90724-12-7. [Google Scholar]
- Bondartsev, A.S. Polypore Fungi of the European Part of USSR and Caucasus; USSR Academy of Sciences Publishing House: Moscow, Russia; Leningrad, Russia, 1953. [Google Scholar]
- Bondartseva, M.A. Families Albatrellaceae, Aporpiaceae, Boletopsiaceae, Bondartseviaceae, Ganodermaceae, Corticiaceae (Species with a Pore-like Hymenophore), Lachnocladiaceae (Species with a Tubular Hymenophore), Polyporaceae (Genera with a Tubular Hymenophore), Poriaceae, Rigidoporaceae, Phaeolaceae, Fistulinaceae; Handbook of the fungi of Russia; Order Aphyllophorales; Nauka: St. Petersburg, Russia, 1998. [Google Scholar]
- Bolshakov, S.; Volobuev, S.; Ezhov, O.; Palomozhnykh, E.; Potapov, K. Aphyllophoroid Fungi of the European Part of Russia: A Checklist; Publishing House of Saint Petersburg Electrotechnical University “LETI”: St. Petersburg, Russia, 2022; ISBN 978-5-7629-3121-2. (In Russian) [Google Scholar]
- Gilbertson, R.L.; Ryvarden, L. North American Polypores; Fungiflora: Oslo, Norway, 1986; Volume 1. [Google Scholar]
- Farr, D.F.; Bills, G.F.; Chamuris, G.P.; Rossman, A.Y. Fungi on Plants and Plant Products in the United States; APS Press: St. Paul, MN, USA, 1989. [Google Scholar]
- Dresch, P.; D Aguanno, M.N.; Rosam, K.; Grienke, U.; Rollinger, J.M.; Peintner, U. Fungal Strain Matters: Colony Growth and Bioactivity of the European Medicinal Polypores Fomes fomentarius, Fomitopsis pinicola and Piptoporus betulinus. AMB Express 2015, 5, 4. [Google Scholar] [CrossRef] [Scilit] [PubMed]
- Garrido-Huéscar, E.; González-Burgos, E.; Kirika, P.M.; Boustie, J.; Ferron, S.; Gómez-Serranillos, M.P.; Lumbsch, H.T.; Divakar, P.K. A New Cryptic Lineage in Parmeliaceae (Ascomycota) with Pharmacological Properties. J. Fungi 2022, 8, 826. [Google Scholar] [CrossRef] [Scilit] [PubMed]
- Ceballos-Escalera, A.; Richards, J.; Arias, M.B.; Inward, D.J.G.; Vogler, A.P. Metabarcoding of Insect-Associated Fungal Communities: A Comparison of Internal Transcribed Spacer (ITS) and Large-Subunit (LSU) rRNA Markers. MycoKeys 2022, 88, 1–33. [Google Scholar] [CrossRef] [Scilit] [PubMed]
- Rašeta, M.; Kebert, M.; Pintać Šarac, D.; Mišković, J.; Berežni, S.; Kulmány, Á.E.; Zupkó, I.; Karaman, M.; Jovanović-Šanta, S. Bioactive Potential of Balkan Fomes fomentarius Strains: Novel Insights into Comparative Mycochemical Composition and Antioxidant, Anti-Acetylcholinesterase, and Antiproliferative Activities. Microorganisms 2025, 13, 1210. [Google Scholar] [CrossRef] [Scilit] [PubMed]
- Zhou, Y.; Mu, L.; Zhao, Q.; Dai, Y.; Chen, S.; Wu, T.; Zhang, Y. Morpho-Molecular Characterization Reveals Three Cortinarius Subgenus Dermocybe Species from Southwest China (Agaricales, Cortinariaceae). MycoKeys 2026, 130, 165–184. [Google Scholar] [CrossRef] [Scilit] [PubMed]
- Badalyan, S.; Iotti, M.; Zambonelli, A. The Resource Potential of Mushrooms—A Review. Mycol. Spectr. 2026, 2, 1–17. [Google Scholar] [CrossRef] [Scilit]
- Kumar, S.; Stecher, G.; Tamura, K. MEGA7: Molecular Evolutionary Genetics Analysis Version 7.0 for Bigger Datasets. Mol. Biol. Evol. 2016, 33, 1870–1874. [Google Scholar] [CrossRef] [Scilit] [PubMed]
- Johnson, M.; Zaretskaya, I.; Raytselis, Y.; Merezhuk, Y.; McGinnis, S.; Madden, T.L. NCBI BLAST: A better web interface. Nucleic Acids Res. 2008, 36, W5–W9. [Google Scholar] [CrossRef] [Scilit] [PubMed]
- Mukhin, V.A.; Zhuykova, E.V.; Badalyan, S.M. Genetic Variability of the Medicinal Tinder Bracket Polypore, Fomes fomentarius (Agaricomycetes), from the Asian Part of Russia. Int. J. Med. Mushrooms 2018, 20, 561–568. [Google Scholar] [CrossRef] [Scilit] [PubMed]
- Gafforov, Y.; Ordynets, A. Aphyllophoroid Fungi of Uzbekistan. Institute of Botany of the Academy of Sciences of the Republic of Uzbekistan. 2022. Available online: https://doi.org/10.15468/vsru5z (accessed on 10 May 2026). [CrossRef]
- Gafforov, Y.; Rašeta, M.; Rapior, S.; Yarasheva, M.; Wang, X.; Zhou, L.; Wan-Mohtar, W.A.A.Q.I.; Zafar, M.; Lim, Y.W.; Wang, M.; et al. Macrofungi as Medicinal Resources in Uzbekistan: Biodiversity, Ethnomycology, and Ethnomedicinal Practices. J. Fungi 2023, 9, 922. [Google Scholar] [CrossRef] [Scilit] [PubMed]
- Gáperová, S.; Gáper, J.; Gallay, I.; Pristaš, P.; Slobodník, B. Spatial Distribution and Host Preferences of Fomes fomentarius and F. inzengae in Europe: A Review. Folia Acol 2025, 52, 202–218. [Google Scholar] [CrossRef] [Scilit]
- Beck, H.; McVicar, T.; Vergopolan, N.; Berg, A.; Lutsko, N.; Dufour, A.; Zeng, Z.; Jiang, X.; van Dijk, A.; Miralles, D. High-Resolution (1 Km) Köppen-Geiger Maps for 1901–2099 Based on Constrained CMIP6 Projections. Sci. Data 2023, 10, 724. [Google Scholar] [CrossRef] [Scilit] [PubMed]
- Kumar, S.; Stecher, G.; Suleski, M.; Sanderford, M.; Sharma, S.; Tamura, K. MEGA12: Molecular Evolutionary Genetic Analysis Version 12 for Adaptive and Green Computing. Mol. Biol. Evol. 2024, 41, msae263. [Google Scholar] [CrossRef] [Scilit] [PubMed]
- Katoh, K.; Standley, D.M. MAFFT Multiple Sequence Alignment Software Version 7: Improvements in Performance and Usability. Mol. Biol. Evol. 2013, 30, 772–780. [Google Scholar] [CrossRef] [Scilit] [PubMed]
- Zhang, D.; Gao, F.; Jakovlić, I.; Zou, H.; Zhang, J.; Li, W.X.; Wang, G.T. Phylosuite: An Integrated and Scalable Desktop Platform for Streamlined Molecular Sequence Data Management and Evolutionary Phylogenetics Studies. Mol. Ecol. Resour. 2020, 20, 348–355. [Google Scholar] [CrossRef] [Scilit] [PubMed]
- Kimura, M. A Simple Method for Estimating Evolutionary Rate of Base Substitutions Through Comparative Studies of Nucleotide Sequences. J. Mol. Evol. 1980, 16, 111–120. [Google Scholar] [CrossRef] [Scilit] [PubMed]
- Kalyaanamoorthy, S.; Minh, B.Q.; Wong, T.K.F.; von Haeseler, A.; Jermiin, L.S. ModelFinder: Fast Model Selection For Accurate Phylogenetic Estimates. Nat. Methods 2017, 14, 587–589. [Google Scholar] [CrossRef] [Scilit] [PubMed]
- Ronquist, F.; Teslenko, M.; van der Mark, P.; Ayres, D.L.; Darling, A.; Höhna, S.; Larget, B.; Liu, L.; Suchard, M.A.; Huelsenbeck, J.P. MrBayes 3.2: Efficient Bayesian Phylogenetic Inference and Model Choice across a Large Model Space. Syst. Biol. 2012, 61, 539–542. [Google Scholar] [CrossRef] [Scilit] [PubMed]
- Clustal Omega. Multiple Sequence Alignment. European Bioinformatics Institute. Available online: https://www.ebi.ac.uk/jdispatcher/msa/clustalo (accessed on 15 May 2026).
- Tajima, F. Evolutionary Relationship of DNA Sequences in Finite Populations. Genetics 1983, 105, 437–460. [Google Scholar] [CrossRef] [Scilit] [PubMed]
- Rozas, J.; Ferrer-Mata, A.; Sánchez-DelBarrio, J.C.; Guirao-Rico, S.; Librado, P.; Ramos-Onsins, S.E.; Sánchez-Gracia, A. DnaSP 6: DNA Sequence Polymorphism Analysis of Large Data Sets. Mol. Biol. Evol. 2017, 34, 3299–3302. [Google Scholar] [CrossRef] [Scilit] [PubMed]
- Hudson, R.R.; Slatkin, M.; Maddison, W.P. Estimation of Levels of Gene Flow from DNA Sequence Data. Genetics 1992, 132, 583–589. [Google Scholar] [CrossRef] [Scilit] [PubMed]
- Mantel, N. The Detection of Disease Clustering and a Generalized Regression Approach. Cancer Res. 1967, 27, 209–220. [Google Scholar] [PubMed]
- Peakall, R.; Smouse, P.E. GenAlEx 6.5: Genetic Analysis in Excel. Population Genetic Software for Teaching and Research—An Update. Bioinformatics 2012, 28, 2537–2539. [Google Scholar] [CrossRef] [Scilit] [PubMed]

Disclaimer/Publisher’s Note: The statements, opinions and data contained in all publications are solely those of the individual author(s) and contributor(s) and not of MDPI and/or the editor(s). MDPI and/or the editor(s) disclaim responsibility for any injury to people or property resulting from any ideas, methods, instructions or products referred to in the content. |
© 2026 by the authors. Licensee MDPI, Basel, Switzerland. This article is an open access article distributed under the terms and conditions of the Creative Commons Attribution (CC BY) license.