


Abstract
Taiwan Bank (TB) is located in the southern Taiwan Strait (TS). The uplifted continental slope and bottom currents in this area result in the formation of upwelling areas, which serve as crucial fishing grounds. Climate-induced fluctuations in fish populations occur in the TS. However, how predation and competition affect the interspecies relationships in the TB ecosystem warrants clarification. In this study, we collected high-grid-resolution data on fishery activity (2013–2019) and constructed ecosystem models using Ecopath with Ecosim (EwE). Three mass-balanced models for determining the influence of El Niño–Southern Oscillation (ENSO) events on the TB ecosystem were constructed using EwE. A range of groups, including representative pelagic, benthic, and reef species, were collected for analyzing the relationship between migratory and sedentary species in terms of ecosystem structure variation due to climate change. The results demonstrated that the total system throughput (TST) was 10,556–11,122 t km−2 year−1, with an average transfer efficiency of 12.26%. According to the keystoneness index, calculated through mixed trophic impact analysis, Polydactylus sextarius and Scomber japonicus were the key species with top–down control and relatively high impact on the ecosystem in normal years. The keystone species also shifted to the predator fish Thunnus albacares and Katsuwonus pelamis during El Niño and La Niña events, respectively. Moreover, total biomass, TST, consumption, and respiration were noted to increase during ENSO events. However, during La Niña events, the diversity and connectance indexes were relatively low but pelagic species’ biomass was relatively high, whereas the biomass of most benthic and reef species was relatively high during El Niño events.
1. Introduction
El Niño–Southern Oscillation (ENSO), the most dynamic interannual climate phenomenon globally, significantly influences marine ecosystems by altering habitat conditions (such as oxygen levels, temperature, and light penetration), ocean currents, and food availability [1,2]. During El Niño events in the equatorial Pacific, particularly the eastern Pacific, reduced upwelling and nutrient supply lead to a decrease in phytoplankton biomass. Zooplankton and micronekton communities respond to these changes, albeit with a time lag of about 1–2 months. This bottom–up (BU) control mechanism subsequently influences the growth, reproduction, and predation of higher-trophic-level predators at the surface [1]. In the northern South China Sea, the warmer temperatures associated with El Niño events have been found to benefit small pelagic fish populations in this ecosystem [3].
ENSO events majorly affect the intensity of upwelling regions in the Taiwan Bank (TB) and change the composition of pelagic and benthic species [4,5,6]. During La Niña events, increased upwelling size in the TB region leads to decreased sea temperature and increased primary production [6,7,8]. ENSO events alter marine environments and affect organism populations through bottom–up [9,10,11,12] or top–down (TD) effects [13,14].
The Taiwan Bank is an essential high-productivity fishing ground located in the southern Taiwan Strait. Northward water flows upward along the edge of the continental shelf year-round, forming an upwelling region in the TB [15,16]. The hydrological cycling and upwelling systems in the TB not only provide a substantial nutrient supply, but also increase benthic and pelagic species richness. Regional studies on the TB have focused on the differences in the physical, chemical, and habitat characteristics of different species within the ecosystem (e.g., 4–6,16). Fishing activities influence ecosystem biodiversity, ecological relationships, and ecological processes [17]. Fishing has greatly reduced Atlantic salmon populations in the North Sea and Atlantic Ocean, impacting ecosystem processes like nutrient cycling and predator–prey dynamics through direct exploitation, bycatch, and habitat disruption [18]. Adebola and Mutsert [19] used two Ecopath models for 1985 and 2000 data from Nigerian coastal waters and observed that, as fishing intensity increased, the ecosystem became less structurally complex, as well as less productive. Studying the impact of fishing activities on ecosystems and developing ecosystem-based fisheries management strategies is crucial for achieving sustainable practices and ecosystem conservation. Ju et al. [20] used Ecopath to model the structure of the entire southern Taiwan Strait and revealed the top–down effect as the primary ecosystem control mechanism. However, no study has reported the effects of climatic events on TB’s ecosystem structure and trophic relationships.
Ecosystem food webs facilitate the transfer of nutrients and energy through predation, symbiosis, and parasitism among species, enabling continuous growth and operation [21]. Changes in primary productivity directly or indirectly affect the population of all consumers and decomposers within an ecosystem [22]. These trophic cascades, including top–down and bottom–up controls, describe interactions among biological communities and collectively influence the structure and stability of an ecosystem [23]. They also contribute to ecological balance and the maintenance of species diversity, and impact the productivity and energy flow within an ecosystem [24]. This holistic analysis of mass, energy, and nutrient cycling shows how ecosystems respond to and recover from internal and external disturbances [25,26]. Marine ecosystems face multiple pressures, such as extreme environment variation, overfishing, human pollution, and climate change [2,27]. Modeling marine food webs has shown great potential for investigating changes due to environmental variability and climate change [28,29].
The highly intricate nature of ecosystems makes them challenging to comprehensively analyze. Jørgensen (1992) [30] emphasizes the need for a holistic research approach to effectively describe ecosystem characteristics. Ecological models, such as Ecopath with Ecosim (EwE), are crucial for developing multispecies ecosystem structures and identifying ecological indicators for marine conservation and sustainable management [31,32,33,34]. These models consider the dynamics of commercial and noncommercial species, including their interactions and the main drivers of exploited marine ecosystems [33,34].
Constructing a comprehensive food web is often the initial step in ecosystem studies. Food web modeling, a mathematical approach, imposes minimal constraints on time and spatial scales and is cost-effective compared to other research methods [1,35]. EwE software (version 6.6.8) facilitates the construction, parameterization, and analysis of mass-balanced trophic models of aquatic and terrestrial ecosystems [36]. Ecopath provides a mass-balanced snapshot of an ecosystem, and is widely used to assess marine ecosystem structures and fisheries’ impacts [20,34,36,37].
Models quantify the biomass of living and non-living components within an ecosystem and their energy flows, simplifying the complexities to provide a summarized description of an ecosystem’s nature. They also predict ecosystem changes following disturbances [1,38]. Network analysis further enhances our understanding of energy flow direction and magnitude within ecosystems and the efficiency of energy transfer among different groups of organisms. In mass-balanced models, fisheries data can be integrated to comprehensively understand interspecific interactions, habitat dynamics, and impacts on the physical environment [39,40].
In the present study, we collected high-resolution data on fisheries activity in the TB region and constructed mass-balanced models using EwE to analyze the influence of ENSO events on the TB ecosystem. We think ENSO will cause changes in the ecosystem structure, with each species having a different level of impact on other species within the ecosystem. Developing a holistic ecosystem management system is essential to mitigate the impact of environmental changes on marine ecosystems in TB. Such management systems should consider not only the dynamics of target species, but also nontarget organisms, trophic relationships and energy flows, and environmental factors [34,41]. The current results may be valuable for evaluating the impacts of stressors on the structure and function of various marine ecosystems.
2. Materials and Methods
2.1. The Study Area
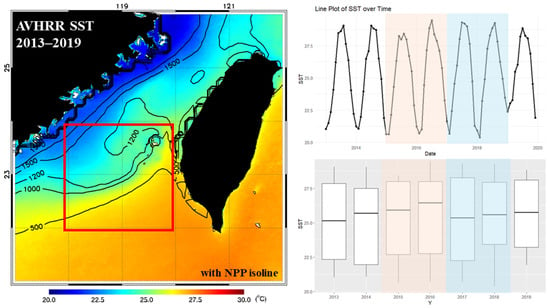
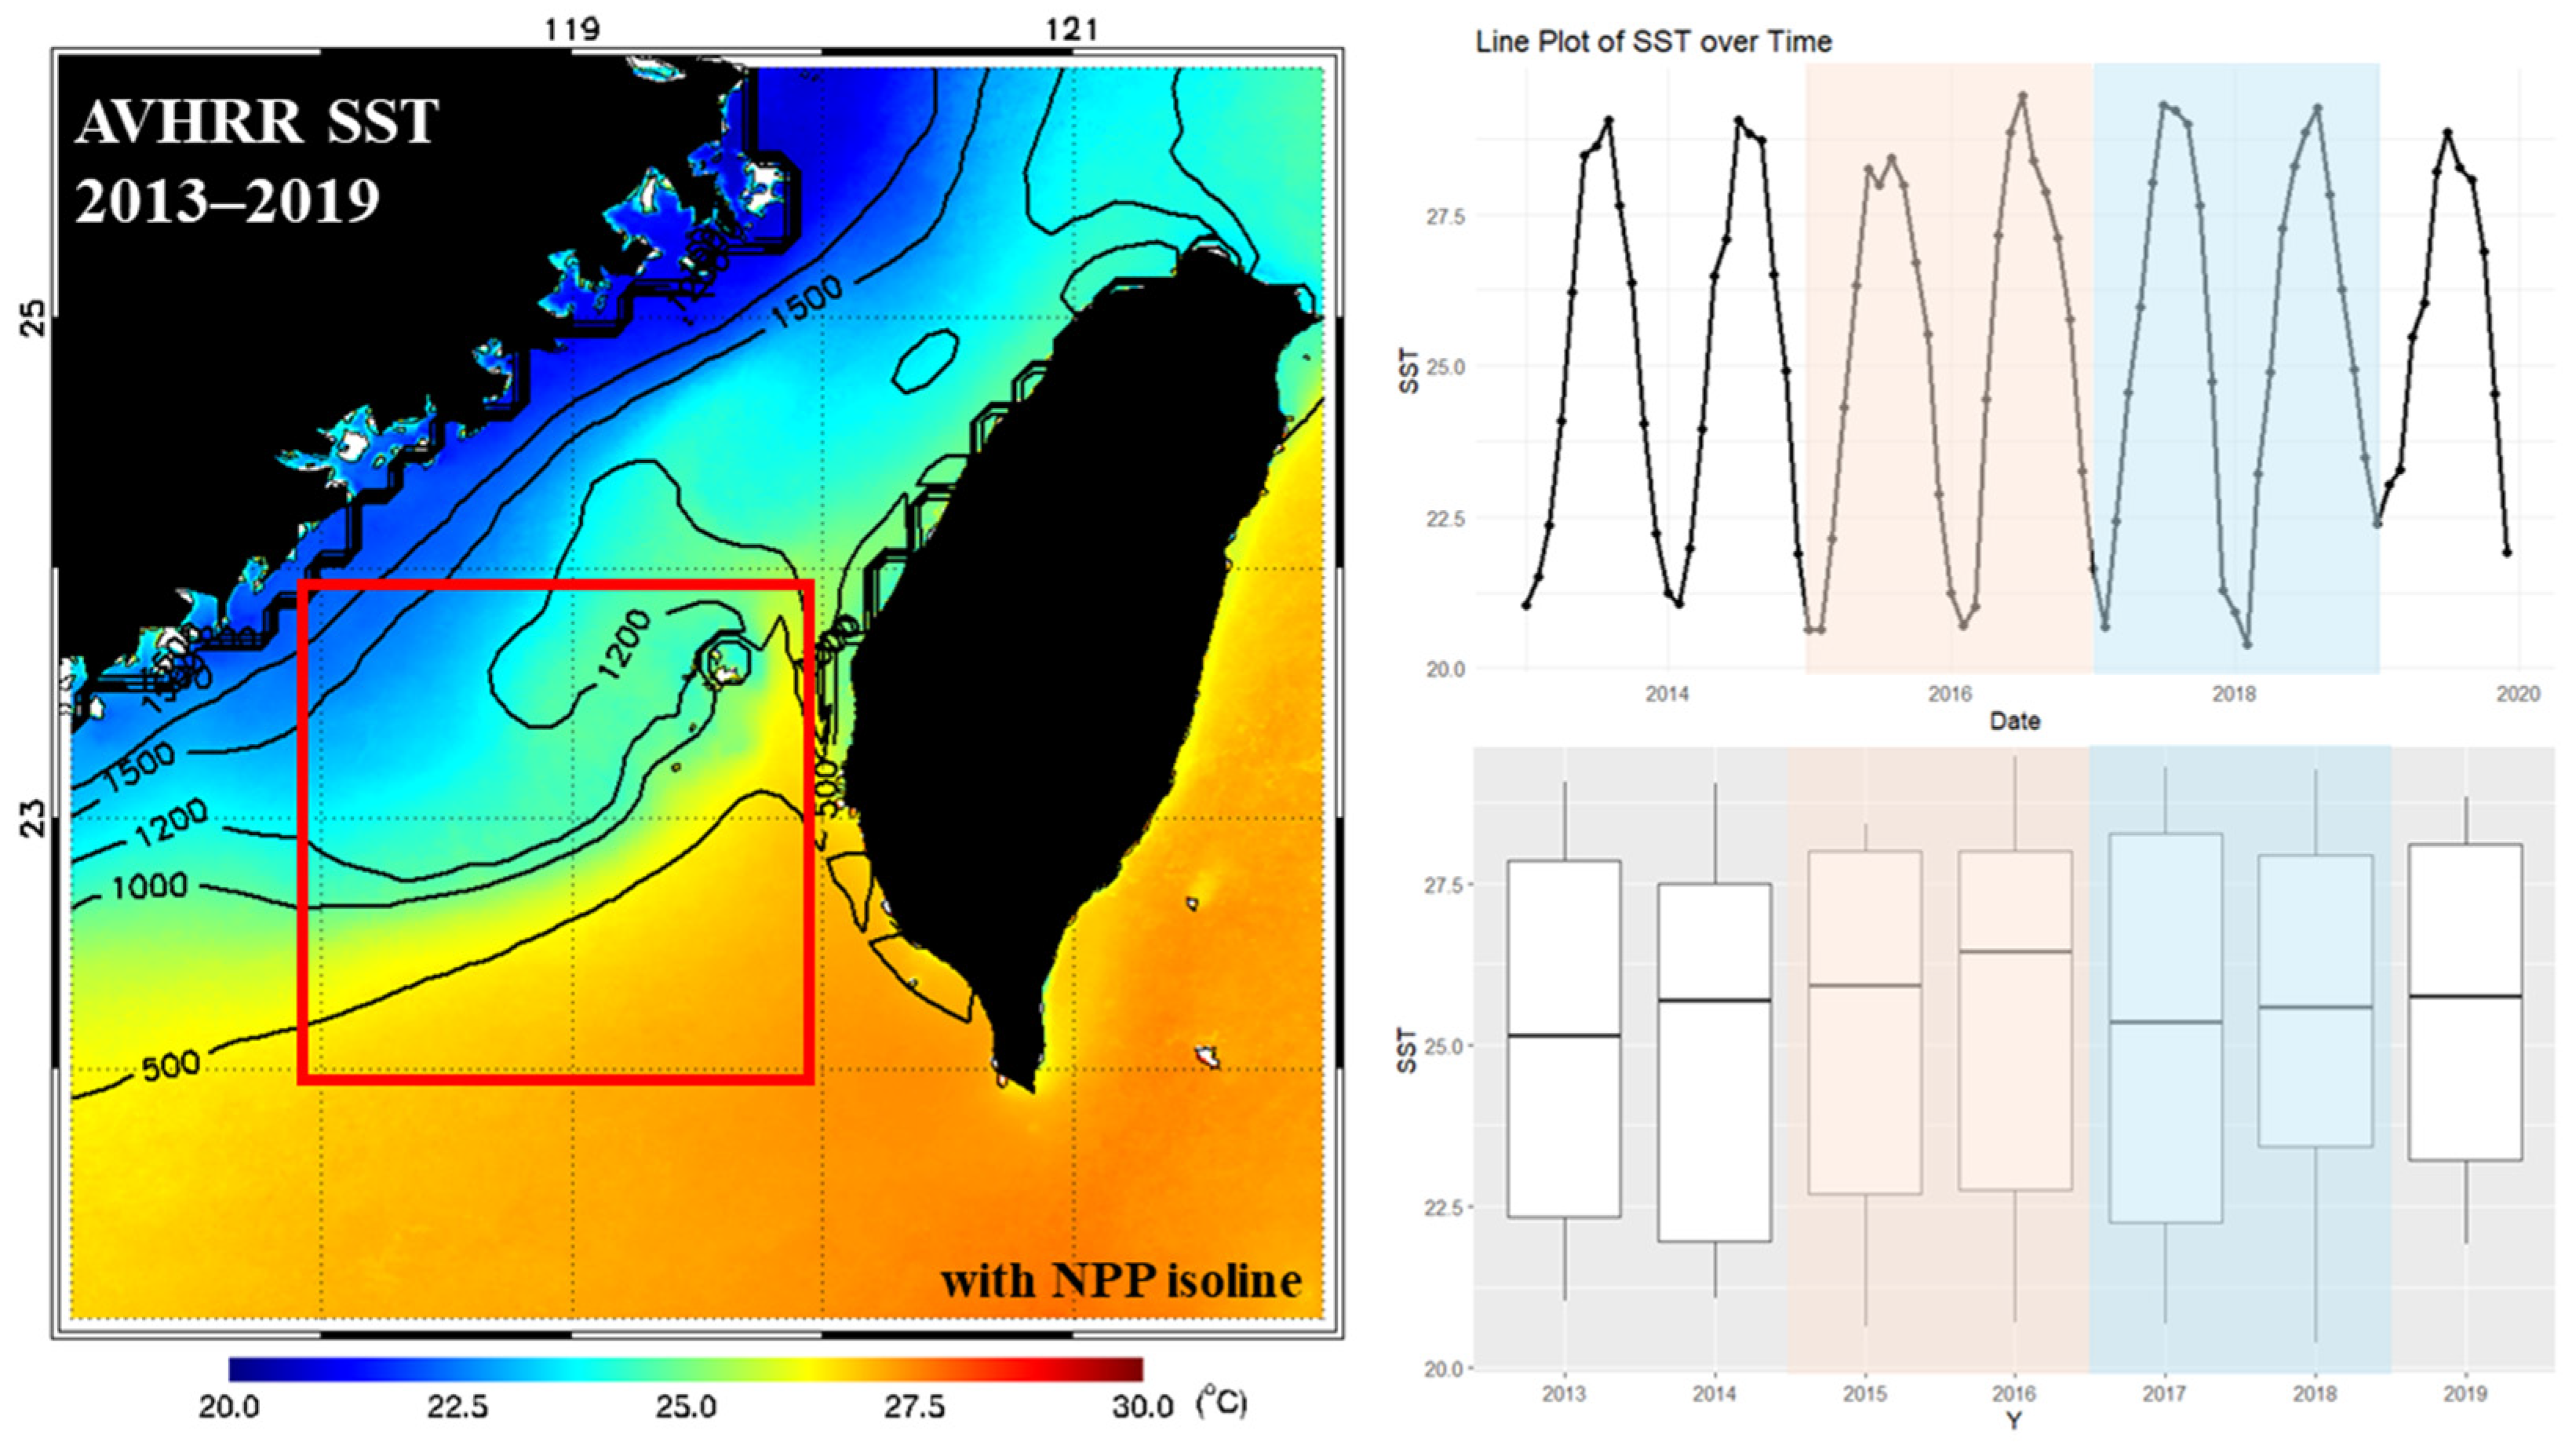
Sea-surface temperature (SST) is relatively high in the southern TB region, but in the northern region, cold northern China coastal currents and continental upwelling reduce the SST and bring nutrients, increasing net primary productivity (NPP; Figure 1).
Figure 1.
SST (contour) and NPP (isoline) distribution in the TB ecosystem (red frame) from 2013 to 2019: El Niño/La Niña period shows in orange/blue color.
Oceanographic studies have indicated that upwelling and thermal fronts have a considerable impact on biogeochemical processes and ecosystem structure [4,6]. Moreover, fishing methods and fishery resource structures are complex and vary considerably in TB. Also, TB is characterized by a large diversity of coral and reef species, and the currents and water depth create a suitable habitat for migratory species [4,6]. Ecosystem structure and function in the Taiwan Strait have been altered due to changes in multiple climate-related and anthropogenic drivers [6,42,43].
2.2. Data Collection and EwE Modeling
In the study area, the most prominent (>75%) fishing methods involve the use of Taiwanese seines and trawls. Considering the top 30 species in the area, based on daily high-grid-resolution observer-recorded fisheries data and commercially crucial species from previous research, we included 28 groups in our TB ecosystem model. Moreover, phytoplankton were included as major producers, whereas zooplankton were considered the major consumers. According to life history strategies and the behavioral features of reproductive biology based on the FishBase database (http://www.fishbase.org) [44], the groups were classified further into pelagic and benthic (including reef, demersal, and benthopelagic species).
Our trophic model was constructed using EwE (version 6.6.8) [45], and the energy production and consumption for each species was estimated. Equations (1) and (2) present the mass-balanced Ecopath model:
where i is a group species, j is the predator, (P/B) is the production-to-biomass ratio, B is the biomass (i.e., wet weight in t km−2), Y is the total catch, (Q/B) is the consumption-to-biomass ratio, DCji is the proportion of i in the diet of j, E is the net migration rate (emigration − immigration), BA is the biomass accumulation rate, EEi is the ecotrophic efficiency [i.e., the proportion of production or total mortality (where P/B = Z) that is actually explained in the model], and (1 − EEi) is the proportion of unexplained production (i.e., mortality due to reasons other than predation and fishing). These relationships are fundamentally derived from the concept that production equals consumption [46].
where Qi, Pi, Ri, and GSi × Qi are the consumption, production, respiration, and unassimilated food of the group species i, respectively. This equation reflects the fundamental ecological principle that total energy intake (consumption) is partitioned into production, respiration, and the energy lost as unassimilated food.
To analyze the effects of ENSO events on the TB ecosystem, three Ecopath models for normal years (2013, 2014, 2019), El Niño events (2015–2016), and La Niña events (2017–2018) were developed at 118° E–120° E, 22° N–24° N (Figure 1, red frame), and we assumed the net migration rate was 0.
2.3. Ecosystem Attributes
The input data sources and citations for P/B, Q/B, and DC are listed in Table 1 and Table 2, and Table A1, Table A2 and Table A3. The biomass density estimates for fish, cephalopods, and crustaceans were obtained from daily high-grid-resolution observer-recorded fisheries data and by using the following transform formula:
where Ci is the fishery catch in group i, Gi is the occurrence area in group i, Di is the number of fishing trips in group i, F is fishing mortality, and B is wet weight (in t km−2). The biomass estimate is derived from the equation B = Y/F [47], as proposed by Ullah et al. [48], where Y is the annual average yield of each group and F is the fishing mortality coefficient.
The diet of each fish compartment was used as a weighted average of the diet composition of different species within each compartment (Table A1, Table A2 and Table A3). For TB fish without available diet information, data were obtained from FishBase [44]. Fishing data constitute a fraction of the ecosystem, and are calculated in tones per kilometer2 per year. Zooplankton biomass was estimated via trawl survey data with an ORI plankton net from a government research unit (Fisheries Research Institute, Ministry of Agriculture) and converted from m−3 to m−2 by multiplying by mean depth (100 m).
Phytoplankton biomass was estimated using chlorophyll-a volume concentrations (mg m−3) determined by a Moderate-Resolution Imaging Spectroradiometer aboard the Aqua Satellite (MODIS Aqua). First, these were converted to surface concentrations (mg m−2) based on the methods of [49]. The surface chlorophyll-a concentrations were multiplied by a conversation factor of 400 to convert these values to wet weight (mg m−2), as described in Link et al. [50] and Watari et al. [37].
Table 1.
Groups and input resources. Biomass of detritus from Ye et al. [51]; grey highlight represents the Benthic groups.
Table 2.
Basic parameters of three Ecopath models (normal; El Niño; and La Niña).
2.4. Model Balancing and Verification
Because DC is more uncertain than other parameters, the DC of each group was used as the main adjustment parameter in the model-balancing process. The rationality of the model was judged by examining the EE of each group. The gross food conversion efficiency was expected to correspond to P/Q. First, because the basic assumption of the model is that the system is in a steady state with constant biomass during the study period, the EE of each group must not be >1; in other words, the amount of each group consumed in the ecosystem (feeding and catching) must not exceed the amount of production [36].
Most groups have a P/Q between 0.05 and 0.3 [45]. Top predators have a lower P/Q, whereas smaller species have a higher P/Q; for instance, crustaceans have a P/Q ≤ 0.5 [56]. The respiration of the groups was also examined for positive values and for whether P/Q was lower than the net transfer efficiency (production/assimilated) to ensure the rationality of the model [36,57].
2.5. Ecosystem Assessment and Statistical Analysis
2.5.1. Basic Ecosystem Indices
Total trophic flow comprises respiration, consumption, flow to detritus, export, and import. The total system throughput (TST), defined as the sum of the flows, is an indirect indicator of ecosystem size [58]. Lindeman [21] provided a means for estimating the flows and biomass transferred through trophic levels (TLs) and for calculating the transfer efficiency. A TL is defined as the position of a group within the food web. Transfer efficiency is defined as the ratio of the production of each TL passed on to the next TL.
Several indices and indicators represent ecosystem structure, function, development, and maturity, and can be derived using EwE based on trophic energy transfer pathways [35,45]. The Shannon diversity index represents the biodiversity of species in a community. The system omnivory index (SOI) and connectance index (CI) reflect the complexity of inner linkages within an ecosystem [36]. Finn’s cycling index (FCI)—calculated as recycled total flow divided by TST—quantifies the relative importance of cycling to TST and reflects stress and structural differences [59].
2.5.2. Mixed Trophic Impact Analysis
Mixed trophic impact (MTI) analysis was used to quantify the negative or positive effects that an increase in a group’s biomass had on the other groups in the ecosystem, as follows:
where εi is the overall effect for the groups from the ecological model and mij denotes the relative impact of a slight increase in group i’s biomass on the biomass of impacted group j, which could be positive (if the impacted group’s biomass increases) or negative (if the impacted group’s biomass decreases) [60].
The MTI routine depicts the relative impact measurement (direct or indirect) between the groups and is based on a sensitivity analysis [61]. The impacts are relative but comparable, and they were calculated with values ranging from −1 to 1. Two types of value were calculated: a positive value when two groups mutually benefited from each other and a negative value when two groups did not mutually benefit from each other. The groups with lower TL components (detritus, zooplankton, and phytoplankton) demonstrated a strong positive impact on the other groups [62].
2.5.3. Keystoneness Index
Keystone species are species with a relatively low biomass that take on a structuring role in the ecosystem and its food webs [55]. Keystone species can be identified by plotting the relative overall effect (εi) against the keystoneness index (KSi) [60]. Mean trophic efficiency describes the effectiveness of energy transfer between TLs. Trophic interactions within the food web were analyzed through MTI analysis to obtain trophic impact (ɛi) and relative biomass (pi), and thus estimate KSi:
where pi is the contribution of group i to the total biomass of the food web.
where B is the biomass of group i.
2.5.4. Top–Down and Bottom–Up Effects
TD and BU effects can be estimated using the negative and positive elements in the MTI matrix, respectively [60]. The TD effect of group i was estimated as having a negative contribution to the overall effect, and BU = 1 − TD [60]. The TD effect can be calculated as follows:
where mij is the element of the MTI matrix that represents the relative impact of the impacting group i on the impacted group j.
3. Results
3.1. TB Marine Ecosystem
In total, 28 groups were selected and balanced in the three Ecopath models: normal years, El Niño events, and La Niña events (Table A4, Table A5 and Table A6). The TST was 10,556.3 t km−2 year−1, and energy transfer efficiency from the first TL to the next TL up was 12.26% in normal years (Table 3). In terms of ecosystem structure, the total number and mean length of the pathways were 2108 and 7.757, respectively. The SOI, Shannon diversity index, and CI values were 0.247, 2.313, and 0.269, respectively; the maximum TL was 3.75 for skipjack tuna, and the mean TL of catch was 2.73.
Table 3.
Summary of TB Ecopath model—statistics and attributes. Grey highlights the highest value of the three models.
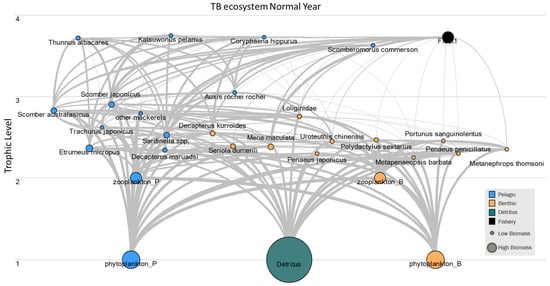
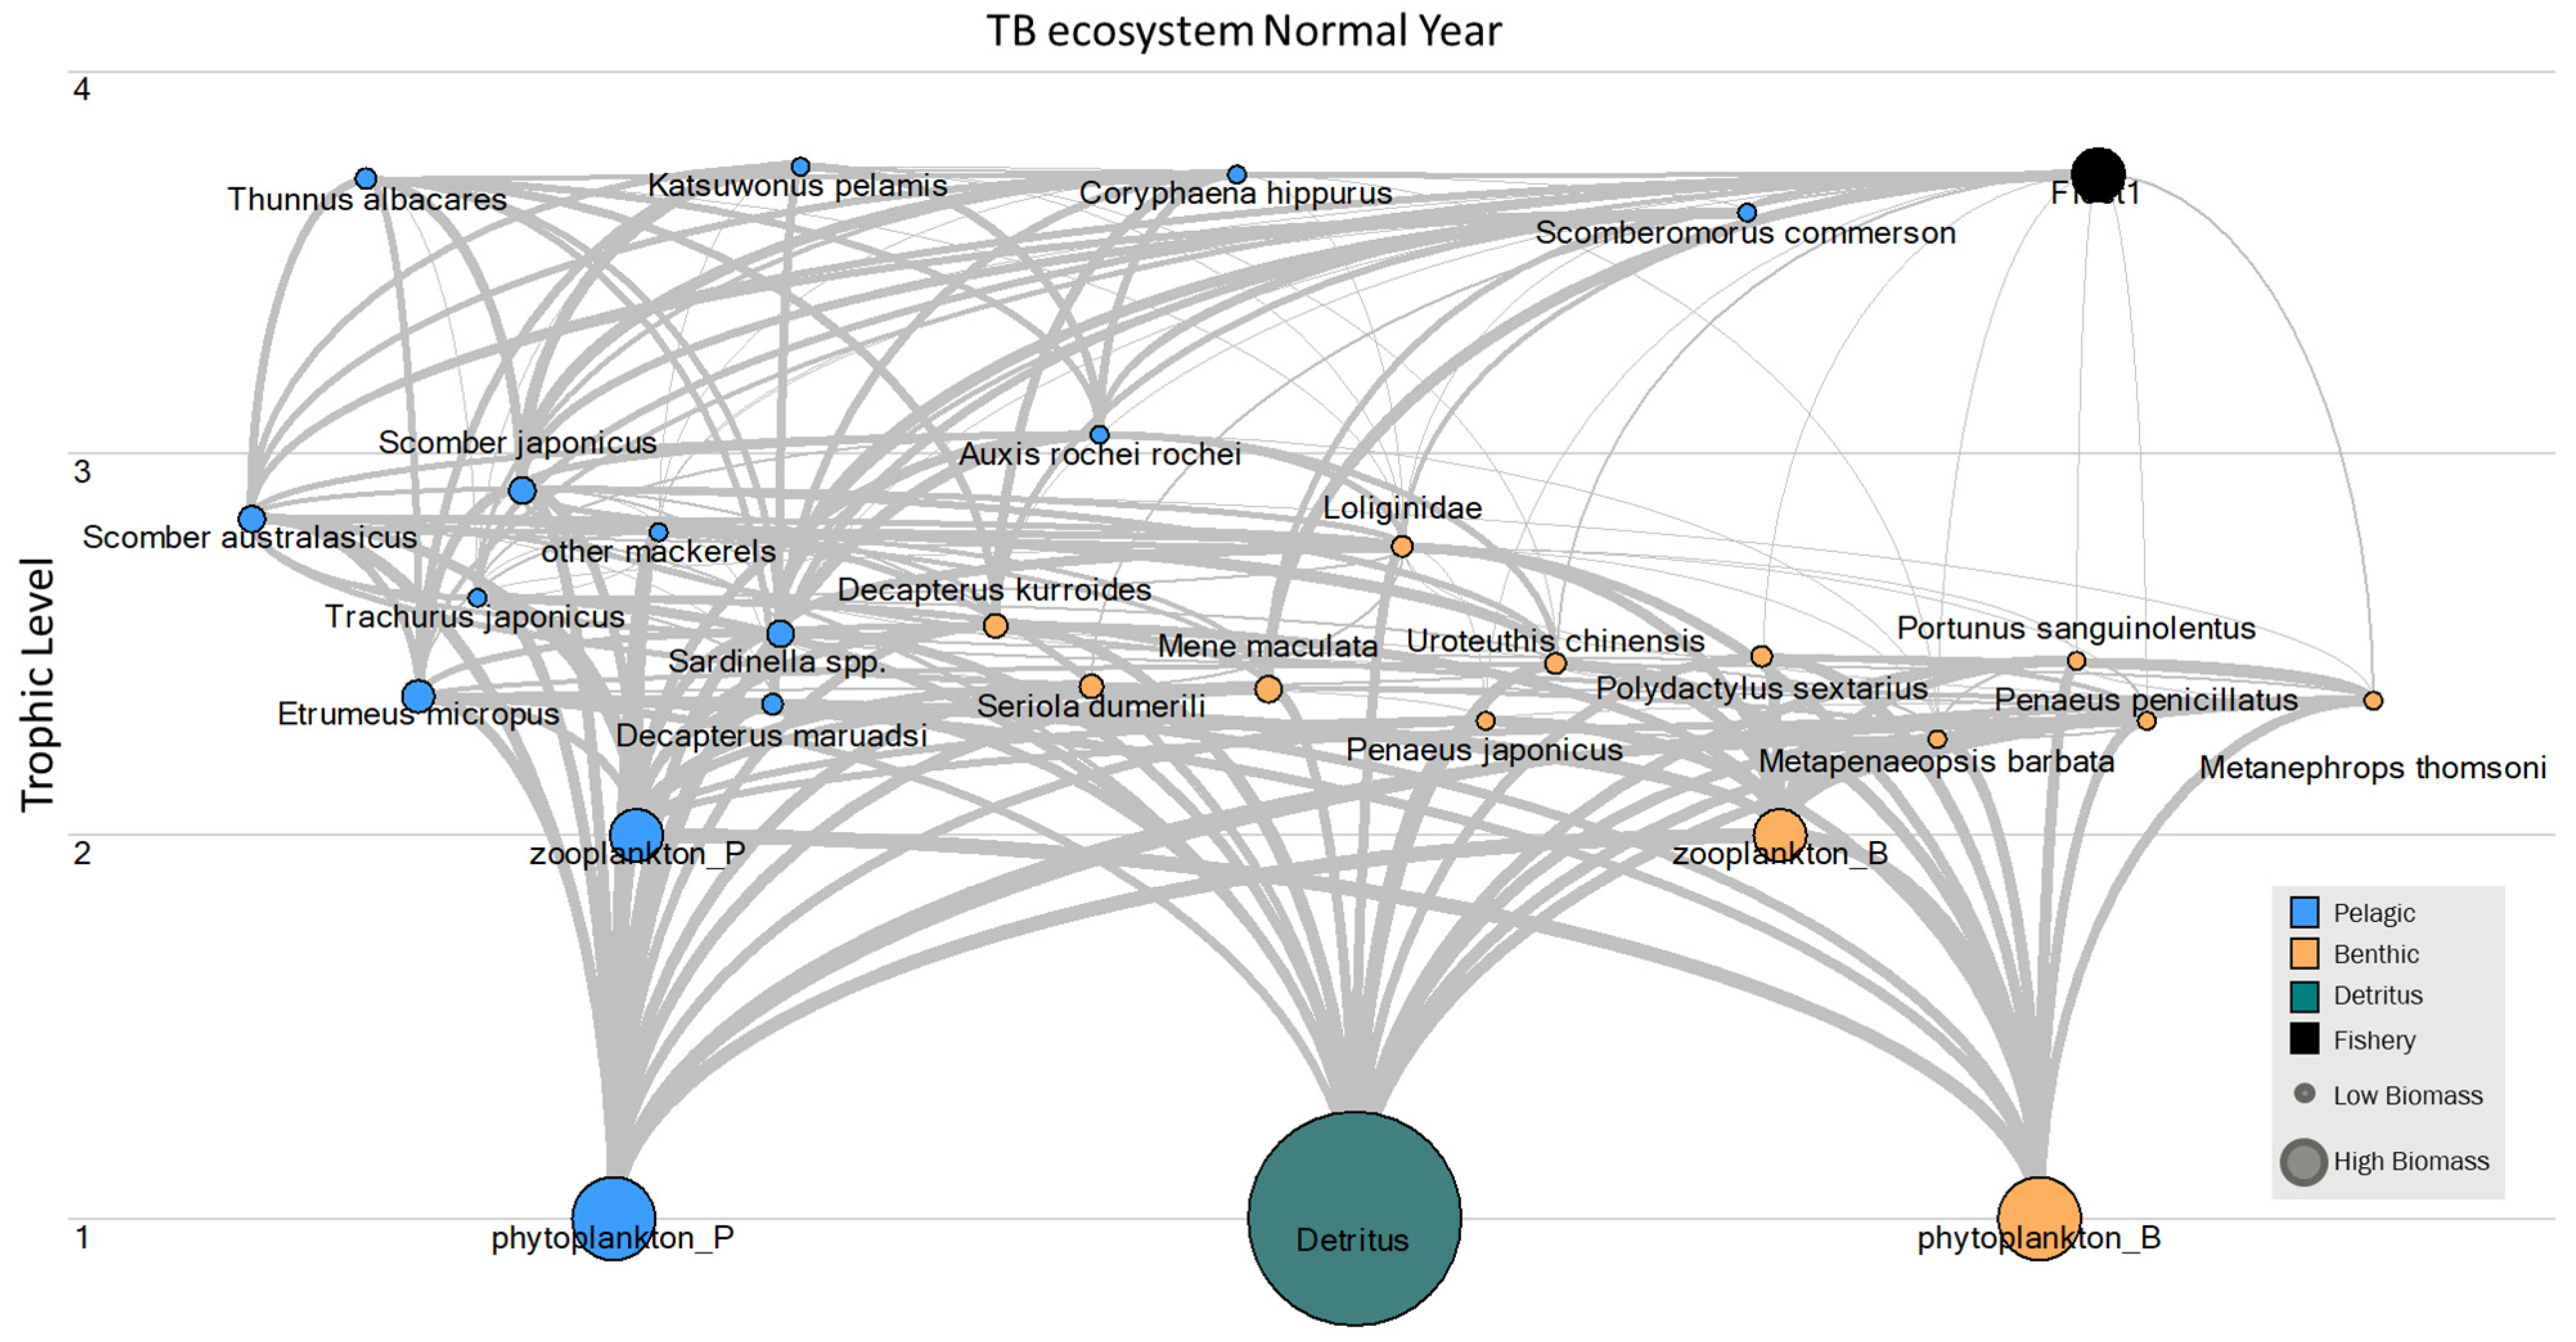
The mass-balanced diagrams of the food web components and energy flows revealed that the biomass of pelagic species, particularly pelagic and small pelagic fish, was higher than that of the other group species (Figure 2 and Table 2).
Figure 2.
Trophic relationships between groups in the TB ecosystem in normal years. Circle size denotes biomass volume of each group.
Among the benthic and reef group, benthic and reef fish had a higher biomass than cephalopods and crustaceans did. The groups were mainly in TL 2 and TL 3, with 36% TST (Figure A1). The top predators (TL 4) in the TB ecosystem were Thunnus albacares, Katsuwonus pelamis, Coryphaena hippurus, and Scomberomorus commerson, which had low EE values (Figure 2 and Table A4). However, commercial species such as mackerel and Mene maculata, and prey species, including shrimps and crabs, had high EE values.
Regarding consumption and respiration, total consumption was 3853.056, total export was 2091.311, total respiration was 2489.028, total flow into detritus was 2122.888, and FCI value was 0.152% of the throughput (Table 3).
3.2. Interspecies Relationships
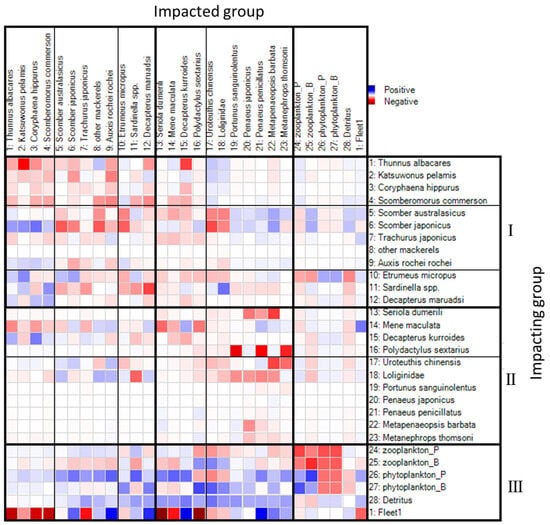
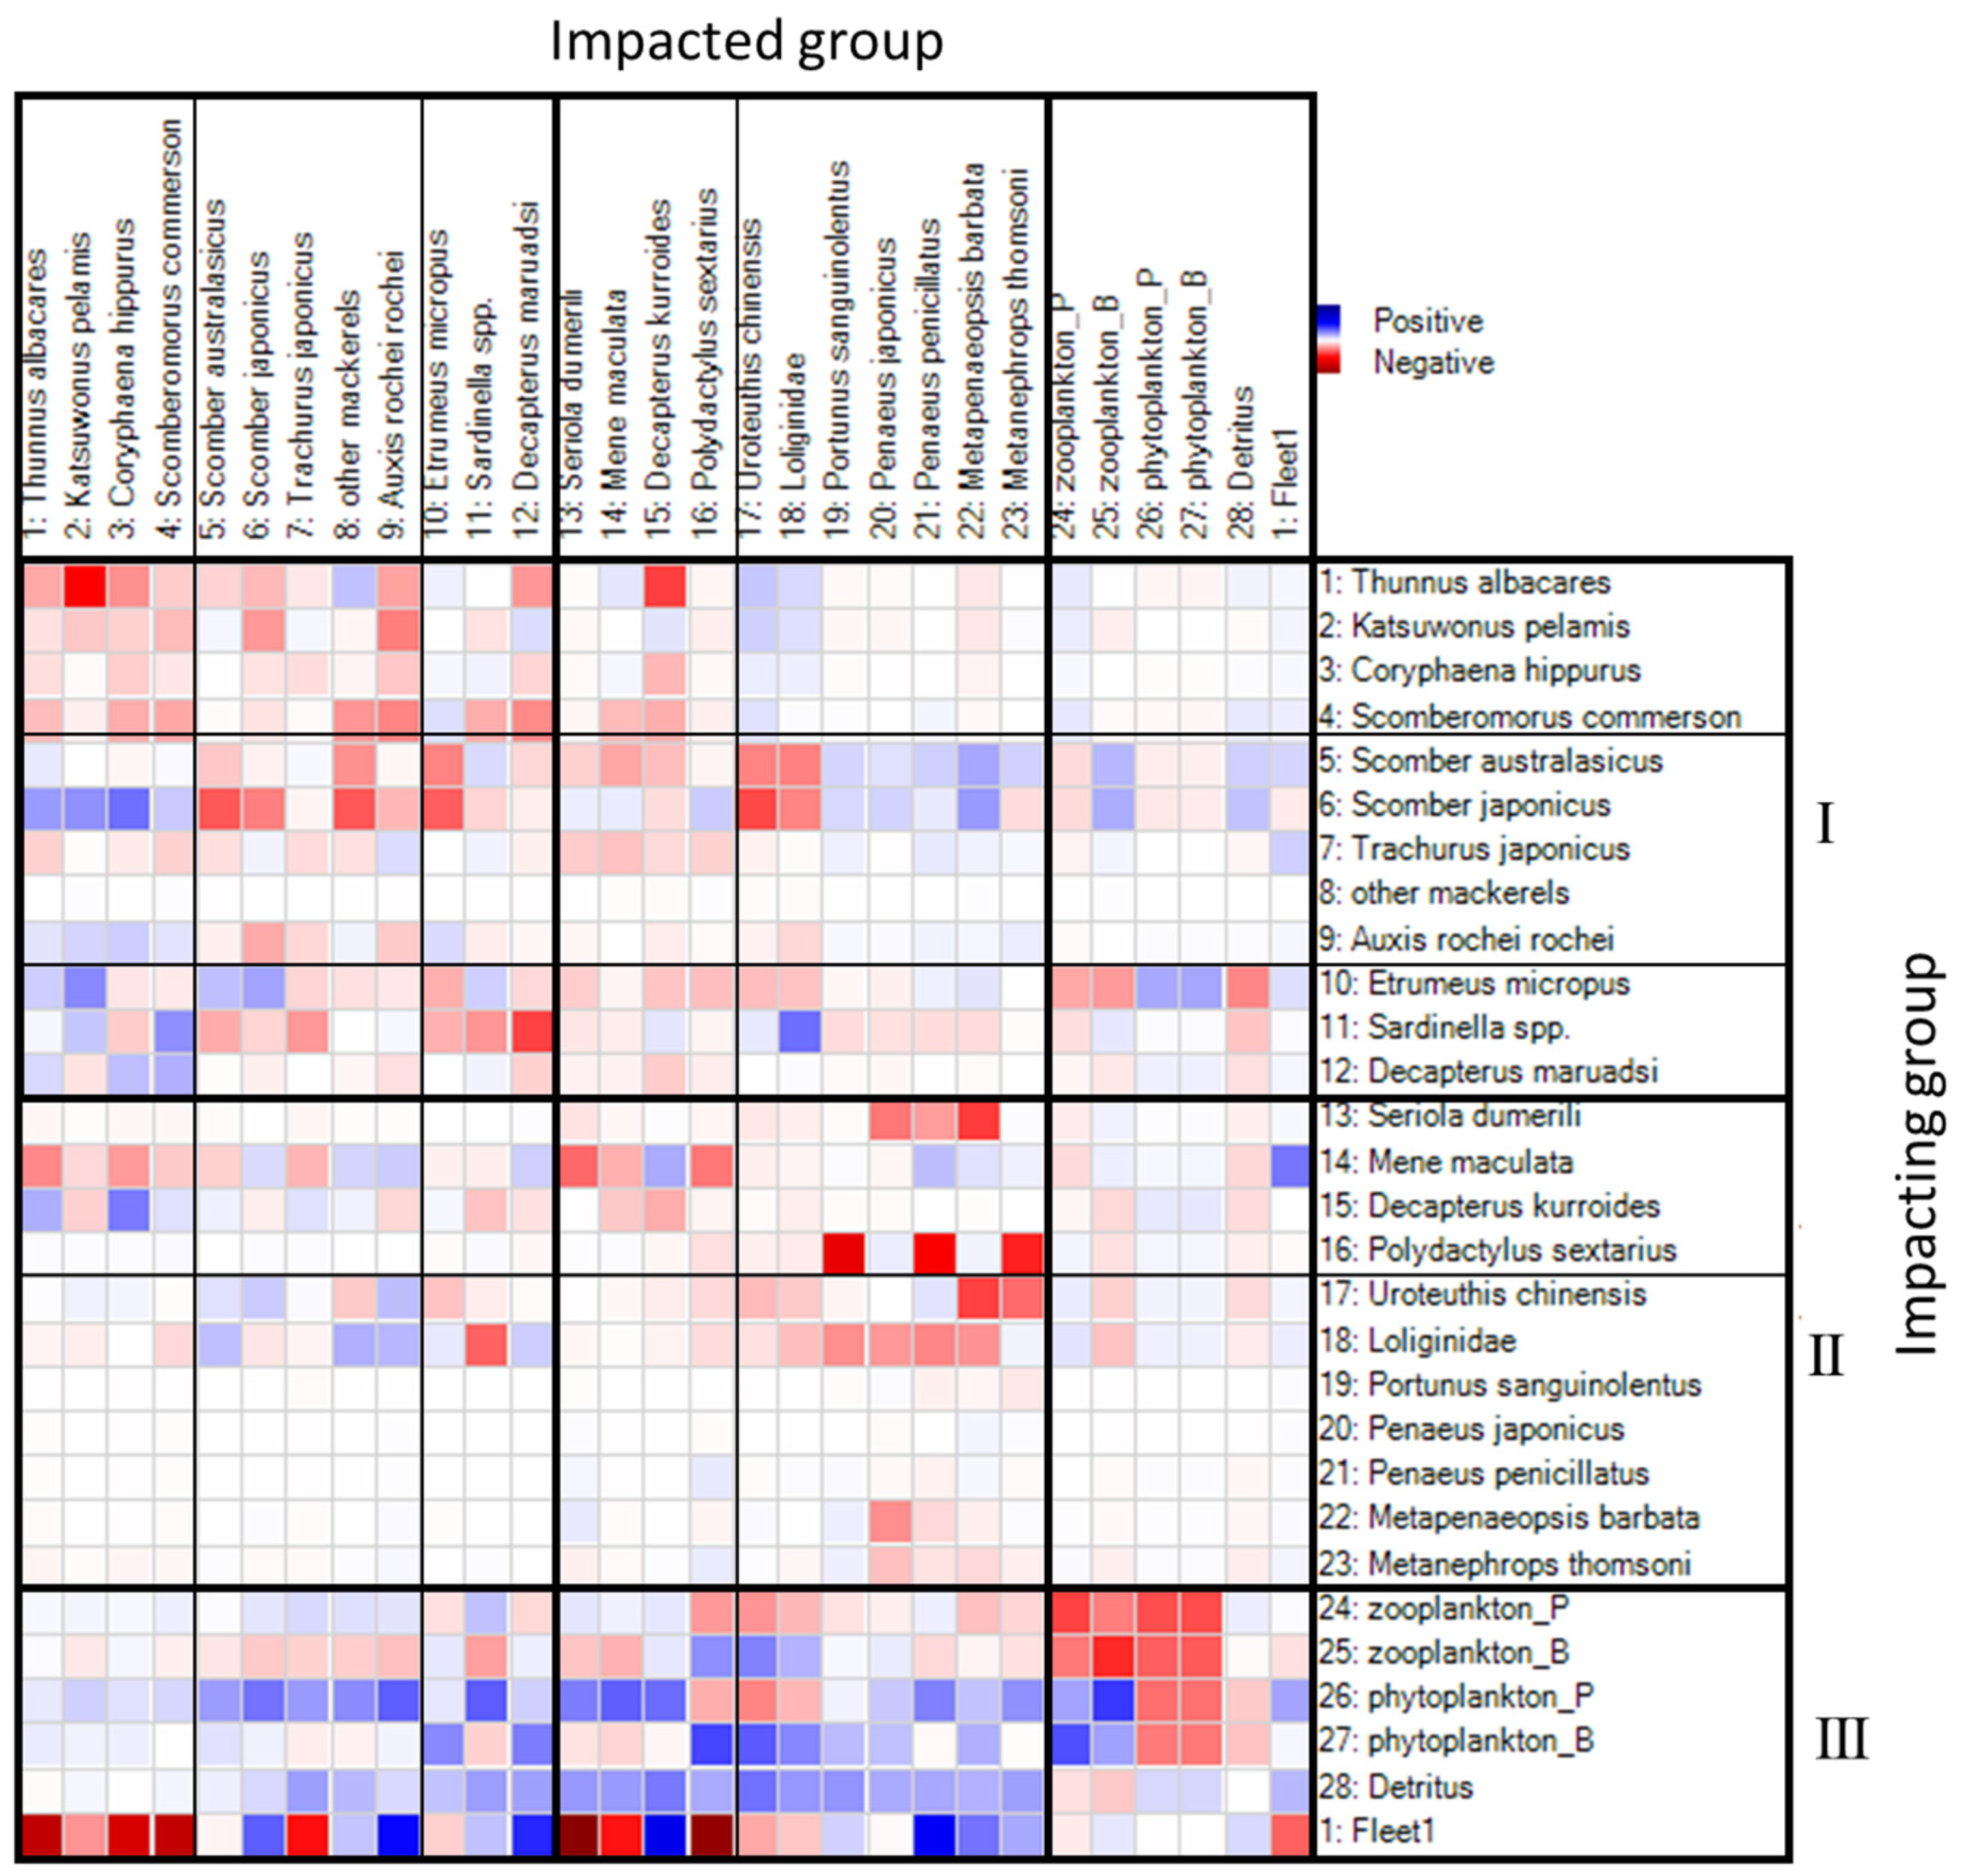
The interspecies relationships between groups in the TB ecosystem revealed that the MTI of pelagic species was considerably higher (Figure 3, area I) than that of benthic and reef species (Figure 3, area II); pelagic species also had mostly negative impacts due to their role as the top–down controllers of predation. However, the predator fish C. hippurus had a lower influence than T. albacares and K. pelamis did. The pelagic fish were mainly positively influenced by plankton and cephalopods but negatively influenced by predator fish, other pelagic species, and benthic species. Small pelagic fish generally had a negative impact on benthic species.
Figure 3.
MTI relationships between groups and fisheries in the TB ecosystem. Positive (blue) and negative (red) values indicate positive and negative impacts, respectively; the colors cannot be interpreted in an absolute sense because the impact is relative but comparable between groups.
Most benthic species had a relatively low and negative impact, and they were mainly influenced by other benthic species (Figure 3, area II). However, benthic–pelagic coupling mainly occurred for the four benthic groups of Uroteuthis chinensis, Loliginidae, M. maculata, and Decapterus kurroides, with a high impact on both pelagic and other benthic species (Figure 3, groups 14–15, 17–18). Crustaceans (Figure 3, groups 19–23) had a low impact on the TB ecosystem, whereas fishing had a direct negative impact on commercial and target species. Moreover, all group species had a negative impact on themselves and their prey because of intraspecific competition and predation, respectively.
Zooplankton and phytoplankton had the largest positive impact on the ecosystem due to their role as bottom–up providers of prey (Figure 3, area III).
Fishing negatively affected most benthic species and all predators, but it positively affected pelagic fish and small pelagic fish. The overall TD and BU values were 0.699 and 0.301, respectively (Table 4), indicating that top–down control has a relatively high impact on the TB ecosystem.
Table 4.
Control effects in TB ecosystem model (TD, top–down effect; BU, bottom–up effect). Grey highlight represents Benthic groups.
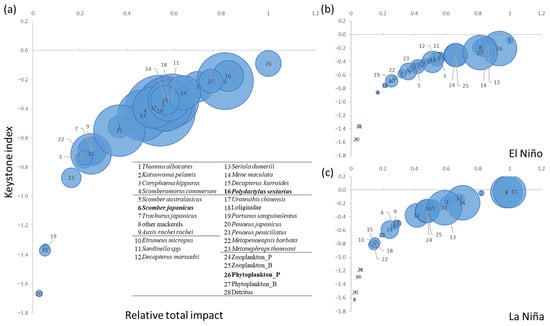
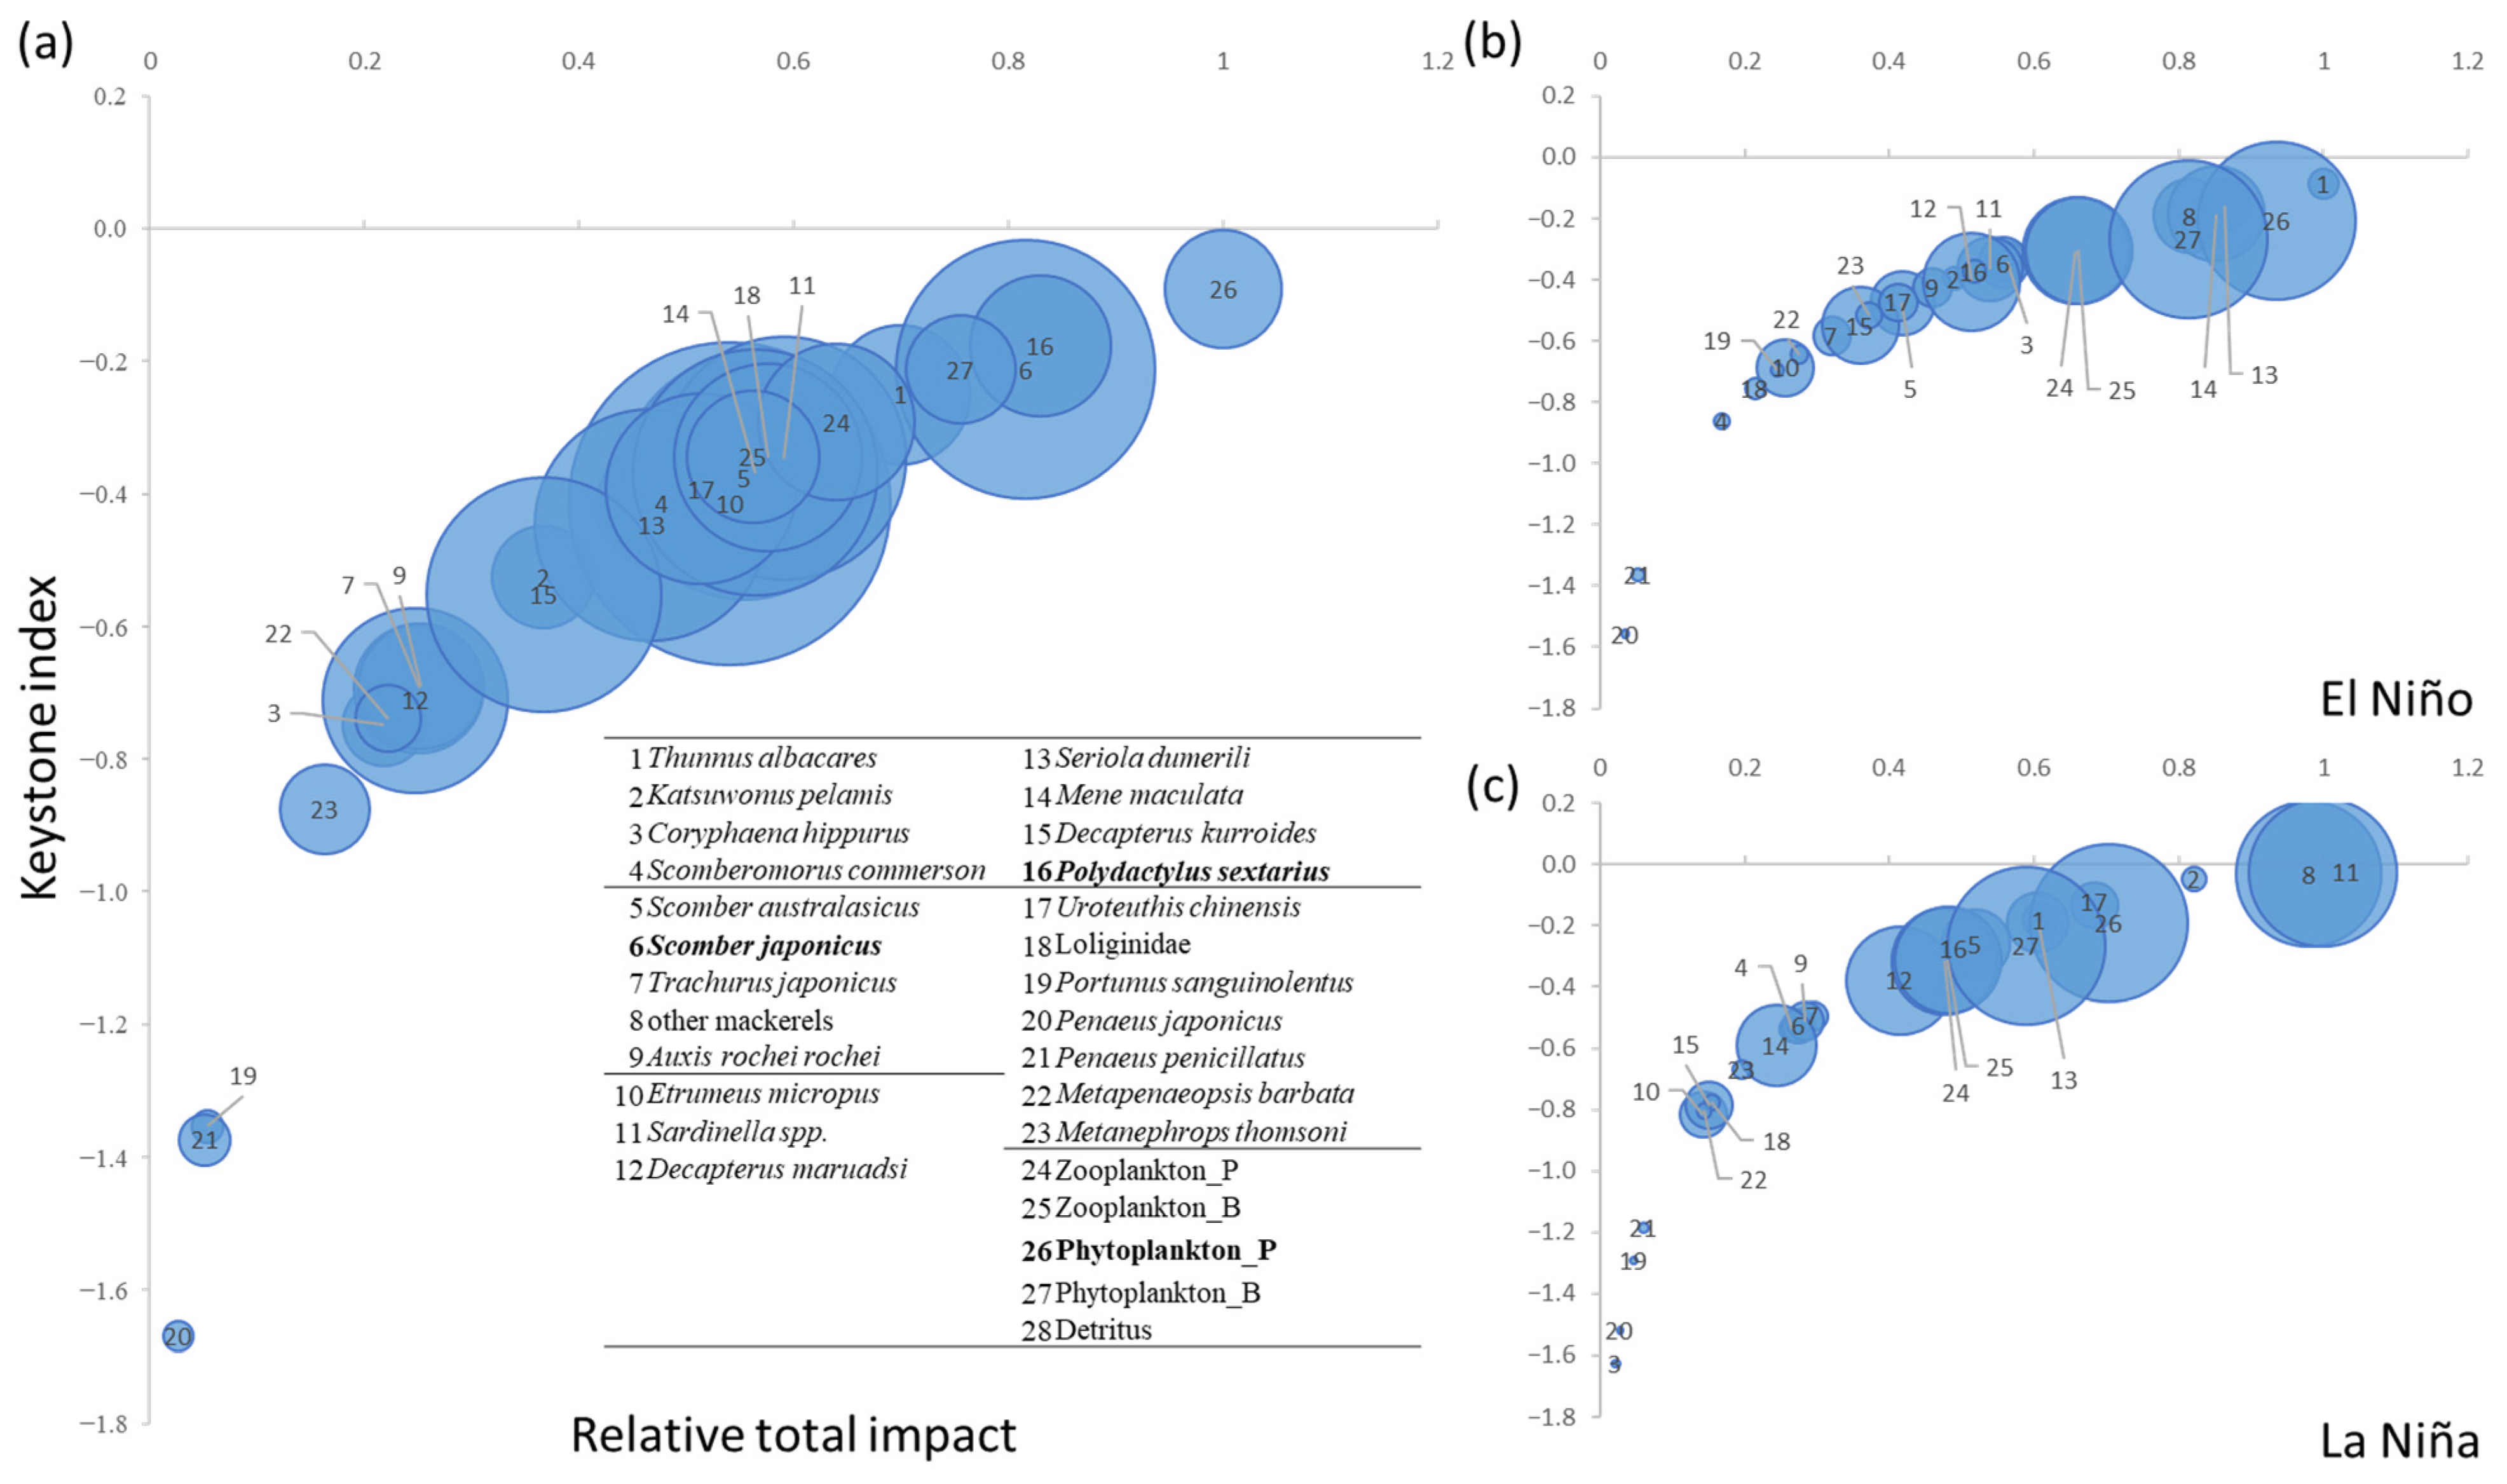
Based on their KSi and relative total impact, Polydactylus sextarius, Scomber japonicus, and pelagic phytoplankton were the top-three potential keystone species (Figure 4).
Figure 4.
KSi and relative total impact on the groups from the TB ecosystem model during (a) normal years, (b) El Niño events, and (c) La Niña events. Top-3 species with high KSi shown in bold.
3.3. Climate-Induced Species Variation in TB Ecosystem
During El Niño events, the ecosystem structure, transfer efficiency, and fishing trophic levels were smaller than in normal years and during La Niña events (Table 3). However, TST, consumption, respiration, and transfer efficiency were higher in both El Niño and La Niña events, with the highest values during La Niña events. Moreover, during La Niña events, the biomass of most pelagic and small pelagic fish was higher than that of other species.
The pelagic and small pelagic fish that demonstrated a relatively high biomass in La Niña events included Scomber australasicus, S. japonicus, other mackerels, Etrumeus micropus, Sardinella spp., and Decapterus maruadsi. By contrast, the biomass of almost all benthic and reef species (including cephalopods and crustaceans) was relatively high during El Niño events but relatively low during La Niña events, especially for M. maculata and D. kurroides (Table 2). During El Niño events, the Shannon diversity index was relatively high but the SOI, CI, catch TL, and TST were relatively low (Table 3).
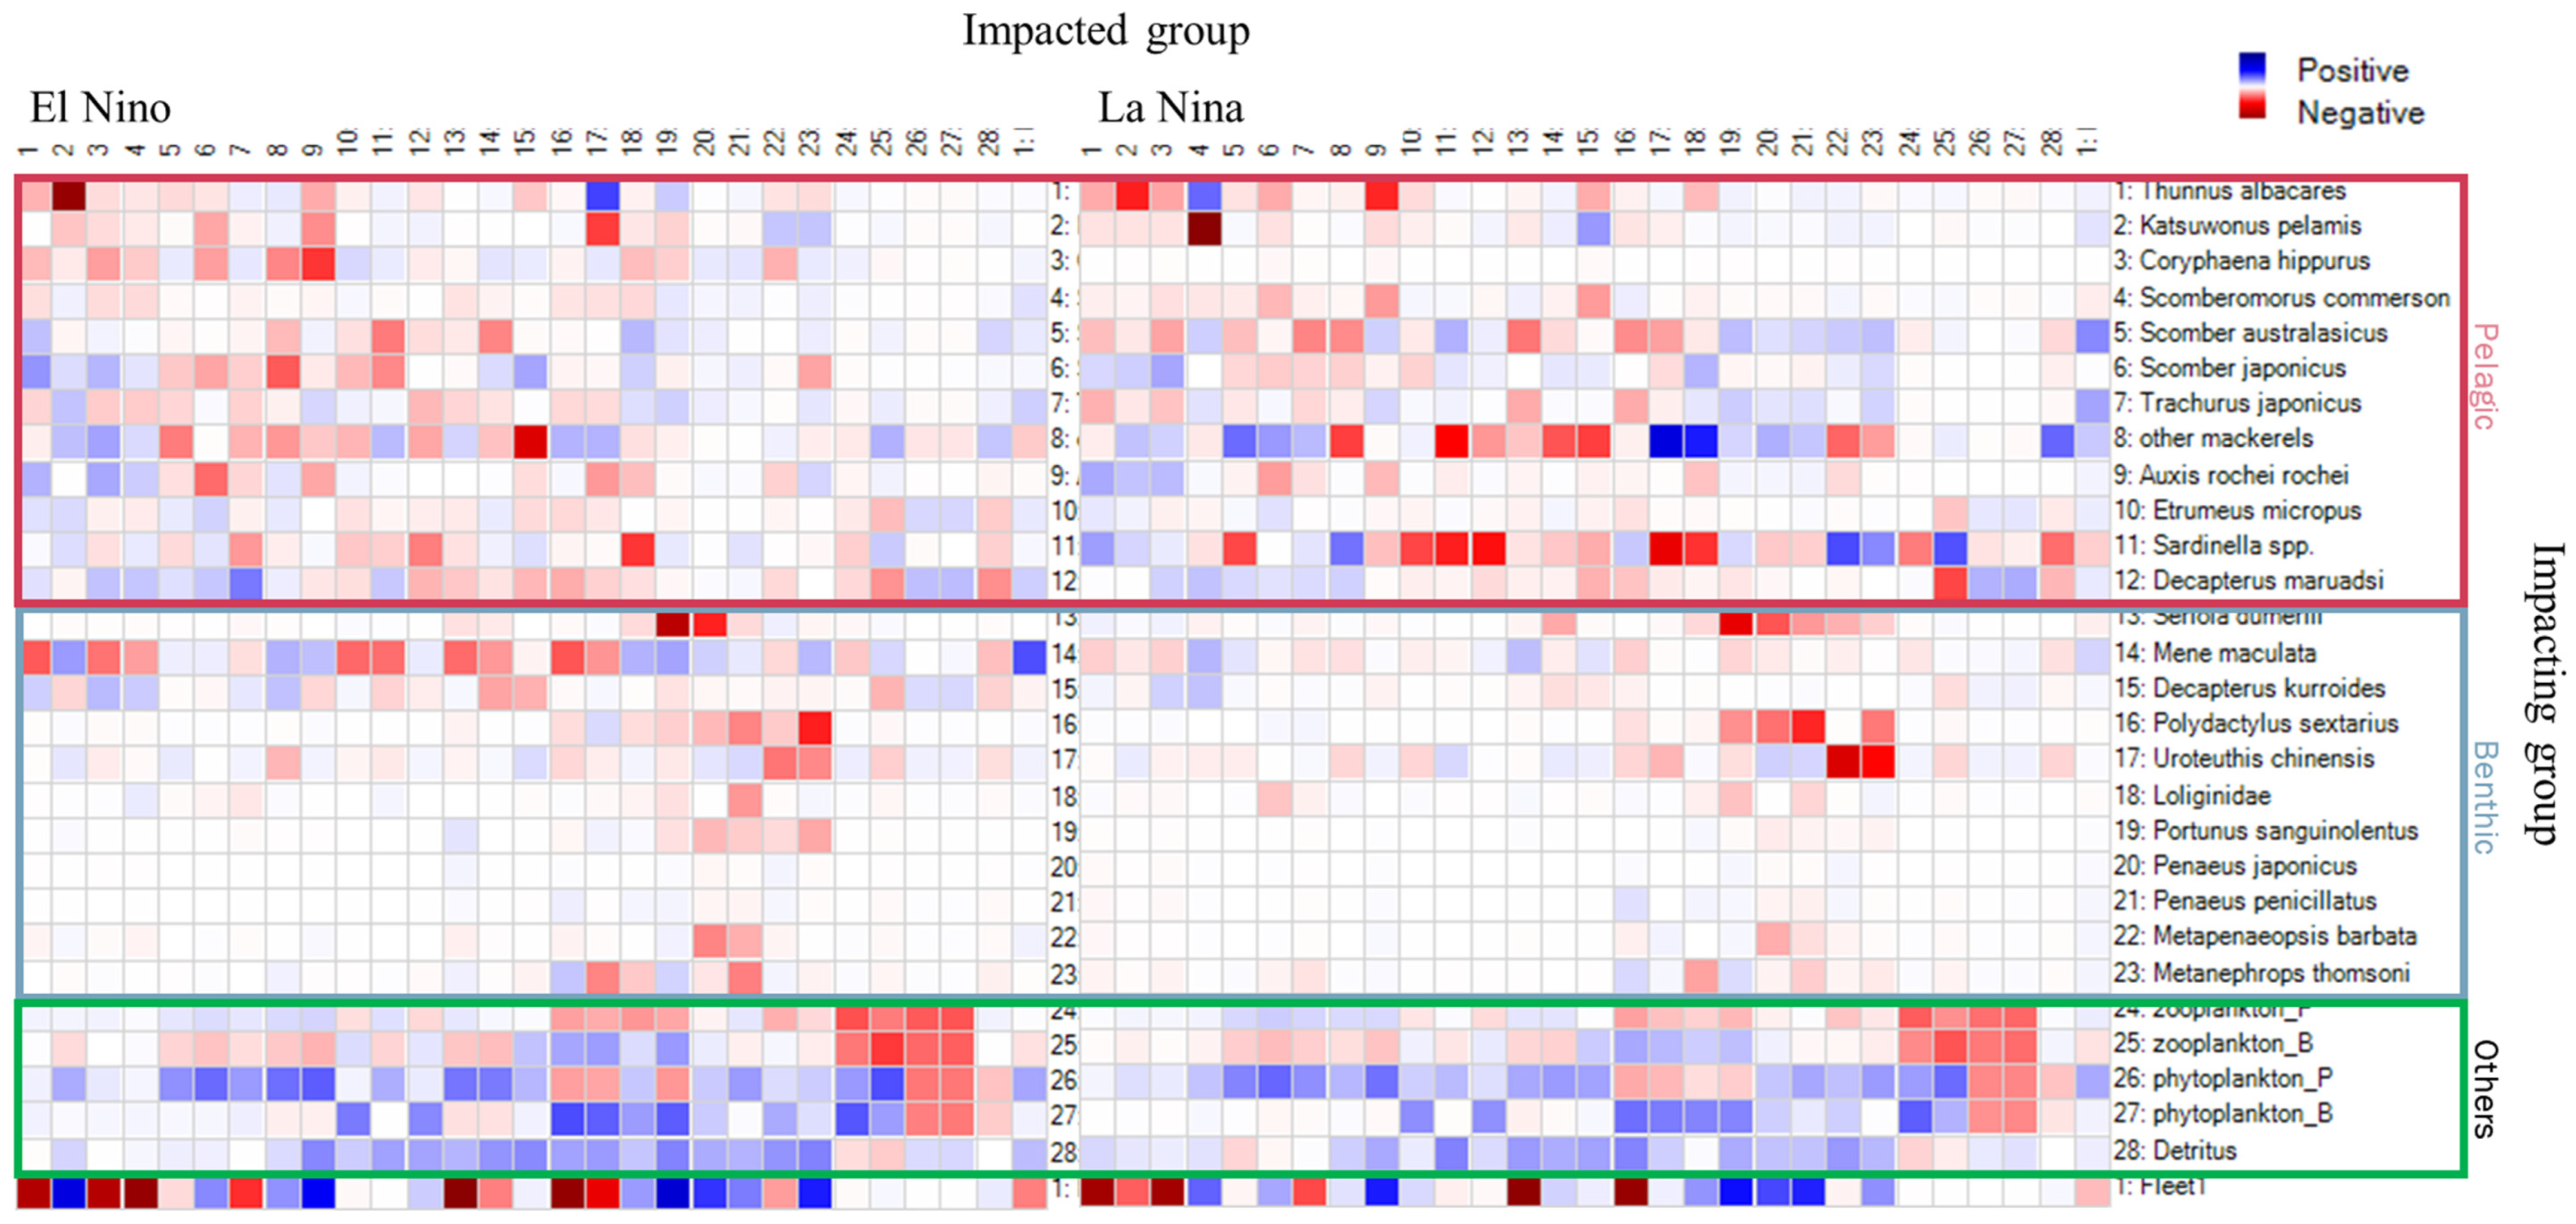
Our MTI analysis results demonstrated similar trends: during El Niño and La Niña events, zooplankton and phytoplankton positively affect other species, serving as bottom–up providers, while predator fish, especially yellowfin and skipjack tuna, negatively affect other species as top–down controls (Figure 5).
Figure 5.
MTI in the TB ecosystem during El Niño and La Niña events. Impacted and impacting groups are arranged along the horizontal and vertical axes, respectively.
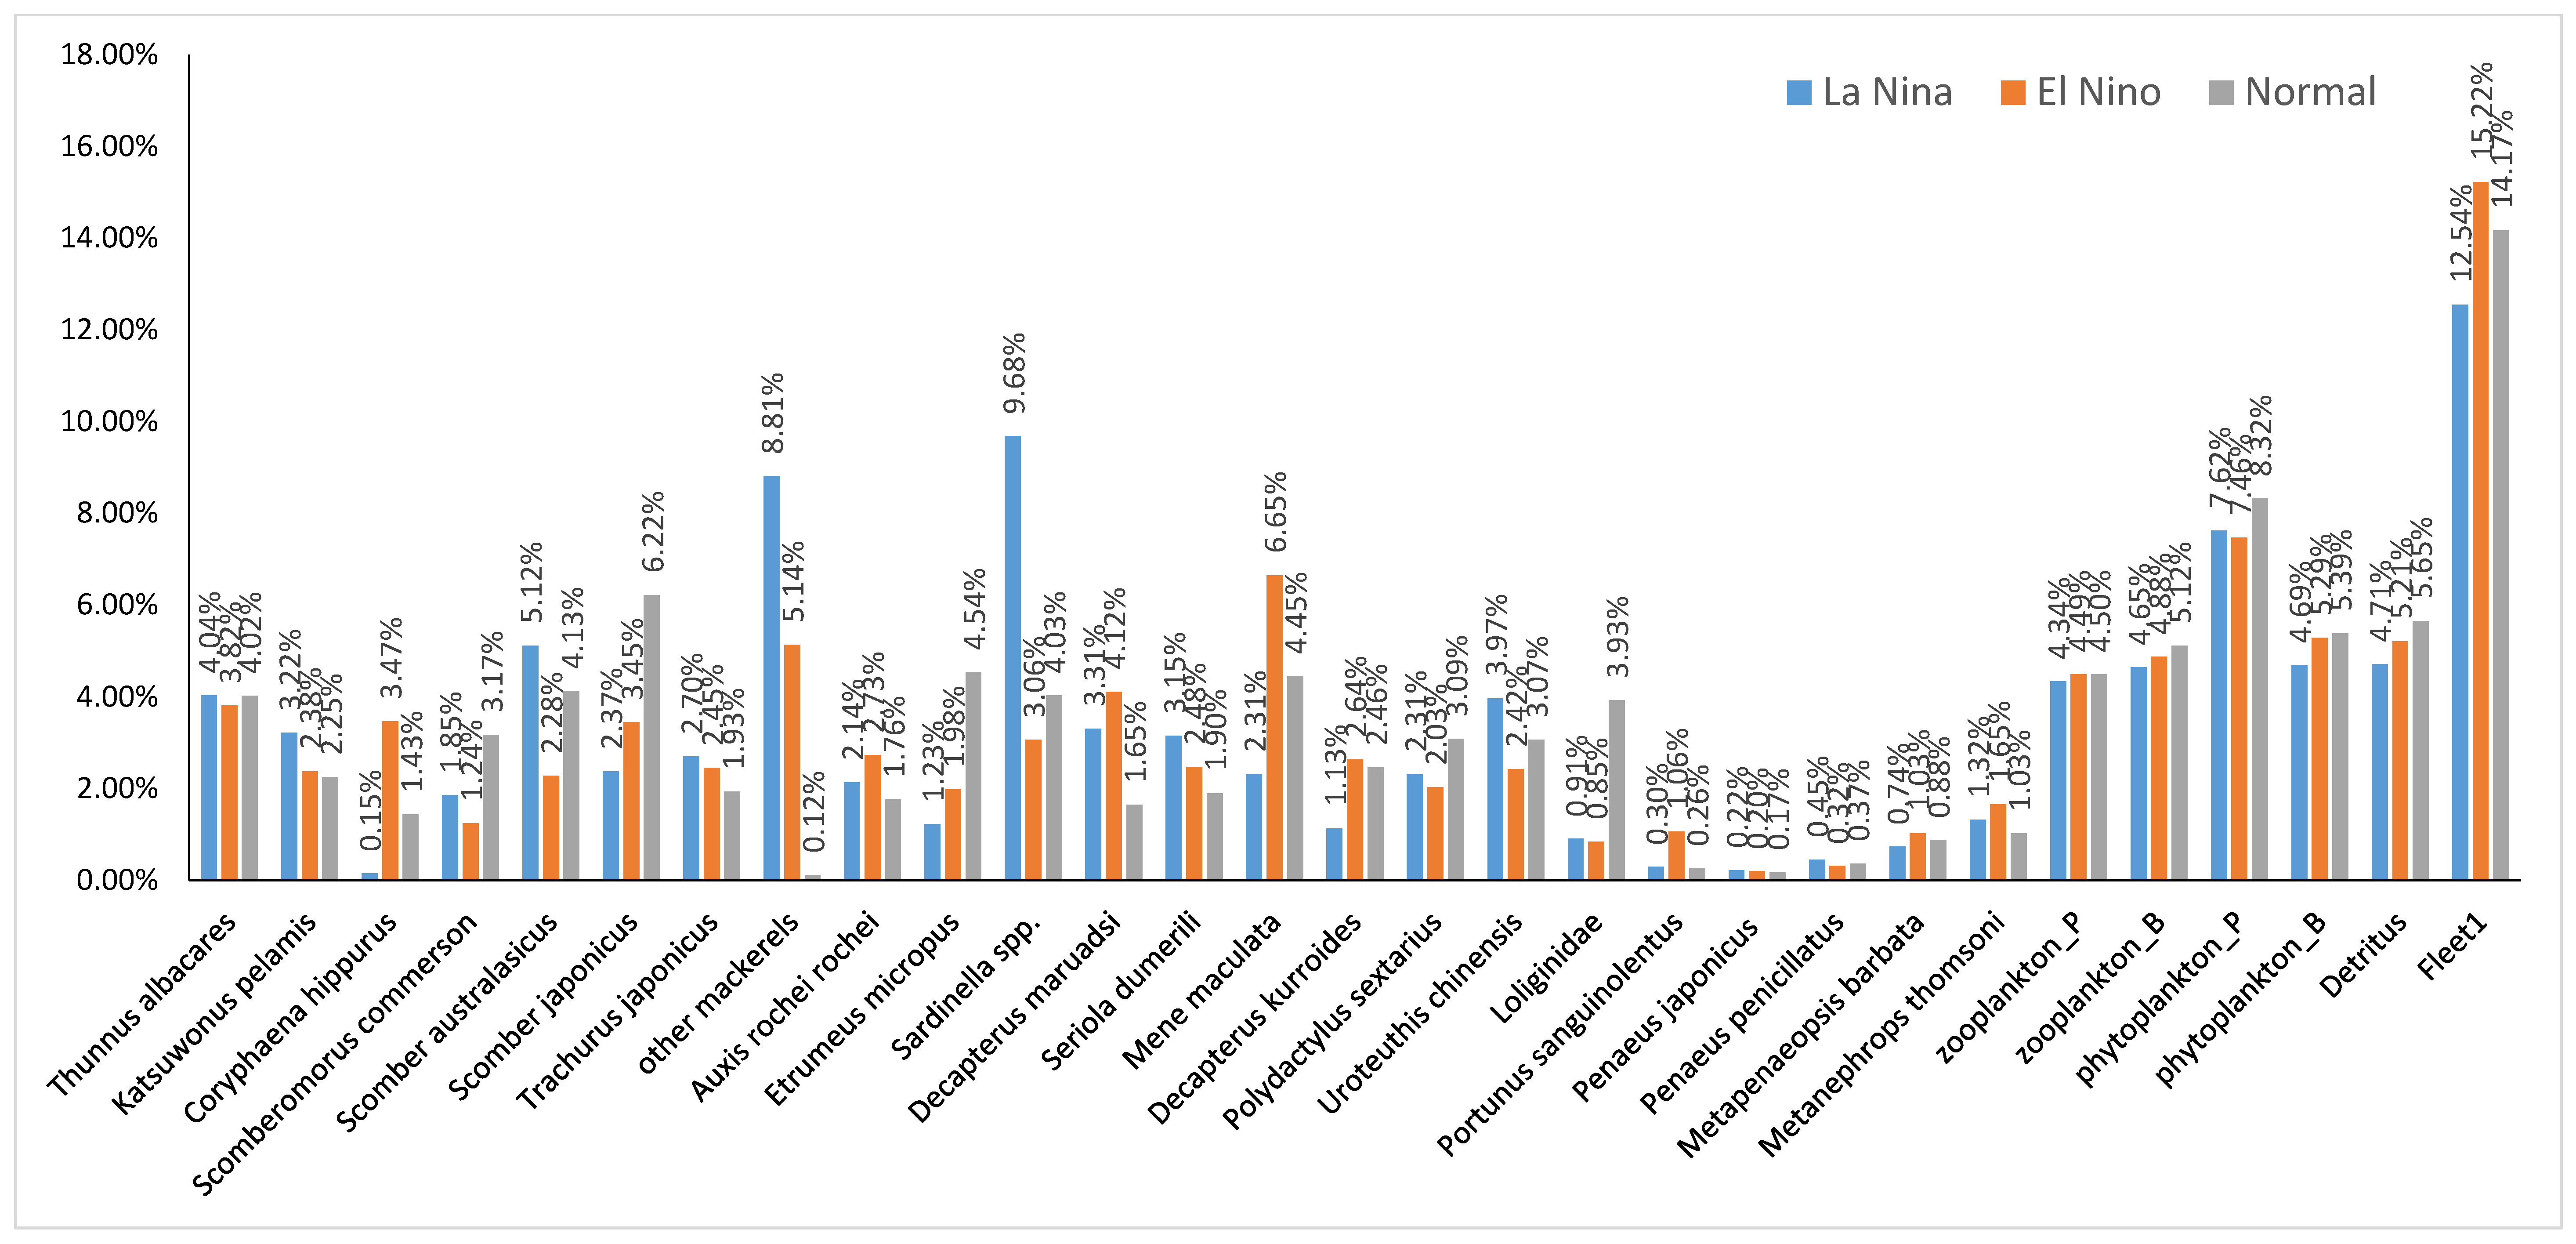
However, based on the changes in MTI for each group, during El Niño events, the impact percentages of C. hippurus, M. maculate, and D. kurroides increased from 0. 15%, 2.31%, and 1.13%, respectively, to 3.47%, 6.65%, and 2.64%, respectively, whereas those of Saddnella spp., other mackerels, and S. australasicus decreased from 9.68%, 8.81%, and 5.12% to 3.06%, 5.14%, and 2.28%, respectively (Figure 6).
Figure 6.
Overall trophic impact percentage variation in groups in the TB ecosystem during normal years and ENSO and La Niña events.
Moreover, during El Niño events, pelagic phytoplankton (7.46%) was the most influential species, followed by M. maculate and plankton, whereas C. hippurus negatively affected most pelagic species. Fishing had the greatest influence during El Niño events, followed by normal years, and finally, by La Niña events. The influence of fisheries on benthic species gradually changed from negative to positive during El Niño events.
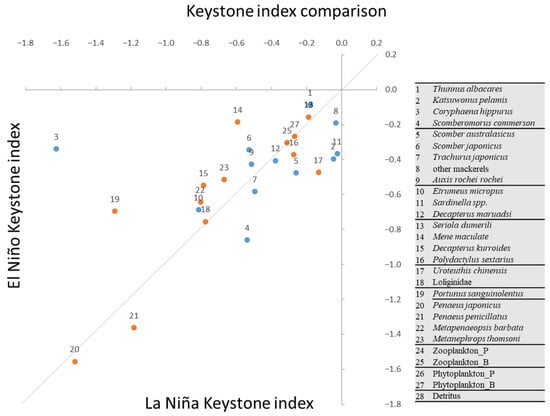
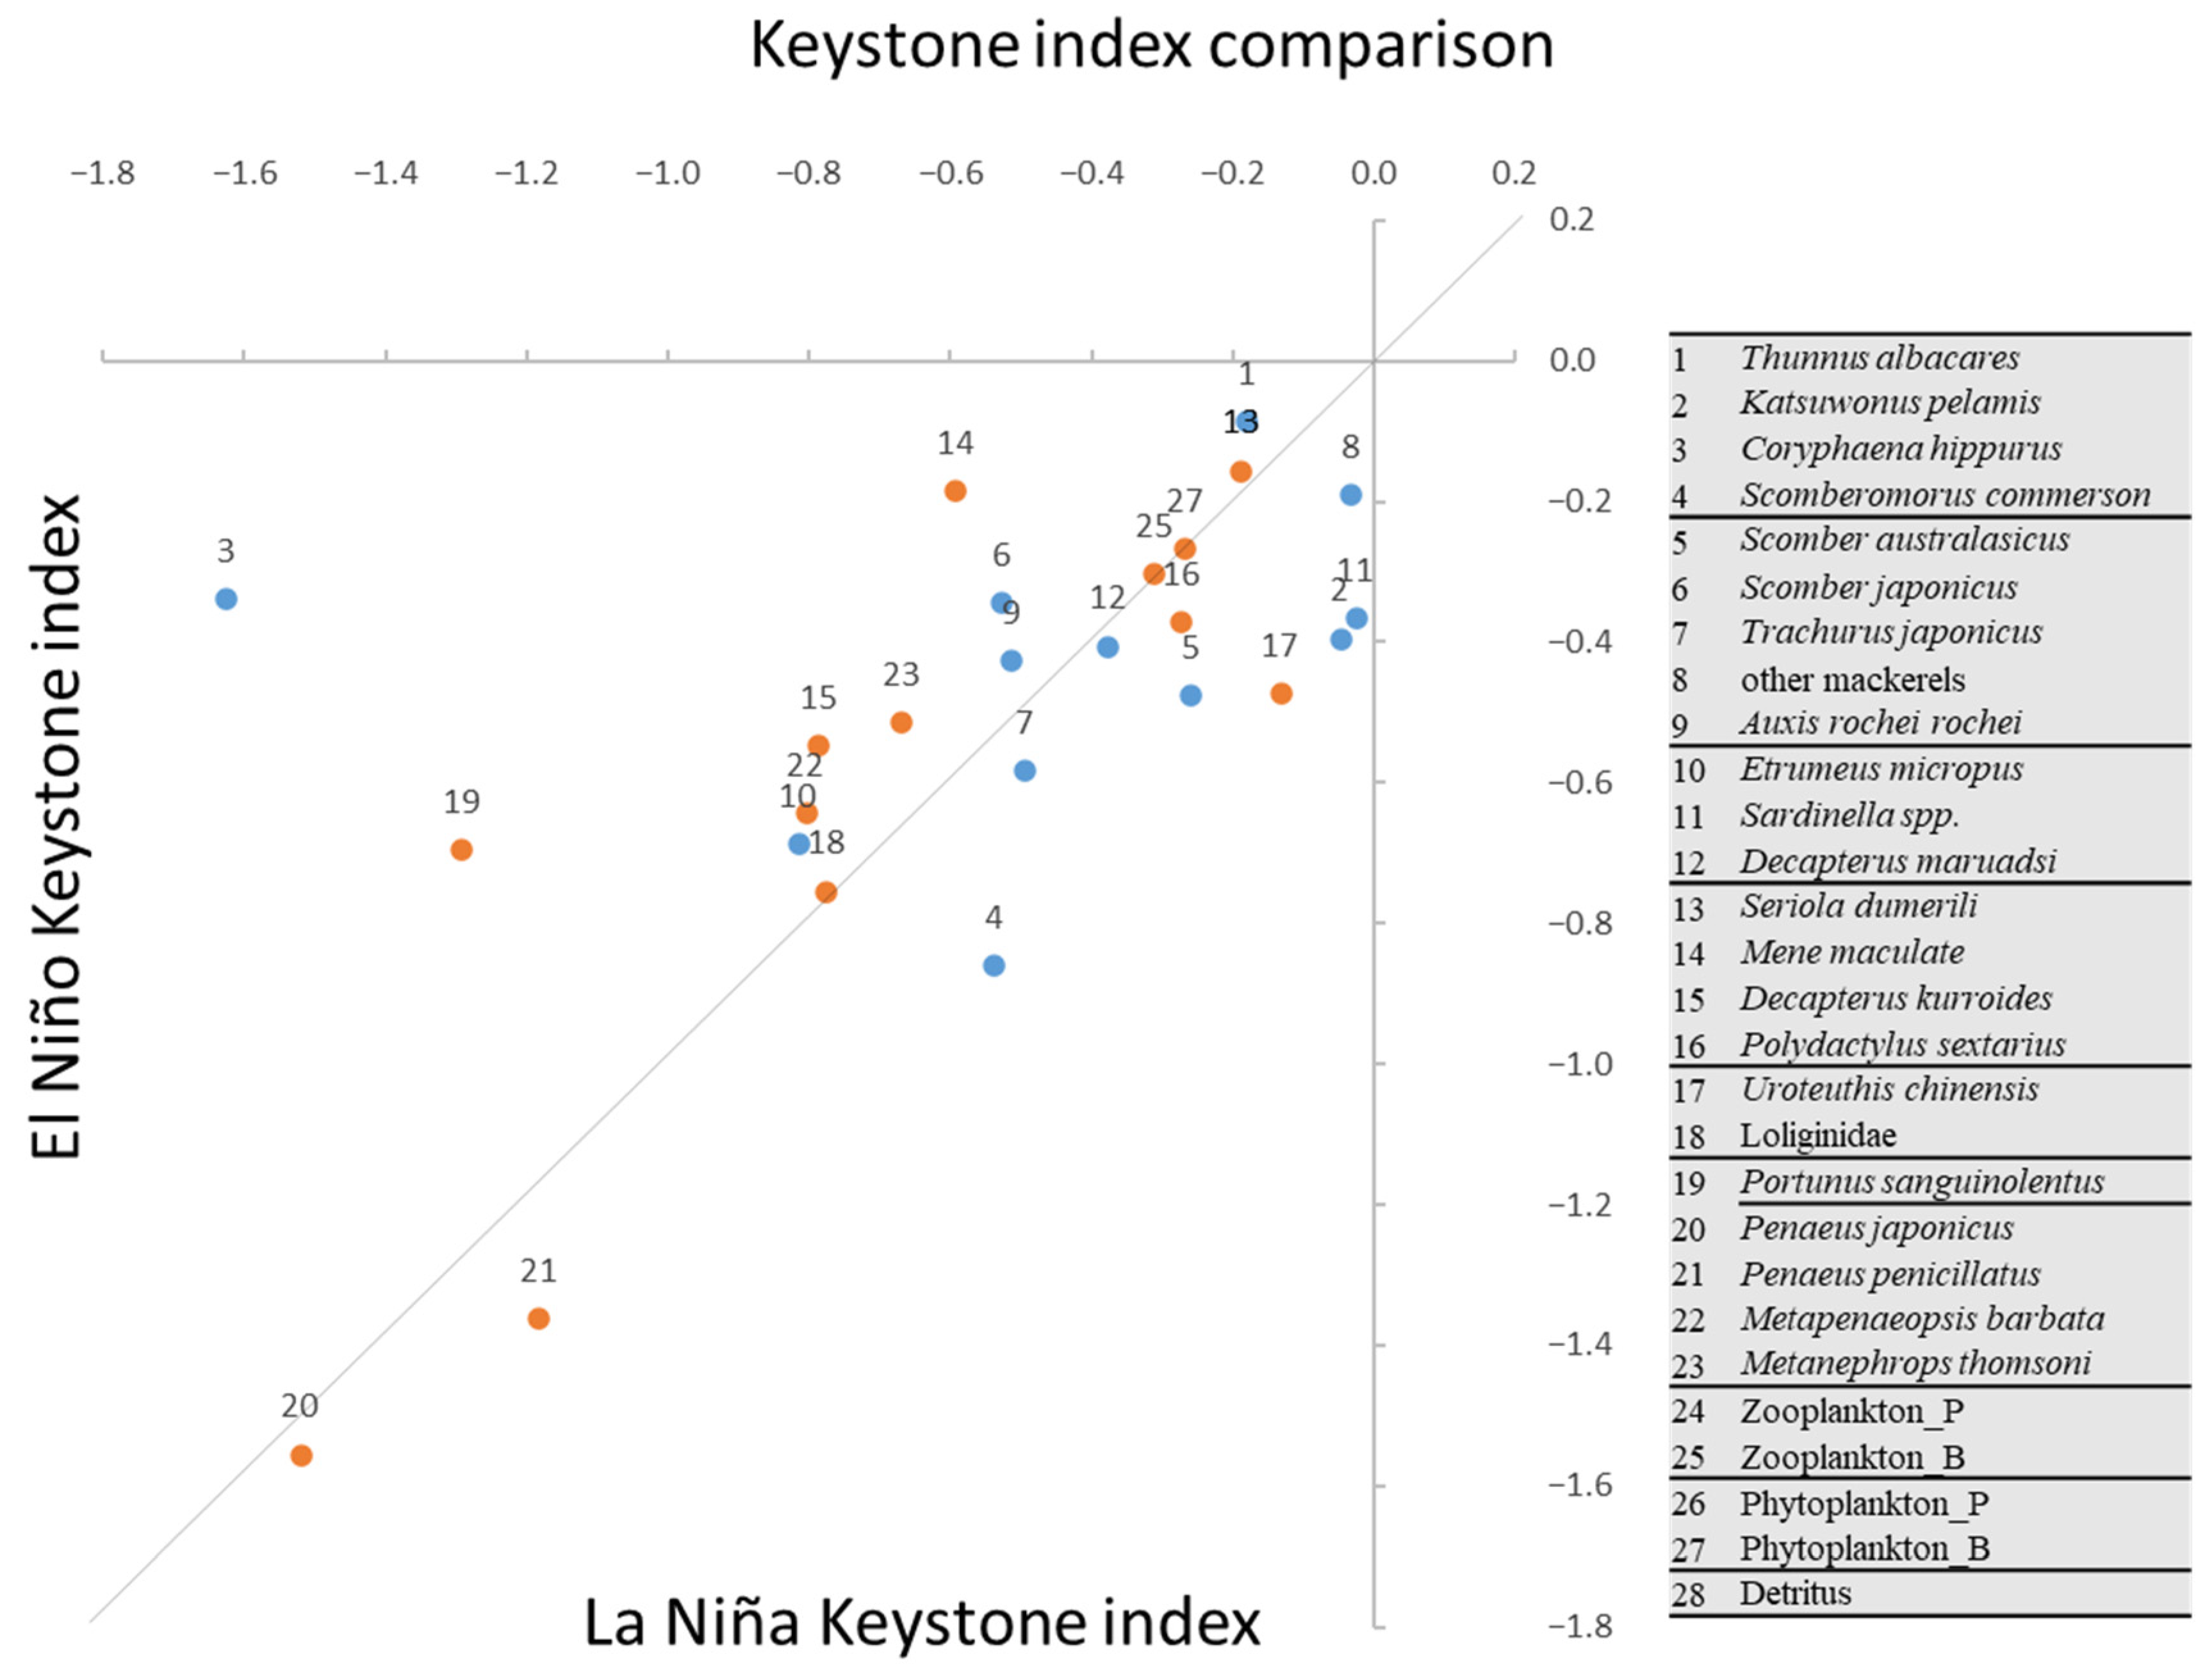
According to their KSi and RTI, P. sextarius, S. japonicus, and pelagic phytoplankton were the top-three groups in TB’s normal years (Figure 4, Table A7). We assume the main keystone species are P. sextarius and S. japonicus due to their low biomass and significant BU and TD impact. During El Niño events, T. albacares, Seriola dumerili, and M. maculata were the top-three groups in terms of KSi; phytoplankton and other mackerels also had high values. We suggest that the main keystone species during El Niño events is T. albacares. Although Sardinella spp., other mackerels, and K. pelamis had high KSi levels during La Niña events, we estimate that the keystone species is K. pelamis. C. hippurus and Portunus sanguinolentus revealed lowered KSi levels during La Niña events (Figure 7).
Figure 7.
Comparison of KSi values between El Niño and La Niña events in the TB ecosystem. Blue and orange represent pelagic and benthic respectively.
Moreover, the influence of the TD effect had a relatively high impact on the ecosystem across all three periods (Table 4).
4. Discussion
4.1. TB Ecosystem Structure
Our food web energy flow diagram indicates that TB ecosystems in three periods contain nearly four TLs, with each consumer group concentrated between TLs 2 and 3. The highest group in terms of TL was the predator fish group; moreover, most species, except for a few pelagic predators, had a high EE; these species may be essential food sources for predators due to their high EE [56]. Detritus had an EE of 0.215, indicating that detritus utilization in the TB ecosystem is low compared with production, but there is still some detritus utilization.
The results of our Lindeman’s spine analysis demonstrated that the energy flow of the TB ecosystem in each period was mainly concentrated on the basic producers in TL 1 and on the primary consumers in TL 2 (Figure 2, Table A1, Table A2 and Table A3). This inference was drawn based on the substantial biomass of large primary consumers and the flattened composition within the ecosystem. Additionally, it highlights that the upwelling ecosystem exhibits high productivity [63]. Across the entire study period, the energy flow of detritus accounted for a relatively low proportion of the total energy flow of TL 1. This result is similar to that for the proportion of producers and detritus during El Niño and La Niña events, indicating that the structural differences among the TLs of the ecosystem are nonsignificant under ENSO events.
In all three TB ecosystem models, a proportion of primary production was not used by organisms and flowed into the detritus stock, which benefited detritus-feeding groups [64]. Other unused detritus in the system may have been decomposed by microorganisms, buried to form sediment, or exported outside the system [56,65]. In the TB ecosystem, although the transfer efficiency (12.26–15.69%) between each TL was higher than the global ecosystem average (10%) [66,67], the transfer efficiency decreased as TL increased. This result is generally consistent with the results of Lindeman [21] and Ju [20]—the transfer efficiency between nutrient classes decreases as nutrient classes increase—and it is also similar to nearby ecosystems, such as those in the East China Sea, South China Sea, and southern TS (Table 5) [20,68,69].
Table 5.
Ecosystem indicators across regions.
The EE of TB is shown in Table A4, Table A5 and Table A6. The top predators in the TB ecosystem had low EE because less mortality occurred due to predation [20]. Commercial species such as S. australasicus and M. maculate had high EE due to experiencing heavy exploitation and high consumption (i.e., high mortality due to predation), respectively [70]. Prey species such as shrimps and crabs demonstrated high EE due to a high proportion of their production being consumed within the ecosystem [71].
Comparing the results with the East China Sea [68], this study shows higher SOI and lower TE values in the TB. In contrast, compared with the South China Sea [69], TB exhibits higher SOI and TE values, although the mean trophic level of the catch is slightly higher in the South China Sea. The southern TS generally shows similar results; the SOI and CI values in our study are slightly higher than those found by [20], with the major difference being in FCI and the mean trophic level of the catch. The biomass observed in this study is relatively high when compared to the East China Sea and South China Sea, but similar to the southern TS [20]. The high fishing efficiency of Taiwanese seining [6,72], which contributes to over 50% of total catch, leads to a significant increase in biomass. Different fishing methods have varying gear selectivity, leading to the capture of different species. We considered the utilization of multiple fishing methods to integrate the calculation of biomass for different species inhabiting various depths, in order to avoid sampling errors caused by relying on a single fishing method for investigation [73,74]. La Peyre et al. [75] also state that differences in species-specific catch due to gear selectivity could have large consequences for constructing and calibrating fish and ecosystem models that remain difficult to reconcile.
4.2. Trophic Interactions in TB Ecosystem
In an ecosystem, various groups of organisms are affected by the interactions of other groups of organisms. The BU effect is a result of changes in the abundance of organisms at lower TLs, resulting in changes in predator abundance at higher TLs [76]. By contrast, the TD effect is caused by changes in the number of predators at higher TLs, and these effects can be transmitted from top to bottom through the trophic linkage [77,78]. Plankton groups were noted to have the largest positive impact on several groups, including zooplankton and benthic crustaceans, confirming their BU effect in the TB ecosystem [79,80]. The current results demonstrate that phytoplankton had a negative effect on zooplankton, and detritus had a positive effect on all species, except zooplankton. They also reveal that pelagic phytoplankton had a high biomass, KSi, and MTI; thus, we consider phytoplankton a dominant species or structure species [20]. Plankton communities are responsible for most of the BU effects in an ecosystem [20,81]. Being an upwelling ecosystem, all plankton groups exhibit high biomass, consistent with the norm [20,63,82];. Due to their higher KSi, P. sextarius and S. japonicus are selected as the two keystone species.
T. albacares and K. pelamis had a higher KSi with a high and negative MTI during the study period, indicating that an increase in their biomass negatively affects their prey species (small pelagic fishes; this is an example of TD). Predators mainly affect the ecosystem through TD control, as indicated by their negative effects on other groups [83]. Pelagic fish negatively affect small pelagic fish, as well as benthic and reef fish, but they have a positive impact on predators and crustaceans, as indicated by the wasp-waist control and TD control [63,84]. Small pelagic fish demonstrated negative effects on benthic species in general, indicating the presence of predation [70]. Furthermore, the high TD value (70%) demonstrated that the ecosystem is mainly subject to top–down control; this result is consistent with the neighboring ecosystem (TD, 64%) in the northern South China Sea [20]. In the East and South China Seas, top predators such as tuna and mackerel have been identified as keystone species in many ecosystem models [20,60,80]. These high-impact groups tend to exert a strong TD effect.
All crustaceans demonstrated a low influence on the TB ecosystem. M. maculate, D. kurroides, and cephalopods demonstrated pelagic–benthic coupling with negative effects on the benthic species and positive effects on the pelagic fish; this result indicates the presence of a bridge between pelagic fish and crustaceans in the mesopelagic layer [85]. Pelagic fish move to the mesopelagic layer during the daytime in search of predator refuge and ascend to the surface layer at nighttime for feeding after the nightly ascension of zooplankton [86,87]. Furthermore, small pelagic fish (e.g., Sardinella spp. and E. micropus) are part of a major mid-TL node in the food web and participate in complex interactions between predators, prey, and competitors [10,88]. Moreover, the relatively high trophic efficiencies in the East China Sea ecosystem highlight a favorable coupling of benthic and pelagic invertebrates with their predators [60,89].
4.3. Climate Impact on TB Ecosystem
During ENSO events, significant changes occurred in terms of biomass, ecosystem structure, productivity, consumption, and respiration in the TB ecosystem. In particular, changes in the marine environment during ENSO events led to an increase in the abundance of specific species, which attracted more organisms to inhabit and forage in the area [6,8,90]. During La Niña events, the SST in the eastern and central tropical Pacific is lower than normal, whereas it is higher than normal during El Niño events [91].
ENSO events have been reported to have various positive and negative effects on the species population in the TS [8,42,90]. Ecosystem structure, transfer efficiency, and mean trophic levels of catch were all smaller during El Niño events than during La Niña events. Benthic and reef species demonstrated a relatively high abundance during El Niño events, which possibly increased the complexity and diversity of pelagic species’ diet composition [92]. In general, groups of the pelagic domain tended to have a higher omnivory index than those in the non-pelagic domain [63].
Pelagic fish and small pelagic fish with high biomass and energy consumption led to an increase in TST, consumption, respiration, and mean fishing TL during La Niña events. Because small pelagic fish contain a high calorie content, they are the prey of top predators but the predator of benthic invertebrates [93]. The increase in TST during La Niña events reflects changes in the overall flow of energy within the ecosystem [58]. Similar phenomena have also been observed along the Pacific coast of Central and South America [94,95]). During El Niño events, TB had a low SST and a high NPP in winter, creating a suitable habitat for benthic and reef species [96]. However, in the summer, TB’s low SST and high NPP during La Niña events attracts top predators and pelagic species [97]. This is also evident in species interactions. During El Niño years, the keystone species transition from S. japonicus and P. sextarius to yellowfin tuna, and during La Niña events the keystone species is skipjack tuna. The increased abundance of pelagic fish and small pelagic fish during La Niña events intensifies the impact on the ecosystem, reflected in the values of RTI and MTI. In El Niño years, there is an increase in benthic species abundance, particularly for M. maculata. Simultaneously, across the three periods, phytoplankton shows high values for both RTI and MTI indices, especially during normal years, indicating characteristics of an upwelling ecosystem and a bottom–up effect. However, the TD index suggests that TD control remains dominant in ecological control throughout the three periods. The TD index is lowest during La Niña events and highest during El Niño years, possibly due to the negative correlation between upwelling intensity and ENSO [98].
As an ecosystem grows larger, its biodiversity increases, and the linkage between organisms and their food habits changes from a simple chain structure to a more complex network structure [99]. During ENSO events, the La Niña model, with a higher TST, also provided a higher SOI and CI, but a lower system omnivory index due to the increase in the number of pelagic species, such as mackerels and Sardinella spp., which carry large amounts of energy. By contrast, in the El Niño model, an increase in the number of benthic species led to the diversification of the food composition of all species and to an increase in the degree of food web linkage with a high SOI, resulting in the development of a highly complex ecosystem [100].
The impact of fisheries on benthic species changed from negative to positive during El Niño events, revealing that fishing leads to composition changes and system ecological effects. The high exploitation of small pelagic fish and benthic predators (i.e., M. maculate) has positive effects on benthic invertebrates in terms of reduced predation. Fishing had a negative effect on all top predators, except K. pelamis; a positive effect on pelagic and small pelagic fish; and a negative effect on most benthic species. Because of the high exploitation of top predators and benthic species through the TD effect, the number of small pelagic species increased [19,45,67,101,102]
Nevertheless, one limitation of our study that should be acknowledged is the lack of explicit consideration of water temperature effects on biological processes. Temperature plays a crucial role in regulating biological rates, including primary production, metabolic rates (respiration), and consumption [103,104,105]. While we recognize that environmental factors such as temperature significantly affect these biological rates, we did not use a forcing function to dynamically modify them because Ecopath is a static snapshot mass-balance model that does not account for temporal dynamics. To capture these environmental effects, models like Ecosim, which incorporate time dynamics, are required. Future research could address this limitation by integrating environmental variables into dynamic models to better understand their influence on energy flow and trophic interactions in the TB ecosystem.
5. Conclusions
In the TB ecosystem, the biomass of pelagic species, including pelagic and small pelagic fish, was found to be higher than that of other group species. Moreover, benthic fish and reef species demonstrated a higher biomass than cephalopods and crustaceans did. The keystone species demonstrating the TD effect were P. sextarius and S. japonicus in normal years. Moreover, El Niño and La Niña events led to different variations in ecosystem structure. During La Niña events, total biomass, TST, consumption, respiration, SOI, and CI were higher, whereas the Shannon diversity index were lower. As such, the biomass of pelagic species was relatively high during La Niña events, and that of almost all benthic species was relatively high during El Niño events. The keystone species also shifted to the predator fish T. albacares and K. pelamis during El Niño and La Niña events, respectively.
When used for marine resource assessment and management, ecological modeling enables the inclusion of trophic interaction dynamics, allowing for the development of precautionary approaches and adaptive management processes. The current Ecopath model provides a basis for the further development of dynamic simulations to understand the extent to which fishing activities, the environment, and other anthropogenic factors drive marine resources and elucidate the configuration of trophic interactions in study areas.
Deficiencies in available biological and fisheries data might influence the quality of ecosystem-based studies. Additional studies on further characterizing the key elements of ecosystems, such as the ecological efficiency of specific groups, the aspect ratio of some fish, and the biomass of some fish groups and detritus, are warranted for the improvement of model input data and ecosystem characterization [36,106,107]. One of the most direct ways to improve the collection of species biomass parameters in a study area is through the direct sampling of field data. Furthermore, Free et al. [108] have developed resource assessment models that rely solely on catch data. Lin et al. [109] have incorporated fishing mortality rates into their considerations for biomass calculations. Moreover, incorporating fishing efficiency [110] as a reference factor can contribute to the computation of more reliable biomass estimates.
Author Contributions
Conceptualization, K.-W.L.; methodology, N.-J.S.; resources, C.-H.L.; data curation, P.-Y.H., W.-H.L. and T.-Y.L.; writing—original draft preparation, P.-Y.H.; writing—review and editing, P.-Y.H. and K.-W.L.; supervision, K.-W.L. All authors have read and agreed to the published version of the manuscript.
Funding
This study was financially supported by the Council of Agriculture (111AS-2.38-FA-03) and the National Science Council (MOST 110-2611-M-019-008 and MOST 111-2611-M-019-024). We are grateful to the Taiwan Ocean Conservation and Fisheries Sustainability Foundation for providing data from Taiwanese vessels. The first author especially thanks the conveners of the 2022 Small Pelagic Fish Symposium for supporting him to present materials and the North Pacific Marine Science Organization and International Credential Evaluation Service for supporting his attendance at the symposium. This manuscript was edited by Wallace Academic Editing. Finally, the authors thank anonymous reviewers for their constructive suggestions for improvement.
Institutional Review Board Statement
Not applicable.
Informed Consent Statement
Not applicable.
Data Availability Statement
The original contributions presented in the study are included in the article, further inquiries can be directed to the corresponding author.
Conflicts of Interest
The authors declare no conflict of interest.
Appendix A
Figure A1.
Lindeman’s spine diagram for the TB ecosystem during normal years. Lindeman spine showing trophic flows among integer trophic levels (TL). Primary producer (P); detritus (D); Total system throughput (TST); Transfer efficiency (TE).
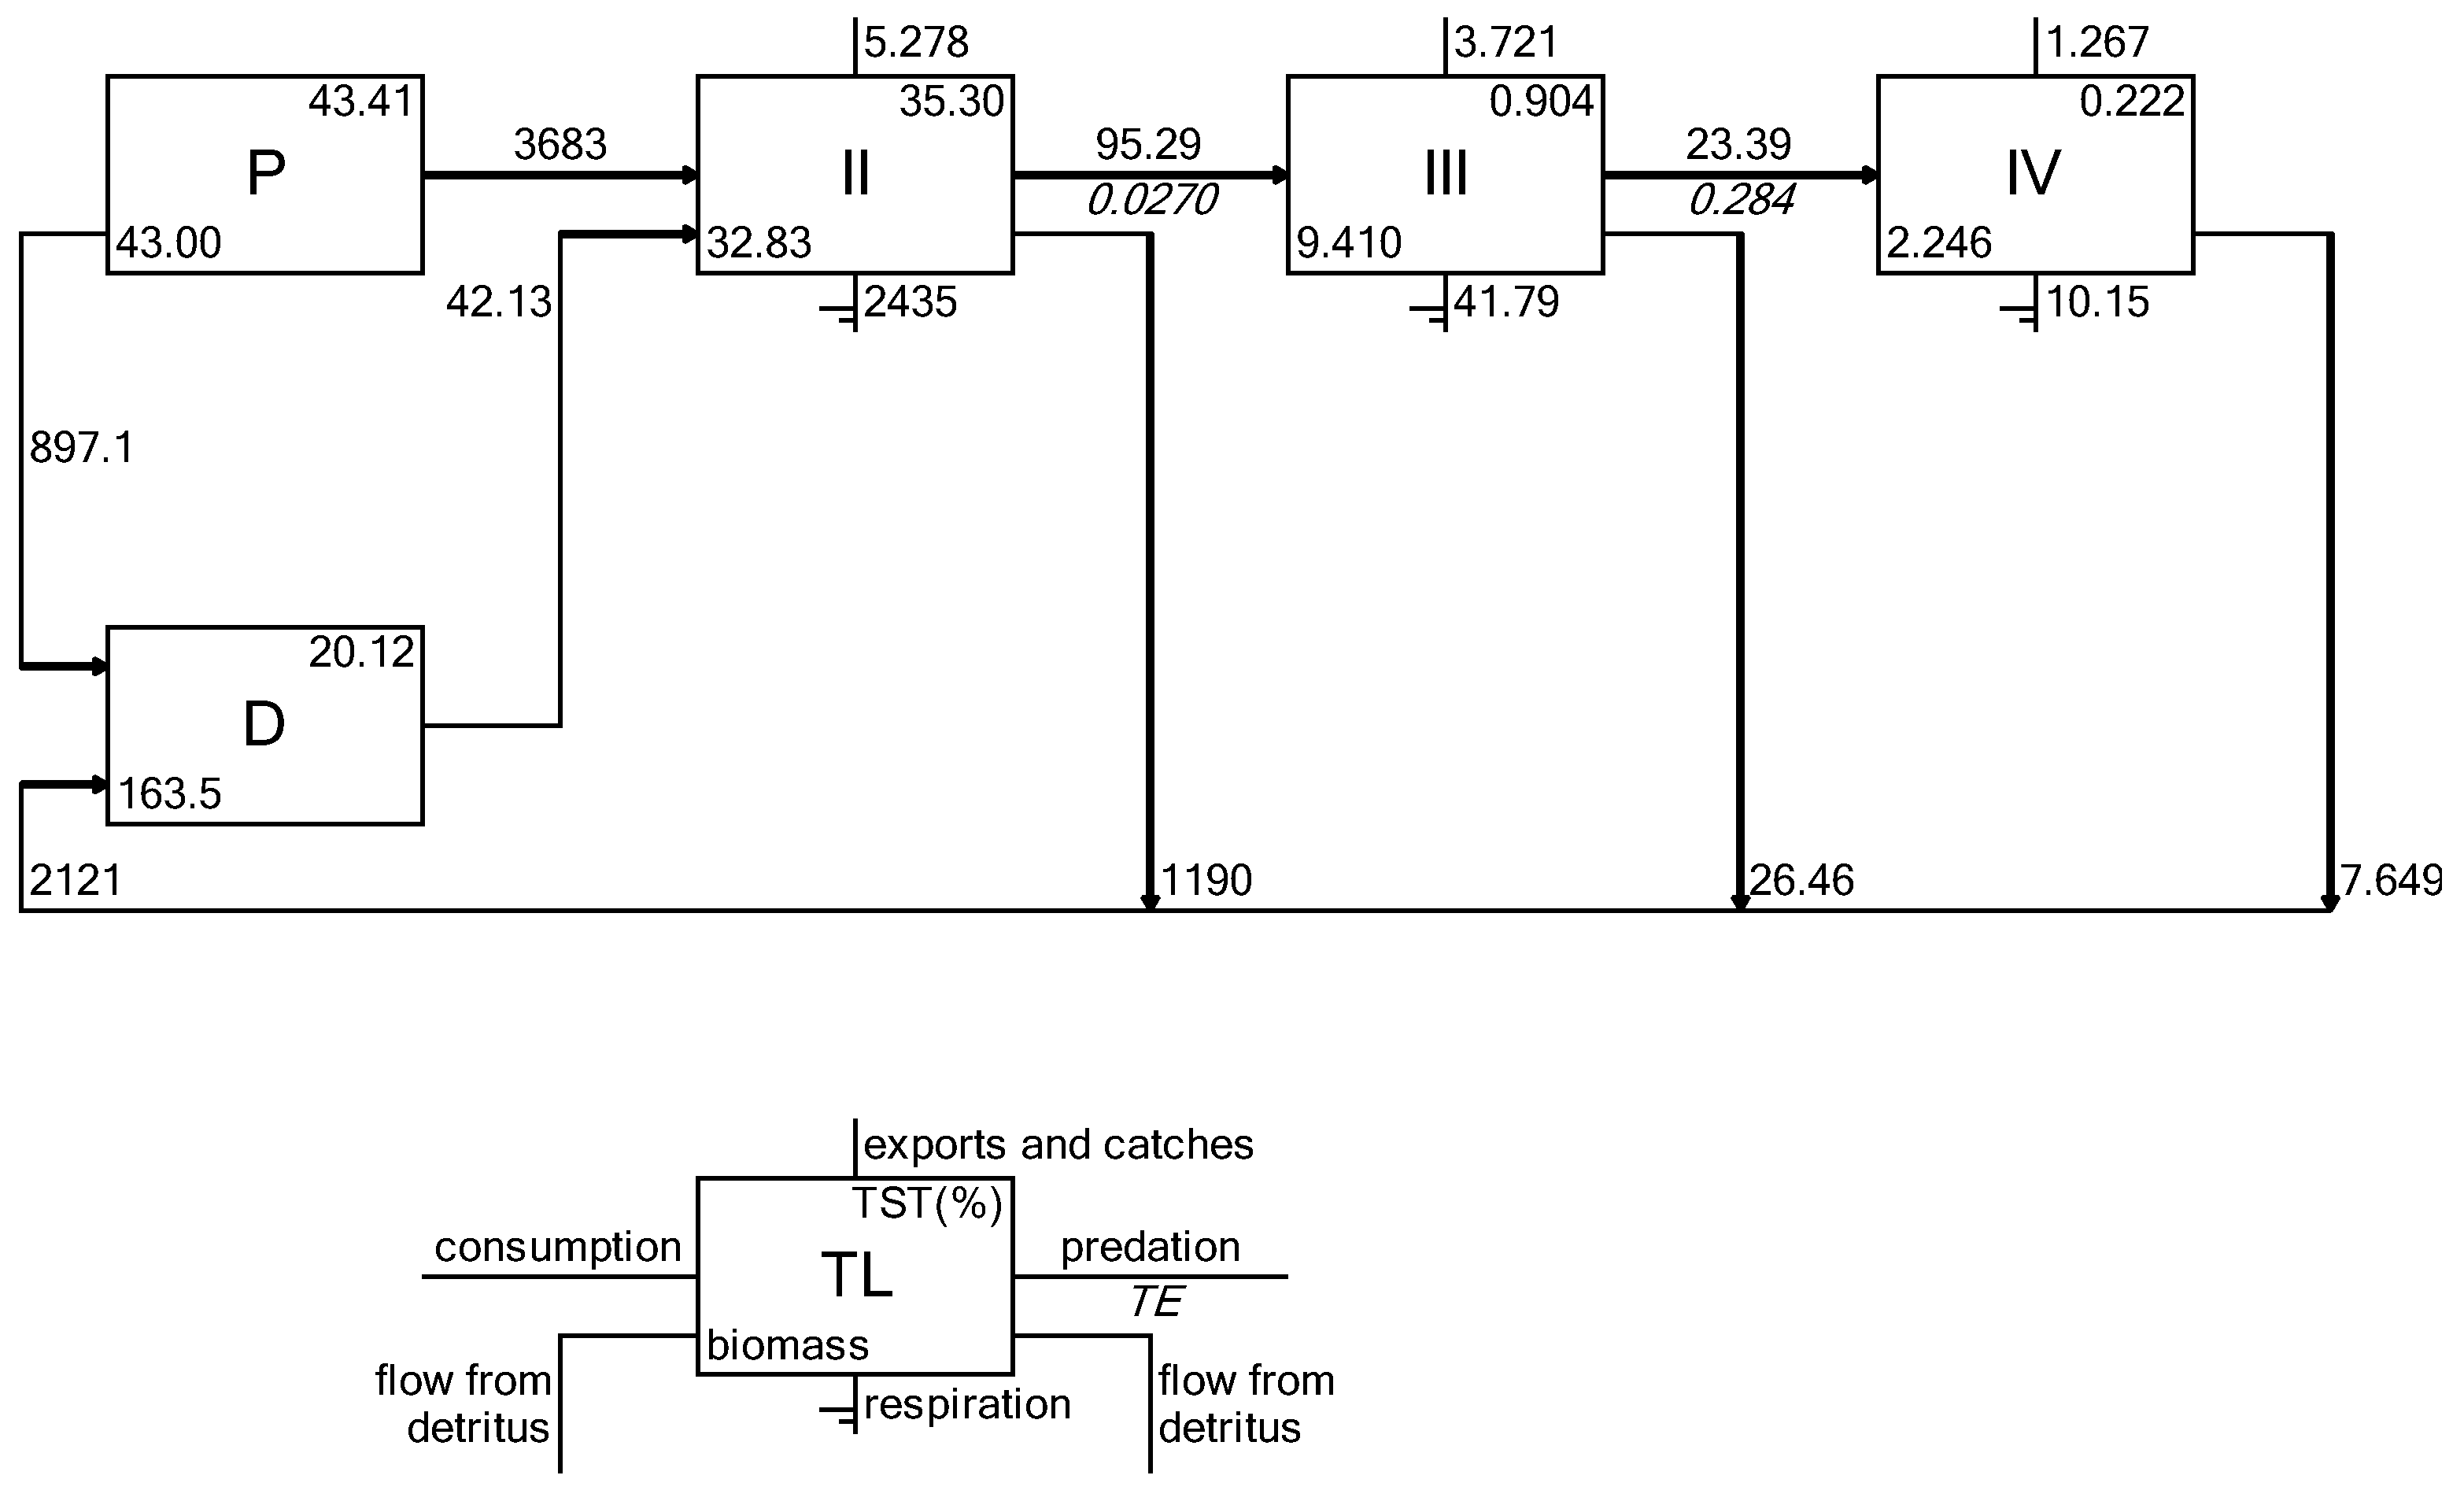
Figure A2.
Lindeman’s spine diagram for the TB ecosystem during El Niño events. Lindeman spine showing trophic flows among integer trophic levels (TL). Primary producer (P); detritus (D); Total system throughput (TST); Transfer efficiency (TE).
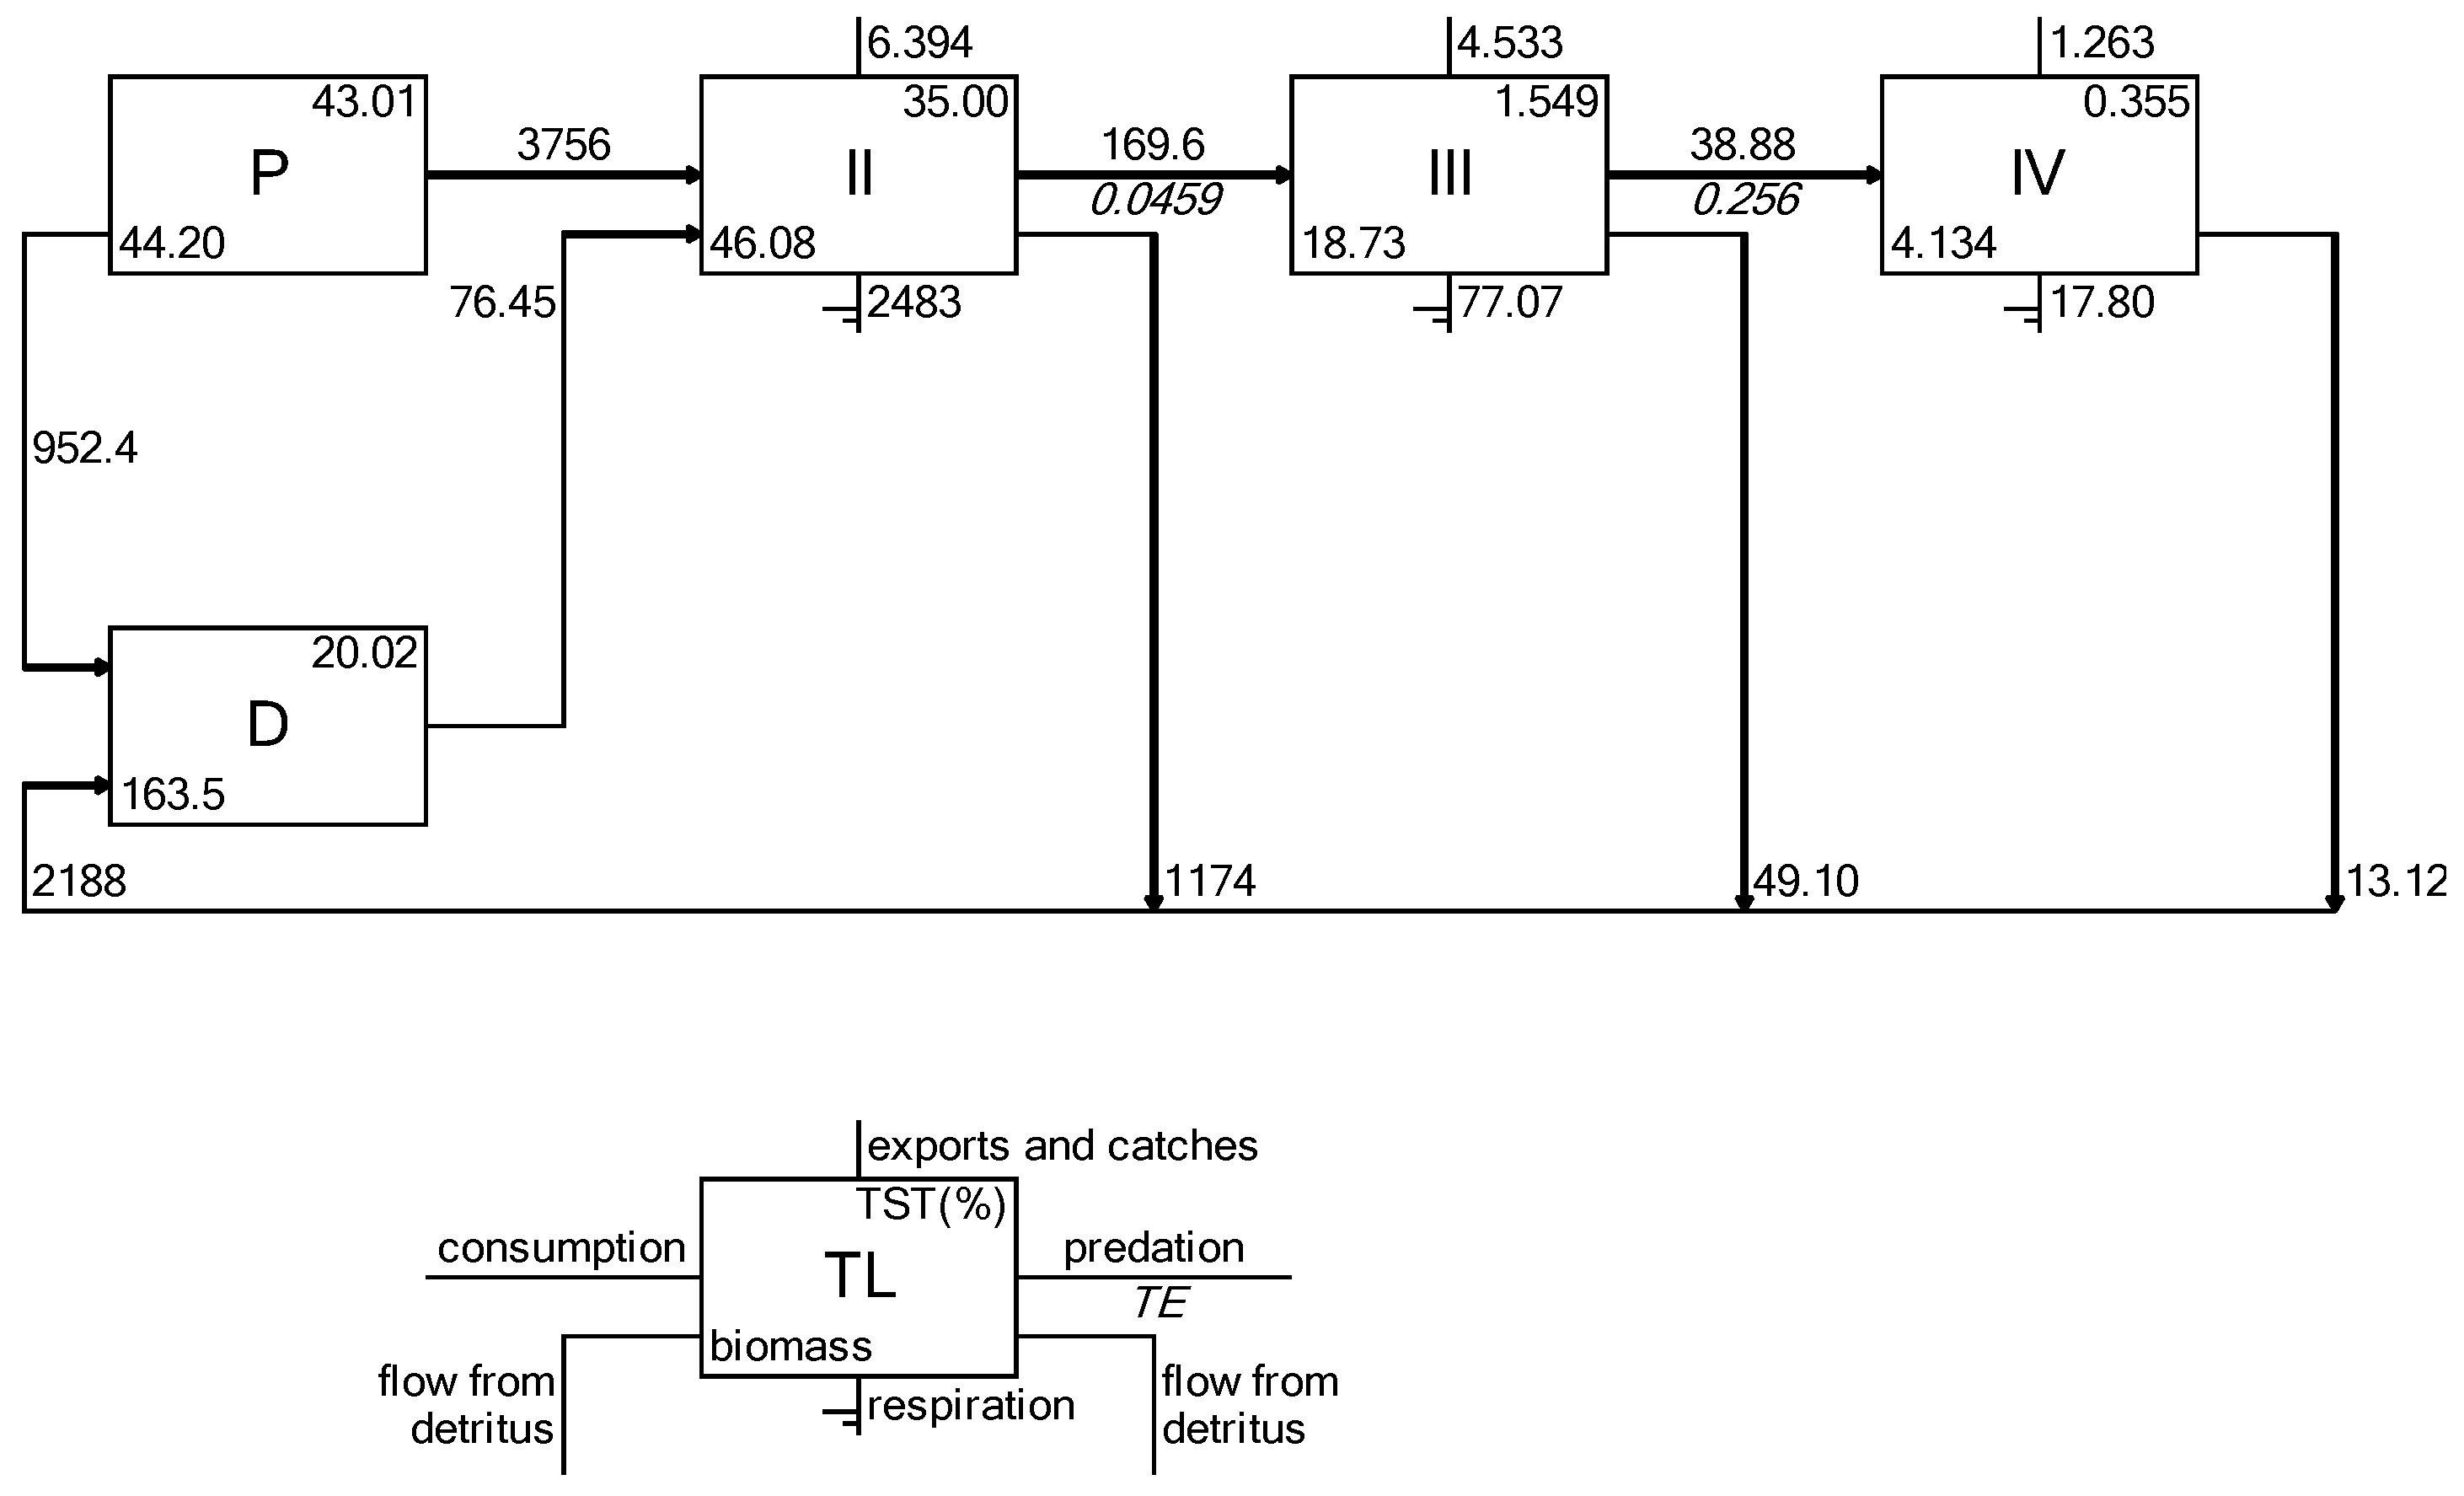
Figure A3.
Lindeman’s spine diagram for the TB ecosystem during La Niña events. Lindeman spine showing trophic flows among integer trophic levels (TL). Primary producer (P); detritus (D); Total system throughput (TST); Transfer efficiency (TE).
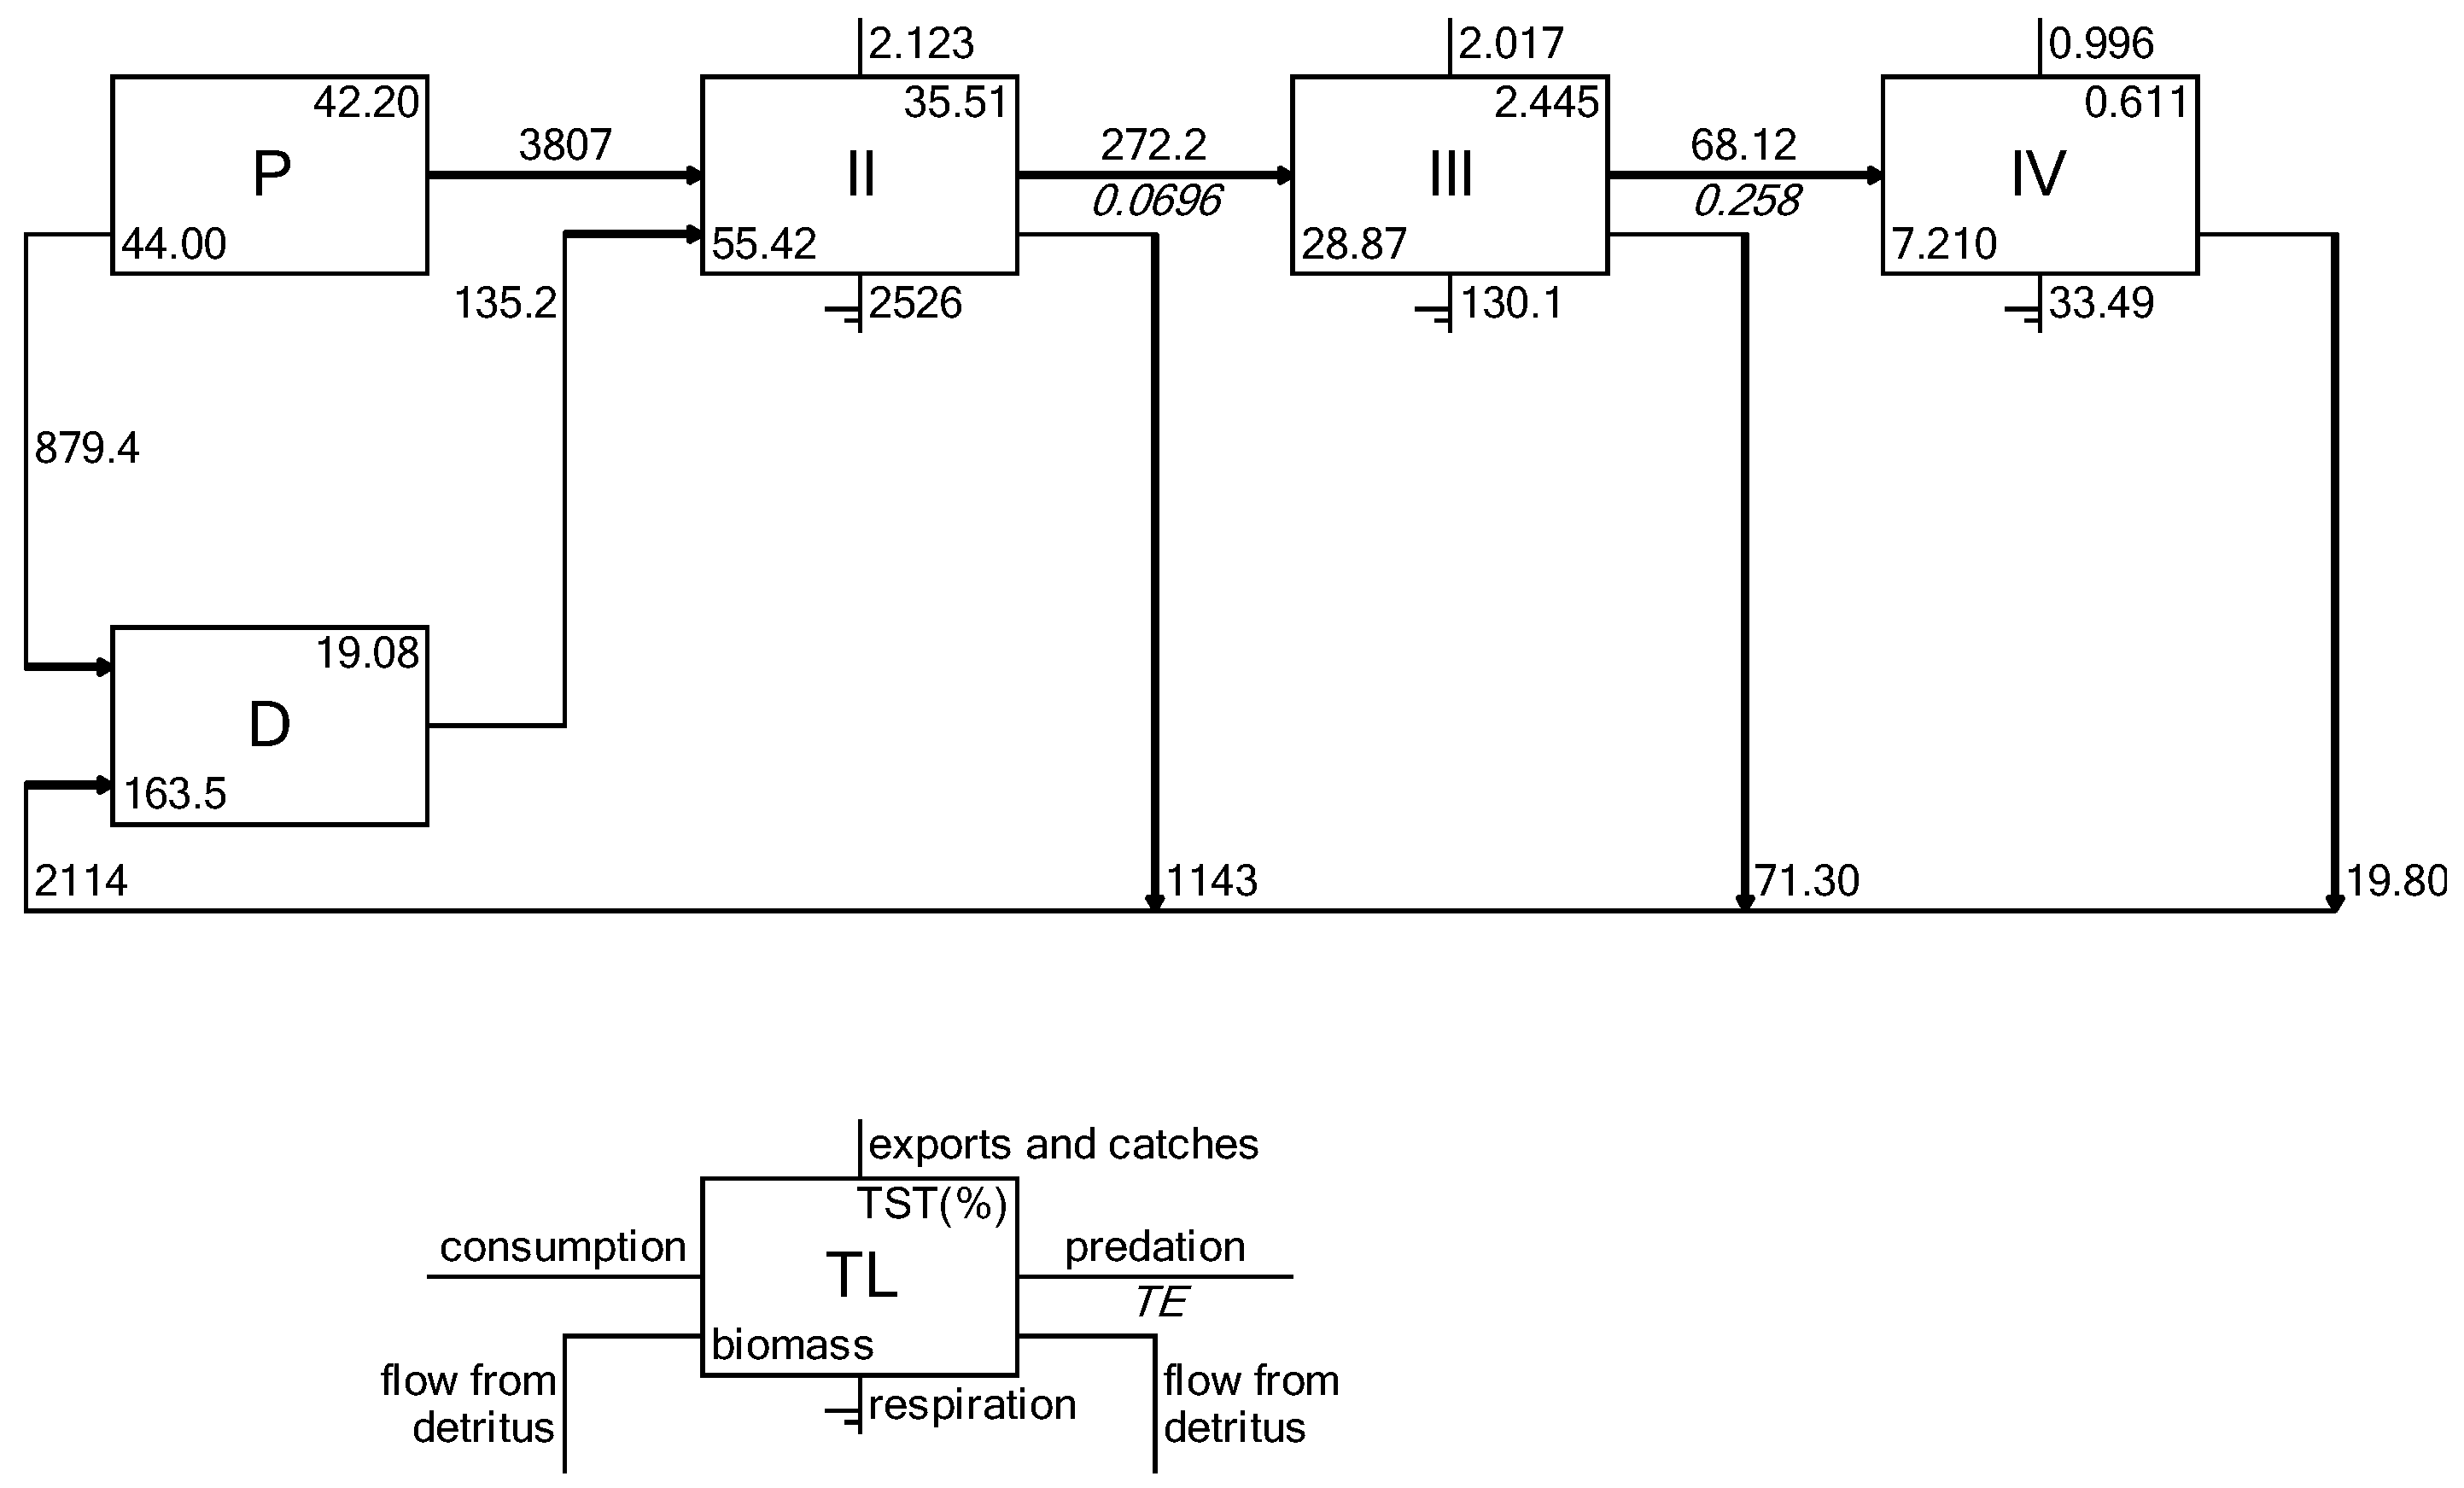
Figure A4.
KSi and relative total impact on the groups from TB ecosystem model during El Niño and La Niña events. Top-3 species with high KSi shown in bold.
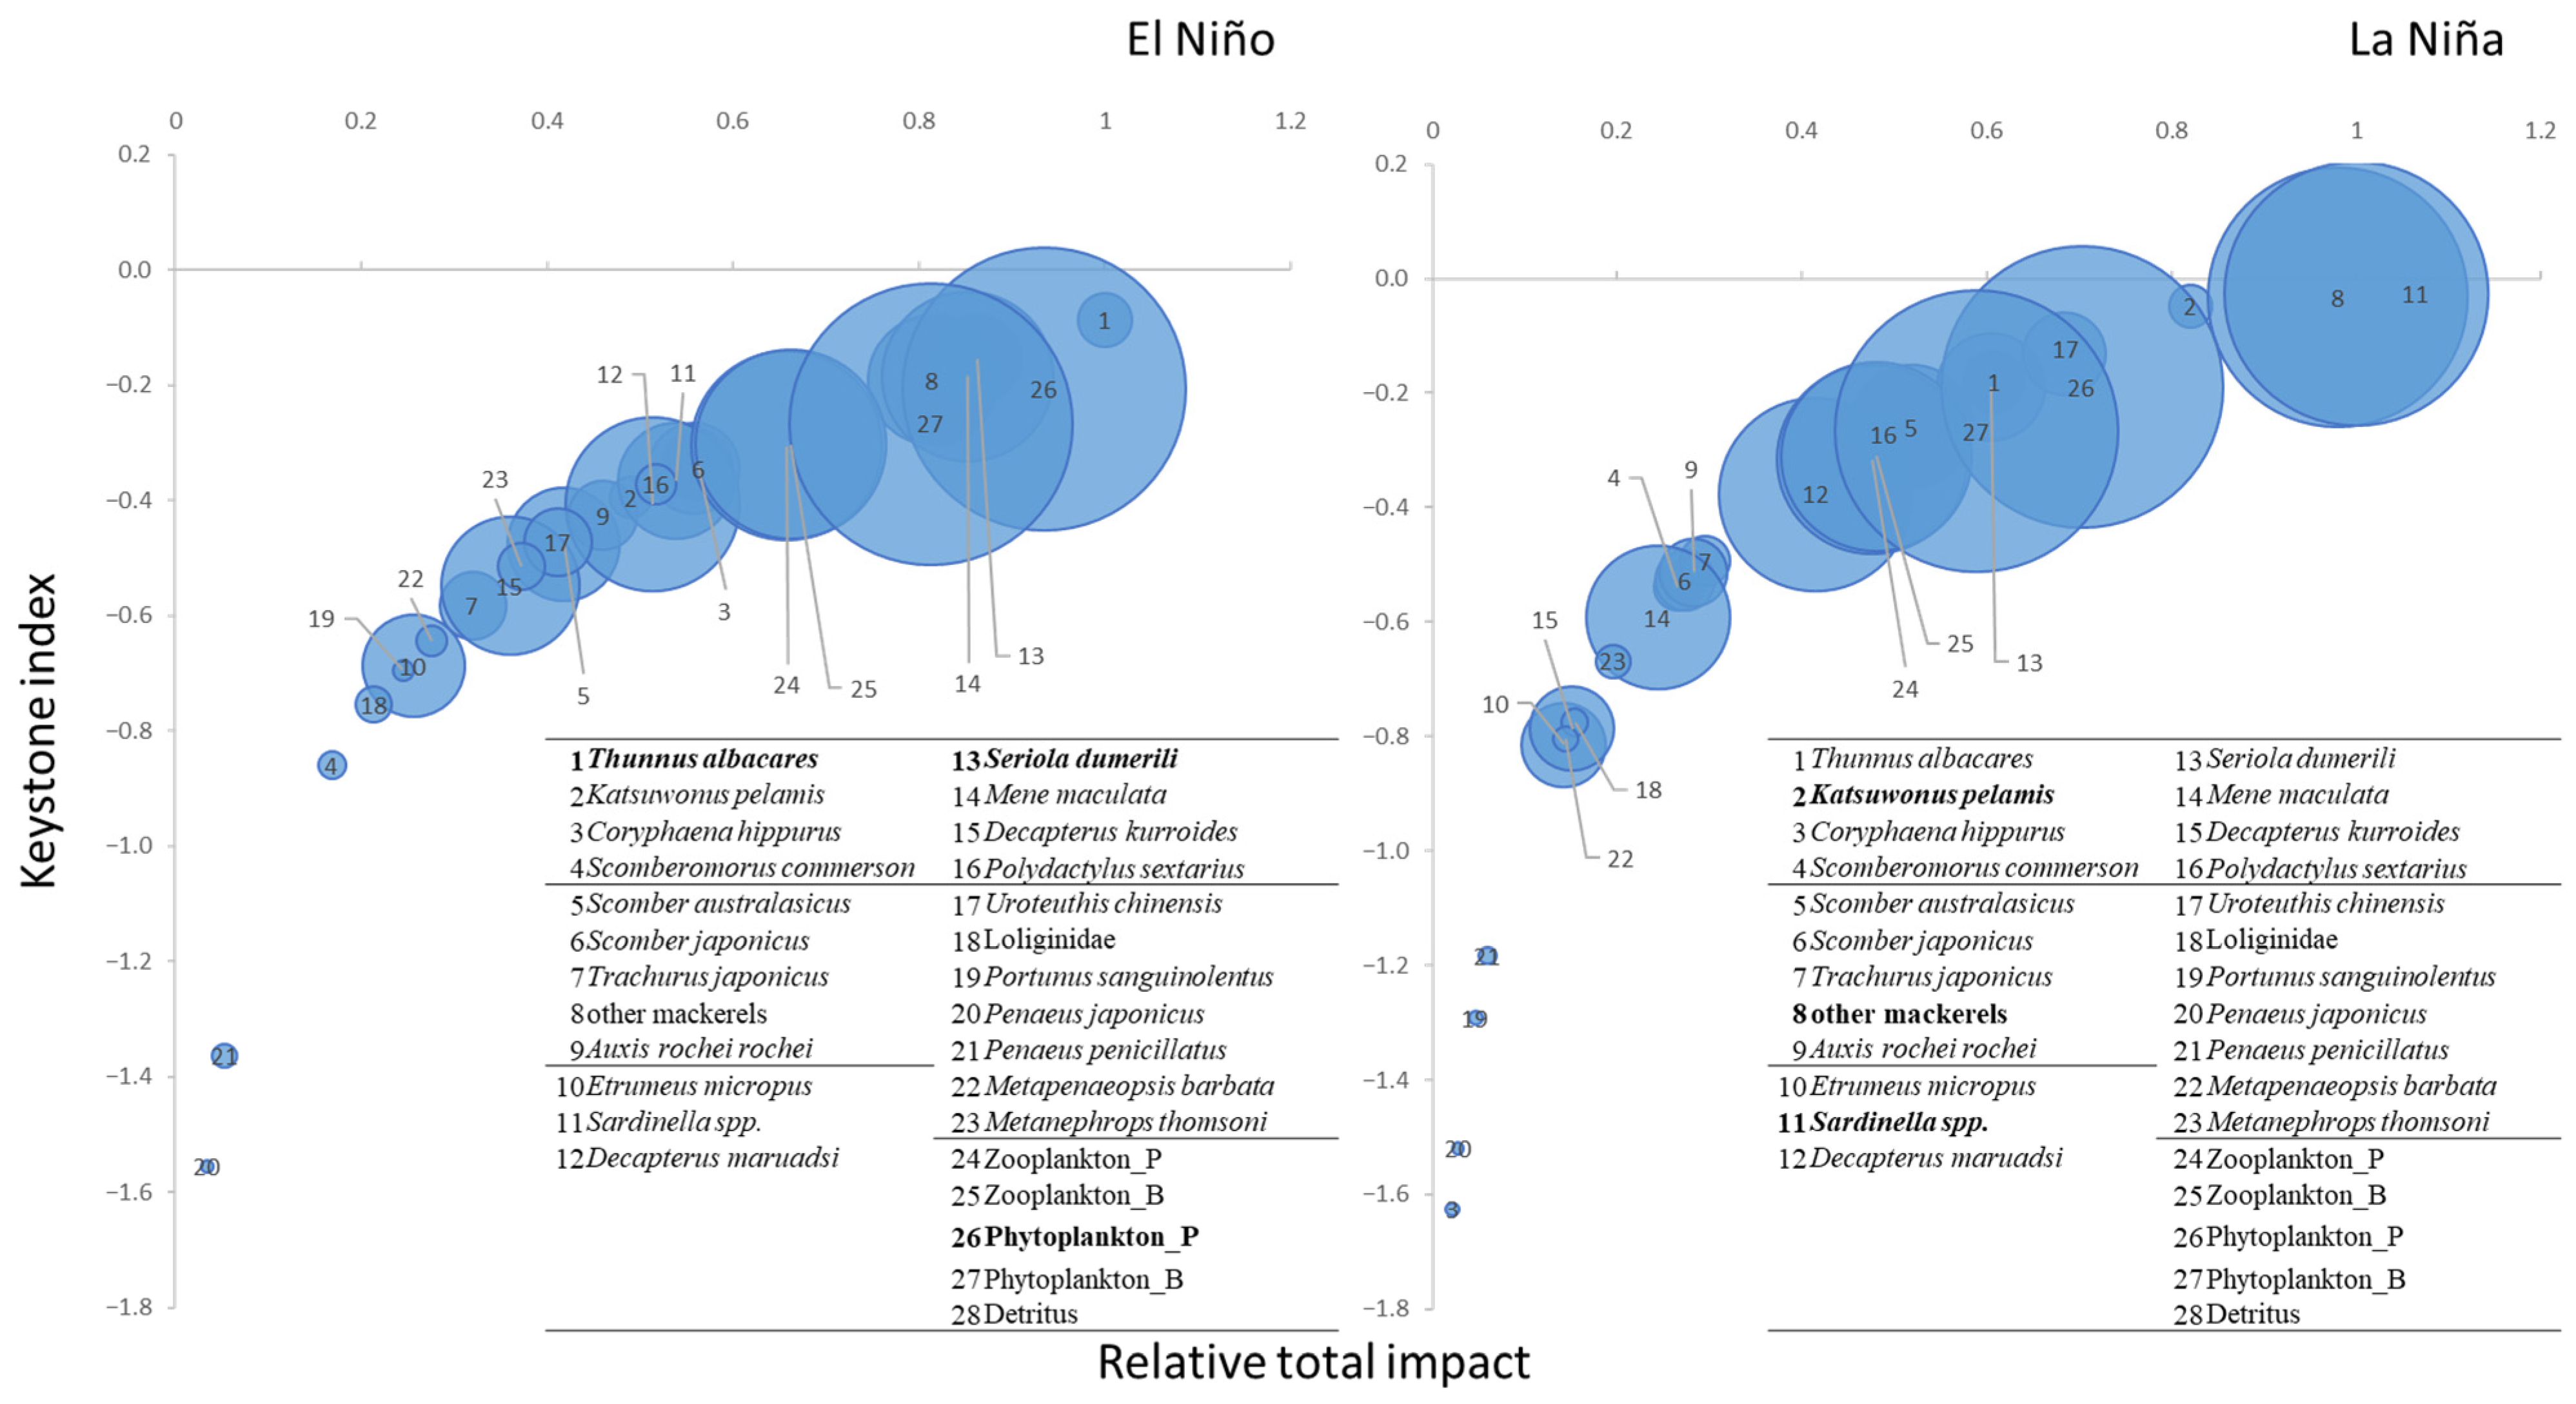
Table A1.
Diet composition matrix for the TB ecosystem during normal years.
Table A2.
Diet composition matrix for the TB ecosystem during El Niño events.
Table A3.
Diet composition matrix for the TB ecosystem during La Niña events.
Table A4.
Input and output parameters of the TB Ecopath model during normal years.
Table A5.
Input and output parameters of the TB Ecopath model during El Niño events.
Table A6.
Input and output parameters of the TB Ecopath model during La Niña events.
Table A7.
Keystoneness index and relative total impact.
References
- Barrier, N.; Lengaigne, M.; Rault, J.; Person, R.; Ethé, C.; Aumont, O.; Maury, O. Mechanisms underlying the epipelagic ecosystem response to ENSO in the equatorial Pacific ocean. Prog. Oceanogr. 2023, 213, 103002. [Google Scholar] [CrossRef] [Scilit]
- Holbrook, N.J.; Claar, D.C.; Hobday, A.J.; McInnes, K.L.; Oliver, E.C.J.; Gupta, A.S.; Widlansky, M.J.; Zhang, X. ENSO-Driven Ocean Extremes and Their Ecosystem Impacts. Geophys. Monogr. Ser. 2020, 253, 409–428. [Google Scholar] [CrossRef] [Scilit]
- Zhang, K.; Li, M.; Li, J.; Sun, M.; Xu, Y.; Cai, Y.; Chen, Z.; Qiu, Y. Climate-induced small pelagic fish blooms in an overexploited marine ecosystem of the South China Sea. Ecol. Indic. 2022, 145, 109598. [Google Scholar] [CrossRef] [Scilit]
- Hong, H.; Chai, F.; Zhang, C.; Huang, B.; Jiang, Y.; Hu, J. An overview of physical and biogeochemical processes and ecosystem dynamics in the Taiwan Strait. Cont. Shelf Res. 2011, 31, S3–S12. [Google Scholar] [CrossRef] [Scilit]
- Chen, W.; Feng, J.; Wu, R. Roles of ENSO and PDO in the link of the east asian winter monsoon to the following summer monsoon. J. Clim. 2013, 26, 622–635. [Google Scholar] [CrossRef] [Scilit]
- Hsiao, P.Y.; Shimada, T.; Lan, K.W.; Lee, M.A.; Liao, C.H. Assessing summertime primary production required in changed marine environments in upwelling ecosystems around the taiwan bank. Remote Sens. 2021, 13, 765. [Google Scholar] [CrossRef] [Scilit]
- Wu, Y.L.; Lee, M.A.; Chen, L.C.; Chan, J.W.; Lan, K.W. Evaluating a suitable aquaculture site selection model for Cobia (Rachycentron canadum) during extreme events in the Inner Bay of the Penghu Islands, Taiwan. Remote Sens. 2020, 12, 2689. [Google Scholar] [CrossRef] [Scilit]
- Naimullah, M.; Wu, Y.L.; Lee, M.A.; Lan, K.W. Effect of the El Niño–Southern Oscillation (ENSO) Cycle on the Catches and Habitat Patterns of Three Swimming Crabs in the Taiwan Strait. Front. Mar. Sci. 2021, 8, 763543. [Google Scholar] [CrossRef] [Scilit]
- Doney, S.C.; Ruckelshaus, M.; Emmett Duffy, J.; Barry, J.P.; Chan, F.; English, C.A.; Galindo, H.M.; Grebmeier, J.M.; Hollowed, A.B.; Knowlton, N.; et al. Climate change impacts on marine ecosystems. Ann. Rev. Mar. Sci. 2012, 4, 11–37. [Google Scholar] [CrossRef] [Scilit]
- Surma, S.; Christensen, V.; Kumar, R.; Ainsworth, C.H.; Pitcher, T.J. High-resolution trophic models reveal structure and function of a northeast pacific ecosystem. Front. Mar. Sci. 2019, 6, 625. [Google Scholar] [CrossRef] [Scilit]
- Santora, J.A.; Hazen, E.L.; Schroeder, I.D.; Bograd, S.J.; Sakuma, K.M.; Field, J.C. Impacts of ocean climate variability on biodiversity of pelagic forage species in an upwelling ecosystem. Mar. Ecol. Prog. Ser. 2017, 580, 205–220. [Google Scholar] [CrossRef] [Scilit]
- Thompson, A.R.; Harvey, C.J.; Sydeman, W.J.; Barceló, C.; Bograd, S.J.; Brodeur, R.D.; Fiechter, J.; Field, J.C.; Garfield, N.; Good, T.P.; et al. Indicators of pelagic forage community shifts in the California Current Large Marine Ecosystem, 1998–2016. Ecol. Indic. 2019, 105, 215–228. [Google Scholar] [CrossRef] [Scilit]
- Moran, J.R.; Heintz, R.A.; Straley, J.M.; Vollenweider, J.J. Regional variation in the intensity of humpback whale predation on Pacific herring in the Gulf of Alaska. Deep. Sea Res. Part II Top. Stud. Oceanogr. 2018, 147, 187–195. [Google Scholar] [CrossRef] [Scilit]
- Straley, J.M.; Moran, J.R.; Boswell, K.M.; Vollenweider, J.J.; Heintz, R.A.; Quinn, T.J.; Witteveen, B.H.; Rice, S.D. Seasonal presence and potential influence of humpback whales on wintering Pacific herring populations in the Gulf of Alaska. Deep. Sea Res. Part II Top. Stud. Oceanogr. 2018, 147, 173–186. [Google Scholar] [CrossRef] [Scilit]
- Hu, J.; Kawamura, H.; Hong, H.; Pan, W. A review of research on the upwelling in the Taiwan Strait. Bull. Mar. Sci. 2003, 73, 605–628. [Google Scholar]
- Lan, K.W.; Kawamura, H.; Lee, M.A.; Chang, Y.; Chan, J.W.; Liao, C.H. Summertime sea surface temperature fronts associated with upwelling around the Taiwan Bank. Cont. Shelf Res. 2009, 29, 903–910. [Google Scholar] [CrossRef] [Scilit]
- Jennings, S.; Kaiser, M.J. The effects of fishing on marine ecosystems. Adv. Mar. Biol. 1998, 34, 201–352. [Google Scholar] [CrossRef] [Scilit]
- Dadswell, M.; Spares, A.; Reader, J.; McLean, M.; McDermott, T.; Samways, K.; Lilly, J. The Decline and Impending Collapse of the Atlantic Salmon (Salmo salar) Population in the North Atlantic Ocean: A Review of Possible Causes. Rev. Fish. Sci. Aquac. 2022, 30, 215–258. [Google Scholar] [CrossRef] [Scilit]
- Adebola, T.; de Mutsert, K. Compartive network analyses for Nigerian coastal waters using two ecopath models developed for the years 1985 and 2000. Fish. Res. 2019, 213, 33–41. [Google Scholar] [CrossRef] [Scilit]
- Ju, P.; Chen, M.; Cheung, W.W.L.; Tian, Y.; Yang, S.; Sun, P.; Jiang, C.; Lu, Z. Modelling the structure and functioning of an upwelling ecosystem in the Southern Taiwan Strait, China. J. Mar. Syst. 2022, 226, 103666. [Google Scholar] [CrossRef] [Scilit]
- Lindeman, R.L. The Trophic-Dynamic Aspect of Ecology. Ecology 1942, 23, 399–417. [Google Scholar] [CrossRef] [Scilit]
- Tilman, D.; Reich, P.B.; Isbell, F. Biodiversity impacts ecosystem productivity as much as resources, disturbance, or herbivory. Proc. Natl. Acad. Sci. 2012, 109, 10394–10397. [Google Scholar] [CrossRef] [Scilit]
- Heath, M.R.; Speirs, D.C.; Steele, J.H. Understanding patterns and processes in models of trophic cascades. Ecol. Lett. 2014, 17, 101–114. [Google Scholar] [CrossRef] [Scilit]
- Poisot, T.; Mouquet, N.; Gravel, D. Trophic complementarity drives the biodiversity–ecosystem functioning relationship in food webs. Ecol. Lett. 2013, 16, 853–861. [Google Scholar] [CrossRef] [Scilit] [PubMed]
- Frank, K.T.; Petrie, B.; Fisher, J.A.D.; Leggett, W.C. Transient dynamics of an altered large marine ecosystem. Nature 2011, 477, 86–89. [Google Scholar] [CrossRef] [Scilit]
- Worm, B.; Barbier, E.B.; Beaumont, N.; Duffy, J.E.; Folke, C.; Halpern, B.S.; Jackson, J.B.C.; Lotze, H.K.; Micheli, F.; Palumbi, S.R.; et al. Impacts of biodiversity loss on ocean ecosystem services. Science 2006, 314, 787–790. [Google Scholar] [CrossRef] [Scilit] [PubMed]
- Halpern, B.S.; Selkoe, K.A.; Micheli, F.; Kappel, C.V. Evaluating and ranking the vulnerability of global marine ecosystems to anthropogenic threats. Conserv. Biol. 2007, 21, 1301–1315. [Google Scholar] [CrossRef] [Scilit]
- Heymans, J.J.; Coll, M.; Libralato, S.; Morissette, L.; Christensen, V. Global patterns in ecological indicators of marine food webs: A modelling approach. PLoS ONE 2014, 9, e95845. [Google Scholar] [CrossRef] [Scilit]
- Libralato, S.; Caccin, A.; Pranovi, F. Modeling species invasions using thermal and trophic niche dynamics under climate change. Front. Mar. Sci. 2015, 2, 29. [Google Scholar] [CrossRef] [Scilit]
- Jørgensen, S.E. Exergy and ecology. Ecol. Modell. 1992, 63, 185–214. [Google Scholar] [CrossRef] [Scilit]
- Pauly, D.; Christensen, V.; Dalsgaard, J.; Froese, R.; Torres, F. Fishing down marine food webs. Science 1998, 279, 860–863. [Google Scholar] [CrossRef] [Scilit] [PubMed]
- Fulton, E.A. Approaches to end-to-end ecosystem models. J. Mar. Syst. 2010, 81, 171–183. [Google Scholar] [CrossRef] [Scilit]
- Smith, M.D.; Fulton, E.A.; Day, R.W. Using an Atlantis model of the southern Benguela to explore the response of ecosystem indicators for fisheries management. Environ. Model. Softw. 2015, 69, 23–41. [Google Scholar] [CrossRef] [Scilit]
- Coll, M.; Steenbeek, J. Standardized ecological indicators to assess aquatic food webs: The ECOIND software plug-in for Ecopath with Ecosim models. Environ. Model. Softw. 2017, 89, 120–130. [Google Scholar] [CrossRef] [Scilit]
- Odum, E.P. The Strategy of Ecosystem Development An understanding of ecological succession provides a basis for resolving man’s conflict with nature. Adv. Sci. 1969, 164, 262–270. [Google Scholar]
- Christensen, V.; Walters, C.J. Ecopath with Ecosim: Methods, capabilities and limitations. Ecol. Modell. 2004, 172, 109–139. [Google Scholar] [CrossRef] [Scilit]
- Watari, S.; Murase, H.; Yonezaki, S.; Okazaki, M.; Kiyofuji, H.; Tamura, T.; Hakamada, T.; Kanaji, Y.; Kitakado, T. Ecosystem modeling in the western North Pacific using Ecopath, with a focus on small pelagic fishes. Mar. Ecol. Prog. Ser. 2019, 617, 295–305. [Google Scholar] [CrossRef] [Scilit]
- Woodward, G.; Perkins, D.M.; Brown, L.E. Climate change and freshwater ecosystems: Impacts across multiple levels of organization. Philos. Trans. R. Soc. B Biol. Sci. 2010, 365, 2093–2106. [Google Scholar] [CrossRef] [Scilit]
- Christensen, V. Ecosystem maturity—Towards quantification. Ecol. Modell. 1995, 77, 3–32. [Google Scholar] [CrossRef] [Scilit]
- Duan, L.J.; Li, S.Y.; Liu, Y.; Moreau, J.; Christensen, V. Modeling changes in the coastal ecosystem of the Pearl River Estuary from 1981 to 1998. Ecol. Modell. 2009, 220, 2802–2818. [Google Scholar] [CrossRef] [Scilit]
- Pikitch, E.K.; Santora, C.; Babcock, E.A.; Bakun, A.; Bonfil, R.; Conover, D.O.; Dayton, P.; Doukakis, P.; Fluharty, D.; Heneman, B.; et al. Ecosystem-based fishery management. Science 2004, 305, 346–347. [Google Scholar] [CrossRef] [Scilit]
- Ho, C.H.; Chen, J.L.; Nobuyuki, Y.; Lur, H.S.; Lu, H.J. Mitigating uncertainty and enhancing resilience to climate change in the fisheries sector in Taiwan: Policy implications for food security. Ocean. Coast Manag. 2016, 130, 355–372. [Google Scholar] [CrossRef] [Scilit]
- Lan, K.W.; Zhang, C.I.; Kang, H.J.; Wu, L.J.; Lian, L.J. Impact of Fishing Exploitation and Climate Change on the Grey Mullet Mugil cephalus Stock in the Taiwan Strait. Mar. Coast. Fish. 2017, 9, 271–280. [Google Scholar] [CrossRef] [Scilit]
- Froese, R.; Pauly, D. Fishbase. World Wide Web Electronic Publication. Version (01/2023). 2023. Available online: https://www.fishbase.de (accessed on 19 August 2022).
- Christensen, V.; Walters, C.J.; Pauly, D.; Forrest, R. Ecopath with Ecosim Version 6 User Guide; Fisheries Centre, University of British Columbia: Vancouver, BC, Canada, 2008; p. 281. [Google Scholar]
- Heymans, J.J.; Coll, M.; Link, J.S.; Mackinson, S.; Steenbeek, J.; Walters, C.; Christensen, V. Best practice in Ecopath with Ecosim food-web models for ecosystem-based management. Ecol. Modell. 2016, 331, 173–184. [Google Scholar] [CrossRef] [Scilit]
- Gulland, J.A. The fish resources of the ocean. In Fishing News [For the Food and Agriculture Organization]; Fishing News Ltd.: Surrey, UK, 1971. [Google Scholar]
- Ullah, M.H.; Rashed-Un-Nabi, M.; Al-Mamun, M.A. Trophic model of the coastal ecosystem of the Bay of Bengal using mass balance Ecopath model. Ecol. Model. 2012, 225, 82–94. [Google Scholar] [CrossRef] [Scilit]
- Morel, A.; Berthon, J.-F. Surface pigments, algal biomass profiles, and potential production of the euphotic layer: Relationships reinvestigated in view of remote-sensing applications. Limnol. Ocean. 1989, 34, 1545–1562. [Google Scholar] [CrossRef] [Scilit]
- Link, J.; Griswold, C.; Methratta, T.; Gunnrd, J. Documentation for the Energy Modeling and Analysis Exercise (EMAX). In Northeast Fisheries Science Center Reference Document 6; NOAA: Woods Hole, MA, USA, 2006. [Google Scholar]
- Ye, X. Particulate Organic Carbon and Suspended Particle Size Spectra in the Southern Taiwan Strait during Summer; Xiamen University: Xiamen, China, 2007. [Google Scholar]
- Duan, L.J. Modeling and Analysis Ecopath Model in the Coastal Ecosystem of the Pearl River Estuary; Sun Yat-sen University: Guangzhou, China, 2005. [Google Scholar]
- Lin, Q.; Jin, X.; Zhang, B. Trophic interactions, ecosystem structure and function in the southern Yellow Sea. Chin. J. Oceanol. Limnol. 2013, 31, 46–58. [Google Scholar] [CrossRef] [Scilit]
- Wang, X. Establishment of EwE Model of Marine Ecosystem in Northern Continental Shelf of South China Sea; Sun Yat-sen University: Guangzhou, China, 2005. [Google Scholar]
- Wang, D.; Lin, Z.J. Spatial and temporal variations of fish community structure in the Pearl River Estuary waters. South China Fish. Sci. 2006, 2, 37–45. (In Chinese) [Google Scholar]
- Lee, C.L.; Lin, W.J.; Liu, P.J.; Shao, K.T.; Lin, H.J. Highly productive tropical seagrass beds support diverse consumers and a large organic carbon pool in the sediments. Diversity 2021, 13, 544. [Google Scholar] [CrossRef] [Scilit]
- Piroddi, C.; Coll, M.; Steenbeek, J.; Moy, D.M.; Christensen, V. Modelling the Mediterranean marine ecosystem as a whole: Addressing the challenge of complexity. Mar. Ecol. Prog. Ser. 2015, 533, 47–65. [Google Scholar] [CrossRef] [Scilit]
- Ulanowicz, R.E. Growth and Development: Ecosystems Phenomenology; Springer Science & Business Media: Berlin/Heidelberg, Germany, 2012. [Google Scholar]
- Finn, J.T. Measures of ecosystem structure and function derived from analysis of flows. J. Theor. Biol. 1976, 56, 363–380. [Google Scholar] [CrossRef] [Scilit] [PubMed]
- Libralato, S.; Christensen, V.; Pauly, D. A method for identifying keystone species in food web models. Ecol. Modell. 2006, 195, 153–171. [Google Scholar] [CrossRef] [Scilit]
- Ulanowicz, R.E.; Puccia, C.J. Mixed Trophic Impacts in Ecosystems. Coenoses 1990, 5, 7–16. [Google Scholar]
- Rahman, M.F.; Al, M.A.; Akhtar, A.; Hoque, M.N.; Shafiqul Islam, M.; Sikder, M.N.A.; Barman, P.P. Structural patterns of fisheries communities with relation to ecological condition in subtropical coastal waters of the northern Bay of Bengal, Bangladesh. Indian J. Geo-Mar. Sci. 2019, 48, 1720–1732. [Google Scholar]
- Giralt Paradell, O.; Díaz López, B.; Methion, S.; Rogan, E. Food-web interactions in a coastal ecosystem influenced by upwelling and terrestrial runoff off North-West Spain. Mar. Environ. Res. 2020, 157, 104933. [Google Scholar] [CrossRef] [Scilit]
- Cross, W.F.; Wallace, J.B.; Rosemond, A.D.; Eggert, S.L. Whole-system nutrient enrichment increases secondary production in a detritus-based ecosystem. Ecology 2006, 87, 1556–1565. [Google Scholar] [CrossRef] [Scilit]
- Zhang, Y.; Richardson, J.S.; Negishi, J.N. Detritus processing, ecosystem engineering and benthic diversity: A test of predator-omnivore interference. J. Anim. Ecol. 2004, 73, 756–766. [Google Scholar] [CrossRef] [Scilit]
- Pauly, D.; Christensen, V. Primary production required to sustain global fisheries. Nature 1995, 374, 255–257. [Google Scholar] [CrossRef] [Scilit]
- Ju, P.; Cheung, W.W.L.; Chen, M.; Xian, W.; Yang, S.; Xiao, J. Comparing marine ecosystems of Laizhou and Haizhou Bays, China, using ecological indicators estimated from food web models. J. Mar. Syst. 2020, 202, 103238. [Google Scholar] [CrossRef] [Scilit]
- Jiang, H.; Cheng, H.Q.; Xu, H.G.; Arreguín-Sánchez, F.; Zetina-Rejón, M.J.; Del Monte Luna, P.; Le Quesne, W.J.F. Trophic controls of jellyfish blooms and links with fisheries in the East China Sea. Ecol. Model. 2008, 212, 492–503. [Google Scholar] [CrossRef] [Scilit]
- Cheung, W.L. Vulnerability of Marine Fishes to Fishing: From Global Overview to the Northern South China Sea; University of British Columbia: Vancouver, BC, Canada, 2007. [Google Scholar]
- Ma, S.; Cheng, J.; Li, J.; Liu, Y.; Wan, R.; Tian, Y. Interannual to decadal variability in the catches of small pelagic fishes from China Seas and its responses to climatic regime shifts. Deep. Sea Res. Part II Top. Stud. Oceanogr. 2019, 159, 112–129. [Google Scholar] [CrossRef] [Scilit]
- Cheng, J.; Cheung, W.W.L.; Pitcher, T.J. Mass-balance ecosystem model of the East China Sea. Prog. Nat. Sci. 2009, 19, 1271–1280. [Google Scholar] [CrossRef] [Scilit]
- Kim, D.H.; Seo, J.N.; Kim, H.S.; Lee, K. Estimation of productivity growth, technical progress, and efficiency changes in the Korean offshore fisheries. Fish. Sci. 2012, 78, 743–751. [Google Scholar] [CrossRef] [Scilit]
- Switzer, T.S.; Keenan, S.F.; Stevens, P.W.; McMichael, R.H.; MacDonald, T.C. Incorporating Ecology into Survey Design: Monitoring the Recruitment of Age-0 Gags in the Eastern Gulf of Mexico. N. Am. J. Fish. Manag. 2015, 35, 1132–114335. [Google Scholar] [CrossRef] [Scilit]
- Flannery, E.; Przeslawski, R. Comparison of sampling methods to assess benthic marine biodiversity. In Are Spatial and Ecological Relationships Consistent among Sampling Gear? Geoscience Australia: Canberra, Australia, 2015. [Google Scholar]
- La Peyre, M.K.; Sable, S.; Taylor, C.; Watkins, K.S.; Kiskaddon, E.; Baustian, M. Effects of sample gear on estuarine nekton assemblage assessments and food web model simulations. Ecol. Indic. 2021, 133, 108404. [Google Scholar] [CrossRef] [Scilit]
- Frederiksen, M.; Edwards, M.; Richardson, A.J.; Halliday, N.C.; Wanless, S. From plankton to top predators: Bottom-up control of a marine food web across four trophic levels. J. Anim. Ecol. 2006, 75, 1259–1268. [Google Scholar] [CrossRef] [Scilit]
- Krebs, C.J. The experimental analysis of distribution and abundance. In Ecology: The Experimental Analysis of Distribution and Abundance, 6th ed.; Benjamin Cummings: San Francisco, CA, USA, 2009. [Google Scholar]
- Shannon, L.; Coll, M.; Bundy, A.; Gascuel, D.; Heymans, J.J.; Kleisner, K.; Lynam, C.P.; Piroddi, C.; Tam, J.; Travers-Trolet, M. Trophic level-based indicators to track fishing impacts across marine ecosystems. Mar. Ecol. Prog. Ser. 2014, 512, 115–140. [Google Scholar] [CrossRef] [Scilit]
- Hunter, M.D.; Price, P.W. Playing chutes and ladders: Heterogeneity and the relative roles of bottom-up and top-down forces in natural communities. Ecology 1992, 73, 724–732. [Google Scholar] [CrossRef] [Scilit]
- Li, B.; Liao, C.H.; Zhang, X.D.; Chen, H.L.; Wang, Q.; Chen, Z.Y.; Gan, X.J.; Wu, J.H.; Zhao, B.; Ma, Z.J.; et al. Spartina alterniflora invasions in the Yangtze River estuary, China: An overview of current status and ecosystem effects. Ecol. Eng. 2009, 35, 511–520. [Google Scholar] [CrossRef] [Scilit]
- Zeng, Z.; Cheung, W.W.L.; Li, S.; Hu, J.; Wang, Y. Effects of climate change and fishing on the Pearl River Estuary ecosystem and fisheries. Rev. Fish Biol. Fish. 2019, 29, 861–875. [Google Scholar] [CrossRef] [Scilit]
- Guénette, S.; Christensen, V.; Pauly, D. Trophic modelling of the Peruvian upwelling ecosystem: Towards reconciliation of multiple datasets. Prog. Oceanogr. 2008, 79, 326–335. [Google Scholar] [CrossRef] [Scilit]
- Baum, J.K.; Worm, B. Cascading top-down effects of changing oceanic predator abundances. J. Anim. Ecol. 2009, 78, 699–714. [Google Scholar] [CrossRef] [Scilit] [PubMed]
- Lynam, C.P.; Llope, M.; Möllmann, C.; Helaouët, P.; Bayliss-Brown, G.A.; Stenseth, N.C. Interaction between top-down and bottom-up control in marine food webs. Proc. Natl. Acad. Sci. USA 2017, 114, 1952–1957. [Google Scholar] [CrossRef] [Scilit]
- Wang, F.; Wu, Y.; Chen, Z.; Zhang, G.; Zhang, J.; Zheng, S.; Kattner, G. Trophic interactions of mesopelagic fishes in the south China sea illustrated by stable isotopes and fatty acids. Front. Mar. Sci. 2019, 5, 522. [Google Scholar] [CrossRef] [Scilit]
- Davison, P.C.; Checkley, D.M.; Koslow, J.A.; Barlow, J. Carbon export mediated by mesopelagic fishes in the northeast Pacific Ocean. Prog. Ocean. 2013, 116, 14–30. [Google Scholar] [CrossRef] [Scilit]
- Olivar, M.P.; Contreras, T.; Hulley, P.A.; Emelianov, M.; López-Pérez, C.; Tuset, V.; Castellón, A. Variation in the diel vertical distributions of larvae and transforming stages of oceanic fishes across the tropical and equatorial Atlantic. Prog. Oceanogr. 2018, 160, 83–100. [Google Scholar] [CrossRef] [Scilit]
- Surma, S.; Pakhomov, E.A.; Pitcher, T.J. Energy-based ecosystem modelling illuminates the ecological role of Northeast Pacific herring. Mar. Ecol. Prog. Ser. 2018, 588, 147–161. [Google Scholar] [CrossRef] [Scilit]
- Coll, M.; Shannon, L.J.; Moloney, C.L.; Palomera, I.; Tudela, S. Comparing trophic flows and fishing impacts of a NW Mediterranean ecosystem with coastal upwelling systems by means of standardized models and indicators. Ecol. Model. 2006, 198, 53–70. [Google Scholar] [CrossRef] [Scilit]
- Lan, K.W.; Lee, M.A.; Zhang, C.I.; Wang, P.Y.; Wu, L.J.; Lee, K.T. Effects of climate variability and climate change on the fishing conditions for grey mullet (Mugil cephalus L.) in the Taiwan Strait. Clim. Chang. 2014, 126, 189–202. [Google Scholar] [CrossRef] [Scilit]
- Lau, N.C.; Nath, M.J. ENSO modulation of the interannual and intraseasonal variability of the East Asian monsoon—A model study. J. Clim. 2006, 19, 4508–4530. [Google Scholar] [CrossRef] [Scilit]
- Yang, J.W.; Wu, W.; Chung, C.C.; Chiang, K.P.; Gong, G.C.; Hsieh, C.H. Predator and prey biodiversity relationship and its consequences on marine ecosystem functioning—Interplay between nanoflagellates and bacterioplankton. ISME J. 2018, 12, 1532–1542. [Google Scholar] [CrossRef] [Scilit] [PubMed]
- Young, J.W.; Hunt, B.P.V.; Cook, T.R.; Llopiz, J.K.; Hazen, E.L.; Pethybridge, H.R.; Ceccarelli, D.; Lorrain, A.; Olson, R.J.; Allain, V.; et al. The trophodynamics of marine top predators: Current knowledge, recent advances and challenges. Deep. Sea Res. Part II Top. Stud. Oceanogr. 2015, 113, 170–187. [Google Scholar] [CrossRef] [Scilit]
- Tam, J.; Taylor, M.H.; Blaskovic, V.; Espinoza, P.; Ballón, R.M.; Díaz, E.; Wosnitza-Mendo, C.; Argüelles, J.; Purca, S.; Ayón, P.; et al. Trophic modeling of the Northern Humboldt Current Ecosystem, part I: Comparing trophic linkages under La Niña and El Niño conditions. Prog. Oceanogr. 2008, 79, 352–365. [Google Scholar] [CrossRef] [Scilit]
- Del Solar, A.; Romagnoni, G.; Kluger, L.C.; Céspedes, C.M.S.; Wolff, M. Comparative food web analysis of two Peruvian bay systems along a latitudinal gradient: Resource use and the environmental envelope. Front. Mar. Sci. 2022, 9, 829424. [Google Scholar] [CrossRef] [Scilit]
- Dang, X.; Bai, Y.; Gong, F.; Chen, X.; Zhu, Q.; Huang, H.; He, X. Different Responses of Phytoplankton to the ENSO in Two Upwelling Systems of the South China Sea. Estuaries Coasts 2022, 45, 485–500. [Google Scholar] [CrossRef] [Scilit]
- Zhang, C. Responses of summer upwelling to recent climate changes in the Taiwan strait. Remote Sens. 2021, 13, 1386. [Google Scholar] [CrossRef] [Scilit]
- Cheng, Y.H.; Chang, M.H. Exceptionally cold water days in the southern Taiwan Strait: Their predictability and relation to la Niña. Nat. Hazards Earth Syst. Sci. 2018, 18, 1999–2010. [Google Scholar] [CrossRef] [Scilit]
- Christensen, V.; Walters, C.J.; Pauly, D. Ecopath with Ecosim: A User’s Guide, November 2005 ed.; Fisheries Centre, University of British Columbia: Vancouver, BC, Canada, 2005; p. 154. [Google Scholar]
- Heymans, J.J.; Shannon, L.J.; Jarre, A. Changes in the northern Benguela ecosystem over three decades: 1970s, 1980s, and 1990s. Ecol. Modell. 2004, 172, 175–195. [Google Scholar] [CrossRef] [Scilit]
- Lee, W.H. Seasonal Ecosystem Structures and the Influence of Fishing Activities in the Southwestern Taiwan Straits. Master’s Thesis, National Taiwan Ocean University, Keelung, China, 2022. [Google Scholar]
- Papantoniou, G.; Giannoulaki, M.; Stoumboudi, M.T.; Lefkaditou, E.; Tsagarakis, K. Food web interactions in a human dominated Mediterranean coastal ecosystem. Mar. Environ. Res. 2021, 172, 105507. [Google Scholar] [CrossRef] [Scilit]
- Bruno, J.F.; Carr, L.A.; O’Connor, M.I. Exploring the role of temperature in the ocean through metabolic scaling. Ecology 2015, 96, 3126–3140. [Google Scholar] [CrossRef] [Scilit]
- Shokri, M.; Cozzoli, F.; Vignes, F.; Bertoli, M.; Pizzul, E.; Basset, A. Metabolic rate and climate change across latitudes: Evidence of mass-dependent responses in aquatic amphipods. J. Exp. Biol. 2022, 225, jeb244842. [Google Scholar] [CrossRef] [Scilit] [PubMed]
- Shokri, M.; Lezzi, L.; Basset, A. The seasonal response of metabolic rate to projected climate change scenarios in aquatic amphipods. J. Therm. Biol. 2024, 124, 103941. [Google Scholar] [CrossRef] [Scilit] [PubMed]
- Walters, C.; Christensen, V.; Pauly, D. Structuring dynamic models of exploited ecosystems from trophic mass-balance assessments. Rev. Fish Biol. Fish. 1997, 7, 139–172. [Google Scholar] [CrossRef] [Scilit]
- Crozier, L.G.; McClure, M.M.; Beechie, T.; Bograd, S.J.; Boughton, D.A.; Carr, M.; Cooney, T.D.; Dunham, J.B.; Greene, C.M.; Haltuch, M.A.; et al. Climate vulnerability assessment for Pacific salmon and steelhead in the California Current Large Marine Ecosystem. PLoS ONE 2019, 14, e0217711. [Google Scholar] [CrossRef] [Scilit]
- Free, C.M.; Jensen, O.P.; Anderson, S.C.; Gutierrez, N.L.; Kleisner, K.M.; Longo, C.; Minto, C.; Osio, G.C.; Walsh, J.C. Blood from a stone: Performance of catch-only methods in estimating stock biomass status. Fish Res. 2020, 223, 105452. [Google Scholar] [CrossRef] [Scilit]
- Lin, Y.S. Using Ecological Models to Evaluate the Impact of Offshore Wind Farm on Fishery Resources off Miaoli. Master’s Thesis, National Taiwan Ocean University, Keelung, China, 2022. [Google Scholar]
- Zhou, S.; Klaer, N.L.; Daley, R.M.; Zhu, Z.; Fuller, M.; Smith, A.D.M. Modelling multiple fishing gear efficiencies and abundance for aggregated populations using fishery or survey data. ICES J. Mar. Sci. 2014, 71, 2436–2447. [Google Scholar] [CrossRef] [Scilit]

Disclaimer/Publisher’s Note: The statements, opinions and data contained in all publications are solely those of the individual author(s) and contributor(s) and not of MDPI and/or the editor(s). MDPI and/or the editor(s) disclaim responsibility for any injury to people or property resulting from any ideas, methods, instructions or products referred to in the content. |
© 2024 by the authors. Licensee MDPI, Basel, Switzerland. This article is an open access article distributed under the terms and conditions of the Creative Commons Attribution (CC BY) license (https://creativecommons.org/licenses/by/4.0/).