


Abstract
Glioblastoma (GBM) is the most aggressive primary malignant brain tumor in adults. Therapeutic outcomes are severely limited by temozolomide (TMZ) chemoresistance and the immunosuppressive tumor microenvironment (TME). Glia maturation factor-γ (GMFG) is linked to cytoskeletal and myeloid remodeling in other cancers, yet its roles in glioma remain poorly explored. We integrated multi-omics analyses to dissect GMFG expression, clinical associations, epigenetic mechanisms, and immune association. CCK-8, Celigo scratch, Transwell, and Annexin V-APC apoptosis assays were performed to elucidate the biological function of GMFG in GBM. GMFG was prioritized based on overlapping hypoxia, isocitrate dehydrogenase (IDH)-wildtype and TMZ-resistance gene signatures. GMFG was upregulated and correlated with adverse clinical features. GMFG knockdown suppressed the cell viability, migration, and invasion of GBM cells and increased Annexin V-APC positivity. GMFG genetic alterations were rare, and CpG hypomethylation across multiple regulatory regions correlated with transcriptional activation; the hypomethylated group showed higher mRNA expression. GMFG K74 acetylation was elevated in GBM and correlated with protein abundance. At single-cell resolution, Chemo_TAM dominated the GMFG-high myeloid population; CellChat predicted prominent signaling pathways underlying tumor–Chemo_TAM crosstalk. GMFG expression positively correlated with immunosuppressive markers and several immune checkpoint molecules; OncoPredict identified candidate drugs with lower predicted IC50 in GMFG-high tumors. Integrated bioinformatic analyses suggest that GMFG is associated with the malignant phenotype and immune microenvironment in glioma, as well as epigenetic alterations—hypomethylation and K74 acetylation. In vitro, GMFG promoted the viability, migration, and invasion of GBM cells, and reduced Annexin V-APC positivity.
1. Introduction
Gliomas are the most common primary malignant brain tumors in adults, with GBM, the most aggressive subtype, accounting for approximately 57% of adult gliomas [1]. The annual incidence is approximately 3–4 per 100,000, with a dismal prognosis: median overall survival after standard treatment is only 14.6 months [2]. Maximal safe resection combined with radiotherapy and TMZ chemotherapy remains the standard of care for newly diagnosed GBM (ndGBM). In 2017, tumor-treating fields (TTFields) plus TMZ were approved, extending median survival to 20.9 months, yet the 5-year survival rate remains below 10% [3]. Clinical benefit remains limited, constrained by tumor heterogeneity, hypermutation, Warburg-effect metabolic reprogramming, and immune evasion [4]. TMZ fails in many patients through multiple mechanisms—unmethylated O6-methylguanine-DNA methyltransferase (MGMT) promoter status leading to elevated MGMT-mediated DNA repair, mismatch repair deficiency, aberrant base excision repair activation, and the self-renewal of tumor stem cells [5]. Genetic and epigenetic oncogenic alterations drive therapeutic resistance and represent actionable targets in GBM, while molecular profiling is critical for advancing personalized treatment strategies [6]. A subset of GBM tumors exhibits high MGMT expression owing to an unmethylated MGMT promoter. Notably, all-trans retinoic acid induces differentiation and downregulates stemness markers and MGMT expression in glioma stem cells (GSCs) [7]. Known molecular markers remain insufficient to fully explain TMZ resistance. Identifying novel resistance regulators is therefore urgently needed.
GBM is histologically defined by necrosis and/or microvascular proliferation (MVP) and exhibits diffuse infiltrative growth with poorly demarcated borders from the adjacent normal brain parenchyma [8]. Hypoxia, a core feature of the GBM microenvironment, not only shapes tumor architecture but also reprograms cellular energetics and broadly governs proliferation, migration, and invasion [9]. Under hypoxia, TMZ resistance in GBM is mediated via activation of the HIF-1α/PRMT6/G3BP1 signaling axis [10]. GSCs residing in perivascular and hypoxic niches represent the core cell subpopulation driving rapid proliferation, extensive infiltration, and resistance to standard therapies. Those cells harbor unique molecular profiles, and enhanced DNA repair capacity and metabolic plasticity, all of which collectively confer resistance to conventional therapeutic regimens [11]. These intertwined cellular and microenvironmental properties bridge malignant and immune phenotypes, positioning hypoxia-associated molecules as key modulators of the immune microenvironment. As a prototypical immunologically “cold” malignancy, GBM is hallmarked by pervasive immunosuppression, T-cell exclusion, and a low neoantigen burden. The TME is dominated by immunosuppressive myeloid cells, and its cellular composition is closely associated with disease progression and overall survival [12]. The GBM TME is highly heterogeneous and strongly immunosuppressive, sustaining tumor progression while complicating therapeutic intervention [13]. While chimeric antigen receptor T-cell (CAR-T) therapy and immune checkpoint inhibitors (ICIs) have demonstrated modest clinical promise, their overall therapeutic benefit in GBM remains largely limited [14]. Accordingly, identifying key molecules that remodel the TME is essential for refining the mechanistic understanding of GBM.
Glia maturation factor-γ (GMFG) belongs to the GMF gene family and acts as a key regulator of Arp2/3-mediated actin polymerization and cytoskeleton remodeling, thereby controlling cell motility [15,16]. Actin cytoskeleton remodeling contributes to chemoresistance, EMT, and cell adhesion-mediated drug resistance [17,18]. It governs membrane localization and drug efflux of ABC transporters, and modulates mitochondrial homeostasis, apoptosis, as well as nuclear actin-dependent DNA damage repair [19,20]. GMFG exerts diverse effects in inflammatory cells: it modulates neutrophil chemotaxis via the PAK1/2–p38 MAPK pathway [21]; it also regulates iron-metabolism proteins and augments IL-4/IL-13-induced polarization of tumor-associated macrophages (TAMs) toward an M2 phenotype [22]; and it participates in macrophage endocytosis, T-cell migratory adhesion, monocyte migratory adhesion, and B-cell chemotaxis [23,24,25,26]. A chordoma study further revealed that hypoxia induces paracrine GMFG secretion from Cancer-associated fibroblasts (CAFs), which recruits Secreted phosphoprotein 1 (SPP1)+ immunosuppressive macrophages via ITGB1 signaling, establishing a regulatory link among hypoxia, GMFG, and myeloid immune remodeling [27]. Collectively, these findings indicate that GMFG is involved in modulating the hypoxic tumor immune microenvironment and may be associated with chemoresistance via its cytoskeleton-regulatory properties. However, GMFG remains largely undercharacterized in GBM.
This study leveraged public databases to dissect how GMFG associates with malignant progression and immune microenvironment features in glioma. We integrated multi-omics data to profile GMFG expression and relate it to clinicopathologic, radiologic, and molecular features. GMFG acetylation and DNA methylation data were used to uncover epigenetic regulation of aberrant GMFG expression. Single-cell RNA-seq resolved GMFG-associated immune microenvironment patterning at cellular resolution, with emphasis on the GMFG-associated Chemo_TAM subset and its communication with tumor cells. Immune-marker correlation, drug-sensitivity prediction, and chemical–gene interaction analysis together assessed GMFG’s translational value. These findings may provide candidate biomarkers and interventional clues for glioma prognosis and precision therapy. In addition, functional and phenotypic validation assays in A-172 and U-87 MG cells were performed to examine the role of GMFG in GBM cell viability, migration, invasion, and apoptosis.
2. Results
2.1. Screening of GMFG, a Key Gene Associated with Glioma Malignant Phenotype and Drug Resistance
GBM is a highly malignant tumor with an extremely poor prognosis, attributable largely to its aggressive biology; the pervasive hypoxic microenvironment within GBM tissue is a key driver of malignant progression. Using published gene sets for EMT-like, invasion, metastasis (here, referring to intracranial infiltration within the brain rather than distant extracranial spread throughout the manuscript), proliferation, and hypoxia signature (Supplementary Table S1), We calculated gene set scores for each sample and stratified samples into high/low groups by the median (n = 966). Kaplan–Meier analysis showed that high scores for EMT-like (Figure 1A), invasion (Figure 1B), intracranial infiltration (Figure 1C), proliferation (Figure 1D), and hypoxia (Figure 1E) signature were each associated with significantly worse prognosis in glioma patients, indicating prognostic relevance of these five malignant phenotypes.
Figure 1.
Screening of the key gene GMFG. (A) A high epithelial–mesenchymal transition (EMT)-like score predicts poor prognosis. (B) A high invasion score predicts poor prognosis. (C) A high intracranial infiltration signature score predicts poor prognosis. (D) A high proliferation score predicts poor prognosis. (E) A high hypoxia signature score predicts poor prognosis. All survival analyses (A–E) were performed using the CGGA cohort dataset. The red line indicates the high signature-score group, and the black line indicates the low signa-ture-score group. (F) Malignant-phenotype gene sets enriched in hypoxic regions based on the Ivy-GAP dataset. (G,H) Spatial transcriptomics shows malignant-phenotype gene sets co-localized in hypoxic regions. (I) Robustness of spatial co-localization after restricting signatures to unique genes. (J) Volcano plot of differentially expressed genes (DEGs) between hypoxic and non-hypoxic regions using the Ivy-GAP dataset. (K) Volcano plot of DEGs between IDH-wildtype and -mutant gliomas using the CGGA cohort dataset. NS: not significant. (L) Volcano plot of DEGs between temozolomide (TMZ)-resistant and -sensitive groups by the GSE100736 dataset. NS: not significant. (M) Venn diagram of the intersection of upregulated genes from hypoxia, isocitrate dehydrogenase (IDH)-wildtype, and TMZ resistance. (N) Boxplots of GMFG differential expression in GBM vs. normal tissue by GEPIA. T—tumor; N—normal, *: p < 0.05. (O) Survival curve of GMFG in GBM by GEPIA. The dotted lines represent the 95% CIs for the survival curves. Original gene-set labels (EMT, metastasis) are retained in figure panels and Supplementary Table S1–S4, Table S6 and Table S11 to preserve analytical reproducibility. Within the main text, these signatures are referred to as the EMT-like transcriptional program and intracranial invasion, respectively. FDR—false discovery rate. FC: fold change.
We further used GSVA to score these signature sets in hypoxic (n = 49) versus non-hypoxic regions (n = 73). The signature scores of EMT-like, invasion, intracranial infiltration, and proliferation were all significantly elevated in the hypoxic regions: EMT-like (95% confidence interval (CI): 0.229–0.445, false discovery rate (FDR): <0.001), invasion (95% CI: 0.281–0.574, FDR: <0.001), intracranial infiltration (95% CI: 0.378–0.525, FDR: <0.001), proliferation (95% CI: 0.096–0.266, FDR: = 4.00 × 10⁻⁵) (Figure 1F). Spatial validation was performed using six GBM spatial transcriptomics datasets. The five signatures showed spatial co-localization, with consistently stronger signals in hypoxic regions (Figure 1G,H). Bivariate Moran’s I analysis revealed predominantly positive spatial associations between signature pairs (Figure 1I), with sample-averaged values ranging from 0.50 to 0.64 across all ten pairs. Detailed per-sample global Moran’s I statistics and cross-sample summaries are provided in Supplementary Table S2 and Figure S1A, respectively. To exclude artifacts from overlapping genes across signatures, we repeated the analysis using non-overlapping gene sets (Supplementary Table S3), which confirmed the positive and significant spatial associations. We further performed spot-level Local indicators of spatial association (LISA) analysis to characterize local spatial patterns: full results including all spots and local statistics are shown in Supplementary Table S4, while significant spots are listed in Supplementary Table S5. The proportion of significant spots varied widely across samples, from 5.8% to 32.6%. The distribution of LISA cluster types (High-High, Low-Low, High-Low, Low-High) across all six samples is summarized in Supplementary Table S6. Notably, High-High co-localization was the most prominent pattern and was most enriched in sample UKF269_T_ST. Local LISA findings were consistent with the inter-sample heterogeneity observed in global Moran’s I, collectively supporting the spatial co-aggregation of these malignant transcriptional programs. These spatial statistics quantify co-occurrence patterns only and do not indicate direct molecular interactions or causal relationships.
We first performed correlation analysis to evaluate the interrelationships between the four malignant phenotypes and the hypoxia signature at the signature score level. All four malignant phenotypes exhibited significant positive correlations with the hypoxia signature, as well as with each other (Figure S1B). To systematically identify driver genes underlying GBM progression, we leveraged the Chinese Glioma Genome Atlas (CGGA) cohort for multi-dimensional bioinformatic screening. With respect to the hypoxic phenotype, differential expression analysis uncovered 187 significantly upregulated and 237 downregulated genes in hypoxic (n = 49) versus non-hypoxic (n = 73) regions (Figure 1J); similarly, 384 upregulated and 509 downregulated genes were identified between IDH-wildtype (n = 418) and IDH-mutant (n = 499) gliomas (Figure 1K). Since hypoxia and TMZ resistance frequently coexist in GBM, we analyzed the GSE100736 dataset to compare TMZ-resistant (n = 3) and TMZ-sensitive (n = 3) cell lines, with 4219 upregulated and 5275 downregulated genes found in resistant lines (Figure 1L).
Intersection of the three gene sets (hypoxia-up, IDH-WT-up, and TMZ-resistance-up DEGs) yielded 17 overlapping genes (Figure 1M). Gene Expression Profiling Interactive Analysis 3 (GEPIA3) validation of these 17 genes in GBM showed that three genes (CEBPD, GMFG, SERPINH1) were significantly upregulated (Figure 1N) (Figure S1C), and they were closely associated with poor prognosis (Figure 1O) (Figure S1D). We further quantified GMFG gene expression across five anatomical regions of GBM (Figure S1E,F). GMFG expression exhibited a gradually increasing gradient, with elevated median expression from the Leading edge (LE) to the Cellular tumor (CT). This spatial pattern is highly consistent with the pathological process of GBM invasion: GMFG expression continuously increases as tumor cells migrate from the infiltrative margin toward the tumor bulk, suggesting that GMFG may participate in the invasive progression of GBM cells. GMFG has been relatively understudied in previous GBM studies. By contrast, although CEBPD expression differed statistically among anatomical regions, it lacked a regular spatial trend along the invasion gradient, and as a well-characterized inflammation-related transcription factor, its glioma functions have been extensively reported, offering limited novelty; SERPINH1 high expression was largely restricted to perinecrotic hypoxic regions, consistent with its collagen-chaperone function, and was comparatively low in the infiltrating tumor region, biasing its function toward the stromal compartment. Combining this multidimensional evidence, we selected GMFG as the target gene for further study.
2.2. Associations of GMFG Expression with Clinical, Imaging, and Molecular Features of Glioma
To explore the clinical relevance of GMFG, we systematically analyzed its correlations with clinicopathologic features in the CGGA cohort (Table 1). This subgroup comprised 280 IDH-wildtype WHO grade IV glioma cases, including five discordant samples annotated with concurrent 1p/19q codeletion. This molecular combination is inconsistent with the canonical WHO classification for IDH-wildtype GBM. In line with our initial screening, GMFG expression was significantly higher in IDH-wildtype glioma (Figure S2A). Ivy GAP regional analysis revealed that GMFG expression was higher in hypoxic regions (MVP and Pseudopalisading cells around necrosis (PAN)) than in non-hypoxic regions (Figure S2B). The TMZ-resistant GBM dataset (GSE100736) confirmed GMFG upregulation in resistant versus sensitive lines (Figure S2C). GMFG mRNA was significantly upregulated in GBM when compared with GTEx normal brain tissues (Figure 2A), with protein levels showing a consistent pattern (Figure S2D). Multi-omics data revealed significantly higher GMFG protein abundance in GBM tumors (n = 99) relative to normal brain tissues (n = 10) (Figure 2B), with GMFG mRNA levels showing a strong correlation with protein abundance (r = 0.847) (Figure 2C). GMFG protein abundance was highest in the mesenchymal subtype (Figure 2D). In gliomas, patients with high GMFG expression had significantly poorer prognosis than those with low GMFG expression (Figure 2E). Similarly, high GMFG expression was associated with unfavorable prognosis in IDH-wildtype GBM (Figure S2E). To investigate the association between GMFG expression and tumor burden in GBM, we integrated expression, clinical, and CE-MRI data from the CGGA cohort (n = 165), which revealed that GMFG expression was positively correlated with log10-transformed tumor volume (Figure 2F). The high-GMFG group exhibited a significantly higher normalized contrast-enhanced voxel ratio (ce_ratio) (Figure 2G), and tumors with high GMFG expression had a larger overall tumor volume (Figure 2H). These findings link high GMFG expression to increased radiographic tumor volume and stronger contrast enhancement.
Table 1.
Clinical characteristics of the 966 CGGA glioma patients.
Figure 2.
GMFG correlates with clinical features in glioma patients. (A) Higher GMFG mRNA in GBM patients; data were obtained from the TCGA and GTEx datasets via UCSC Xena. (B) Higher GMFG protein abundance in GBM than in normal brain. (C) Correlation between GMFG mRNA levels and protein abundance. (D) GMFG was predominantly highly expressed in the mesenchymal subtype. Analyses in (B–D) were performed based on a published multi-omics GBM cohort. ****, p < 0.0001. (E) High GMFG links to poor prognosis in glioma. (F) GMFG positively correlates with tumor volume. (G) High-GMFG patients show a higher ce_ratio than low-GMFG patients. (H) The high-GMFG group carries a greater tumor burden. Analyses in (F–H) were performed based on MRI data from the CGGA cohort. (I) Heatmap of GMFG vs. clinical features. *, p < 0.05; ***, p < 0.001. (J) Higher GMFG in 1p/19q non-codeleted glioma. (K) Higher GMFG in patients aged >43. (L) Higher GMFG in chemotherapy-treated patients. (M) Higher GMFG with increasing glioma grade. (N) Univariate Cox regression analyses. (O) Multivariate Cox regression analyses for prognostic factors in glioma patients. Analyses in (I–O) were performed using the CGGA cohort dataset. The red line in Figure (C,F) represents the fitted regression line. HR—hazard ratio; CI—confidence interval.
Using the median expression cutoff, GMFG was split into high/low groups; an annotated heatmap integrating age (43 years, median), gender, radiotherapy, PRS type, WHO grade, IDH status, 1p/19q codeletion, MGMT promoter methylation, and chemotherapy status gave a global view of GMFG’s clinical relevance in glioma using CGGA samples (Figure 2I). GMFG was higher in 1p/19q non-codeleted than 1p/19q codeleted glioma (Figure 2J); patients aged >43 showed higher GMFG than younger ones (Figure 2K); and chemotherapy-exposed patients had significantly elevated GMFG (Figure 2L), hinting at a role in treatment response. GMFG expression increased with ascending WHO grade (Figure 2M), which was further validated in the GSE4290 cohort (Figure S2F). To validate GMFG’s involvement in TMZ resistance, GEPIA3 analysis revealed significant differences in GMFG expression across complete response, partial response, stable disease, and progressive disease groups in glioma patients (Figure S2G).
We next conducted univariate and multivariate Cox proportional hazards (PHs) regression analyses to assess the independent prognostic relevance of GMFG expression, with adjustment for established clinical and molecular covariates. In the univariate analysis, elevated GMFG expression, age > 43 years, TMZ treatment, WHO grade III/IV, and IDH-wildtype status were significantly associated with shorter overall survival, whereas 1p/19q codeletion correlated with favorable prognosis (Figure 2N). The multivariate Cox regression model included 664 eligible patients with 434 observed death events. Multivariate Cox regression confirmed that GMFG expression retained independent prognostic significance (HR = 1.094, 95% CI: 1.016–1.178, p = 0.017) (Figure 2O). Model performance was supported by a significant likelihood ratio test (test statistic = 375.5, p < 0.001) and a concordance index (C-index) of 0.781, indicating good discriminatory capacity. Tests for the PH assumption showed that GMFG expression (p = 0.881), age group (p = 0.807), TMZ chemotherapy status (p = 0.274), and MGMT methylation status (p = 0.199) satisfied the PH assumption. By contrast, PRS status (p = 0.003), 1p/19q codeletion status (p = 0.008), IDH mutation status (p = 0.001), and WHO grade (p = 0.001) violated this assumption. The global test also revealed an overall violation of the PH assumption for the full model (GLOBAL, p < 0.001). Collectively, GMFG is upregulated in glioma and linked to adverse prognosis and multiple malignant clinical phenotypes.
2.3. GMFG Modulates GBM Cell Viability, Migration, and Apoptosis
After systematically analyzing the relationship between GMFG and GBM, we hypothesized that GMFG contributes to GBM malignant phenotypes. We knocked down GMFG via lentiviral shRNA transduction and verified efficiency by qPCR (Figure 3A). Among all shRNA sequences, shRNA#179 exhibited the highest knockdown efficiency and was thus selected for subsequent experiments. Western blotting further confirmed the successful GMFG knockdown at the protein level (Figure 3B).
Figure 3.
GMFG modulates multiple malignant phenotypes of GBM. (A) qRT-PCR to verify the knockdown efficiency of GMFG. ****, p < 0.0001. (B) Western blot to verify the knockdown efficiency of GMFG. (C) CCK-8 assay of cell viability in A-172 and U-87 MG cells over 5 consecutive days. (D,E) Celigo scratch assay. Scale bar, 200 μm. Red vertical lines mark the boundaries of the scratch wound. (F,G) Annexin V-APC flow cytometry in the A-172 and U-87 MG cell lines (single staining cannot distinguish apoptosis from necrosis; data reflect the proportion of Annexin V-APC-positive cells). (H) Transwell assay to detect changes in the migratory ability of A-172 and U-87 MG cells after knockdown of GMFG; scale bar, 100 μm. (I) Transwell assay (covered with Matrigel-lined filter membranes) to detect changes in the invasive ability of A-172 and U-87 MG cells after knocking down GMFG. Scale bar, 100 μm. OD450—optical density at 450 nm. *, p < 0.05; **, p < 0.01; ***, p < 0.001.
CCK-8 assays demonstrated that the GMFG depletion markedly reduced the cell viability of A-172 and U-87 MG cells (Figure 3C). The Celigo scratch assay demonstrated that at 24 h (A-172) and 8 h (U-87 MG) after wounding, the residual scratch area was significantly larger in shGMFG cells than in control cells (Figure 3D,E), indicating impaired wound closure. We note that scratch-wound assays reflect combined effects of cell migration and proliferation/viability; therefore, Transwell assays were used to further verify migratory and invasive phenotypes. At 72 h after GMFG knockdown, A-172 and U-87 MG cells were harvested for Annexin V-APC staining to evaluate phosphatidylserine exposure. The proportion of Annexin V-APC-positive cells was significantly higher in the GMFG-knockdown group than in the control group for both cell lines (Figure 3F,G). Since Annexin V-APC single staining cannot distinguish early apoptotic cells from necrotic cells, this observation only provides suggestive evidence for apoptotic signaling and confirms elevated phosphatidylserine externalization upon GMFG knockdown.
The Transwell assay was also performed to assess the migration and invasion abilities of U-87 MG and A-172 cells after GMFG knockdown. As the results displayed in Figure 3H,I, GMFG silencing significantly attenuated migration and invasion of both U-87 MG and A-172 cells. GMFG knockdown likewise reduced the invasive capacity of both cell lines. To rule out off-target effects, we repeated selected experiments using an independent shRNA clone (sh#178). Consistently, GMFG knockdown markedly suppressed cell viability and migration, and increased the proportion of Annexin V-APC-positive cells (Figure S3). Both independent shRNA constructs therefore yielded concordant phenotypic changes.
2.4. GMFG Subcellular Localization and Somatic Alteration Landscape
To characterize the subcellular localization of GMFG protein, we examined immunofluorescence data available in the Human Protein Atlas (HPA). In HPA immunofluorescence images of the GBM cell line U251 and osteosarcoma cell line U2OS (microtubules stained in green), GMFG exhibited predominant cytoplasmic distribution, and its fluorescent signals partially overlapped with those of microtubules (Figure 4A). The GMFG crystal structure (PDB ID: 3L50) from the PDB database was visualized in cartoon mode (Figure 4B); GMFG forms a homodimer with a conserved α/β fold, consistent with its actin-regulating activity, and putative mutation sites are marked.
Figure 4.
GMFG genomic variation and localization. (A) Immunofluorescence of GMFG (red) and microtubules (green) in U251 and U2OS cells, used as a qualitative reference for subcellular distribution. (B) GMFG 3D structural model, with red dots marking potential amino acid variants. (C) GMFG alteration types and frequencies. (D) Oncoprint showing GMFG amplification events across individual TCGA-GBM samples. (E) Classification of rare GMFG variant events. This panel serves as a descriptive genomic background observation to demonstrate that GMFG mutations are uncommon in GBM. SNP—single nucleotide polymorphism; CNA—copy number alteration. Data sources: (A) Human Protein Atlas (HPA) immunofluorescence; (B) Protein Data Bank (PDB ID: 3L50); (C,D) TCGA-GBM somatic alteration data via cBioPortal; (E) TCGA-GBM SNV profile via GSCA.
Next, we characterized the genomic variation landscape of GMFG in GBM using somatic alteration data from the TCGA GBM cohort (n = 273) in cBioPortal, with the single nucleotide polymorphism (SNP) profile analyzed in the TCGA-GBM cohort (n = 403) from the GSCA database. Genomic alterations of GMFG in GBM were dominated by copy-number amplification, with an overall low somatic mutation frequency (Figure 4C). The overall GMFG alteration frequency in GBM was only 0.7%—among 273 GBM patients with mutation data, only two cases harbored GMFG alterations, predominantly copy-number amplification, while the vast majority of samples exhibited no mutations or copy number alteration (CNA) (Figure 4D). Given the rarity of these events, the SNV pattern is reported as a descriptive observation of the genomic background only (Figure 4E). In the TCGA-GBM cohort, GMFG upregulation is not primarily driven by gene amplification or coding mutations.
2.5. Epigenetic Regulation of GMFG Through DNA Methylation and Acetylation
The low frequency of GMFG mutations and copy-number variations (CNVs) in GBM indicates that its overexpression is rarely driven by genetic alterations, prompting us to explore its epigenetic regulation. We integrated GMFG methylation and mRNA expression data to interrogate potential epigenetic−transcriptional correlations of GMFG. Pan-cancer analysis revealed marked inter-tumor heterogeneity in GMFG mRNA expression (Figure 5A), with GBM showing particularly high expression. Global methylation status also varied substantially across cancer types: testicular germ cell tumor (TGCT) had the lowest median methylation (0.365), while low-grade glioma (LGG) exhibited the highest (0.530) (Figure S4A), consistent with genome-wide hypomethylation during glioma progression.
Figure 5.
GMFG methylation in tumors. (A) GMFG mRNA expression varies across tumor types (TIMER web platform); red boxes indicate tumor samples and blue boxes indicate matched normal samples. *, p < 0.05; **, p < 0.01; ***, p < 0.001. (B) The mean methylation β-value of GMFG CpGs across multiple regulatory regions shows pan-cancer heterogeneity. (C) Correlation of the mean methylation β-value of GMFG CpGs across multiple regulatory regions with mRNA in every tumor. (D) Heatmap of GMFG CpG probes across tumors. (E) Scatter of CpG β-values in LGG (blue) vs. GBM (red); *, p < 0.05; ***, p < 0.001. (F) GMFG methylation is lower in GBM than in LGG. (G) GMFG hypomethylation links to worse OS in IDH-wildtype GBM (Kaplan–Meier with the log-rank test; n = 61 with survival data). Analyses in (B–G) were performed using the TCGA methylation cohort dataset. (H). Absolute GMFG K74 acetyl-peptide signal was higher in GBM tumors than in normal brains. (I). Correlation of GMFG K74 acetylation with protein abundance. Red line: fitted trend line of Spearman correlation. Analyses in (H,I) were based on a published multi-omics GBM cohort. CpG—cytosine–phosphate–guanine dinucleotide. LGG: low-grade glioma.
We next evaluated the association between GMFG mRNA expression and the mean methylation β-value across these 15 CpG sites spanning multiple regulatory regions, and observed widespread heterogeneity in mean β-value of GMFG CpGs in multiple regulatory regions across cancers (Figure 5B). Tumor clustering separated samples into a globally hypomethylated group (TGCT, KIRP, and THCA) and a hypermethylated cluster (COAD and READ). Across all cancer types, the mean β-value of GMFG CpGs located in multiple regulatory regions was significantly and negatively correlated with its mRNA expression (Figure 5C), consistent with the canonical inverse relationship between regulatory-region methylation and gene transcription. Strong negative correlations were detected in both glioma subtypes: GBM (r = −0.458) and LGG (r = −0.412). A pan-cancer heatmap covering 32 cancer types and 15 CpG probes stratified the 15 probes into two clusters: one persistently hypermethylated across most tumors and the other fluctuating widely (Figure 5D).
We further replicated methylation-expression and methylation-survival analyses in the IDH-wildtype GBM cohort (n = 132; the 15-probe mean β-value survival analysis included 61 patients with complete survival data). CpG-level analysis demonstrated lower methylation levels for most probes in GBM compared to in LGG (Figure 5E), supporting an association between GMFG regulatory-region demethylation and elevated GMFG transcription in GBM. Global GMFG methylation differed substantially between IDH-wildtype GBM and LGG (Figure 5F). Consistently, GMFG mRNA levels were significantly higher in hypomethylated GBM than in hypermethylated tumors (Figure S4B), linking GMFG transcriptional activation to DNA methylation status. Survival analysis further associated GMFG hypomethylation with inferior overall survival in IDH-wildtype GBM (Figure 5G). Owing to the limited sample size, we did not perform multivariable Cox regression to adjust for clinical confounders. This association should be regarded as exploratory.
Of the 15 probes, four CpG probes located in the GMFG promoter region (cg27360210, cg17514766, cg24796852, and cg25599012) were selected for analysis. After filtering, 534 LGG and 132 primary IDH-wildtype GBM samples were included for the comparison of GMFG promoter methylation levels. The mean β-value of GMFG promoter methylation was significantly lower in IDH-wildtype GBM than in LGG (Figure S4C). Consistently, patients with high promoter methylation exhibited significantly lower GMFG mRNA expression than those with low promoter methylation (Figure S4D). We further integrated methylation and RNA-seq expression datasets, and 61 IDH-wildtype GBM samples with matched promoter methylation and expression data were retained. Correlation analysis revealed a moderate negative correlation between the GMFG promoter methylation β-value and GMFG mRNA expression (Figure S4E). In a separate promoter-specific survival analysis, 65 IDH-wildtype GBM patients with complete survival information were enrolled in survival analysis, including 35 patients in the low-methylation subgroup and 30 in the high-methylation subgroup. Kaplan–Meier survival analysis (Figure S4F) showed that patients with high GMFG promoter methylation (accompanied by low GMFG expression) had a significantly longer overall survival than patients with low promoter methylation (accompanied by high GMFG expression).
In the IDH-wildtype GBM cohort from a published study, GMFG-K74 acetylated peptides were detectable in 26 of 99 tumors and 3 of 10 normal brains (Figure 5H). The absolute K74 acetyl-peptide signal was significantly positively correlated with total GMFG protein abundance (Spearman ρ = 0.47, p = 0.0163) (Figure 5I). These observations are consistent with increased total GMFG protein abundance underlying the elevated signal, but cannot establish whether site-specific K74 acetylation acts as an independent regulatory layer. Notably, only a small number of normal specimens yielded detectable acetylation signals.
2.6. Single-Cell Analysis Reveals GMFG-Linked Patterning of the GBM Immune Microenvironment
Whereas bulk tissue profiling misses GBM heterogeneity and cannot pinpoint GMFG’s cell-specific role, single-cell RNA-seq distinguishes tumor, stromal, and immune compartments. Single-cell transcriptomics also enables the detection of subpopulation-specific transcriptional state transitions across conditions, a key analytical advance supported by analytical frameworks such as muscat [28]. We analyzed the glioma scRNA-seq dataset GSE182109, which covers LGG and ndGBM. To avoid pseudoreplication, each patient was treated as an independent biological unit; given the limited sample size, all patient-level results are presented as exploratory descriptions without formal significance testing. A subset of 11 fragments from 2 LGG and 2 ndGBM patients with multiregional sampling was analyzed (Figure S5A), and 55,327 cells were retained after quality control (Figure S5B); clustering identified 25 clusters (Figure S5C). Sample information and filtered cell counts are provided in Supplementary Table S7. Marker-gene annotation defined 11 major populations—macrophages, microglia, monocytes, T cells, oligodendrocytes, endothelial cells, pericytes, astrocytes, Schwann precursor cells, neurons, and neural stem cells (Figure 6A). GMFG expression was elevated in GBM, predominantly within myeloid populations and T cells (Figure S5D,E).
Figure 6.
Single-cell-level analysis of GMFG expression in GSE182109. (A) Cell-type annotation. (B) t-SNE plot showing GMFG-high (red) versus GMFG-low (blue) cells overlaid on annotated cell types. (C) Proportion of GMFG-high versus GMFG-low cells within each cell type. (D) Cell-subtype composition of the GMFG-high and GMFG-low groups. (E) t-SNE annotation of myeloid subtypes in the GMFG-high group. (F) t-SNE annotation of myeloid subtypes in the GMFG-low group. (G) Top 12 Hallmark pathways in Chemo_TAM ranked by mean ssGSEA score. (H) CellChat-inferred tumor→Chemo_TAM signaling: ligand–receptor interaction probabilities (left) and relative signaling contribution by direction (right); exploratory predictions from pooled ndGBM samples. (I) GSEA enrichment plots of pathways upregulated in GMFG-high GBM. The green curve represents the enrichment score (ES). The black vertical bars indicate the positions of gene hits within the ranked gene list. The bottom grey curve shows the ranked list metric scores. All comparisons are conducted at the single-cell level; these cell-level findings should not be interpreted as evidence of tumor- or patient-level differences in myeloid infiltration. t-SNE, t-distributed stochastic neighbor embedding; ssGSEA, single sample gene set enrichment analysis; GSEA, gene set enrichment analysis; TAM, tumor-associated macrophage; Chemo_TAM, chemotaxis TAM; IFN_TAM, interferon TAM; Phago_AP_TAM, phagocytosis/antigen-presentation TAM; NES, normalized enrichment score.
At the single-cell level, GMFG-high cells were concentrated in myeloid populations, whereas GMFG-low cells were enriched for oligodendrocytes and neurons (Figure 6B); compositionally, GMFG-high cell populations were myeloid-rich, whereas GMFG-low compartments contained more non-immune cells (Figure 6C,D). Of the seven canonical myeloid subsets defined above, four (Chemo_TAM, IFN_TAM, Hypoxia_TAM, and Phago_AP_TAM) were detected in this cohort. Per-cell GMFG expression (RNA assay) was median-split into GMFG-high (>median) and GMFG-low (≤median), and the high/low fraction within each subset was computed. t-SNE visualization resolved all four subsets among GMFG-high myeloid cells, with Chemo_TAM being dominant (Figure 6E); among GMFG-low myeloid cells, Hypoxia_TAM, IFN_TAM, and Phago_AP_TAM were the main subsets (Figure 6F). Chemo_TAM dominated the GMFG-high myeloid compartment, while GMFG-low lacked Chemo_TAM and favored IFN_TAM/Hypoxia_TAM (Figure S5F). Since GMFG was also enriched in T cells, we compared T-cell subtype compositions: within the GMFG-low group, T cells were predominantly Effector_T (Figure S5G). Chemo_TAM-enriched pathways were largely inflammatory (Figure 6G). Quantitative communication probabilities showed that tumor→Chemo_TAM signaling predominated over the reverse direction, with APP, ApoE, PTN, and MIF as the dominant tumor-derived signals (Figure 6H). Because cells from the 2 ndGBM patients were pooled, these ligand–receptor interactions are exploratory predictions and may include pairs that did not co-occur in the same specimen.
All cell-level comparisons reflect compartmental differences rather than tumor-level phenotypes. To address pseudoreplication, we performed pseudobulk analysis at the patient level to explore trends between GMFG expression and myeloid subset proportions. These descriptive results, along with patient metadata and CopyKat CNV annotations for ndGBM samples, are summarized in Supplementary Table S8. Patient-level results were not consistent across grouping definitions: the two ndGBM patients differed in both mean myeloid GMFG expression and Chemo-TAM fraction, and pseudobulk GMFG grouping did not reproduce the trend; given the limited sample size, these findings are descriptive only.
Finally, GSEA of bulk GBM samples showed that the GMFG-high phenotype was enriched for immune-inflammatory pathways, including cytokine signaling, NOD-like receptor signaling, cell chemotaxis, and T cell immunity (Figure 6I), aligning with an inflammatory, mesenchymal-like immune state and supporting the inferred tumor-promoting crosstalk between malignant cells and Chemo_TAM.
2.7. GMFG Immune Correlations, Drug Sensitivity, and Potential Chemical Regulators
To systematically evaluate the association between GMFG and immune cell subsets, we performed Pearson correlation analysis of GMFG and immune-subset marker genes. GMFG positively correlated with immunosuppressive myeloid markers—MDSC (CD33), M-MDSC (CD14), TAM (CD68), M2 macrophage (CD163), and monocyte (CSF1R); moderate positives also appeared for NK cells (KIR2DL1), B cells (CD19), dendritic cells (CD1C), Treg (CCR8), Th2 (STAT6), CAF (FAP), and M1 macrophage (IRF5), whereas Th17 (STAT3) and neutrophils (CEACAM8) showed negative correlations with GMFG (Figure 7A). GMFG expression was associated with immune-checkpoint genes: CTLA4, HAVCR2, PDCD1, and PDCD1LG2 differed between GMFG-high and GMFG-low groups (Figure 7B), with several checkpoints upregulated in GMFG-high tumors.
Figure 7.
GMFG immune correlations. (A) Pearson correlation between GMFG expression and key immune-cell marker genes after tumor-purity correction (TIMER2.0). *, p < 0.05; ***, p < 0.001. (B) Immune-checkpoint molecule expression between GMFG-high and GMFG-low groups (n = 76 per group; Wilcoxon rank-sum test). *, p < 0.05; ***, p < 0.001; ****, p < 0.0001. (C) Predicted log2-transformed IC50 distribution of nine candidate drugs between GMFG-high and GMFG-low IDH-wild-type glioma subgroups (post hoc descriptive visualization). Box-and-scatter plots showing the distribution of in-silico-predicted log2(IC50). Group-wise comparisons were performed using the Wilcoxon rank-sum test. ****, p < 0.0001. (D) Forest plot showing the mean differences of log2-transformed predicted IC50 (GMFG-high minus GMFG-low). (E) Bubble scatter plots showed, per compound, the number of tested species, scale of downstream target-gene regulation, and literature evidence in the CTD dataset. CTD—Comparative Toxicogenomics Database. IC50—half-maximal inhibitory concentration.
OncoPredict was applied to 198 GDSC2 reference drugs to predict drug sensitivity in the CGGA IDH-wildtype GBM cohort. Raw Pearson correlation p-values between continuous GMFG expression and predicted log2-transformed IC50 were corrected using the BH method. Nine candidate drugs were selected according to pre-specified criteria (FDR < 0.05 and |r| > 0.3). For the remaining eight agents including 5-Fluorouracil, Dactolisib, GNE-317, BDP-00009066, Rapamycin, Pevonedistat, Palbociclib and BMS-536924, GMFG-high tumors exhibited lower predicted log2-transformed IC50 values, indicating higher predicted drug sensitivity. By contrast, JQ1 showed a positive correlation with predicted IC50 (r = 0.760) despite a negligible group-wise mean difference (+0.001, 95% CI: 0.000–0.001) (Figure 7C). A forest plot summarized the mean difference in log2(IC50), together with corresponding 95% CI and subgroup-level FDR-corrected p-values for each drug (Figure 7D). All statistical metrics, including Pearson correlation coefficients, two sets of FDR values, mean differences, 95% CI, and valid sample sizes, are summarized in Supplementary Table S9.
To screen exogenous upstream regulators of GMFG, we mined the CTD database for chemical–gene interactions. CTD records 77 chemicals linked to GMFG (Supplementary Table S10). Benzo[a]pyrene exhibited the largest number of target-gene interactions, while bisphenol A (BPA) had reports spanning the widest range of species; both are established environmental factors with documented connections to GMFG. Additional candidates encompassed environmental toxicants and epigenetic small-molecule inhibitors, including valproic acid, 2,3,7,8-tetrachlorodibenzodioxin (TCDD), and acetaminophen (Figure 7E). These database-derived associations support the hypothesis that diverse environmental exposures, endocrine-disrupting chemicals, and epigenetic agents may modulate GMFG transcription.
3. Discussion
GBM is the most malignant and invasive primary tumor of the adult central nervous system, associated with dismal clinical prognosis [29]. TMZ resistance is the core bottleneck of GBM therapy. As a classic “cold” tumor, GBM exhibits a deeply immunosuppressive TME: abundant TAM infiltration, exhausted T cells, aberrantly upregulated checkpoints, and limited recruitment of anti-tumor effectors limit the benefit of immunotherapy and targeted therapy [30]. Molecules jointly linked to malignant progression, chemoresistance, and immune microenvironment patterning therefore hold high translational value. Here, we integrated multi-omics profiling with in vitro functional assays to identify GMFG as a candidate key molecule operating at this biological interface.
This study characterized the interplay between hypoxia and malignant transcriptional programs and confirmed robust coupling between hypoxia and these malignant-signature gene sets. Of note, we define this mesenchymal transcriptional program as an EMT-like program rather than canonical epithelial–to–mesenchymal transition, because GBM lacks an epithelial compartment and is characterized by local brain infiltration instead of distant metastasis. Elevated GMFG expression in IDH-wildtype tumors, hypoxic/MVP regions, and chemoresistant cell lines indicates that GMFG may be associated with malignant progression and chemoresistance. Prior bioinformatics studies have reported GMFG upregulation and poor prognosis in GBM [31]. This study adds three layers of evidence to the characterization of GMFG. First, GMFG hypomethylation across multiple regulatory regions was identified as an epigenetic alteration correlated with GMFG transcriptional upregulation, alongside an elevated K74 acetylated-peptide signal that largely reflected total protein abundance. Second, single-cell-resolution analysis identified GMFG enrichment in Chemo_TAM populations and delineated GMFG-associated immune features within this myeloid compartment. Third, in vitro functional assays in GBM cell lines confirmed changes in cell viability, migration, invasion, and Annexin V-APC positivity following GMFG knockdown. Consistent with our findings in GBM, GMFG is also overexpressed in epithelial ovarian cancer (EOC) and is associated with advanced FIGO stage, chemotherapy resistance, and unfavorable clinical outcomes. GMFG facilitates EOC cell migration and invasion by remodeling the actin cytoskeleton through its interaction with the Arp2/3 complex [32], supporting a conserved cytoskeletal function across tumor types.
Genomic variation analysis revealed virtually no high-frequency driver mutations or copy number alterations of GMFG in GBM, suggesting that its dysregulation stems not from genetic events but, more plausibly, from epigenetic regulation. Epigenetic reprogramming acts as a core driver of malignant evolution in GBM, rewiring the global transcriptome in the absence of genomic sequence alterations [33]. Our multi-cohort methylation analysis showed that the mean methylation β-value of GMFG CpGs across multiple regulatory regions is negatively correlated with its mRNA expression, and hypomethylation is associated with worse prognosis. It remains untested whether GMFG CpG methylation is causally linked to elevated GMFG expression; the present correlations are hypothesis-generating and require methylation-editing perturbation experiments. IDH mutations establish the G-CIMP phenotype via 2-HG-mediated inhibition of TET enzymes, whereas IDH-wildtype GBM does not harbor this G-CIMP hypermethylation signature. It remains unclear whether GMFG hypomethylation arises as a secondary consequence of the IDH-wildtype epigenetic background or constitutes a locus-specific regulatory event independent of IDH status [34]. The absolute abundance of the GMFG K74 acetylated peptide was higher in GBM and positively correlated with total GMFG protein abundance. In contrast, the estimated K74 acetylation occupancy (the fraction of GMFG protein carrying this modification) did not differ from that in normal brain tissue. Notably, only a limited subset of normal brain samples yielded detectable acetylated peptide signals. These observations are consistent with increased total GMFG protein abundance underlying the elevated signal but cannot establish whether site-specific K74 acetylation acts as an independent regulatory layer; validation in larger cohorts and dedicated perturbation experiments is warranted.
Single-cell analysis further dissected the pro-tumor association of GMFG at cellular resolution. GMFG-high cell populations were enriched for Chemo_TAM, suggesting an association between GMFG expression and Chemo_TAM abundance in GBM. Studies of macrophage iron metabolism have shown that iron and H2O2 downregulate GMFG, increase intracellular iron levels and promote anti-inflammatory M2 polarization [22]. ssGSEA revealed that Chemo_TAM cells displayed activation of IFN-α/γ response, TNFα-NF-κB, mTORC1, hypoxia, and EMT programs. These correspond to pro-tumor and immunosuppressive programs characterized by a canonical signature combining inflammatory activation and immune reprogramming. Previous work in murine macrophages demonstrated that GMFG suppresses phagocytosis via SR-A/MSR1 [35], raising the possibility that GMFG-high Chemo_TAMs may likewise exhibit impaired phagocytic clearance. Given that Chemo_TAM inflammatory programs coincide with the immunosuppressed, checkpoint-upregulated GBM microenvironment, GMFG-high TAMs may promote immune evasion by sustaining a chemokine-rich landscape that restricts effector T-cell infiltration. We emphasize that this enrichment is observed at the single-cell level and does not translate to consistent patient-level trends in Chemo_TAM proportion after pseudobulk GMFG grouping.
GMFG is predominantly expressed by Chemo_TAM rather than malignant cells in GBM, whereas cultured GBM cell lines (A-172 and U-87 MG) exhibit robust GMFG expression. This discrepancy likely reflects transcriptional adaptation during long-term in vitro culture: cell lines lack the native TAM compartment and in vivo paracrine signals, and their expression profiles undergo adaptive drift, so cell-line expression cannot be equated with that of malignant cells in patient tumors. Our knockdown assays in GBM cell lines were therefore not intended to investigate the immune-microenvironment functions of GMFG in TAMs; rather, they test whether malignant GBM cells retain GMFG expression and the molecular capacity to respond to its perturbation. The cell-line results therefore serve only as secondary, complementary evidence and cannot recapitulate tumor–TAM interactions in vivo; the bioinformatic hypothesis of an association between GMFG and the myeloid compartment remains correlative and requires functional validation, and this limitation is acknowledged to preclude over-extrapolating in vitro findings to the in situ tumor immune microenvironment.
GMFG acts as a paracrine signal in other malignancies—secreted downstream of stromal or mechanical cues in chordoma and pancreatic cancer to rewire the TAM compartment and promote progression [27,36], supporting its conserved role as a stromal-tumor signaling mediator. In Chemo_TAM, GMFG-dependent actin remodeling may therefore facilitate the intracellular trafficking and secretion of inflammatory chemokines, providing a plausible mechanistic link between GMFG’s canonical cytoskeletal function and the chemokine-rich, myeloid-recruiting phenotype observed here. Glioma progression heavily depends on tumor cell hijacking of intracranial stroma and immune cells, with chemokine-mediated recruitment being a key driver of microenvironmental dysregulation [37]. Mechanistically, tumor-secreted MIF, APP, ApoE, and PTN are known macrophage-reprogramming regulators, and SPP1 is a classic pro-immunosuppressive TAM marker reported in glioma; our CellChat-inferred “tumor- Chemo_TAM” axis is essentially consistent with the common mechanism across solid tumors where tumor cells hijack TAM toward a pro-tumor phenotype, suggesting cross-tumor generality. These observations nominate GMFG as a candidate link between malignant phenotypes and immune suppression, but whether it plays a causal role or is merely a correlated marker remains to be tested experimentally. The observed transcriptional correlations between GMFG and immune checkpoint genes in our study do not support GMFG as a predictive biomarker for ICI response. The expression of immune checkpoint molecules represents only one component within the highly complex immune microenvironment of glioblastoma. Recent clinical investigations in high-grade gliomas, including the NT-I7 trial, have highlighted that systemic lymphocyte homeostasis and treatment-induced lymphopenia act as critical determinants of immunotherapy outcomes [38,39]. Consistent with this notion, preclinical studies in melanoma further demonstrate that the therapeutic efficacy of PD-1 blockade is strongly context-dependent; host status, environmental cues, and temporal factors can substantially shape responses to anti-PD-1 therapy [40]. Accordingly, without dedicated prospective clinical validation, transcriptional associations with individual immune checkpoint genes cannot be interpreted as predictive signatures for anti-PD-1/PD-L1 treatment benefit.
In silico drug-sensitivity prediction uncovered a complex interplay between GMFG-associated immunosuppression and drug responsiveness. GMFG-high GBM showed predicted sensitivity to several chemotherapeutic and targeted agents (including 5-fluorouracil, dactolisib, GNE-317, rapamycin, pevonedistat, palbociclib, BDP-00009066, and BMS-536924). One plausible explanation is that GMFG-high tumors exhibit enhanced proliferation and pro-inflammatory activation, states that typically render cells more susceptible to cytotoxic agents, whereas the surrounding immunosuppressive milieu simultaneously blunts immune-mediated tumor clearance. Among the nine candidates, agents targeting proliferation-related pathways are mechanistically compatible with the aggressive phenotype of GMFG-high tumors, whereas 5-fluorouracil crosses the blood–brain barrier poorly; intracranial pharmacokinetics should therefore be considered before clinical extrapolation. Even within the IDH-wildtype cohort, proneural, classical, and mesenchymal subtype heterogeneity may confound the association between GMFG and predicted IC50. CTD mining further revealed benzo[a]pyrene, bisphenol A, and valproic acid as exogenous GMFG regulators, providing bioinformatic leads to probe GMFG regulation and target its epigenetic control to counteract pro-tumor phenotypes. It should be noted that GMFG is an actin-cytoskeleton regulator with limited direct druggability; its translational value may therefore reside more in serving as a biomarker or a combinatorial target than in direct GMFG inhibition.
This study has limitations. First, all analyses are retrospective bioinformatics analyses using public databases with inherent selection bias, and lack prospective cohorts and in vivo functional validation; in particular, the GMFG–Chemo_TAM axis was inferred computationally and awaits co-culture or genetic models. Platform-specific bias cannot be excluded and independent cohort validation is required. Second, single-cell analysis relies on a single dataset, so Chemo_TAM features, GMFG microenvironment associations, and communication may suffer from batch effects and technical artifacts. Our 2D cell-based experiments cannot model the intricate TAM-containing tumor microenvironment. We have also noted that future investigations using organotypic cultures, spheroid co-culture, or in vivo models will be required to further validate the crosstalk between GMFG and TAM within the GBM microenvironment. Third, oncoPredict drug sensitivity is in silico on GDSC2 cell lines, distant from real intratumor drug response, and predicted drugs need cellular and animal validation. Fourth, CTD chemicals are literature-mined without intervention experiments, so their regulatory effects on GMFG await in vitro validation. Fifth, we acknowledge that our functional assays rely on two independent shRNA constructs without rescue experiments, which cannot fully rule out potential off-target effects. In addition, Annexin V single staining cannot discriminate apoptosis from necrosis. Sixth, our IDH-wildtype WHO grade IV glioma cohort contained five discordant cases with IDH-wildtype status concurrent with 1p/19q codeletion. Although these samples were retained in the analysis, this molecular profile does not match the standard definition of IDH-wildtype GBM; therefore, caution is needed when generalizing our findings to canonical IDH-wildtype GBM.
Future work will use GMFG overexpression and knockdown models, primary GBM cells, organoids, and macrophage co-culture to verify regulation of chemokine pathways, Chemo_TAM polarization, and T-cell immunity, and to validate the prognostic value of the mean methylation β-value of GMFG CpGs across multiple regulatory regions in independent clinical cohorts. Rescue experiments (GMFG overexpression in the knockdown backgrounds) are also planned to strengthen causal evidence for GMFG’s role in cell viability, migration, invasion, and apoptosis.
4. Materials and Methods
4.1. Data Acquisition and Processing
RNA-seq data and clinical annotations for glioma patients were obtained from TCGA via the UCSC Xena browser (https://xenabrowser.net/ (accessed on 5 July 2026)) [41] and the CGGA (http://www.cgga.org.cn/ (accessed on 5 July 2026)) [42]. The mRNAseq_325 and mRNAseq_693 datasets were downloaded from CGGA, comprising 1018 glioma samples in total; samples with incomplete clinical annotation (missing follow-up, grade, or survival information) were excluded, leaving 966 samples with complete information. GSE100736, GSE4290, and GSE182109 were downloaded from GEO (https://www.ncbi.nlm.nih.gov/geo/ (accessed on 10 July 2026)). Spatial transcriptomics datasets were downloaded from GEO (GSM7596595, VISDS-637, and VISDS-644) and CGGA (UKF259, UKF269, and UKF313) [43]. Pan-cancer expression data came from TIMER2.0 (http://timer.cistrome.org/ (accessed on 10 July 2026)) [44]. GBM proteomic data were obtained from the Clinical Proteomic Tumor Analysis Consortium (CPTAC) via the UALCAN portal (http://ualcan.path.uab.edu/ (accessed on 23 July 2026)) [45]. GDSC2 pharmacogenomic data were used for drug-sensitivity analysis [46]. Chemical–target interaction data were from the Comparative Toxicogenomics Database (CTD, http://ctdbase.org/ (accessed on 23 July 2026)) [47]. Subcellular localization images of GMFG were taken from the Human Protein Atlas (HPA, https://www.proteinatlas.org/ (accessed on 23 July 2026)), and the human GMFG crystal structure (PDB ID: 3L50) was downloaded from the Protein Data Bank in Europe (PDBe, EMBL-EBI). Drug-response and survival analyses were performed with GEPIA3 (https://gepia3.bioinfoliu.com/ (accessed on 1 July 2026)). Gene signatures for EMT, invasion, proliferation, and hypoxia were downloaded from the CancerSEA database (http://biocc.hrbmu.edu.cn/CancerSEA/goDownload (accessed on 10 June 2026)).
4.2. Multi-Omics and Spatial Signature Analysis
Differentially expressed genes were identified with the limma package. Thresholds were a log2 fold change ≥ 1 with BH-adjusted p < 0.0001 for the Ivy GAP (hypoxic n = 49 versus non-hypoxic n = 73) and CGGA (IDH-wildtype n = 418 versus IDH-mutant n = 499) comparisons, with an additional average-expression filter (AveExpr > 4) applied to the GSE100736 TMZ-resistant (n = 3) versus TMZ-sensitive (n = 3) comparison. Kaplan–Meier curves with log-rank tests compared overall survival (OS) between GMFG-high and GMFG-low groups. The prognostic value of the five gene signatures (EMT-like, invasion, intracranial infiltration, proliferation, and hypoxia) was validated in the CGGA cohort (n = 966) using median signature score stratification. Associations between GMFG expression and clinicopathologic features were further evaluated. The multi-omics GBM dataset from a previously published study was used as the validation dataset [48]. Spatial transcriptomic data were processed and visualized with the SPATA2 R package, and signature GSVA scores (EMT-like, invasion, intracranial infiltration, proliferation, and hypoxia) were mapped onto spatial coordinates and displayed as heatmaps showing each signature’s distribution across glioma tissue architecture. Co-localization of these five signatures in space was quantified by bivariate Moran’s I (global; 1000 permutation tests with BH correction) and bivariate local LISA (spot level; KNN k = 6), using both full signature gene sets and non-overlapping gene sets after removing shared genes (Supplementary Table S11).
4.3. Cell Culture
A-172 and U-87 MG cell lines were obtained from the National Infrastructure of Cell Line Resource (NICR, Beijing, China; resource numbers: 1101HUM-PUMC000941 and 1101HUM-PUMC000208, respectively). Notably, the U-87 MG line distributed by ATCC differs genetically from the original Uppsala isolate [49]. Both cell lines underwent short tandem repeat (STR) authentication before distribution (Supplementary Table S12). Cells within passages 3–8 were used for all experiments. Mycoplasma testing was performed by NICR before release and repeated in our laboratory before phenotypic assays; all results were negative. They were cultured in DMEM medium (Hyclone, Logan, UT, USA) containing 10% fetal bovine serum (FBS, Gibco, Grand Island, NY, USA) and 1% penicillin-streptomycin (P/S, Gibco, Grand Island, NY, USA). All cells were incubated at 37 °C with 5% CO2 in a cell incubator (Thermo Scientific, Waltham, MA, USA).
4.4. Lentiviral Transduction of GBM Cells
Lentiviral transduction was performed according to the manufacturer’s protocol. Sequences of GMFG shRNA and non-targeting scramble shRNA are listed in Supplementary Table S13. Briefly, cells were seeded in 6-well plates and transduced with GFP-labeled GMFG shRNA lentivirus (Genechem Co., Shanghai, China) 24 h later. After 8 h of incubation, the medium was refreshed, and transduction efficiency was verified by fluorescence microscopy 72 h later. Cells were then collected for subsequent in vitro assays.
4.5. Quantitative Real-Time PCR
Equal numbers of A-172 and U-87 MG cells were lysed and total RNA was prepared using TRIzol (Clontech, Mountain View, CA, USA, 3101-100) following the manufacturer’s protocol. cDNA was synthesized using a high-capacity cDNA synthesis kit (Promega, Madison, WI, USA, M1705), and qRT-PCR was performed using SYBR® Premix Ex Taq™ (Perfect Real Time) (TaKaRa, Kusatsu, Shiga, Japan, RR041B). Primer sequences are listed in Supplementary Table S14. Gene expression was calculated using the ΔΔCt method. All qRT-PCR measurements were performed in three independent biological replicates.
4.6. Western Blotting
Whole-cell lysate was prepared by lysis in RIPA buffer supplemented with a protease inhibitor cocktail. After incubation on ice (15 min), lysates were cleared by centrifugation. The lysate protein concentration was measured by the BCA (Beyotime Institute of Biotechnology, Shanghai, China) method. Proteins were separated in 12% SDS-PAGE gels and transferred to 0.45 μm PVDF membranes at 250 mA. After being blocked in 5% milk in TBST for 1 h, the membranes were incubated with a primary antibody at 4 °C overnight. Secondary antibodies were used at a 1:10,000 ratio for chemiluminescent detection of primary antibody binding. Immunoblots were developed with the ECL substrates (Biosharp, Hefei, China) and imaged using a MyECL imager. The following primary antibodies were used in this study: GMFG (Proteintech, Rosemont, IL, USA, 13625-1-AP) and tubulin (ABclonal, Woburn, MA, USA, AC012). The following secondary antibodies were used: anti-rabbit IgG (CST, Danvers, MA, USA, #7074) and anti-mouse IgG (CST, Danvers, MA, USA, #7076). Band intensities were quantified by densitometry; for each independent experiment, the GMFG signal was normalized to the tubulin loading control on the same membrane, and the normalized values from three independent blots were used for statistical analysis.
4.7. CCK-8 Assay
Cell viability was assessed using the Cell Counting Kit-8 (Dojindo, Kumamoto, Japan, CK04). GBM cells (2 × 10³ cells per well) were inoculated into 96-well plates. Ten microliters of CCK-8 solution was added to treated cells at 24 h, 48 h, 72 h, 96 h, and 120 h. After 30 min of incubation, the optical density (OD) value was measured at 450 nm using a microplate reader to evaluate cell viability. All experiments were performed in three independent biological replicates.
4.8. Celigo Scratch Assay
Cell migration was evaluated using a Celigo-based scratch assay. Cells (1 × 10⁴/well) were inoculated into 96-well plates until the cells adhered. Once the cells reached confluence, a scratch was introduced into the monolayer using a 1000 μL pipette tip, and the wells were then washed three times with PBS. Subsequently, the residual scratch area was quantified at the indicated time points (24 h for A-172 and 8 h for U-87 MG, reflecting their differing proliferation rates) using ImageJ software (1.54f). Because GMFG knockdown reduced cell viability, wound closure integrated contributions from both migration and proliferation; cells were therefore grown to full confluence before scratching to suppress cell division, and reading endpoints were shortened to precede substantial cell division [50]. The migration phenotype was corroborated by the Transwell assays.
4.9. Cell Transwell Migration and Invasion Assay
Cells were seeded in the upper chamber at the density of 1 × 10⁴/well, and the lower chamber was filled with medium containing 5% FBS as a chemoattractant. The upper compartment was precoated with Matrigel (BD Biosciences, San Diego, CA, USA) for the invasion assay but not for the migration assay. The chambers were incubated at 37 °C for 24 h. Cells on the lower surface were washed with PBS, fixed in 4% paraformaldehyde for 5 min and stained with 0.1% crystal violet. Finally, images of the stained cells were captured under an inverted light microscope. Migration and invasion assays were each performed in three independent biological replicates.
4.10. Apoptosis Detection
Apoptotic cells were assessed using the Annexin V Apoptosis Kit (eBioscience, San Diego, CA, USA, 88-8007). Cells (1 × 10⁶) transduced with lentivirus were cultured for 72 h. Cells were harvested, washed twice with PBS and resuspended in 1× binding buffer. The cells were stained with 10 μL Annexin V-APC for 20 min at room temperature. Finally, the stained cells were detected by flow cytometry (Millipore, Burlington, MA, USA) to determine the proportion of Annexin V-APC-positive cells. Gating strategy: Intact cells were gated based on forward scatter (FSC) and side scatter (SSC) to exclude cellular debris. Annexin V-APC-positive cells were defined by fluorescence above the negative-control threshold. Notably, only Annexin V-APC single staining was used without PI co-staining; thus, early apoptosis, late apoptosis, and necrotic cells could not be distinguished.
4.11. Immune Infiltration and Tumor Microenvironment Analysis
Correlations between GMFG expression and immune cell marker genes (CD8+ T cells, Tregs, exhausted T cells, dendritic cells, M1/M2 macrophages, monocytes, MDSCs, B cells, neutrophils, and NK cells) were assessed using TIMER2.0 with tumor purity adjustment. Immune-checkpoint gene expression was compared between GMFG-high and GMFG-low IDH-wildtype glioma subgroups (n = 76 per group) using the Wilcoxon rank-sum test.
4.12. Single-Cell Transcriptomic Analysis
Single-cell RNA-seq UMI count matrices for dataset GSE182109 were downloaded from the GEO database, including 11 tissue fragments from 2 LGG and 2 ndGBM patients. Raw data processing was performed using Seurat (v4.0.4). Briefly, cells with <1000 UMIs, <500 detected genes, or >20% mitochondrial UMIs were filtered out, and genes detected in <3 cells were excluded. Counts were log-normalized with a scale factor of 10,000, and the top 2000 highly variable genes were selected. Anchor-based integration was applied to merge multiple samples, followed by PCA with the top 50 principal components (selected by elbow plot) for Louvain clustering (resolution = 0.6). Clustering results were visualized by t-SNE and UMAP. Unsupervised clustering yielded 25 clusters, which were annotated into 11 major cell populations (macrophages, microglia, monocytes, T cells, oligodendrocytes, endothelial cells, pericytes, astrocytes, Schwann precursor cells, neurons, and neural stem cells) based on FindAllMarkers results (avg_log2FC ≥ 0.5, pct difference ≥ 0.25, adjusted p ≤ 0.05), combined with ScType, published marker genes, and the CellMarker 2.0 database. CopyKat-based CNV inference was performed to distinguish aneuploid malignant glioma cells from diploid non-malignant cells.
Differential expression analysis between cell subsets was performed using FindMarkers. Cells were stratified into GMFG-high (>median) and GMFG-low (≤median) groups based on per-cell GMFG expression for compositional comparison. To avoid pseudoreplication, each patient was treated as an independent biological unit, and all patient-level results are presented as exploratory descriptions. Cell–cell communication was analyzed with CellChat (v1.0.0) using the secreted-signaling reference database [51]. For tumor–Chemo_TAM interaction analysis, Chemo_TAMs and aneuploid malignant glioma cells from the 2 pooled ndGBM patients were used as inputs, and all ligand–receptor interactions are reported as exploratory predictions.
4.13. Myeloid and T-Cell Subset and Cell–Cell Communication Analysis
Myeloid and T-cell populations were extracted from the GBM single-cell data for sub-clustering. Following published annotation standards [52], myeloid cells were further divided into seven subsets—Hypoxia_TAM, chemotaxis (Chemo)-TAM, interferon (IFN)-TAM, lipid_TAM, ribosome (Ribo) TAM, antigen presentation (Phago/AP)-TAM, and Mg_TAM—with marker genes: Hypoxia_TAM (ADM, BNIP3, CSTB, SLC2A1, ENO2, HK2), Chemo_TAM (CCL2, CCL5, CXCR4), IFN_TAM (IFIT1, IFIT3, MX1, CXCL10), Lipid_TAM (APOE, APOC1), Ribo_TAM (RPL13, RPL19, RPS6, RPS18), Phago_AP_TAM (CD83, HLA-DRA, CD68), and Mg_TAM (TMEM119, P2RY12). T cells were classified into Effector_T (GZMB, PRF1, IFNG, TNF, NR4A1, CD69), Exhausted_T (PDCD1, LAG3, TIGIT, HAVCR2, TOX), Stem_T (TCF7, IL7R, SELL), Treg (FOXP3, IL2RA), and Tissue_Resident_T (ITGAE, ZNF683, CXCR6).
4.14. Pathway Enrichment
For the GBM expression matrix, samples were split into GMFG-high and GMFG-low groups by the median GMFG expression. For bulk RNA-seq, gene-set enrichment analysis (GSEA v4.3.3) was performed using MSigDB c2 (KEGG) and c5 (GO biological process) gene sets with 1000 phenotypic permutations; significance thresholds were |NES| > 1 and adjusted p < 0.05. Separately, single-sample GSEA (ssGSEA) with Hallmark gene sets was performed to score pathway activation in each myeloid subset.
4.15. Download and Processing of MRI Data
CE-MRI data were obtained from the CGGA database for glioma patients with pre-operative T1 contrast-enhanced MRI, RNA-seq expression data, and complete clinicopathological data; cases with missing CE sequences, corrupted images, or absent expression data were excluded, leaving 165 patients with complete multimodal data, and subsequent subgroup analyses were restricted to the IDH-wildtype population. Tumor masks were manually segmented, and the total tumor volume (log10-transformed owing to skewness), mean CE enhancement signal, and standardized enhancement ratio (ce_ratio; enhancing pixels above a grayscale threshold of 150 divided by total tumor-mask pixels) were computed for each tumor. Between-group differences were tested by the Wilcoxon rank-sum test, and linear associations between GMFG expression and quantitative imaging metrics were tested by Spearman rank correlation.
4.16. Source and Preprocessing of Ivy GAP Gene Expression Data
The expression matrix was log2(FPKM+1)-transformed after mapping gene IDs to gene symbols. Samples were divided into five spatial regions: LE, IT (infiltrating tumor), CT (core tumor), MVP, and PAN; MVP and PAN were defined as hypoxic regions, and LE, IT, and CT were defined as as non-hypoxic regions. Expression differences across the five regions were assessed by the Kruskal–Wallis test (with Dunn’s post hoc test for pairwise comparisons), and hypoxic versus non-hypoxic comparisons were performed using the Wilcoxon rank-sum test, with Hodges–Lehmann median differences and 95% CIs reported. All raw p-values, corrected FDR values, sample sizes, effect sizes, and 95% CIs are provided in Supplementary Table S15.
4.17. GDSC Drug-Response Analysis
Drug-response prediction was performed with the oncoPredict R package (v0.2.2) based on the GDSC2 dataset. The CGGA glioma transcriptomic dataset (n = 1018) served as the test set with empirical Bayesian batch correction; drugs with excessive missingness or low variance were excluded. To remove confounding by IDH status, correlation analyses were restricted to IDH-wildtype samples with complete clinical, molecular, and GMFG expression metadata (final n = 280). Pearson correlation was used to assess the association between continuous GMFG expression and log2-transformed predicted IC50 for each drug. Drugs were visualized by prespecified criteria (BH-corrected FDR < 0.05 and |r| > 0.3; up to the top 9 by ascending corrected p-value), and IDH-wildtype samples were divided into GMFG-high/low groups by median expression for boxplot comparisons.
4.18. Epigenetic Analysis
Pan-cancer whole-genome methylation analysis included 8301 primary tumor samples across 32 TCGA solid tumors, depicting the global methylation landscape of human malignancies. A pan-cancer boxplot of the mean β-value across the 15 GMFG CpG probes was generated for 32 TCGA solid tumors. Methylation at each CpG probe was measured and correlated with GMFG expression at the probe level. Wilcoxon tests assessed GMFG methylation differences between LGG and GBM. GBM samples were grouped into hyper- and hypomethylated groups by the GMFG methylation level, comparing expression and prognostic significance. The 15 CpG probes and their genomic annotations are listed in Supplementary Table S16.
Public multi-omics datasets were retrieved from the published study [48]. Raw preprocessed tables provided by the original publication were downloaded and reanalyzed without additional normalization in the present work. Correlation analyses were performed to evaluate the association between GMFG K74 acetylation abundance and GMFG mRNA/protein levels in GBM samples. Notably, K74 acetylation signal was detectable only within a subset of patient specimens in this public resource.
4.19. Genomic Variation and Chemical–Gene Interaction Analysis
Chemical–GMFG interactions were retrieved from the CTD database, and literature-validated small molecules were visualized as a bubble plot showing interaction counts. Somatic mutation and copy number alteration (amplification/deletion) frequencies of GMFG in GBM and pan-cancer cohorts were queried via cBioPortal (https://www.cbioportal.org/ (accessed on 23 July 2026)) to characterize its genetic variation [53]. Somatic SNV profiles were additionally analyzed in the TCGA-GBM cohort (n = 403) using the GSCA database (http://bioinfo.life.hust.edu.cn/GSCA/ (accessed on 23 July 2026)).
4.20. Univariate and Multivariate Cox Regression Analyses
Univariate and multivariate Cox proportional hazards (PHs) regression analyses were performed using the CGGA cohort to evaluate the independent prognostic value of GMFG. Samples with missing values for key covariates were excluded during model construction. Univariate Cox PH regression was used to screen candidate prognostic variables, including GMFG expression, age group, primary/recurrent status, radiotherapy status, TMZ chemotherapy status, 1p/19q codeletion status, IDH mutation status, WHO grade, and MGMT promoter methylation status. A total of 966 samples with available GMFG expression data were included; after excluding 302 samples with missing covariates, 664 patients (434 death events) were enrolled in the final multivariate model. For multivariate Cox regression, 302 samples with missing covariates (age, recurrent status, TMZ chemotherapy, 1p/19q codeletion, IDH mutation status, WHO grade, and MGMT promoter methylation status) were excluded. Variables with p < 0.05 in univariate analysis were entered into the multivariate Cox model. In addition, GMFG expression was pre-specified and forced into the model regardless of univariate p value, to evaluate whether GMFG represented an independent prognostic factor for OS after adjustment for other clinical and molecular covariates. Results were reported as hazard ratios (HRs) with corresponding 95% CI values and p-values. The cox.zph function was applied to test the PH assumption for individual covariates and the global model. All statistical tests were two-sided, and p < 0.05 was considered statistically significant.
4.21. Statistical Analysis
All statistical analyses were performed in R (v4.4.1) with RStudio (2024.04.2, Build 764). Two-group and multi-group comparisons were performed using Wilcoxon rank-sum and Kruskal–Wallis tests, respectively. Survival differences were assessed by Kaplan–Meier analysis with log-rank tests. Correlations between continuous variables were evaluated by Pearson or Spearman correlation analysis. The BH method was used for multiple testing correction, with p < 0.05 set as the significance threshold. Statistical significance was indicated by asterisks: *, p < 0.05; **, p < 0.01; ***, p < 0.001; ****, p < 0.0001.
Data processing, statistical computation, and visualization relied on the following R packages with specified versions: ggplot2 (v4.0.1), ggpubr (v0.6.0), ggrepel (v0.9.5), ggsci (v3.2.0), patchwork (v1.3.2), cowplot (v1.1.3), pheatmap (v1.0.13), data.table (v1.15.4), limma (v3.60.4), survival (v3.7.0), survminer (v0.5.2), forestploter (v1.1.3), clusterProfiler (v4.12.6), org.Hs.eg.db (v3.19.1), enrichplot (v1.24.4), GSVA (v1.52.3), irGSEA (v3.3.3), ComplexHeatmap (v2.20.0), circlize (v0.4.17), GEOquery (v2.72.0), maftools (v2.20.0), SPATA2 (v3.1.4), Seurat (v4.0.4), CellChat (v1.0.0), oncoPredict (v0.2.2), sva (v3.52.0), glmmTMB (v1.1.14), DHARMa (v0.4.7), performance (v0.19.0), msigdbr (v25.1.1), RColorBrewer (v1.1.3), viridis (v0.6.5), broom (v1.0.6), rstatix (v0.7.3), extrafont (v0.20), car (v3.1.2), RANN (v2.6.1), Matrix (v1.7.0), Biobase (v2.64.0), TCGAmutations (v0.4.0).
5. Conclusions
Correlative multi-omics data indicate that GMFG upregulation is associated with epigenetic alterations, including GMFG CpG hypomethylation and K74 acetylation, and GMFG is highly enriched in Chemo_TAM. These findings reveal correlative relationships between altered GMFG expression, epigenetic modification, and the myeloid cell compartment in glioblastoma. In vitro experiments verify that GMFG facilitates GBM cell viability, migration, and invasion, and that GMFG knockdown increases Annexin V-APC positivity. Drug sensitivity predictions indicate that most of the nine candidate agents showed lower predicted IC50 in GMFG-high tumors. Collectively, GMFG expression correlates with epigenetic features, in vitro malignant phenotypes, and predicted drug-response patterns. Further work is needed to validate these observations and explore its potential for combinatorial therapeutic development.
Supplementary Materials
The following supporting information can be downloaded at: https://www.mdpi.com/article/10.3390/ijms272210288/s1.
Author Contributions
H.D.: writing—original draft, methodology, data curation, formal analysis, and investigation. T.Z.: writing—review and editing. P.S.: review and editing, as well as methodology. N.H.: review and editing. Q.Q.: review and validation. J.B.: review and methodology. M.Z.: conceptualization, resources, supervision, review, and editing. All authors have read and agreed to the published version of the manuscript.
Funding
This research was funded by the Beijing Huakang Public-Welfare Foundation, grant number “EXZL-GX-080”.
Institutional Review Board Statement
Not applicable.
Informed Consent Statement
Not applicable.
Data Availability Statement
The datasets analyzed in this study are publicly available. The TCGA, CGGA, Ivy-GAP, and GSE series datasets can be accessed from the corresponding public databases, whose URLs are provided in the Section 4. The raw proteomic and acetylation modification data were derived from a published proteogenomic study of glioblastoma and can be downloaded from the original publication. The fully annotated R analysis scripts are available from the corresponding author upon reasonable request.
Conflicts of Interest
The authors declare no conflicts of interest.
Abbreviations
The following abbreviations are used in this manuscript:
| BPA | Bisphenol A |
| BH | Benjamini–Hochberg |
| CAF | Cancer-associated fibroblast |
| CAR-T | chimeric antigen receptor T-cell |
| CCK-8 | Cell Counting Kit-8 |
| CGGA | Chinese Glioma Genome Atlas |
| Chemo_TAM | Chemotaxis-TAM |
| CI | confidence interval |
| C-index | concordance index |
| CNA | copy number alteration |
| CNV | copy number variant |
| CpG | cytosine–phosphate–guanine dinucleotide |
| COAD | colon adenocarcinoma |
| CPTAC | Clinical Proteomic Tumor Analysis Consortium |
| CT | cellular tumor |
| CTD | Comparative Toxicogenomics Database |
| DEG | differentially expressed genes |
| EMT | epithelial-mesenchymal transition |
| EOC | epithelial ovarian cancer |
| FAP | fibroblast activation protein |
| FDR | false discovery rate |
| G-CIMP | glioma CpG island methylator phenotype |
| GBM | glioblastoma |
| GDSC | Genomics of Drug Sensitivity in Cancer |
| GEO | Gene Expression Omnibus |
| GEPIA | Gene Expression Profiling Interactive Analysis |
| GFP | green fluorescent protein |
| GMFG | glia maturation factor-γ |
| GSC | glioma stem cell |
| GSCA | Gene Set Cancer Analysis |
| GSEA | Gene Set Enrichment Analysis |
| GSVA | Gene Set Variation Analysis |
| HPA | Human Protein Atlas |
| IC50 | half-maximal inhibitory concentration |
| ICI | immune checkpoint inhibitor |
| IDH | isocitrate dehydrogenase |
| IFN | interferon |
| IL | interleukin |
| IT | infiltrating tumor |
| HR | hazard ratio |
| KIRP | kidney renal papillary cell carcinoma |
| LE | leading edge |
| LGG | low-grade glioma |
| LISA | local indicators of spatial association |
| MAPK | mitogen-activated protein kinase |
| MDSC | myeloid-derived suppressor cell |
| MGMT | O6-methylguanine-DNA methyltransferase |
| MVP | microvascular proliferation |
| ndGBM | newly diagnosed glioblastoma |
| NES | normalized enrichment score |
| NK | natural killer cell |
| OD450 | optical density at 450 nm |
| OS | overall survival |
| PAN | pseudopalisading cells around necrosis |
| PDB | Protein Data Bank |
| PH | proportional hazard |
| PRS | Primary-Recurrent-Secondary |
| READ | rectum adenocarcinoma |
| QC | quality control |
| SNP | single nucleotide polymorphism |
| SNV | single nucleotide variant |
| ssGSEA | single-sample gene set enrichment analysis |
| STAT | signal transducer and activator of transcription |
| TAM | tumor-associated macrophage |
| TCGA | The Cancer Genome Atlas |
| THCA | thyroid carcinoma |
| TIMER | Tumor Immune Estimation Resource |
| TGCT | testicular germ cell tumor |
| TME | tumor microenvironment |
| TMZ | temozolomide |
| Treg | regulatory T cell |
| t-SNE | t-distributed stochastic neighbor embedding |
| TTFields | tumor-treating fields |
| 2-HG | 2-hydroxyglutarate |
References
- Louis, D.N.; Perry, A.; Wesseling, P.; Brat, D.J.; Cree, I.A.; Figarella-Branger, D.; Hawkins, C.; Ng, H.K.; Pfister, S.M.; Reifenberger, G.; et al. The 2021 WHO Classification of Tumors of the Central Nervous System: A summary. Neuro Oncol. 2021, 23, 1231–1251. [Google Scholar] [CrossRef] [Scilit] [PubMed]
- Grochans, S.; Cybulska, A.M.; Simińska, D.; Korbecki, J.; Kojder, K.; Chlubek, D.; Baranowska-Bosiacka, I. Epidemiology of Glioblastoma Multiforme-Literature Review. Cancers 2022, 14, 2412. [Google Scholar] [CrossRef] [Scilit] [PubMed]
- Stupp, R.; Taillibert, S.; Kanner, A.; Read, W.; Steinberg, D.; Lhermitte, B.; Toms, S.; Idbaih, A.; Ahluwalia, M.S.; Fink, K.; et al. Effect of Tumor-Treating Fields Plus Maintenance Temozolomide vs Maintenance Temozolomide Alone on Survival in Patients with Glioblastoma: A Randomized Clinical Trial. JAMA 2017, 318, 2306–2316, Erratum in JAMA 2018, 319, 1824. [Google Scholar] [CrossRef] [Scilit] [PubMed]
- Dymova, M.A.; Kuligina, E.V.; Richter, V.A. Molecular Mechanisms of Drug Resistance in Glioblastoma. Int. J. Mol. Sci. 2021, 22, 6385. [Google Scholar] [CrossRef] [Scilit] [PubMed]
- Zhang, H.; Li, Y. Temozolomide-Derived Therapeutic Strategies to Overcome Resistance in Glioblastoma. J. Med. Chem. 2025, 68, 18810–18828. [Google Scholar] [CrossRef] [Scilit] [PubMed]
- Tang, J.; Karbhari, N.; Campian, J.L. Therapeutic Targets in Glioblastoma: Molecular Pathways, Emerging Strategies, and Future Directions. Cells 2025, 14, 494. [Google Scholar] [CrossRef] [Scilit] [PubMed]
- Tang, J.; Yang, R. All-Trans Retinoic Acid Induces Differentiation and Downregulates Stemness Markers and MGMT Expression in Glioblastoma Stem Cells. Cells 2025, 14, 746. [Google Scholar] [CrossRef] [Scilit] [PubMed]
- Pouyan, A.; Ghorbanlo, M.; Eslami, M.; Jahanshahi, M.; Ziaei, E.; Salami, A.; Mokhtari, K.; Shahpasand, K.; Farahani, N.; Meybodi, T.E.; et al. Glioblastoma multiforme: Insights into pathogenesis, key signaling pathways, and therapeutic strategies. Mol. Cancer 2025, 24, 58, Correction in Mol. Cancer 2026, 25, 156. [Google Scholar] [CrossRef] [Scilit] [PubMed]
- Li, J.; Ross, J.L.; Hambardzumyan, D.; Brat, D.J. Immunopathology of Glioblastoma. Annu. Rev. Pathol. 2026, 21, 135–162. [Google Scholar] [CrossRef] [Scilit] [PubMed]
- Chen, S.; Yu, P.; Sun, Y.; Yan, Y.; Zhang, B.; Li, G. Hypoxia-induced PRMT6 expression promotes temozolomide chemoresistance in glioblastoma via G3BP1. J. Transl. Med. 2026, 24, 226. [Google Scholar] [CrossRef] [Scilit] [PubMed]
- Tang, J.; Amin, M.A.; Campian, J.L. Glioblastoma Stem Cells at the Nexus of Tumor Heterogeneity, Immune Evasion, and Therapeutic Resistance. Cells 2025, 14, 562. [Google Scholar] [CrossRef] [Scilit] [PubMed]
- Politis, A.; Stavrinou, L.; Kalyvas, A.; Boviatsis, E.; Piperi, C. Glioblastoma: Molecular features, emerging molecular targets and novel therapeutic strategies. Crit. Rev. Oncol./Hematol. 2025, 212, 104764. [Google Scholar] [CrossRef] [Scilit] [PubMed]
- Moreno-Sanchez, P.M.; Rezaeipour, M.; Inderberg, E.M.; Platten, M.; Golebiewska, A. Immunosuppressive mechanisms and therapeutic interventions shaping glioblastoma immunity. Nat. Cancer 2026, 7, 29–42. [Google Scholar] [CrossRef] [Scilit] [PubMed]
- Sung, J.Y.; Hwang, K. Breaking immune isolation in glioblastoma. Drug Resist. Updat. 2026, 87, 101412. [Google Scholar] [CrossRef] [Scilit] [PubMed]
- Goode, B.L.; Sweeney, M.O.; Eskin, J.A. GMF as an Actin Network Remodeling Factor. Trends Cell Biol. 2018, 28, 749–760. [Google Scholar] [CrossRef] [Scilit] [PubMed]
- Inagaki, M.; Aoyama, M.; Sobue, K.; Yamamoto, N.; Morishima, T.; Moriyama, A.; Katsuya, H.; Asai, K. Sensitive immunoassays for human and rat GMFB and GMFG, tissue distribution and age-related changes. Biochim. Biophys. Acta 2004, 1670, 208–216. [Google Scholar] [CrossRef] [Scilit] [PubMed]
- Lamm, N.; Read, M.N.; Nobis, M.; Van Ly, D.; Page, S.G.; Masamsetti, V.P.; Timpson, P.; Biro, M.; Cesare, A.J. Nuclear F-actin counteracts nuclear deformation and promotes fork repair during replication stress. Nat. Cell Biol. 2020, 22, 1460–1470. [Google Scholar] [CrossRef] [Scilit] [PubMed]
- Debaugnies, M.; Rodríguez-Acebes, S.; Blondeau, J.; Parent, M.A.; Zocco, M.; Song, Y.; de Maertelaer, V.; Moers, V.; Latil, M.; Dubois, C.; et al. RHOJ controls EMT-associated resistance to chemotherapy. Nature 2023, 616, 168–175. [Google Scholar] [CrossRef] [Scilit] [PubMed]
- Tso, J.L.; Yang, S.; Menjivar, J.C.; Yamada, K.; Zhang, Y.; Hong, I.; Bui, Y.; Stream, A.; McBride, W.H.; Liau, L.M.; et al. Bone morphogenetic protein 7 sensitizes O6-methylguanine methyltransferase expressing-glioblastoma stem cells to clinically relevant dose of temozolomide. Mol. Cancer 2015, 14, 189. [Google Scholar] [CrossRef] [Scilit] [PubMed]
- Suresh, R.; Diaz, R.J. The remodelling of actin composition as a hallmark of cancer. Transl. Oncol. 2021, 14, 101051. [Google Scholar] [CrossRef] [Scilit] [PubMed]
- Aerbajinai, W.; Liu, L.; Chin, K.; Zhu, J.; Parent, C.A.; Rodgers, G.P. Glia maturation factor-γ mediates neutrophil chemotaxis. J. Leukoc. Biol. 2011, 90, 529–538. [Google Scholar] [CrossRef] [Scilit] [PubMed]
- Aerbajinai, W.; Ghosh, M.C.; Liu, J.; Kumkhaek, C.; Zhu, J.; Chin, K.; Rouault, T.A.; Rodgers, G.P. Glia maturation factor-γ regulates murine macrophage iron metabolism and M2 polarization through mitochondrial ROS. Blood Adv. 2019, 3, 1211–1225. [Google Scholar] [CrossRef] [Scilit] [PubMed]
- Aerbajinai, W.; Lee, K.; Chin, K.; Rodgers, G.P. Glia maturation factor-γ negatively modulates TLR4 signaling by facilitating TLR4 endocytic trafficking in macrophages. J. Immunol. 2013, 190, 6093–6103. [Google Scholar] [CrossRef] [Scilit] [PubMed]
- Lippert, D.N.; Wilkins, J.A. Glia maturation factor gamma regulates the migration and adherence of human T lymphocytes. BMC Immunol. 2012, 13, 21. [Google Scholar] [CrossRef] [Scilit] [PubMed]
- Aerbajinai, W.; Liu, L.; Zhu, J.; Kumkhaek, C.; Chin, K.; Rodgers, G.P. Glia Maturation Factor-γ Regulates Monocyte Migration through Modulation of β1-Integrin. J. Biol. Chem. 2016, 291, 8549–8564. [Google Scholar] [CrossRef] [Scilit] [PubMed]
- Li, Y.; Tang, Y.; Liu, J.; Meng, X.; Wang, Y.; Min, Q.; Hong, R.; Tsubata, T.; Hase, K.; Wang, J.Y. Glia maturation factor-γ is involved in S1P-induced marginal zone B-cell chemotaxis and optimal IgM production to type II T-independent antigen. Int. Immunol. 2022, 34, 35–43. [Google Scholar] [CrossRef] [Scilit] [PubMed]
- Zhang, T.L.; Zheng, B.W.; Xia, C.; Wu, P.F.; Zheng, B.Y.; Jiang, L.X.; Li, J.; Lv, G.H.; Zhou, H.; Huang, W.; et al. Hypoxic Upregulation of IER2 Increases Paracrine GMFG Signaling of Endoplasmic Reticulum Stress-CAF to Promote Chordoma Progression via Targeting ITGB1. Adv. Sci. 2024, 11, e2405421. [Google Scholar] [CrossRef] [Scilit] [PubMed]
- Crowell, H.L.; Soneson, C.; Germain, P.L.; Calini, D.; Collin, L.; Raposo, C.; Malhotra, D.; Robinson, M.D. muscat detects subpopulation-specific state transitions from multi-sample multi-condition single-cell transcriptomics data. Nat. Commun. 2020, 11, 6077. [Google Scholar] [CrossRef] [Scilit] [PubMed]
- Venkataramani, V.; Yang, Y.; Schubert, M.C.; Reyhan, E.; Tetzlaff, S.K.; Wißmann, N.; Botz, M.; Soyka, S.J.; Beretta, C.A.; Pramatarov, R.L.; et al. Glioblastoma hijacks neuronal mechanisms for brain invasion. Cell 2022, 185, 2899–2917.e2831. [Google Scholar] [CrossRef] [Scilit] [PubMed]
- Tetzlaff, S.K.; Reyhan, E.; Layer, N.; Bengtson, C.P.; Heuer, A.; Schroers, J.; Faymonville, A.J.; Langeroudi, A.P.; Drewa, N.; Keifert, E.; et al. Characterizing and targeting glioblastoma neuron-tumor networks with retrograde tracing. Cell 2025, 188, 390–411.e336. [Google Scholar] [CrossRef] [Scilit] [PubMed]
- Liu, J.; Zhu, X.; Gao, L.; Geng, R.; Tao, X.; Xu, H.; Chen, Z. Expression and Prognostic Role of Glia Maturation Factor-γ in Gliomas. Front. Mol. Neurosci. 2022, 15, 906762. [Google Scholar] [CrossRef] [Scilit] [PubMed]
- Zuo, P.; Ma, Y.; Huang, Y.; Ye, F.; Wang, P.; Wang, X.; Zhou, C.; Lu, W.; Kong, B.; Xie, X. High GMFG expression correlates with poor prognosis and promotes cell migration and invasion in epithelial ovarian cancer. Gynecol. Oncol. 2014, 132, 745–751. [Google Scholar] [CrossRef] [Scilit] [PubMed]
- Singh, S.; Dey, D.; Barik, D.; Mohapatra, I.; Kim, S.; Sharma, M.; Prasad, S.; Wang, P.; Singh, A.; Singh, G. Glioblastoma at the crossroads: Current understanding and future therapeutic horizons. Signal Transduct. Target. Ther. 2025, 10, 213. [Google Scholar] [CrossRef] [Scilit] [PubMed]
- Nomura, M.; Raviram, R.; Schiffman, J.S.; Bussema, L.; Lu, V.; Wheeler, N.; Lee, J.J.Y.; Fan, Y.; Zheng, M.H.; Ruiz, F.; et al. Longitudinal changes in DNA methylation in IDH-mutant glioma fuel disease progression through altered cell state differentiation. Nat. Genet. 2026, 58, 1651–1660. [Google Scholar] [CrossRef] [Scilit] [PubMed]
- Aerbajinai, W.; Zhu, J.; Chin, K.; Rodgers, G.P. Glia maturation factor-γ regulates amyloid-β42 phagocytosis through scavenger receptor class A type I in murine macrophages. J. Leukoc. Biol. 2024, 117, qiae197. [Google Scholar] [CrossRef] [Scilit] [PubMed]
- Zhu, B.; Wan, J.; Zhang, X.; Yan, J.; Chen, X.; Guan, X.; Ren, Q.; Yang, T.; Wu, D.; Guo, Q.; et al. Stiffness-Activated Stellate Cells Drive Pancreatic Cancer Liver Colonization via GMFG-TNS4 Signaling. Adv. Sci. 2026, 13, e76173. [Google Scholar] [CrossRef] [Scilit] [PubMed]
- Corsaro, A.; Tremonti, B.; Bajetto, A.; Barbieri, F.; Thellung, S.; Florio, T. Chemokine signaling in tumors: Potential role of CXC chemokines and their receptors as glioblastoma therapeutic targets. Expert Opin. Ther. Targets 2024, 28, 937–952. [Google Scholar] [CrossRef] [Scilit] [PubMed]
- Campian, J.L.; Grossman, S.A.; Kask, A.S.; Kosydar, S.; Strowd, R.; Piotrowski, A.; Tang, J.; Chheda, M.G.; DiPersio, J.F.; Schullery, D.; et al. Phase I study of NT-I7, a long-acting interleukin-7, in severe treatment-related lymphopenia following standard radiation and temozolomide for high-grade glioma. Neuro-Oncol. Adv. 2025, 7, vdaf117. [Google Scholar] [CrossRef] [Scilit] [PubMed]
- Butt, O.H.; Singhal, K.; Luo, J.; Rettig, M.P.; Foltz, J.A.; Huang, J.; Zhou, A.Y.; Tao, Y.; Griffith, O.L.; Griffith, M.; et al. NT-I7, a Long-Acting Interleukin 7, Increases Lymphocyte Counts and Induces CD8+ T-cell Clonotype Expansion in Patients with Newly Diagnosed High-Grade Gliomas. Clin. Cancer Res. 2026, 32, 2581–2592. [Google Scholar] [CrossRef] [Scilit] [PubMed]
- Tang, J.; Miller, J.P.; Yang, R. Synergistic effect of thermoneutral housing and chronotherapeutic PD-1 blockade overcomes melanoma resistance. Biomed. Pharmacother. 2025, 190, 118413. [Google Scholar] [CrossRef] [Scilit] [PubMed]
- Goldman, M.J.; Craft, B.; Hastie, M.; Repečka, K.; McDade, F.; Kamath, A.; Banerjee, A.; Luo, Y.; Rogers, D.; Brooks, A.N.; et al. Visualizing and interpreting cancer genomics data via the Xena platform. Nat. Biotechnol. 2020, 38, 675–678. [Google Scholar] [CrossRef] [Scilit] [PubMed]
- Zhao, Z.; Zhang, K.N.; Wang, Q.; Li, G.; Zeng, F.; Zhang, Y.; Wu, F.; Chai, R.; Wang, Z.; Zhang, C.; et al. Chinese Glioma Genome Atlas (CGGA): A Comprehensive Resource with Functional Genomic Data from Chinese Glioma Patients. Genom. Proteom. Bioinform. 2021, 19, 1–12. [Google Scholar] [CrossRef] [Scilit] [PubMed]
- Clough, E.; Barrett, T.; Wilhite, S.E.; Ledoux, P.; Evangelista, C.; Kim, I.F.; Tomashevsky, M.; Marshall, K.A.; Phillippy, K.H.; Sherman, P.M.; et al. NCBI GEO: Archive for gene expression and epigenomics data sets: 23-year update. Nucleic Acids Res. 2024, 52, D138–D144. [Google Scholar] [CrossRef] [Scilit] [PubMed]
- Li, T.; Fu, J.; Zeng, Z.; Cohen, D.; Li, J.; Chen, Q.; Li, B.; Liu, X.S. TIMER2.0 for analysis of tumor-infiltrating immune cells. Nucleic Acids Res. 2020, 48, W509–W514. [Google Scholar] [CrossRef] [Scilit] [PubMed]
- Chandrashekar, D.S.; Karthikeyan, S.K.; Korla, P.K.; Patel, H.; Shovon, A.R.; Athar, M.; Netto, G.J.; Qin, Z.S.; Kumar, S.; Manne, U.; et al. UALCAN: An update to the integrated cancer data analysis platform. Neoplasia 2022, 25, 18–27. [Google Scholar] [CrossRef] [Scilit] [PubMed]
- Maeser, D.; Gruener, R.F.; Huang, R.S. oncoPredict: An R package for predicting in vivo or cancer patient drug response and biomarkers from cell line screening data. Brief. Bioinform. 2021, 22, bbab260. [Google Scholar] [CrossRef] [Scilit] [PubMed]
- Davis, A.P.; Wiegers, T.C.; Sciaky, D.; Barkalow, F.; Strong, M.; Wyatt, B.; Wiegers, J.; McMorran, R.; Abrar, S.; Mattingly, C.J. Comparative Toxicogenomics Database’s 20th anniversary: Update 2025. Nucleic Acids Res. 2025, 53, D1328–D1334. [Google Scholar] [CrossRef] [Scilit] [PubMed]
- Wang, L.B.; Karpova, A.; Gritsenko, M.A.; Kyle, J.E.; Cao, S.; Li, Y.; Rykunov, D.; Colaprico, A.; Rothstein, J.H.; Hong, R.; et al. Proteogenomic and metabolomic characterization of human glioblastoma. Cancer Cell 2021, 39, 509–528.e520. [Google Scholar] [CrossRef] [Scilit] [PubMed]
- Allen, M.; Bjerke, M.; Edlund, H.; Nelander, S.; Westermark, B. Origin of the U87MG glioma cell line: Good news and bad news. Sci. Transl. Med. 2016, 8, 354re353. [Google Scholar] [CrossRef] [Scilit] [PubMed]
- Liang, C.C.; Park, A.Y.; Guan, J.L. In vitro scratch assay: A convenient and inexpensive method for analysis of cell migration in vitro. Nat. Protoc. 2007, 2, 329–333. [Google Scholar] [CrossRef] [Scilit] [PubMed]
- Jin, S.; Guerrero-Juarez, C.F.; Zhang, L.; Chang, I.; Ramos, R.; Kuan, C.H.; Myung, P.; Plikus, M.V.; Nie, Q. Inference and analysis of cell-cell communication using CellChat. Nat. Commun. 2021, 12, 1088. [Google Scholar] [CrossRef] [Scilit] [PubMed]
- Wang, W.; Li, T.; Cheng, Y.; Li, F.; Qi, S.; Mao, M.; Wu, J.; Liu, Q.; Zhang, X.; Li, X.; et al. Identification of hypoxic macrophages in glioblastoma with therapeutic potential for vasculature normalization. Cancer Cell 2024, 42, 815–832.e812. [Google Scholar] [CrossRef] [Scilit] [PubMed]
- Cerami, E.; Gao, J.; Dogrusoz, U.; Gross, B.E.; Sumer, S.O.; Aksoy, B.A.; Jacobsen, A.; Byrne, C.J.; Heuer, M.L.; Larsson, E.; et al. The cBio cancer genomics portal: An open platform for exploring multidimensional cancer genomics data. Cancer Discov. 2012, 2, 401–404, Erratum in Cancer Discov. 2012, 2, 960. [Google Scholar] [CrossRef] [Scilit] [PubMed]
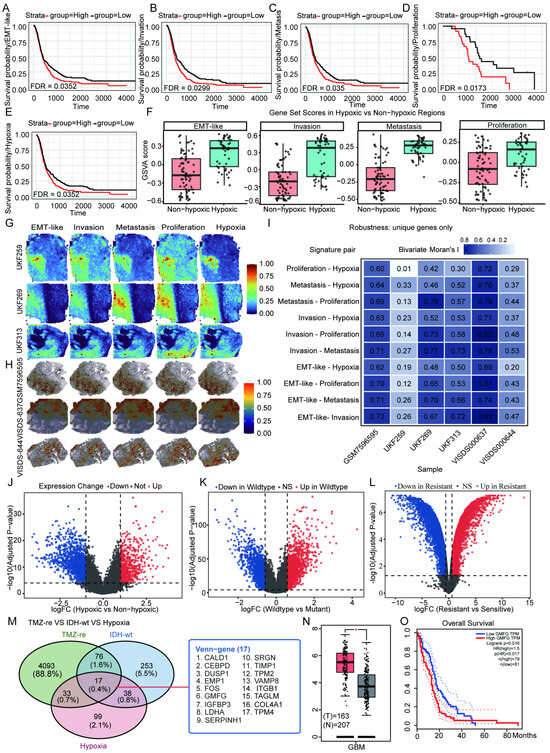
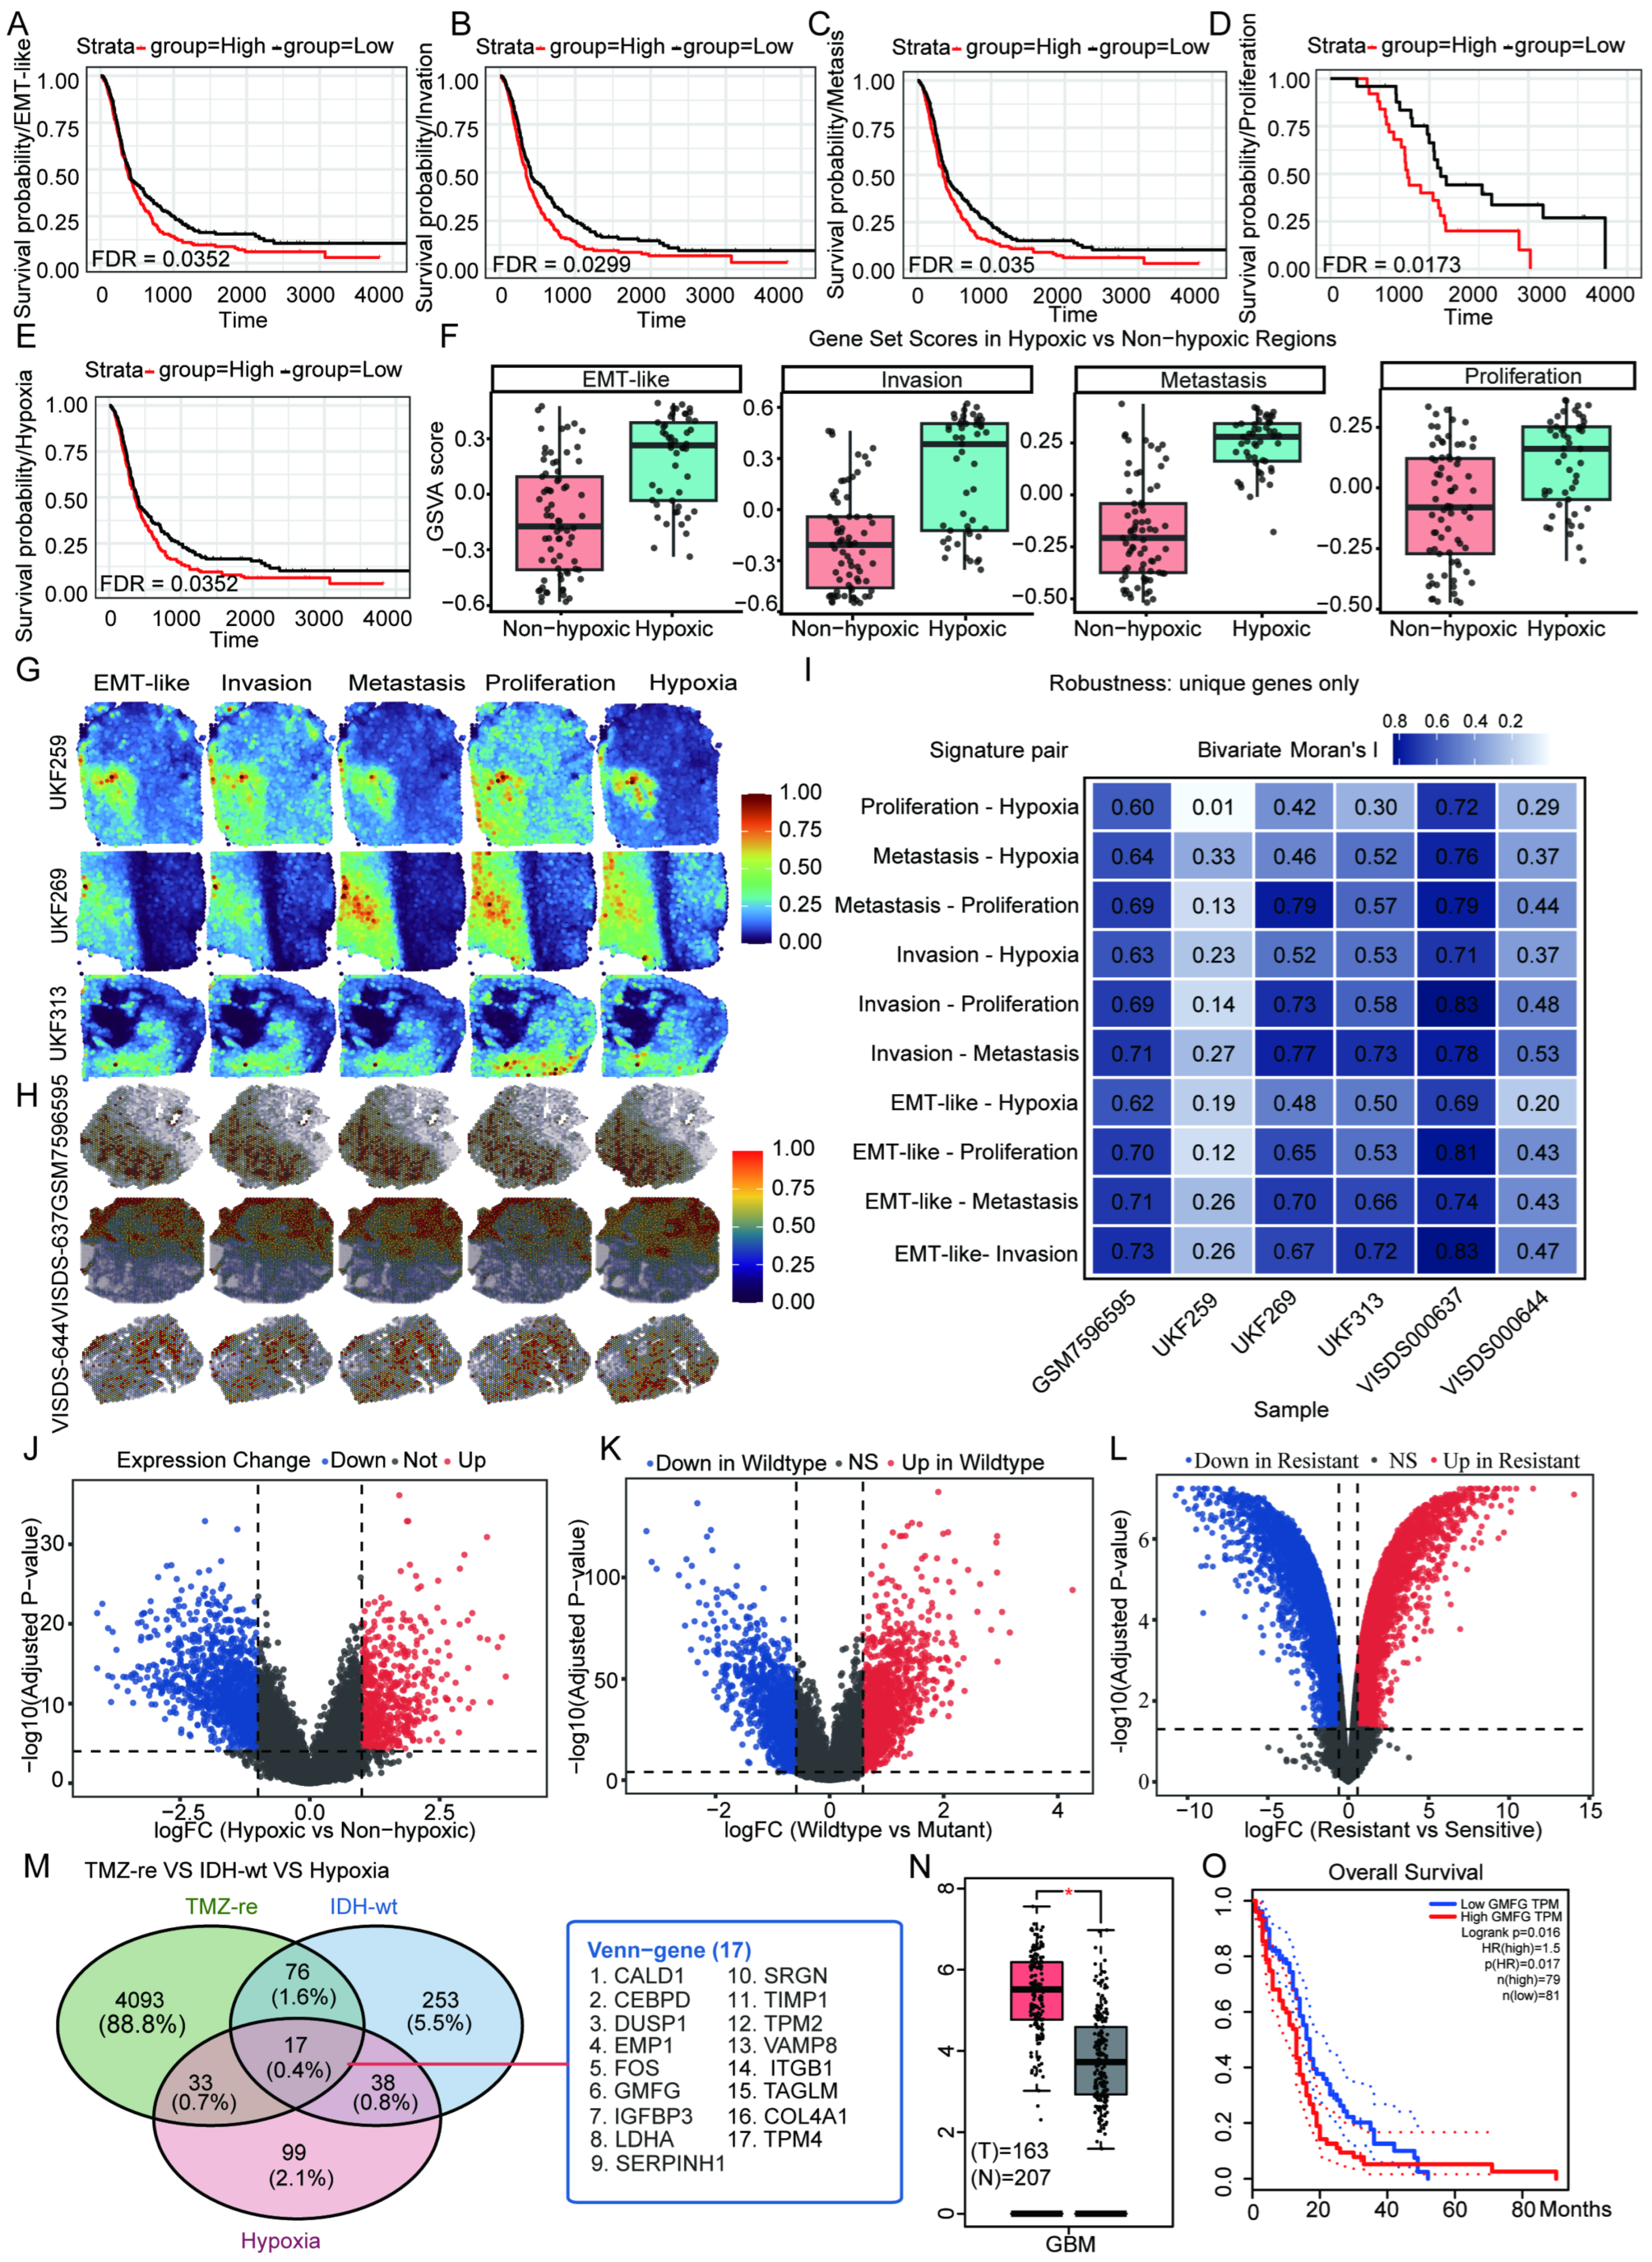
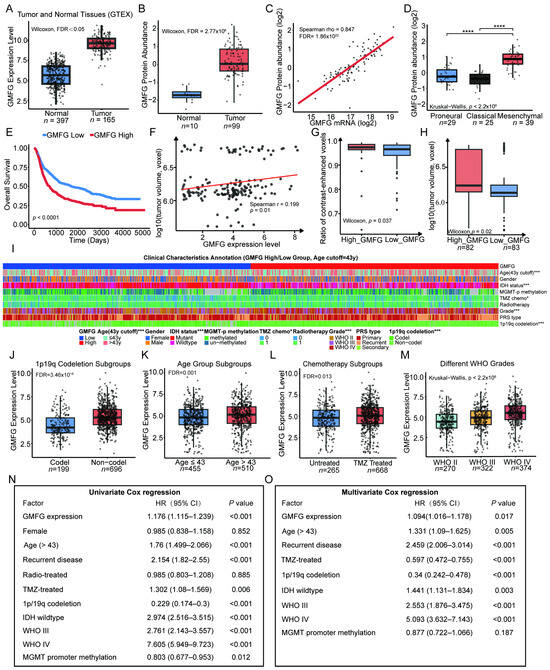
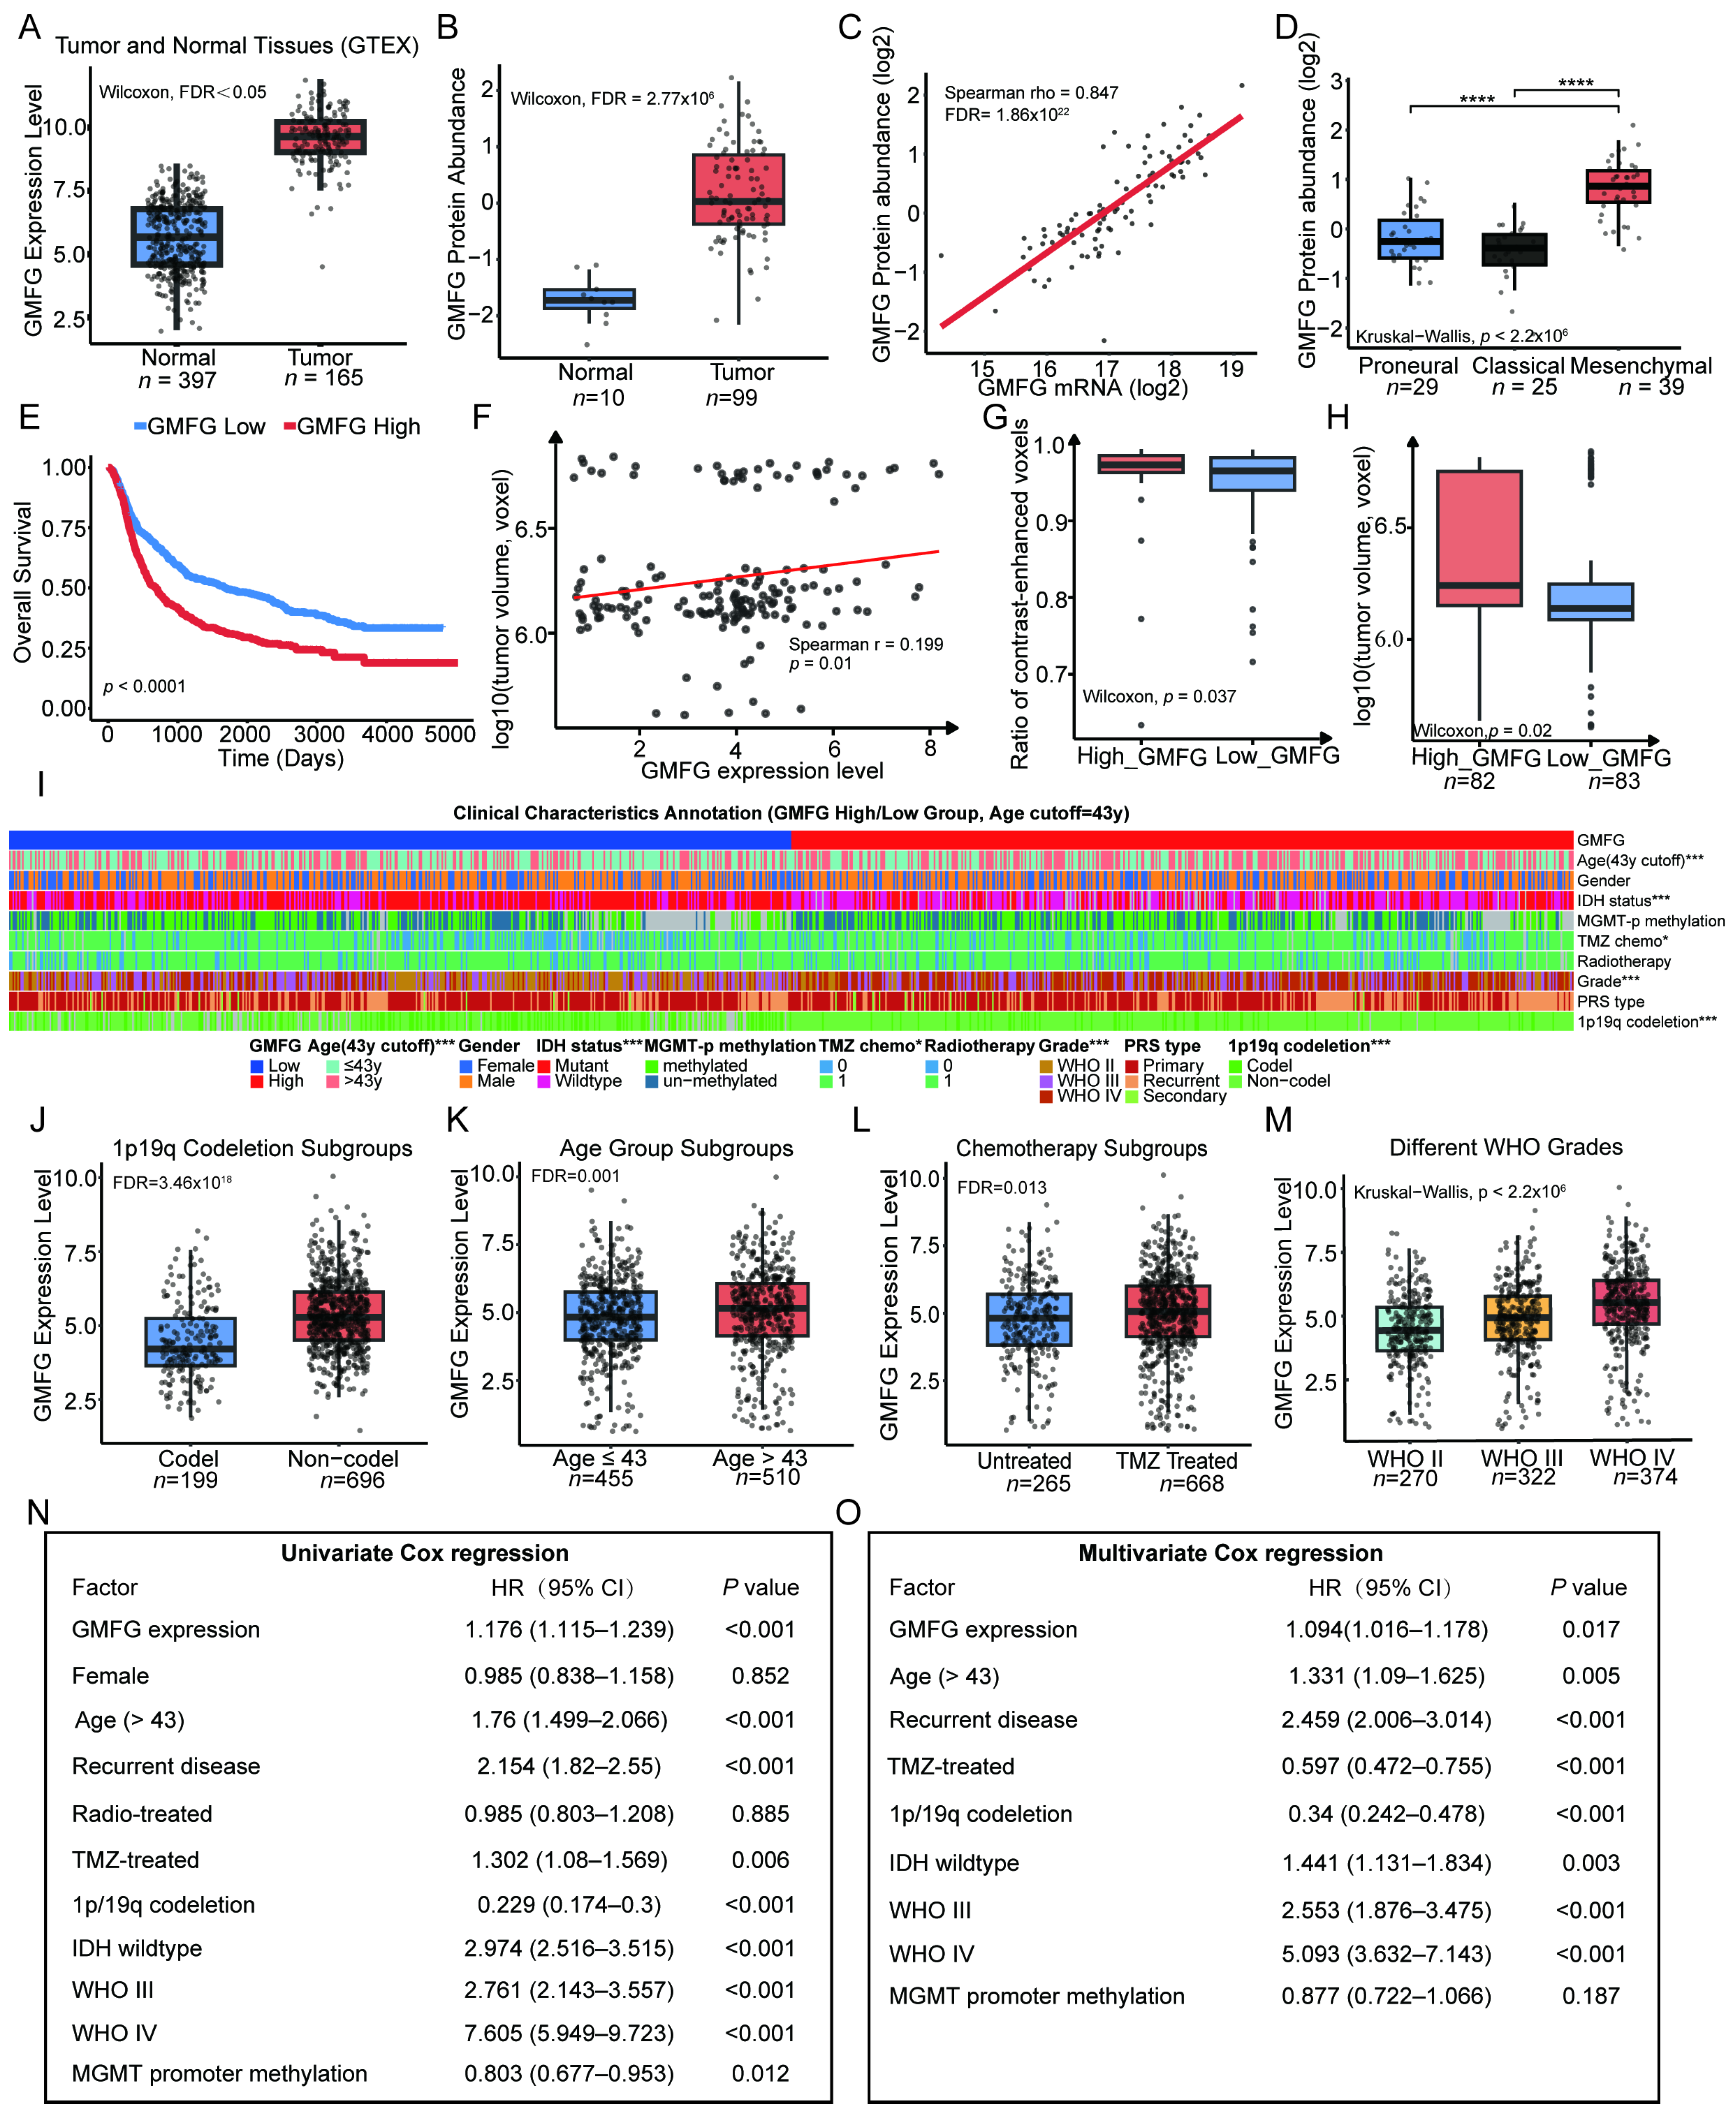
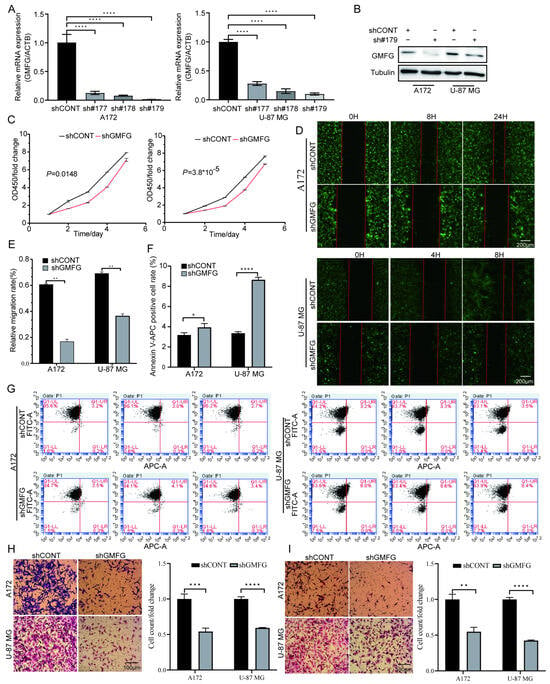
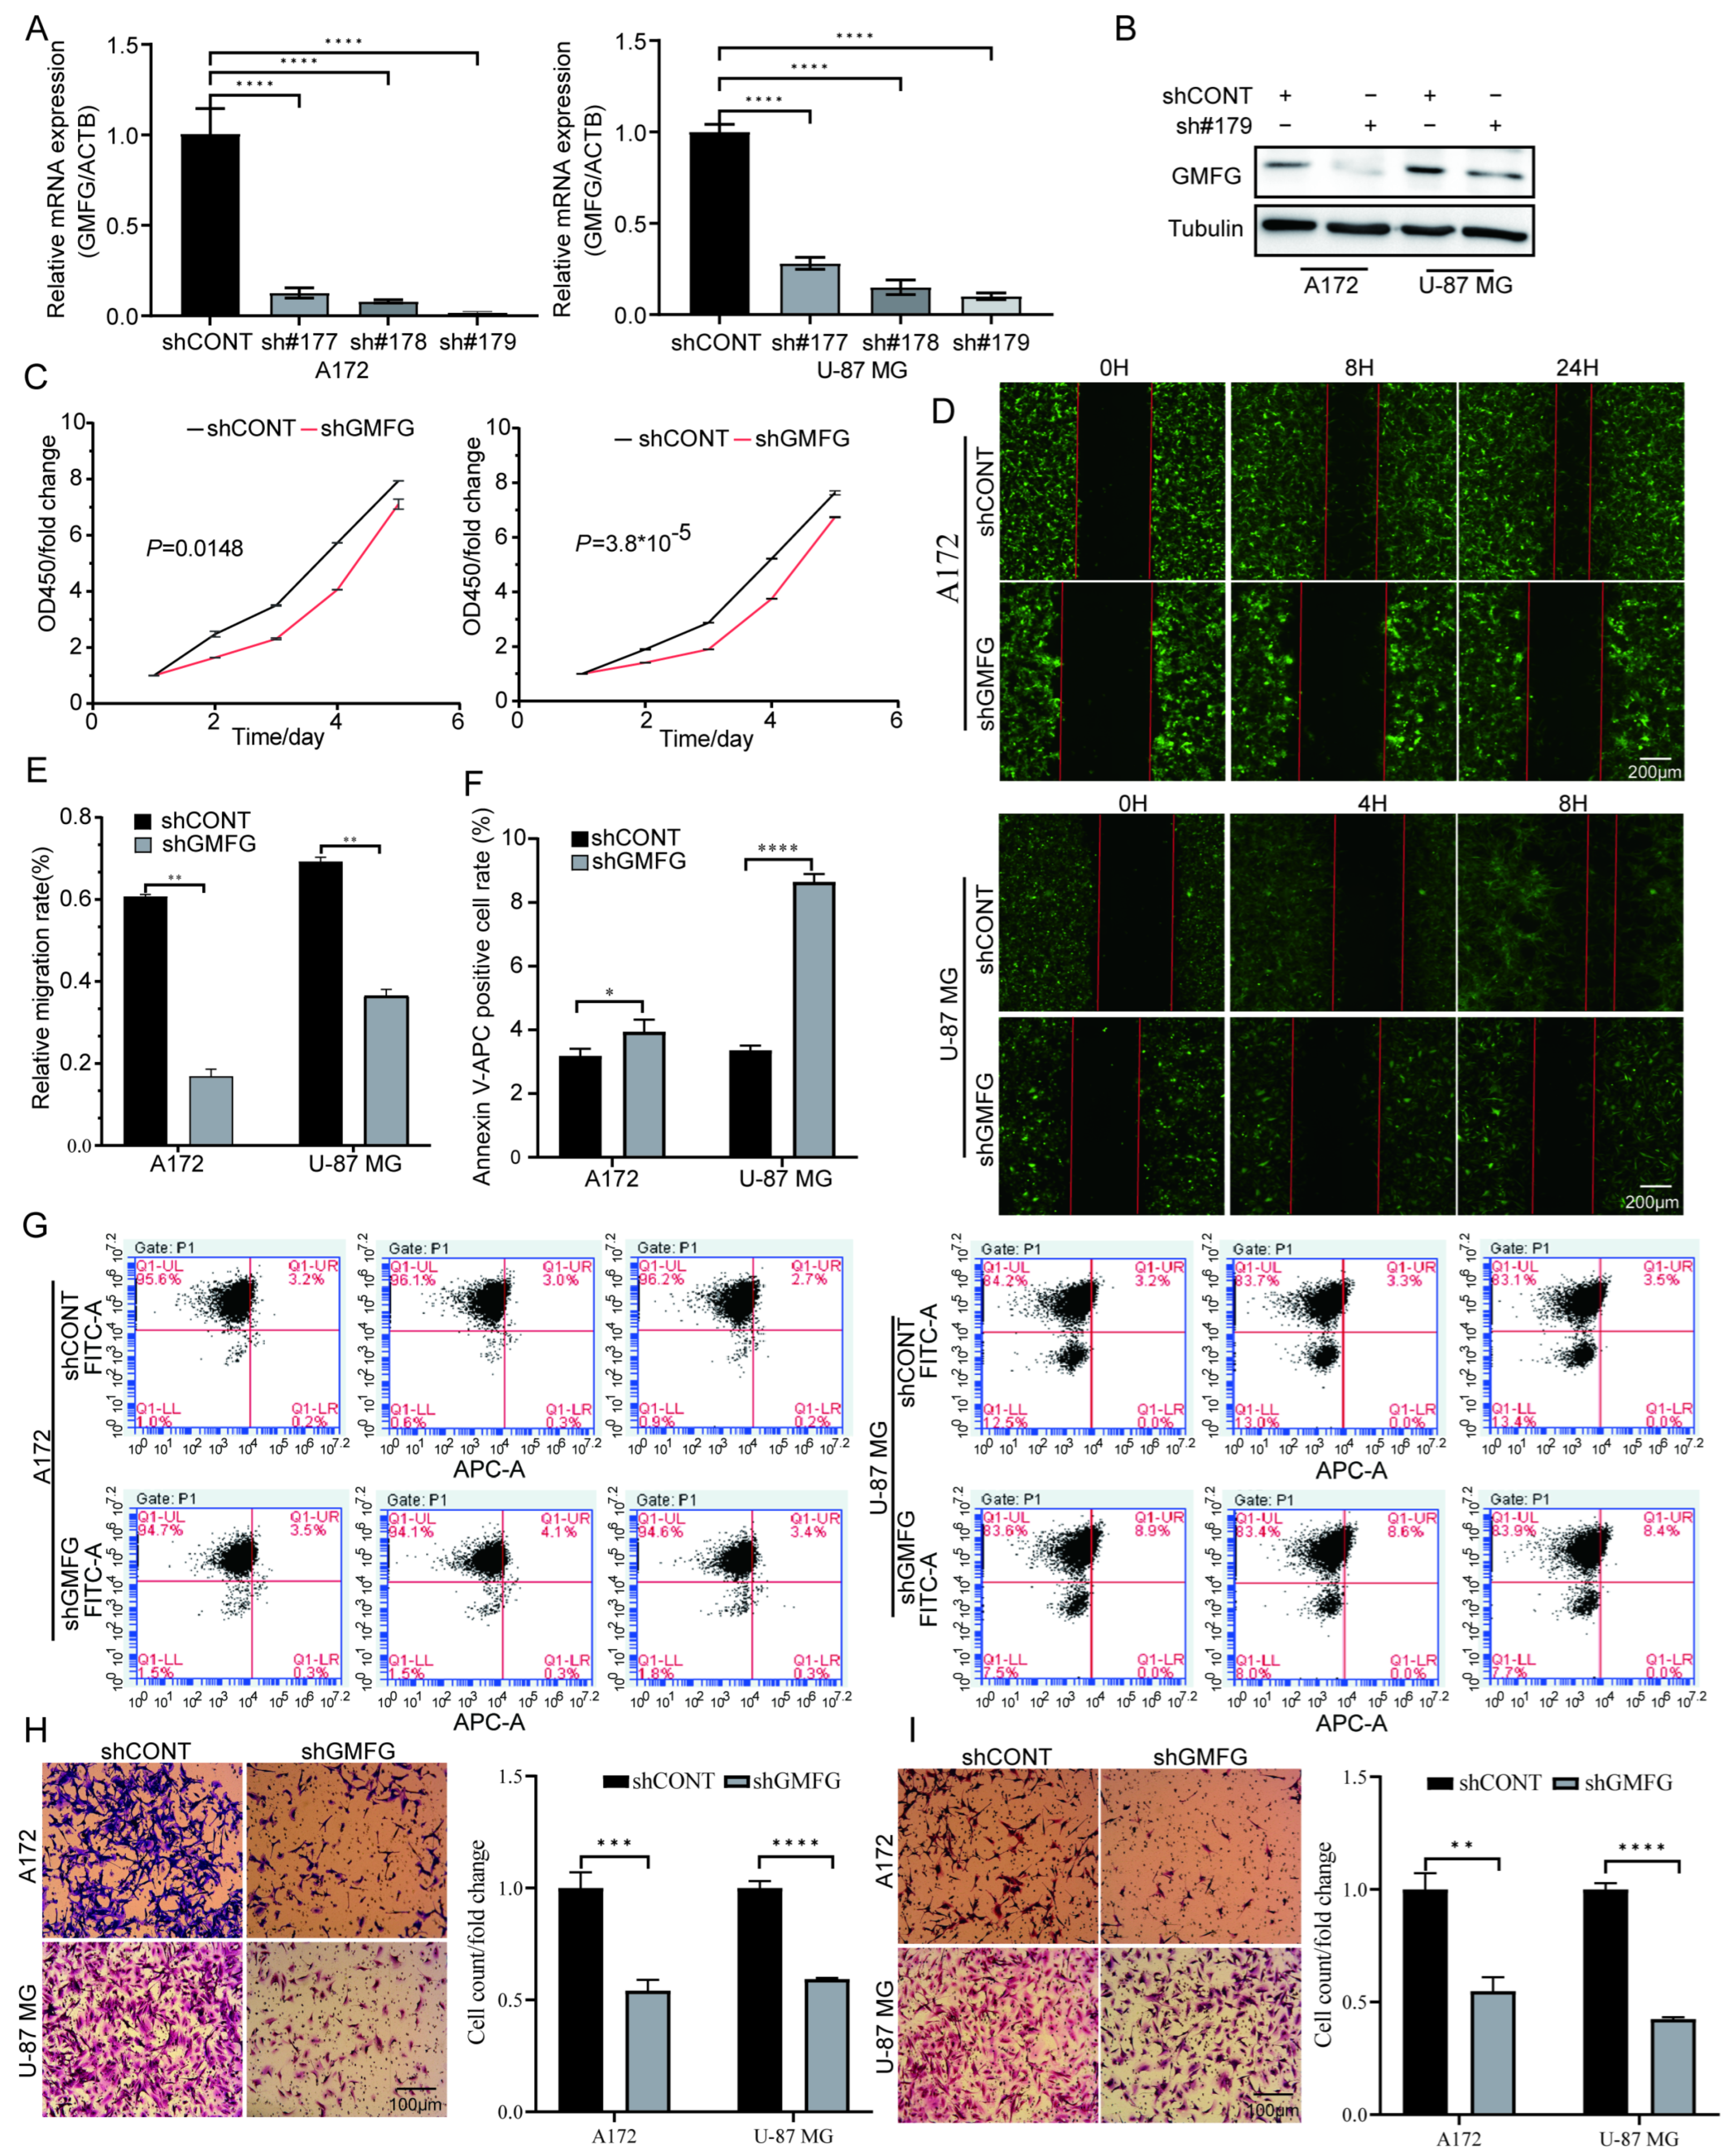
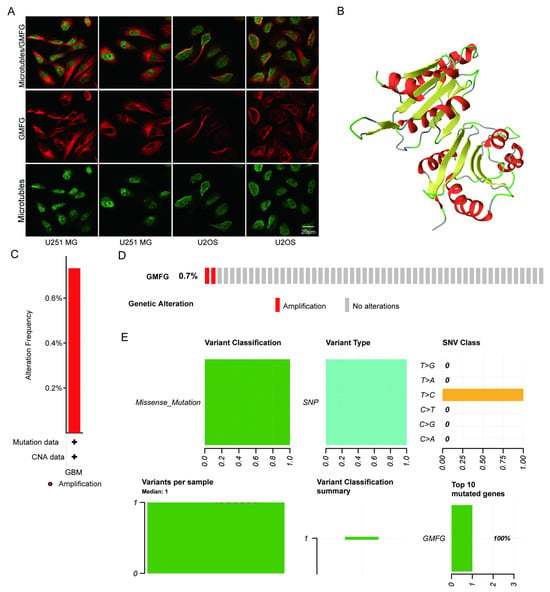
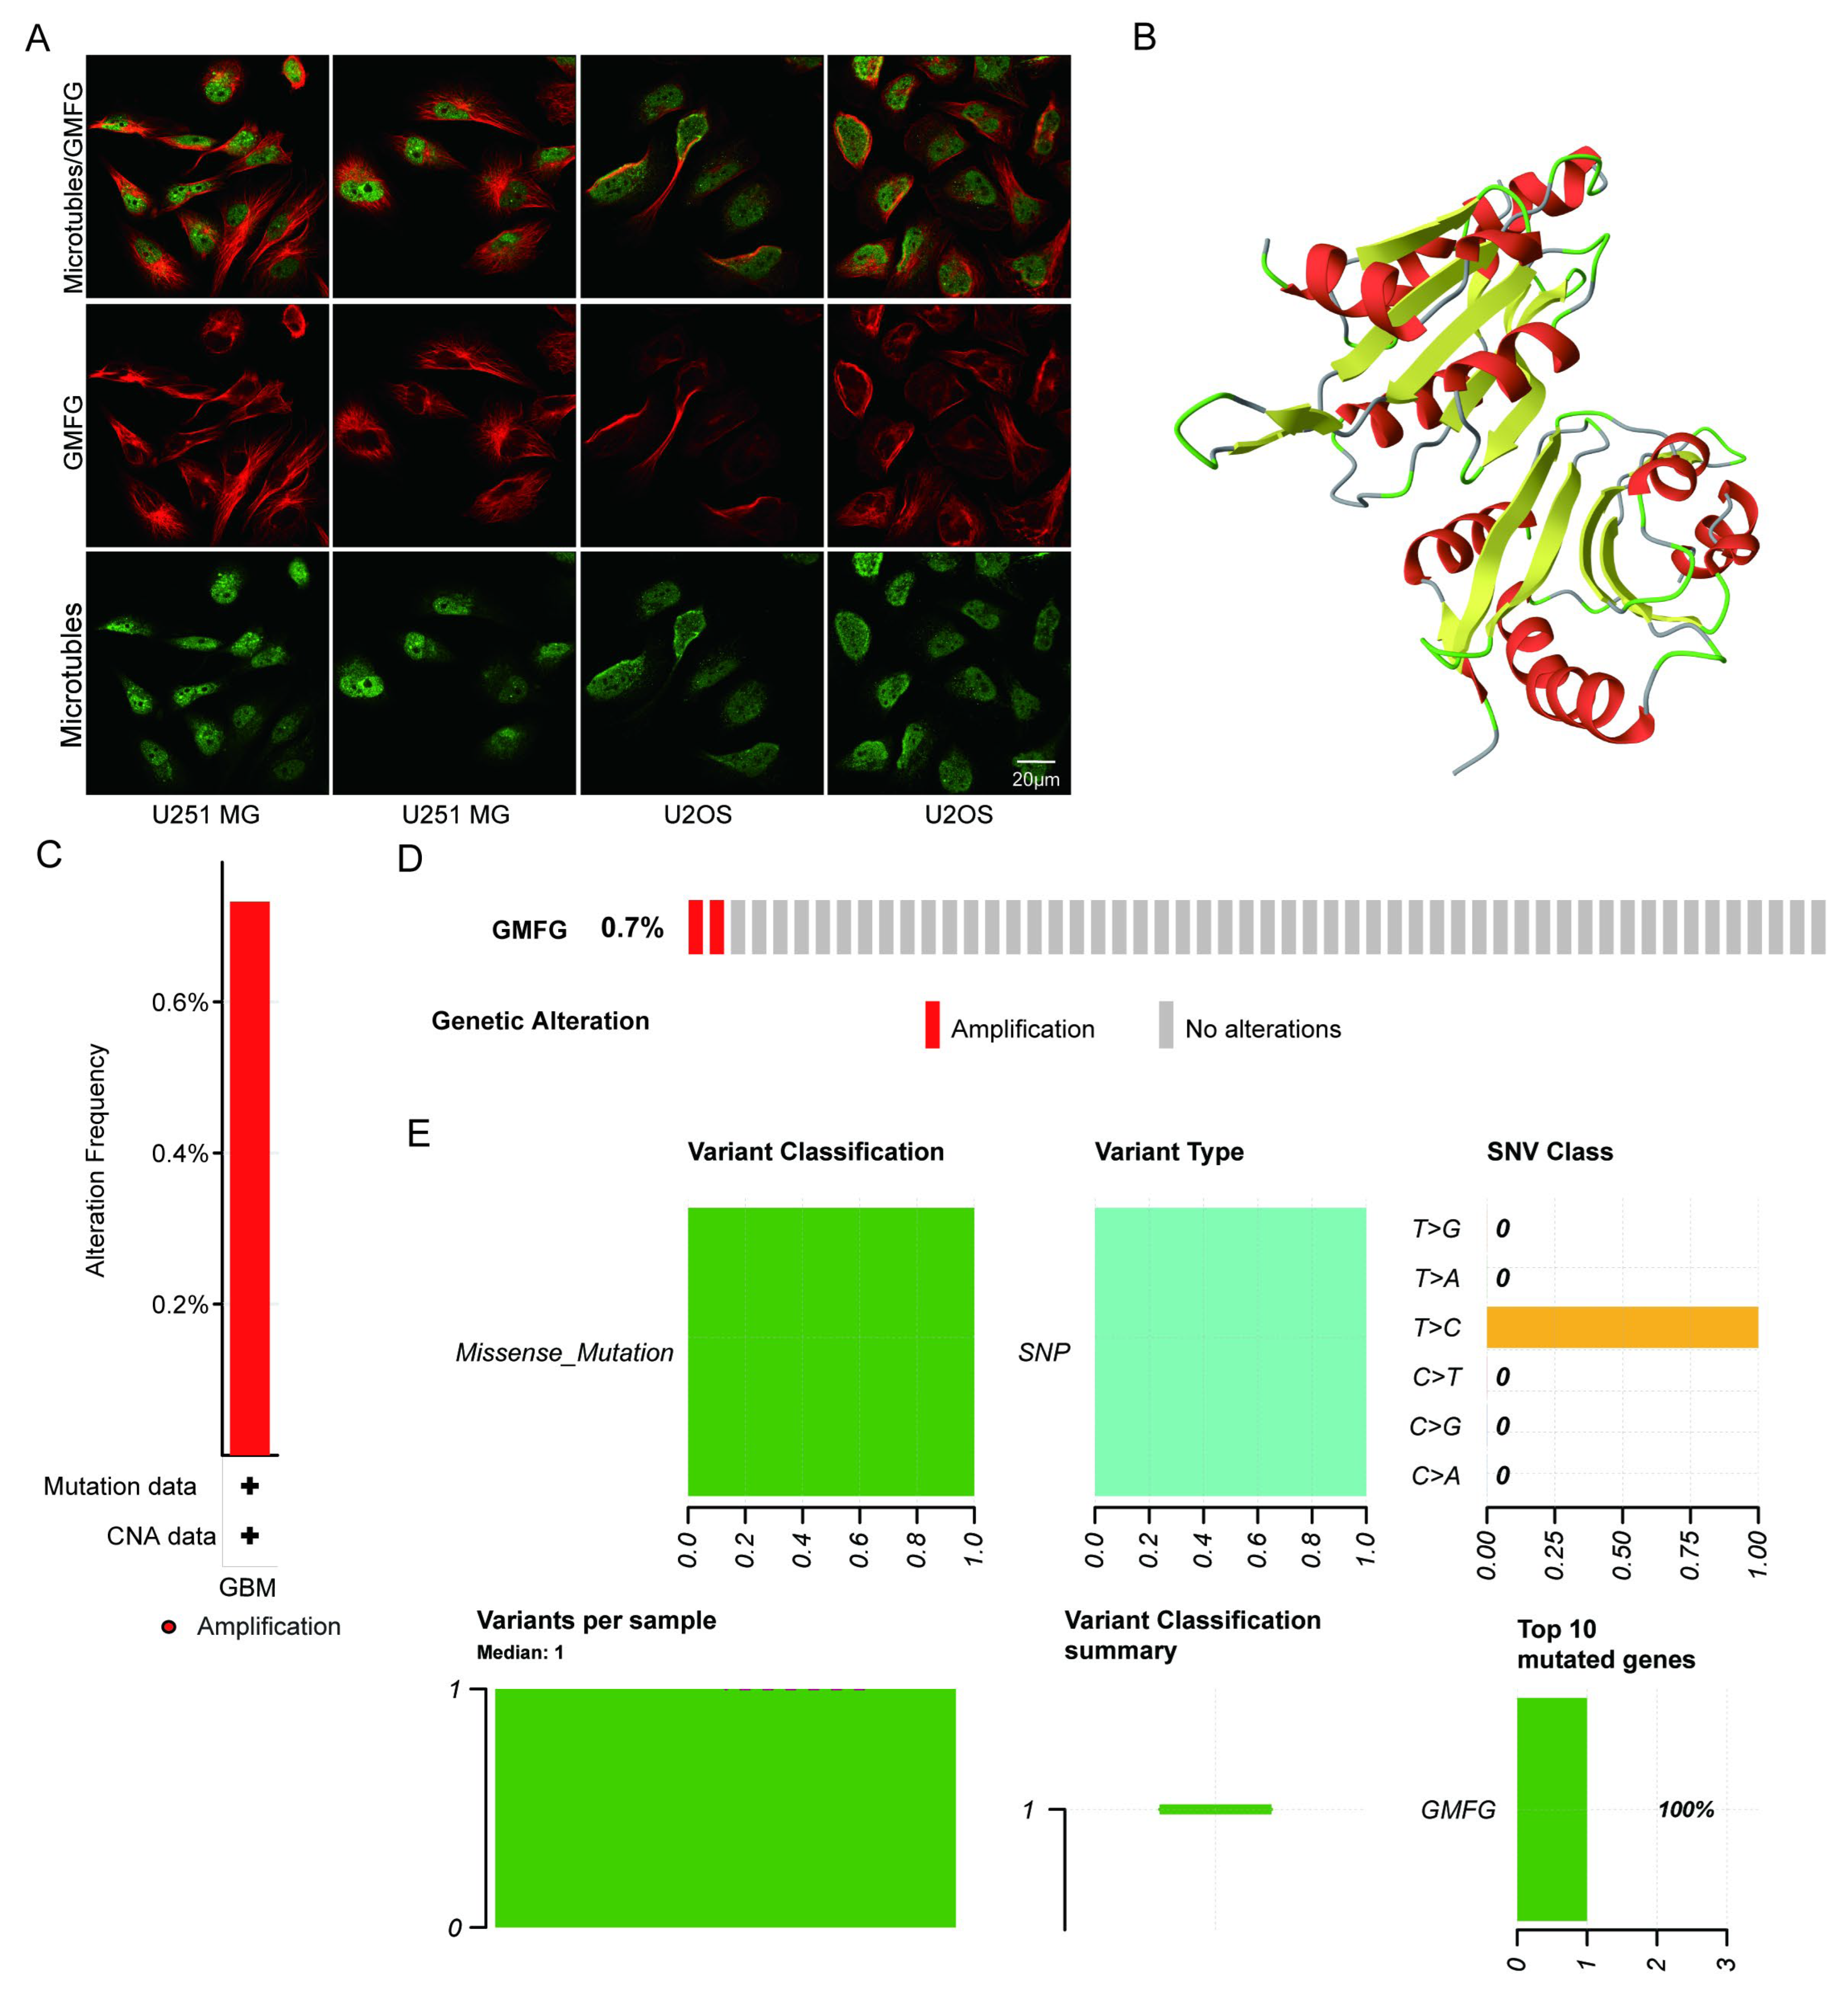
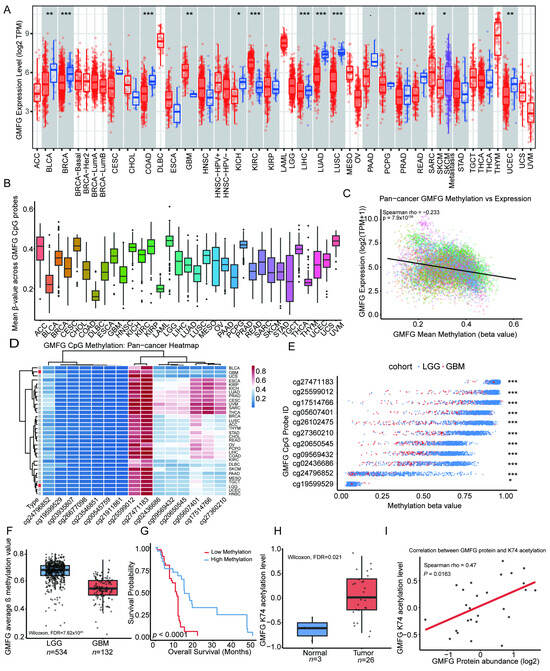
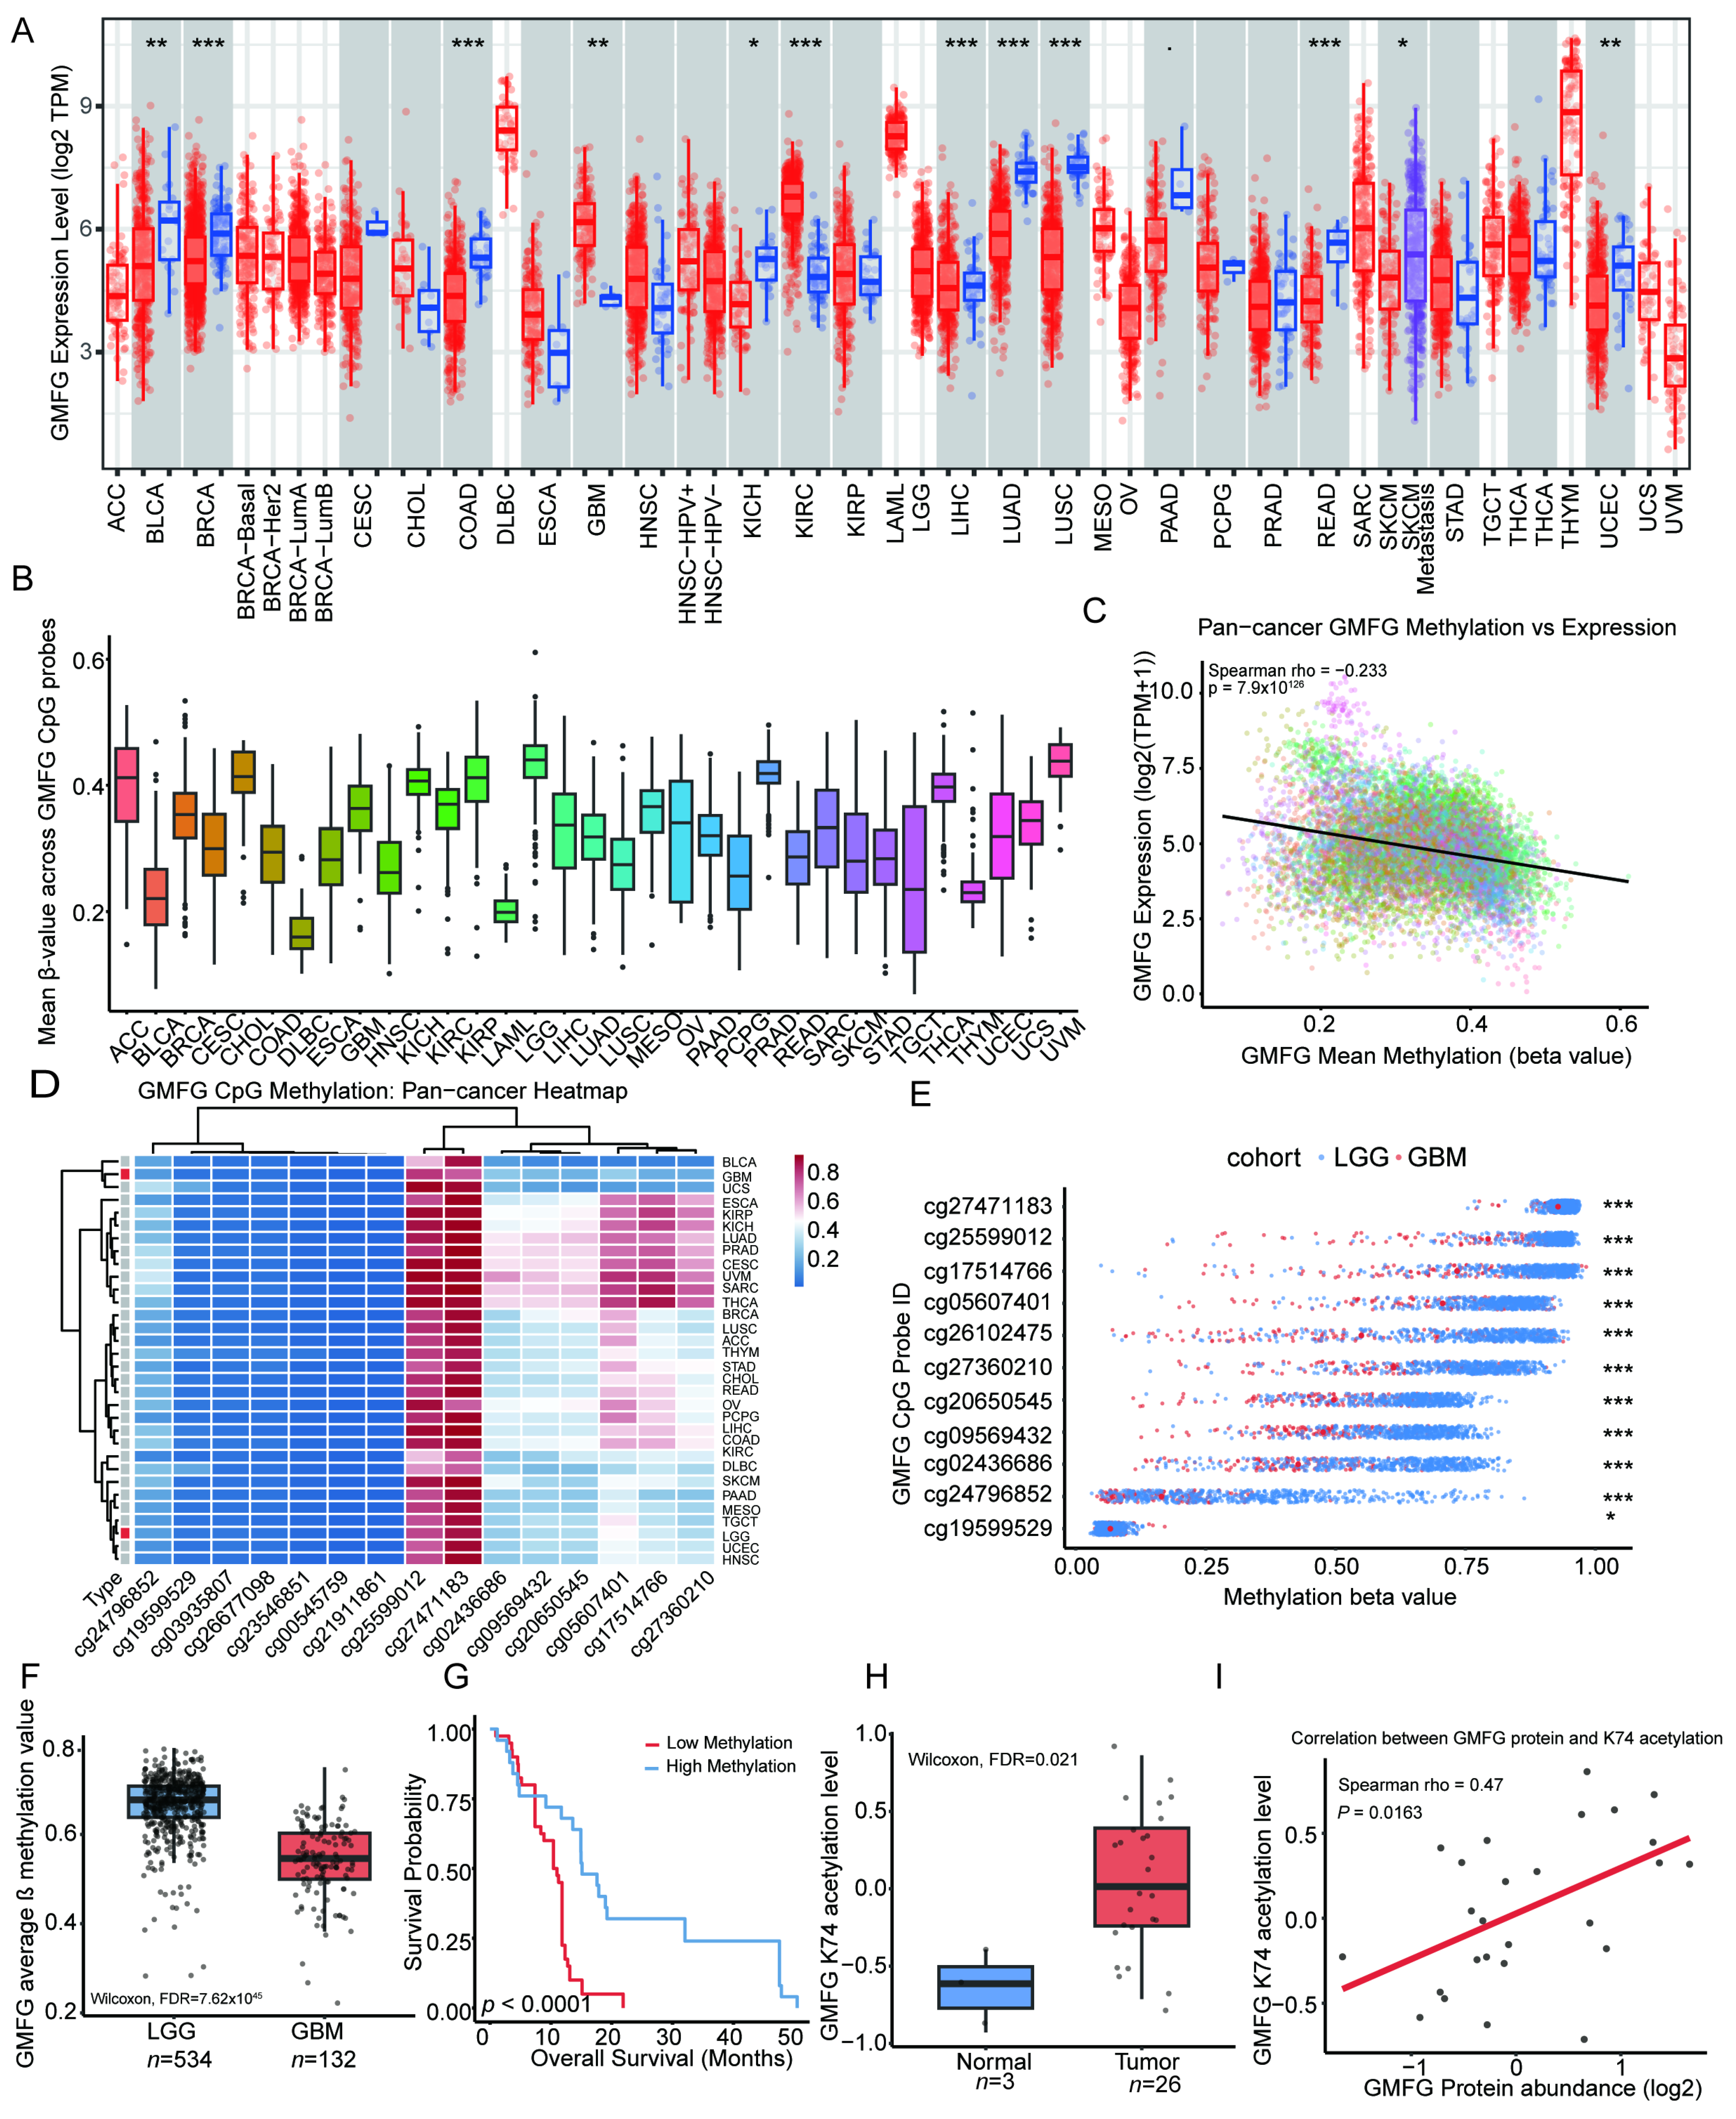
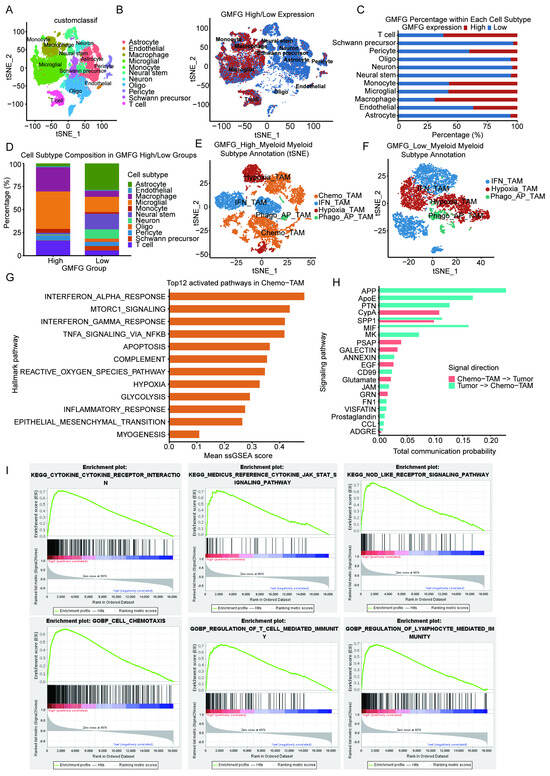
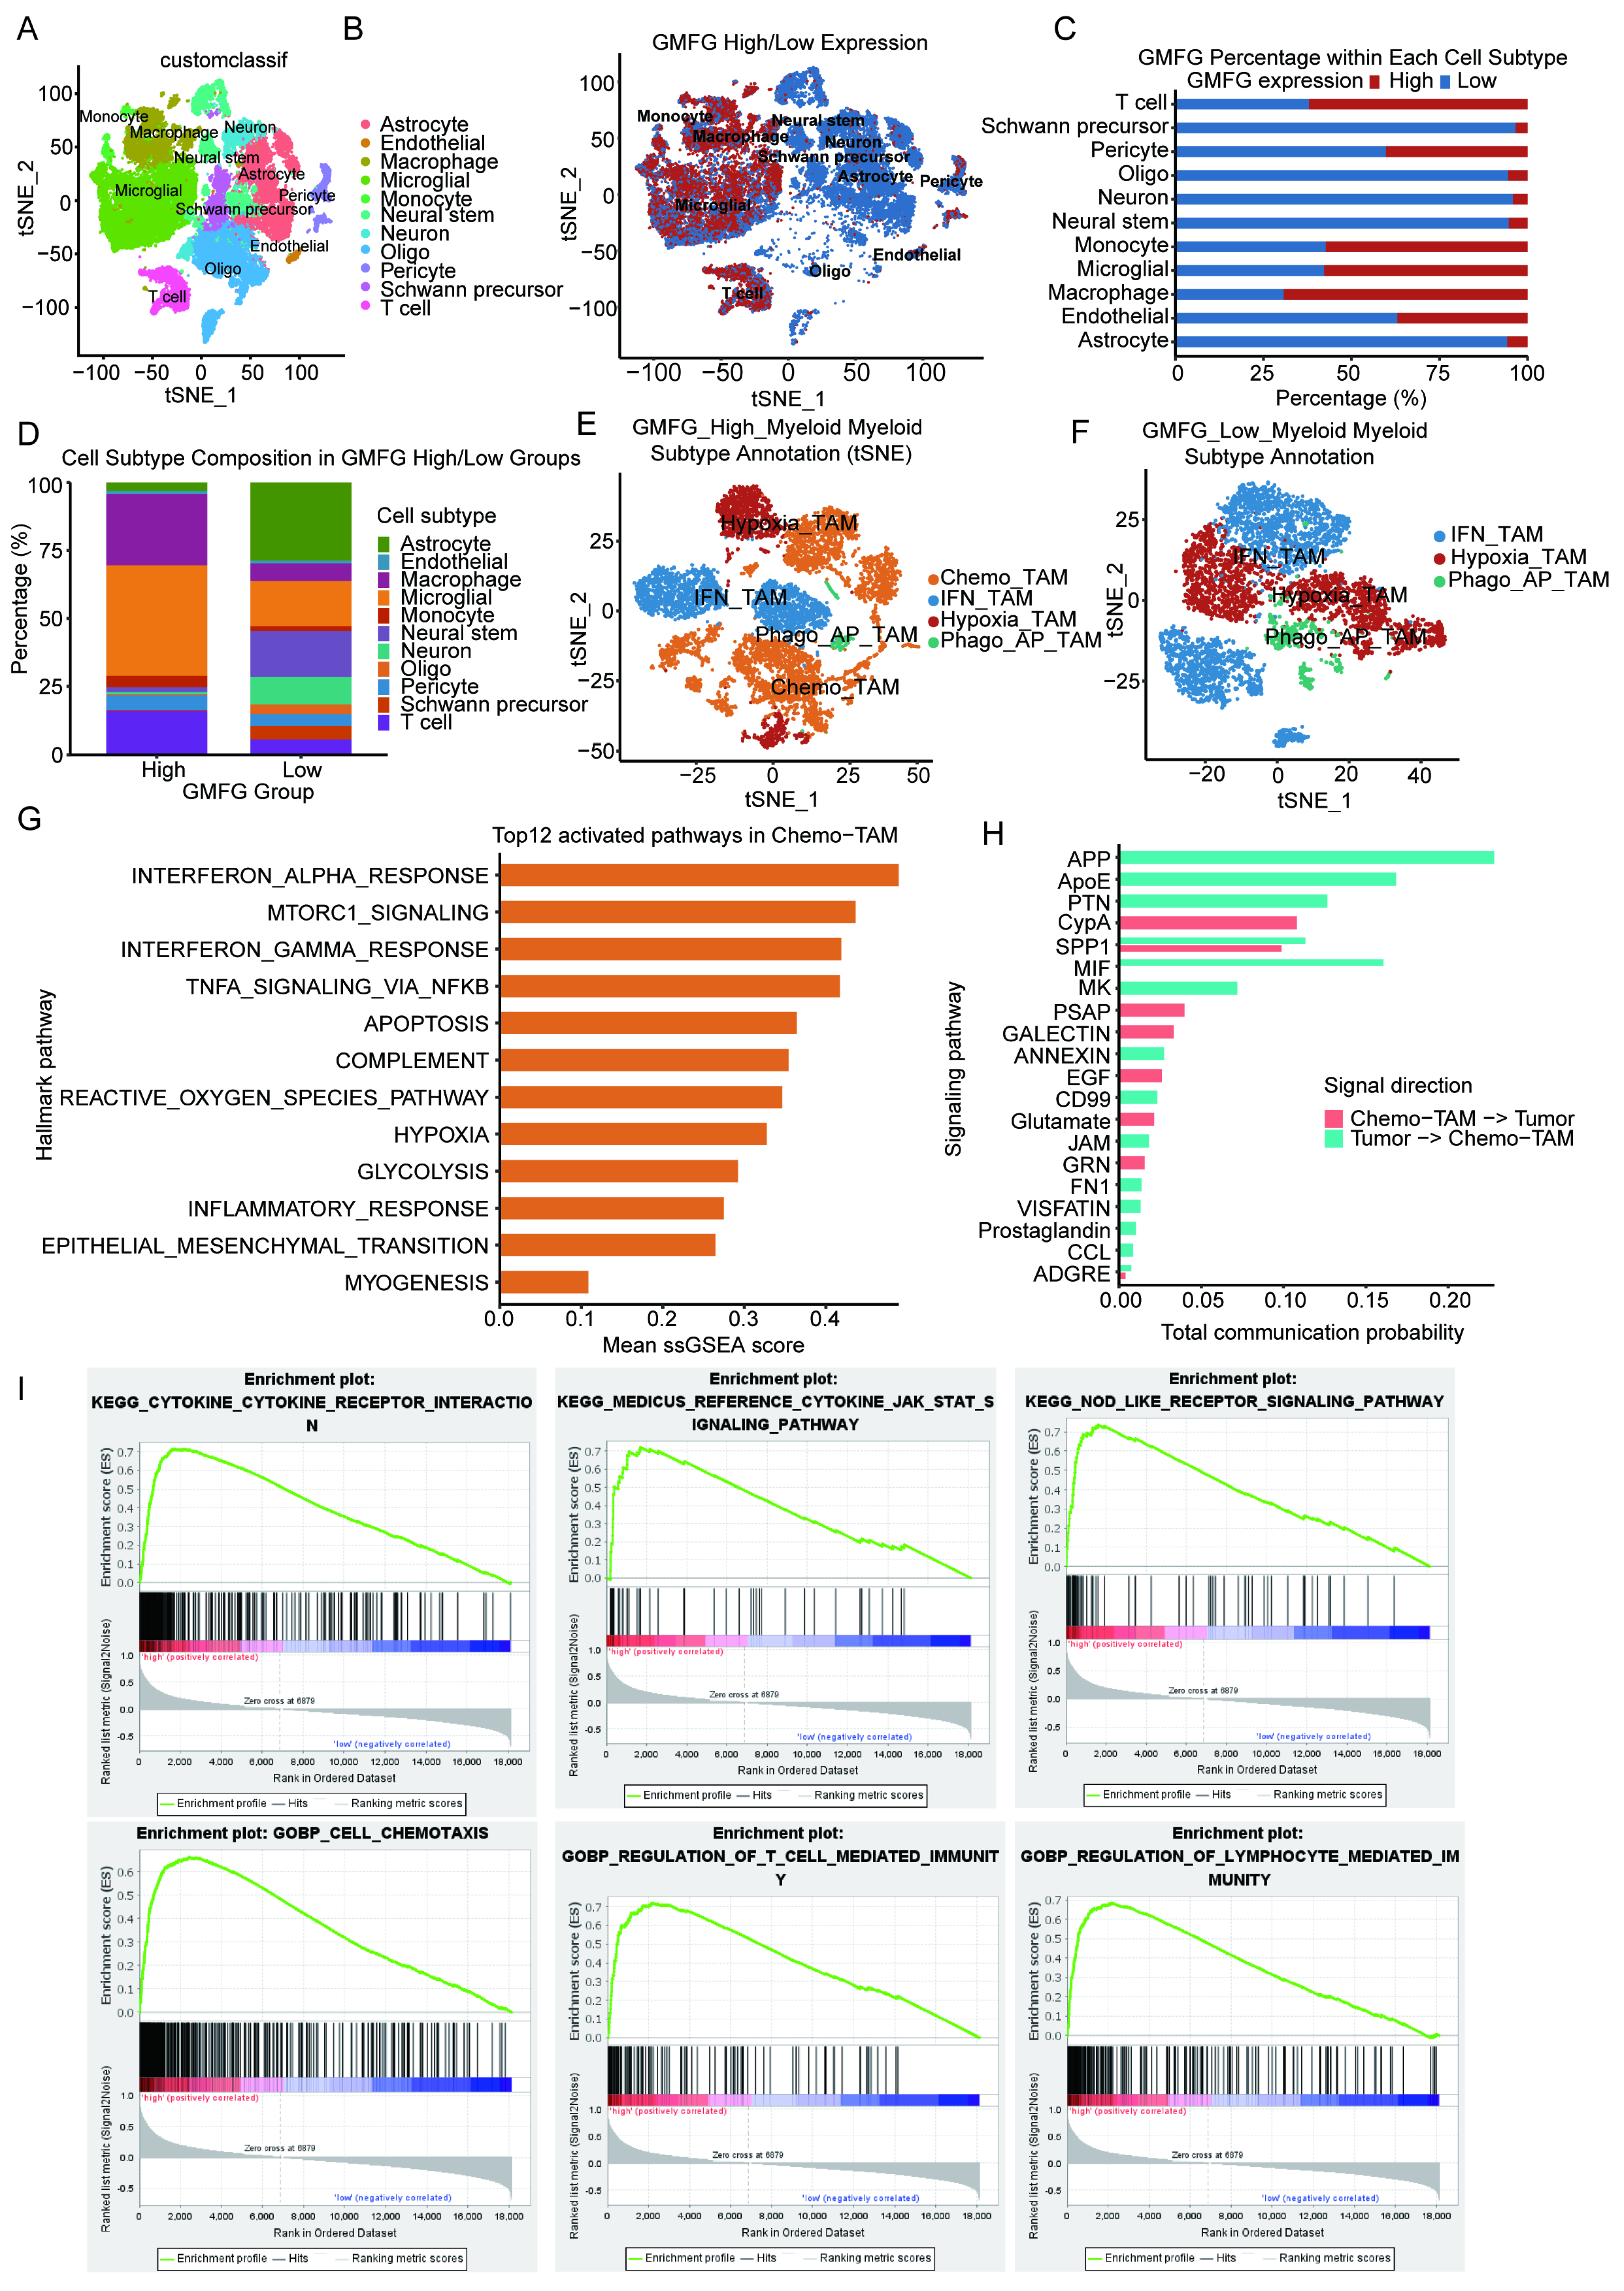
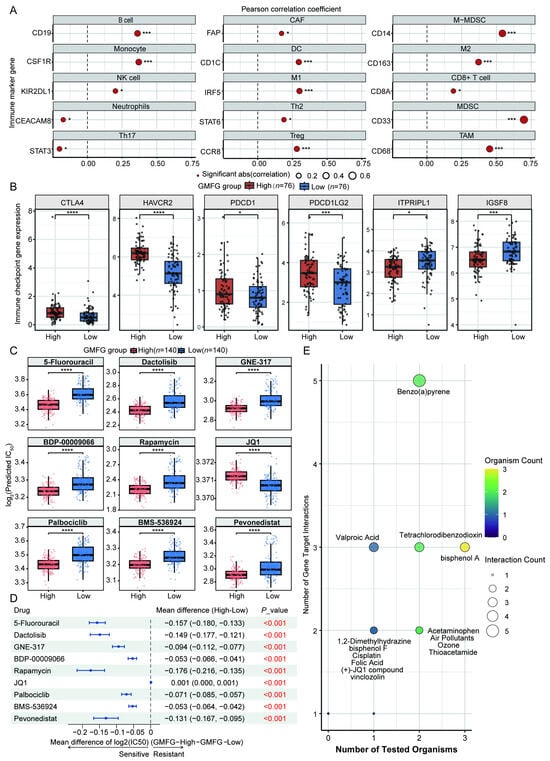
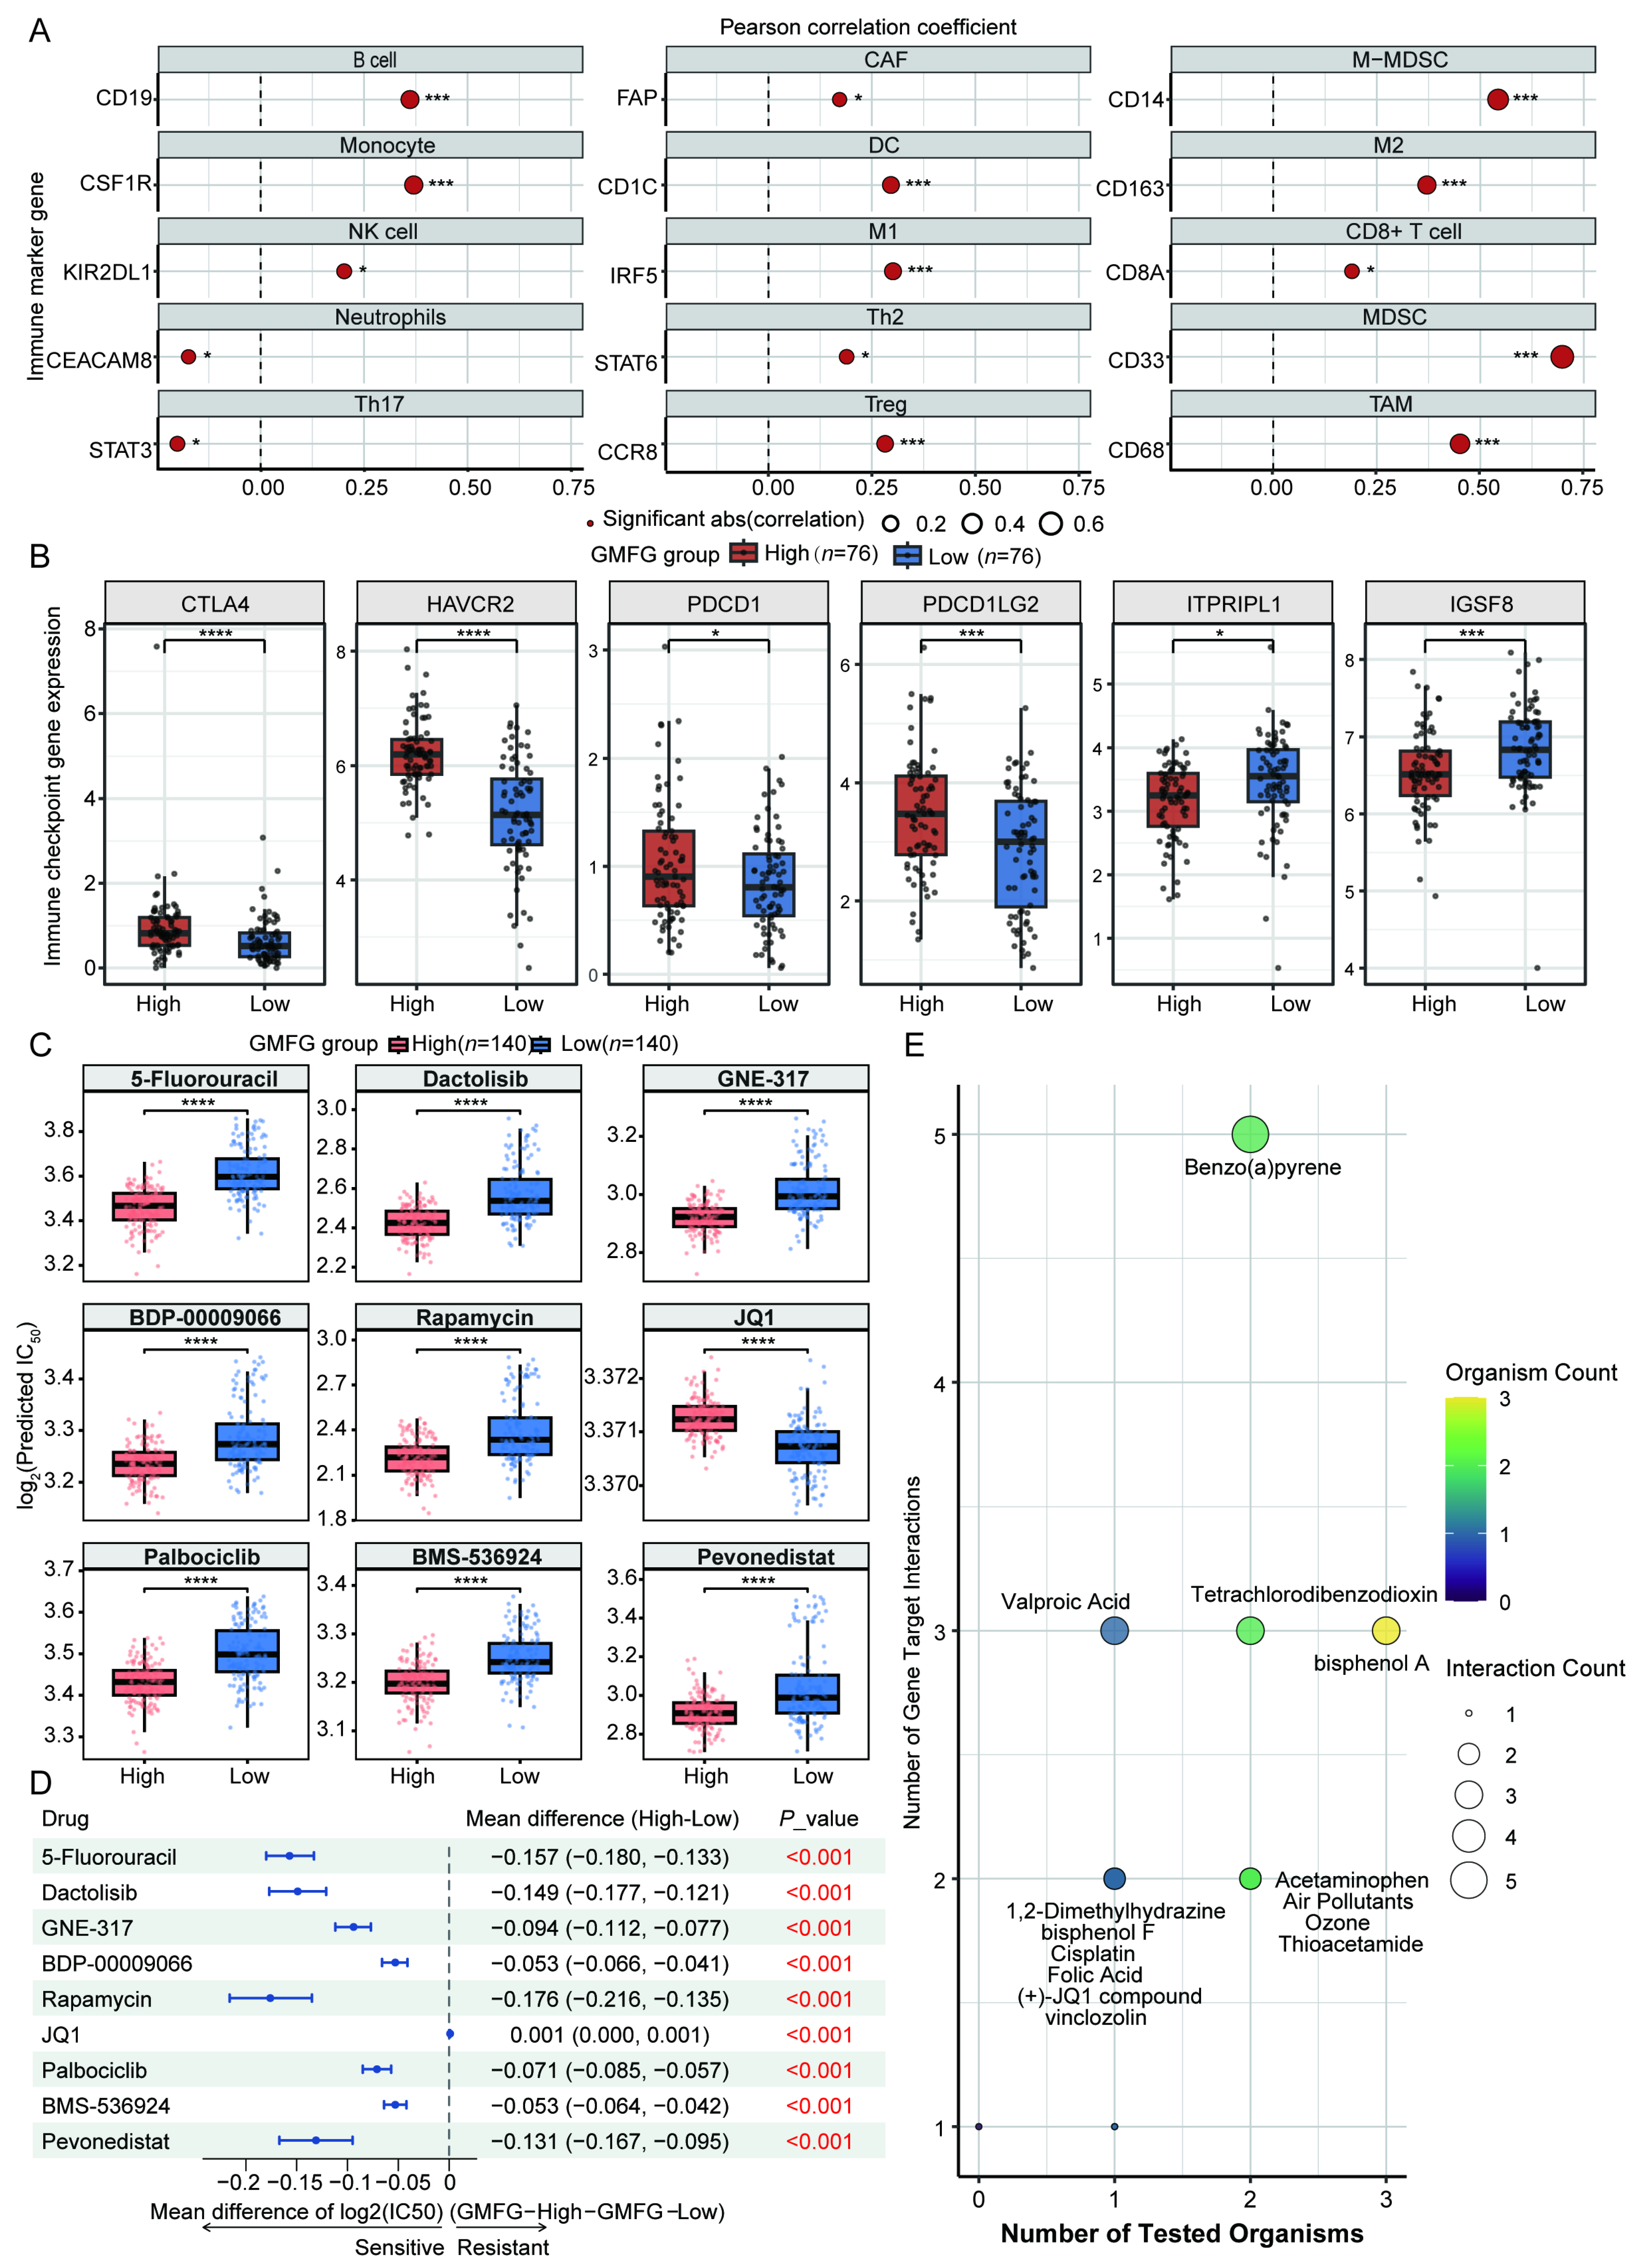

Disclaimer/Publisher’s Note: The statements, opinions and data contained in all publications are solely those of the individual author(s) and contributor(s) and not of MDPI and/or the editor(s). MDPI and/or the editor(s) disclaim responsibility for any injury to people or property resulting from any ideas, methods, instructions or products referred to in the content. |
© 2026 by the authors. Licensee MDPI, Basel, Switzerland. This article is an open access article distributed under the terms and conditions of the Creative Commons Attribution (CC BY) license.