


Abstract
Type 2 diabetes (T2D) is a global crisis affecting 589 million adults, with South Asian populations particularly vulnerable, developing T2D earlier and at lower BMIs than Europeans. Insulin resistance, measured by HOMA-IR, is central to T2D pathogenesis. Circulating microRNAs are stable biomarkers implicated in insulin signalling, but no systematic review has compared their associations with insulin resistance across South Asians and Europeans. To identify microRNAs associated with HOMA-IR in adults with T2D and explore whether association patterns differ between South Asians and Europeans. A PRISMA-compliant systematic review searched six databases (PubMed, Embase, Web of Science, Scopus, bioRxiv, medRxiv). Eligible studies reported statistical associations between circulating serum/plasma microRNA and HOMA-IR in adults with T2D. Bias risks were assessed using an adapted domain-based tool. A qualitative synthesis was conducted because of the differences in methodology. The review was registered on the Open Science Framework (OSF). A total of 14 studies were included (9 European, 5 South Asian), reporting 29 associations across 21 microRNA species, with 12 reaching statistical significance (p < 0.05). The strongest finding was that miR-122 positively associated with log HOMA-IR in a large European prospective cohort. Co-directional associations for miR192 and miR-194 suggested a hepatic microRNA cluster in Europeans. The miR-29 family and miR-192 emerged as cross-ethnic signals. Associations reported in South Asian populations included miR-128 and miR-374a-5p. Circulating microRNAs showed consistent positive associations with HOMA-IR, supporting biomarker potential. Cross-ethnic comparison was not possible within the included studies, revealing a gap in the literature rather than true ethnic differences. Multi-ethnic, methodologically standardised studies are needed, prioritising miR-122, miR-192, the miR-29 family, miR-128, and miR-374a-5p.
1. Introduction
Type 2 diabetes mellitus (T2D) is a chronic, multifactorial disorder, characterised by insulin resistance and insulin deficiency, resulting in persistent hyperglycaemia and progressive metabolic dysfunction [1,2,3]. T2D accounts for approximately 90–95% of all diabetes cases in developed countries, with a greater proportion in developing regions, making it the predominant form of diabetes worldwide [1,2]. T2D has become a major global public health concern. Population ageing, urbanisation, dietary changes and reduced physical activity [1,4,5], accompanied by rising levels of obesity and metabolic disorders, have contributed to the increasing prevalence of diabetes worldwide [3,4]. T2D contributes substantially to global mortality, with an estimated 3.4 million deaths in 2024, making it one of the leading causes of death worldwide [5,6].
T2D prevalence is projected to increase from 589 million in 2024 to 853 million by 2050, representing a 45% rise globally [6]. The largest increases are expected in middle-income countries, including much of South Asia [6], where the prevalence of diabetes has nearly doubled, rising from approximately 11.3% in 2000–2004 to 22.3% in 2020–2024 [6,7,8,9]. This trend has been linked to fast urbanisation, adoption of sedentary and calorie-dense Western dietary patterns, declining physical activity, and genetic susceptibilities unique to South Asian populations [9,10].
South Asians are disproportionately affected by T2D, developing the disease at younger ages and at lower body mass index (BMI) levels than Europeans [7,10,11]. This elevated risk has been observed both within South Asia and among migrant populations, suggesting contributions from both biological and environmental factors [8]. Increased insulin resistance, greater visceral adiposity, and central fat accumulation are thought to contribute to this susceptibility [7,10,11,12,13,14,15,16,17]. More broadly, T2D risk is influenced by complex interactions among genetic predisposition, early-life nutritional exposures, and metabolic pathways regulating insulin sensitivity [13,14,15,16,17,18,19,20].
Recent advances in genomics and molecular biology have provided new insights into T2D pathogenesis. Genome-wide association studies have identified numerous susceptibility loci, with increasing attention paid to epigenomic and post-transcriptional regulatory mechanisms as important contributors to disease pathogenesis [18,21]. Among these, miRNAs have emerged as particularly promising molecular regulators, with evidence implicating them in the regulation of insulin signalling, glucose metabolism, and pancreatic β-cell function [21,22].
MicroRNAs: Biology and Role in Type 2 Diabetes
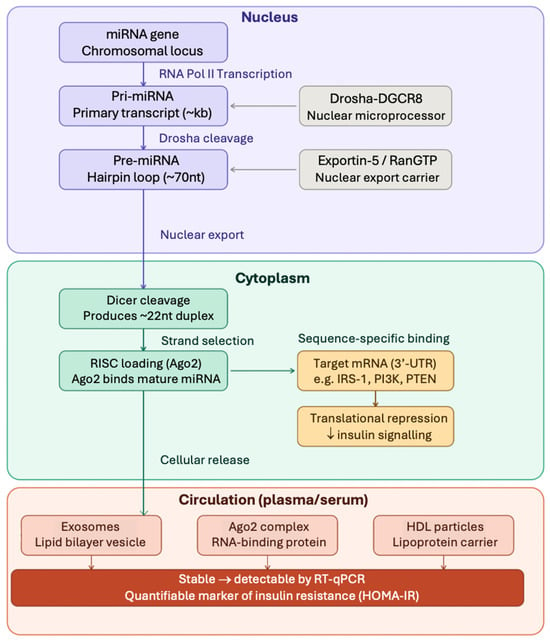
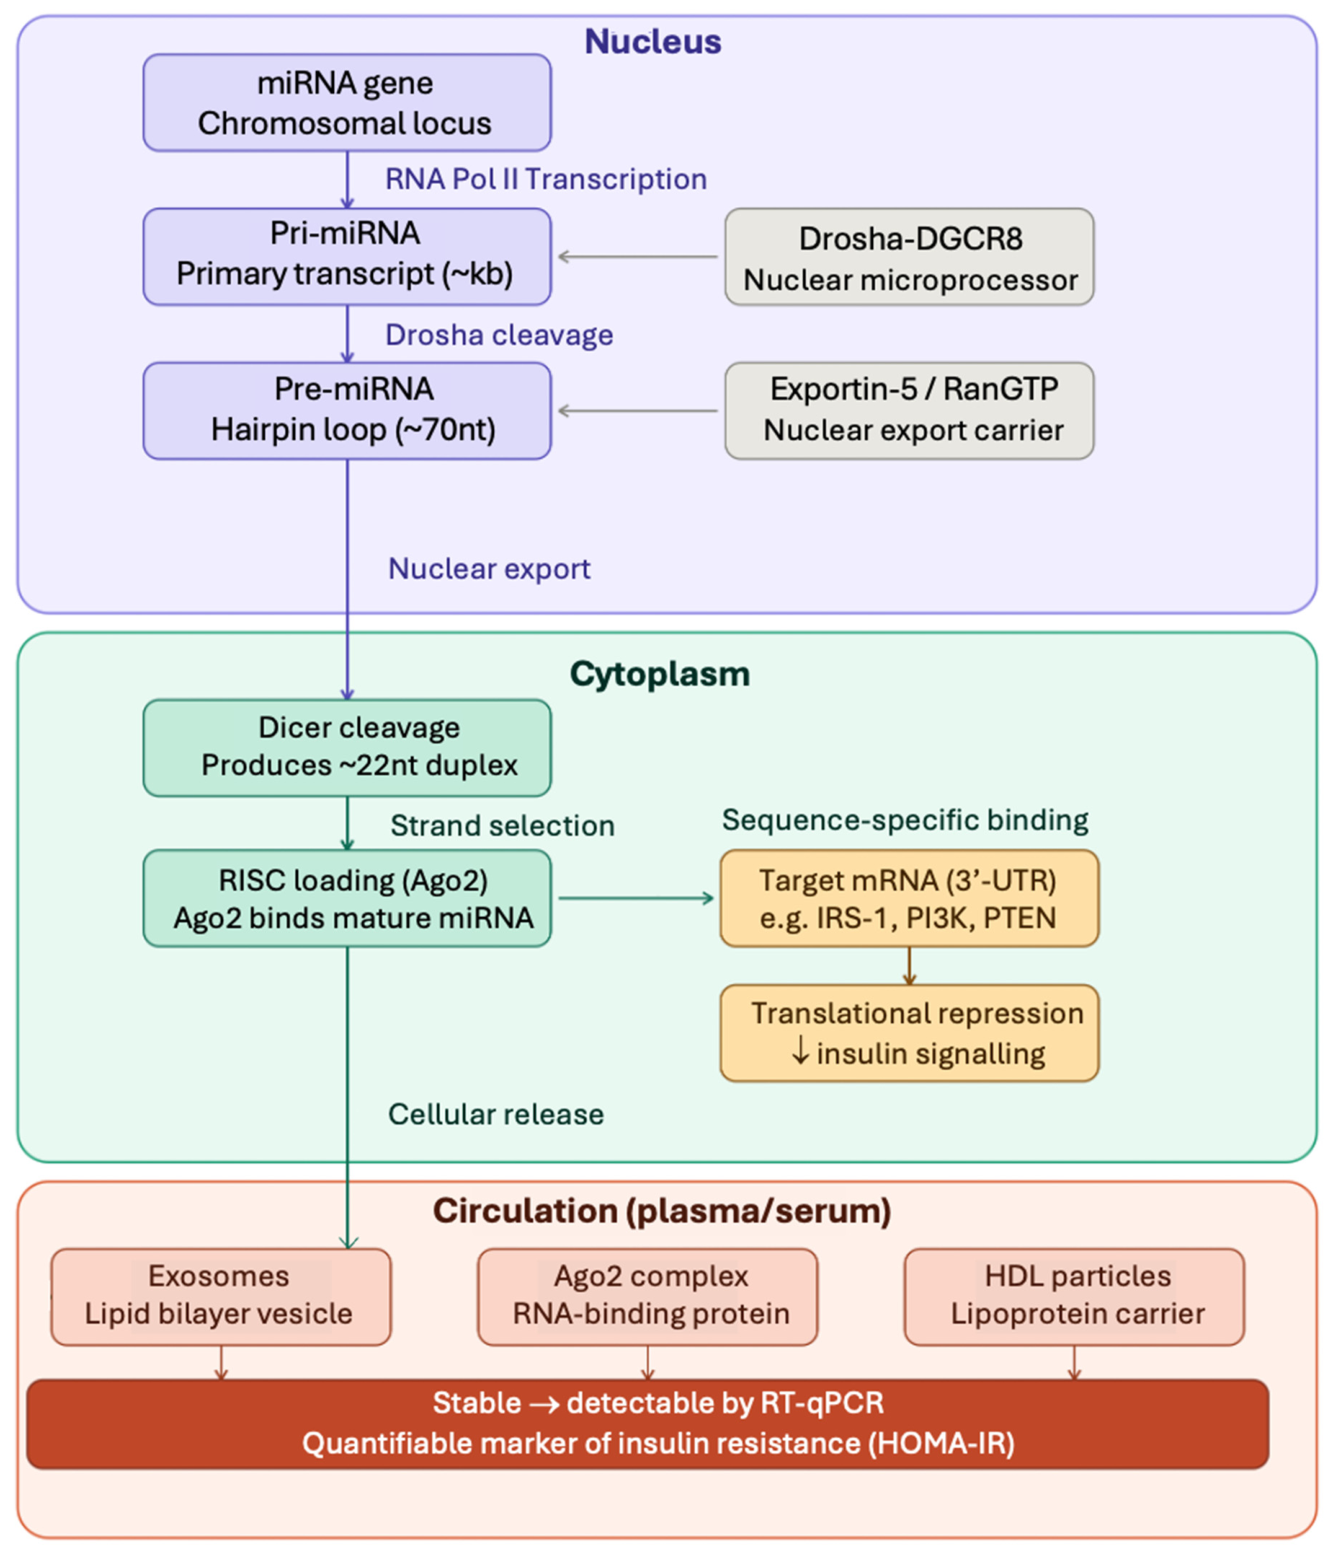
MicroRNAs (miRNAs) are small non-coding RNAs, around 22 nucleotides long, that regulate gene expression post-transcriptionally by binding to complementary sequences within the 3′-UTR of mRNAs and commonly promoting translational repression or degradation of the target transcript. miRNAs are critical in controlling numerous processes, including cellular differentiation, proliferation, metabolism and homeostasis [22]. A single miRNA can regulate multiple target genes, allowing these molecules to act as important modulators of complex biological pathways [22,23,24,25]. The key steps relevant to miRNAs and insulin signalling are illustrated in Figure 1.
Figure 1.
Schematic overview of miRNA biogenesis, cellular release, and target gene silencing. In the nucleus, miRNA genes are transcribed and processed by Drosha-DGCR8 to yield pre-miRNA hairpins, which are exported via Exportin-5/RanGTP. In the cytoplasm, Dicer cleaves the hairpin into a mature ~22 nt duplex loaded into RISC (Ago2), enabling translational repression of target mRNAs including insulin signalling components (IRS-1, PI3K, PTEN). Mature miRNAs are released into circulation encapsulated in exosomes, bound to Ago2, or associated with HDL particles, providing stability and enabling detection by RT-qPCR as biomarkers of insulin resistance. Deng and Guo 2019 [22]; Turchinovich et al., 2012 [23]; Valadi et al., 2007 [24]; Mitchell et al., 2008 [25].
Dysregulation of specific miRNAs can influence key metabolic pathways involved in insulin signalling, glucose homeostasis and pancreatic β-cell function [26,27]. Several miRNAs regulate components of the insulin signalling cascade, including molecules within the PI3K–AKT (Phosphoinositide 3-kinase-Protein Kinase B) pathway, which is central to insulin-mediated glucose uptake in metabolic tissues [22,26]. Other miRNAs influence pancreatic β-cell development and insulin secretion, highlighting their involvement in multiple stages of diabetes pathogenesis [26,27].
Circulating miRNAs are detectable in blood and remain sufficiently stable for biomarker research as they are protected from degradation through association with extracellular vesicles, RNA-binding proteins, and lipoproteins [23,24]. This stability, together with the minimally invasive nature of blood sampling, has made circulating serum and plasma miRNAs preferential for biomarker studies [23,24,25].
In metabolic disease, circulating miRNAs have been reported to differ between individuals with T2D or insulin resistance compared to healthy controls. For example, miR-21-5p, miR-34a-5p, miR-146a-5p and miR-126-3p have been consistently identified as dysregulated across multiple studies [26,27,28]. Altered levels of circulating miRNAs have also been shown to correlate with markers of insulin resistance, suggesting their potential utility as biomarkers that reflect underlying pathophysiological changes relevant to T2D [26,27,28]. Studies investigating circulating miRNAs and insulin resistance have examined many candidate molecules, often within small cohorts. As a result, there is limited understanding of whether patterns of circulating miRNA dysregulation are consistent across different populations. This represents a significant gap in the literature, particularly given the substantial ethnic differences observed in the prevalence and metabolic characteristics of T2D.
South Asians are particularly underrepresented in medical and genomic studies. Despite comprising approximately 25% of the world’s population, South Asians account for less than 2% of participants in genomic studies [29], with similarly limited representation in miRNA research. Importantly, ethnic differences in circulating miRNA profiles may not simply reflect epidemiological or phenotypic disparities but may also have a direct molecular basis. Population-specific genetic variation can influence miRNA sequence, expression, and target binding [30], while ancestry-related differences in miRNA eQTLs suggest that the same circulating miRNA may show different basal expression across ethnic groups [31,32].
No systematic review has compared circulating miRNA signatures associated with insulin resistance between South Asian and European populations. A scoping search of PROSPERO and Cochrane found no prior/in-progress review on this topic. This systematic review aims to identify circulating miRNAs associated with insulin resistance, measured using HOMA-IR, in adults with T2D and to explore whether association patterns differ across South Asian and European studies. A secondary aim is to map the existing cross-ethnic evidence base and identify structural gaps that current biomarker research programmes may reinforce to facilitate T2D diagnosis and therapeutic interventions in different ethnic populations.
2. Materials and Methods
2.1. Study Design
This systematic review followed PRISMA 2020 guidelines [33] and identified, critically appraised, and synthesised evidence from observational studies investigating associations between circulating miRNA expression and insulin resistance, quantified by HOMA-IR, in South Asian and European adults with T2D. Meta-analysis was not appropriate due to substantial clinical and methodological heterogeneity in miRNAs measured, laboratory methods, HOMA-IR handling, adjustment strategies, and biological sample types, making any pooled estimate difficult to interpret, with limited biological or statistical value. A qualitative synthesis was therefore considered the most appropriate and is consistent with the Synthesis Without Meta-analysis (SWiM) guidance for reviews [34]. The review was registered on the Open Science Framework (OSF) (https://osf.io/zkqyj/overview, accessed on 9 April 2026).
2.2. Eligibility Criteria
Eligibility criteria were pre-specified prior to database searching and applied consistently at both the title/abstract and full-text screening stages. Criteria were structured according to the PICOS framework (Population, Intervention/Exposure, Comparator, Outcome, Study design) and entered into Covidence [35]. The full inclusion and exclusion criteria are presented in Table 1.
Table 1.
PICOS eligibility criteria for study inclusion and exclusion.
2.3. Search Strategy
Six electronic databases were searched to identify eligible studies: PubMed, Embase, Web of Science, Scopus, bioRxiv, and medRxiv. The preprint servers bioRxiv and MedRxiv were included to capture emerging evidence in the evolving field of miRNA biomarker research. The searches were conducted from 1 December 2025 to 17 March 2026.
Search strategies were developed independently for each database, accounting for differences in indexing systems and syntax requirements. For PubMed and Embase, MeSH and Emtree vocabulary terms were incorporated alongside keywords to maximise sensitivity. Web of Science and Scopus searches relied on topic-field keyword searching. bioRxiv and medRxiv were searched using basic keywords due to the search bar character limits.
Search strategies were structured around three core concepts: T2D, insulin resistance/HOMA-IR, and circulating miRNA. These were combined using Boolean operators, with additional ethnicity terms for South Asian and European populations included where relevant. Ethnicity-blind versions of the searches were also run to avoid missing relevant studies that did not specify ethnicity in the title/abstract. No date restrictions were applied, and searches were limited to English-language. Full search strategies are provided in Supplementary Text S1.
2.4. Selection Process
Database search results were imported into Covidence to remove duplicates and for screening. Screening was conducted in two stages: title and abstract screening, followed by full-text assessment against the pre-specified eligibility criteria. Reasons for full-text exclusion were recorded in Covidence [35], and the study selection process is summarised in the PRISMA 2020 flow diagram.
2.5. Data Collection Process
All screening decisions were initially made by the main reviewer (T.K.) and were reviewed by S.S.M. Where data were unclear in the main text, Supplementary Materials were examined, and study authors were contacted for missing information, although no additional data were provided. Screening followed pre-specified criteria entered into Covidence before review to mitigate the risk of inconsistent application of criteria. Both reviewers (T.K. and S.S.M.) reviewed the 14 included studies and confirmed the appropriateness of the final inclusions, data extraction, and quality assessments. The data was extracted using data items relevant to the main aims of the review (Table 2). A blank copy of the form used for data extraction is included in Supplementary Table S1.
Table 2.
Data items extracted from each included study.
2.6. Risk of Bias Assessment Methods
The Newcastle–Ottawa Scale was not used in its standard form as it does not adequately capture issues central to this review, particularly miRNA measurement quality, normalisation methods, and ethnicity classification. The adapted domain-based tool was informed by established frameworks: exposure measurement criteria drew on QUADAS-2 principles [36], confounding assessment on ROBINS-E guidance [37], and normalisation quality criteria on published miRNA-specific recommendations [38]. The assessment domains are summarised in Table 3.
Table 3.
Domains included in the adapted risk of bias assessment tool.
Each domain was rated as low, unclear, or high risk of bias, with brief justification recorded in Covidence. Particular emphasis was placed on confounding and HOMA-IR measurement because of their direct relevance to the review question.
2.7. Data Synthesis
Findings were synthesised qualitatively, grouped by ethnicity and miRNAs to enable visual comparison across studies in the forest plot. Then, 95% confidence intervals (CIs) were derived for each reported correlation coefficient (Pearson r or Spearman ρ) using Fisher’s z-transformation, calculated as z = ½ ln[(1 + r)/(1 − r)], with SE(z) = 1/√(n − 3), back-transformed to the correlation scale [39]. This approximation assumes normality of the Fisher-z statistic for n > 10, which all included studies exceeded [40]. Four associations reporting non-correlation metrics (β regression coefficients, tertile comparisons, or percentage change per SD log HOMA-IR) were excluded from the forest plot due to using different scales but were retained in the descriptive information of studies. Significance classification (p < 0.05) followed values reported by included studies.
3. Results
3.1. Study Selection
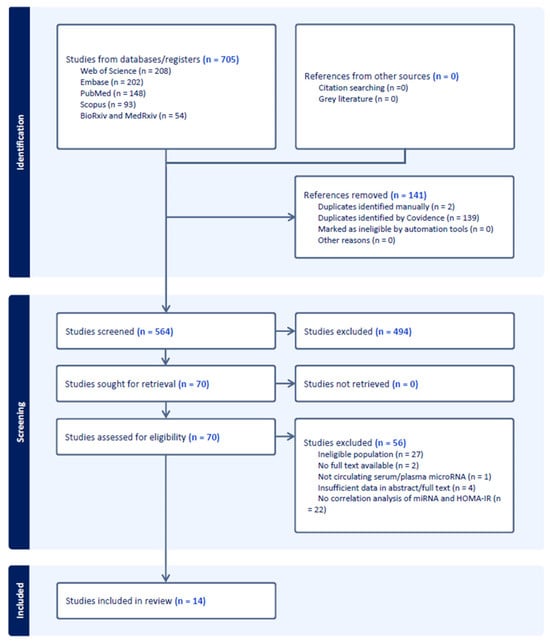
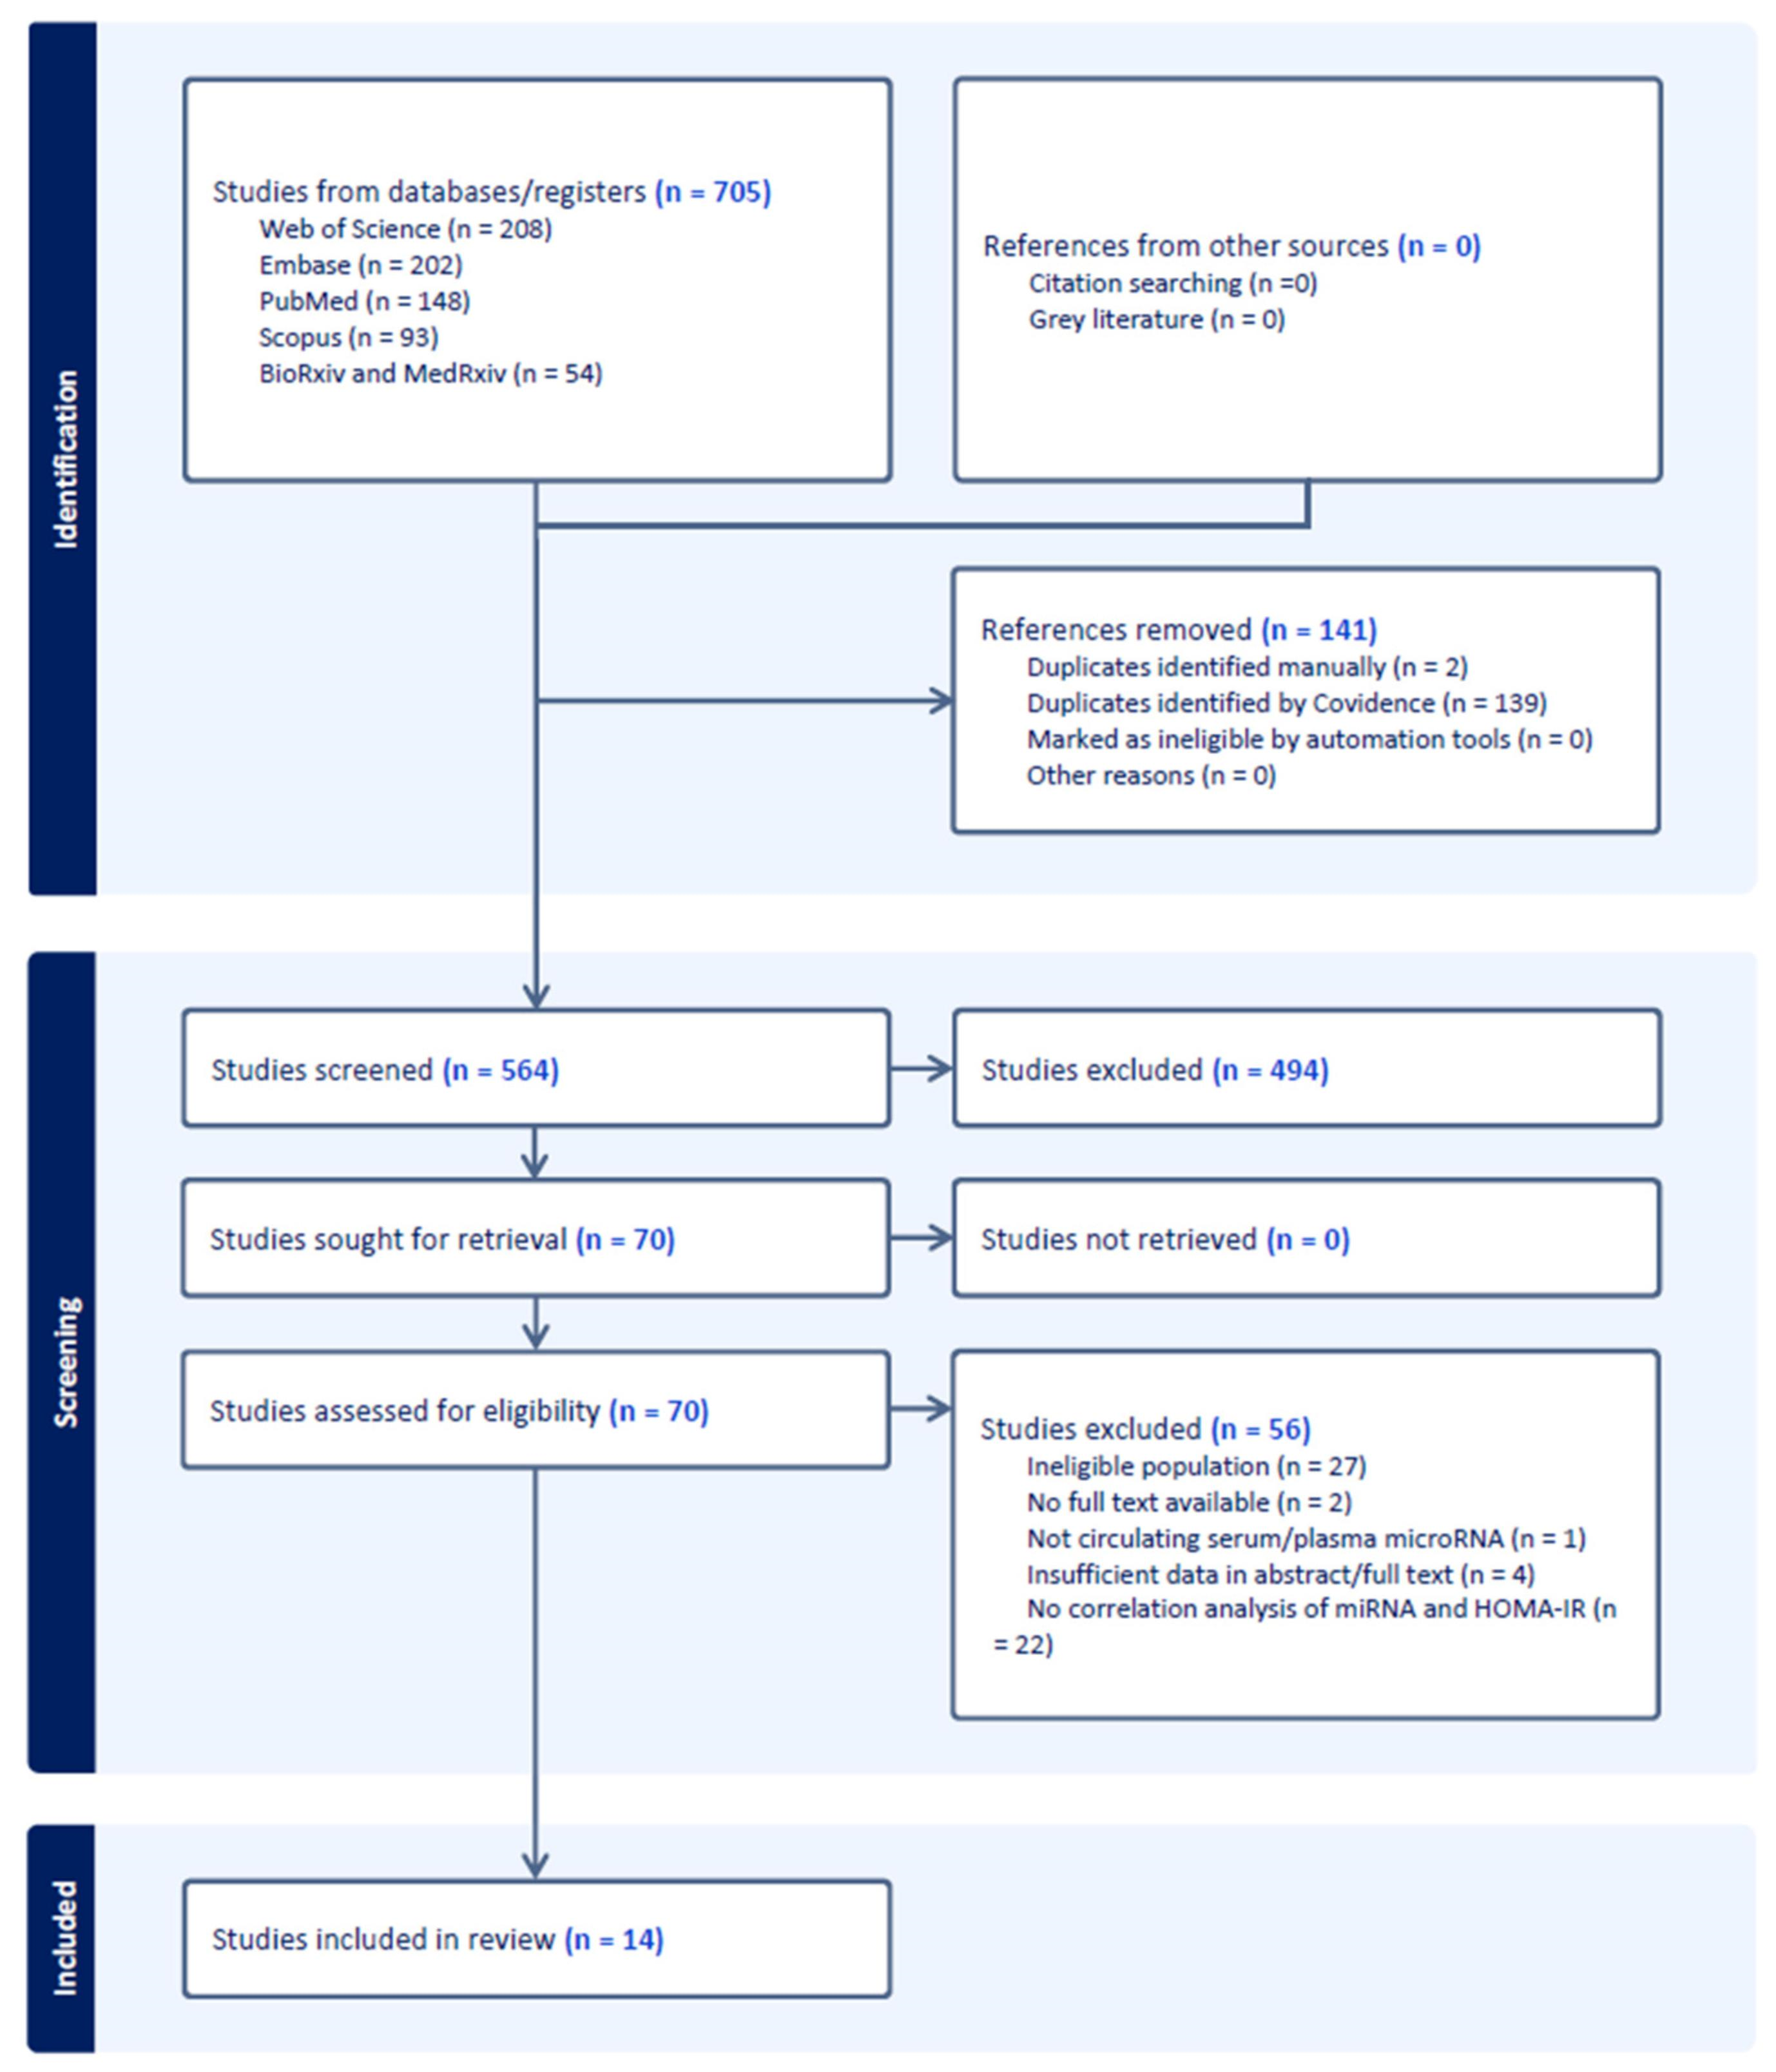
Database searches identified 705 records (Figure 2). Following the predetermined search criteria and deduplication in Covidence, 564 studies underwent title and abstract screening. Out of these, 494 studies were excluded as clearly ineligible, and 70 were retrieved for full-text review. Following this, 56 studies were excluded, with 14 studies meeting all eligibility criteria for inclusion in the review.
Figure 2.
PRISMA 2020 flow diagram of the selection process, created in Covidence.
3.2. Characteristics of Included Studies
The included studies were published between 2014 and 2024 and are summarised in Table 4. Together, they reported 29 circulating miRNA–HOMA-IR associations across both ethnicities. The predominant study design was cross-sectional case–control (12/14 studies), with one prospective cohort study and one mixed cross-sectional/longitudinal study. Sample sizes varied widely, from 30 to 826 participants, with a median sample size of approximately 111 participants.
Table 4.
Summary of included studies’ characteristics (n = 14).
Serum and plasma were both used as biological sample types, and all studies measured circulating miRNAs using PCR-based methods. However, normalisation strategies varied substantially, and in some cases, unclear reporting was found. HOMA-IR was used in all studies, but reporting of HOMA version and log-transformation was inconsistent. These differences in normalisation and HOMA-IR handling were important sources of methodological heterogeneity and are considered in the interpretation of findings and associated limitations.
3.3. Risk of Bias Assessment
Risk of bias was assessed across seven domains for all fourteen included studies, with results summarised in Table 5. Overall, five studies were judged to be at low risk of bias, five at unclear risk, and four at high risk.
Table 5.
Risk of bias summary for included studies (n = 14).
Confounding was the most consistently problematic domain, having scored high risk in 8 out of 14 studies. This was due to failure to adjust for key confounders such as BMI, medication use, and comorbidities like cardiovascular disease. This was particularly important in the Serik et al. studies [45,47,48,49], which recruited participants with coronary artery disease (CAD) alongside T2D, without adjusting for the potential independent effects of CAD on circulating miRNA expression. Additionally, several studies rated high in miRNA Measurement Bias due to the absence of information regarding miRNA isolation procedures, storage conditions, and quality control. Outcome Measurement (HOMA-IR Bias) was rated unclear/high for seven studies, reflecting either failure to report the HOMA model used or information about log-transformation.
Ethnicity classification was another important limitation. Only five studies clearly defined and reported ethnicity, while in the remaining nine studies, ethnicity was inferred from the country of recruitment. This reduced confidence in attributing findings to specific ethnic groups, particularly in cross-ethnic comparisons, as country of residence does not necessarily reflect ethnic background.
3.4. Qualitative Synthesis of miRNA–HOMA-IR Associations
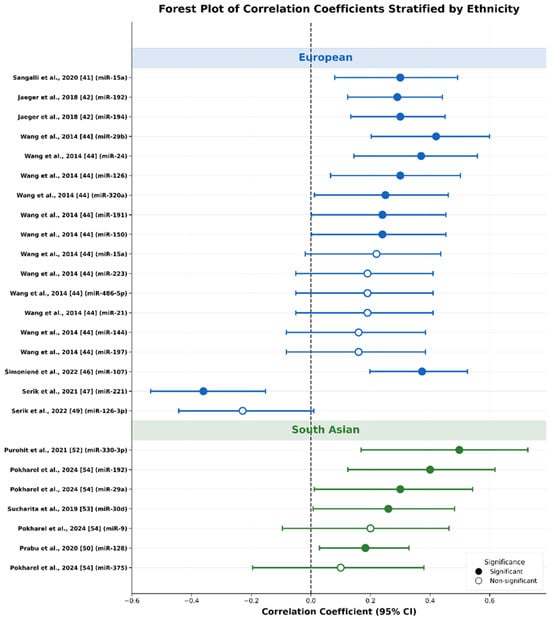
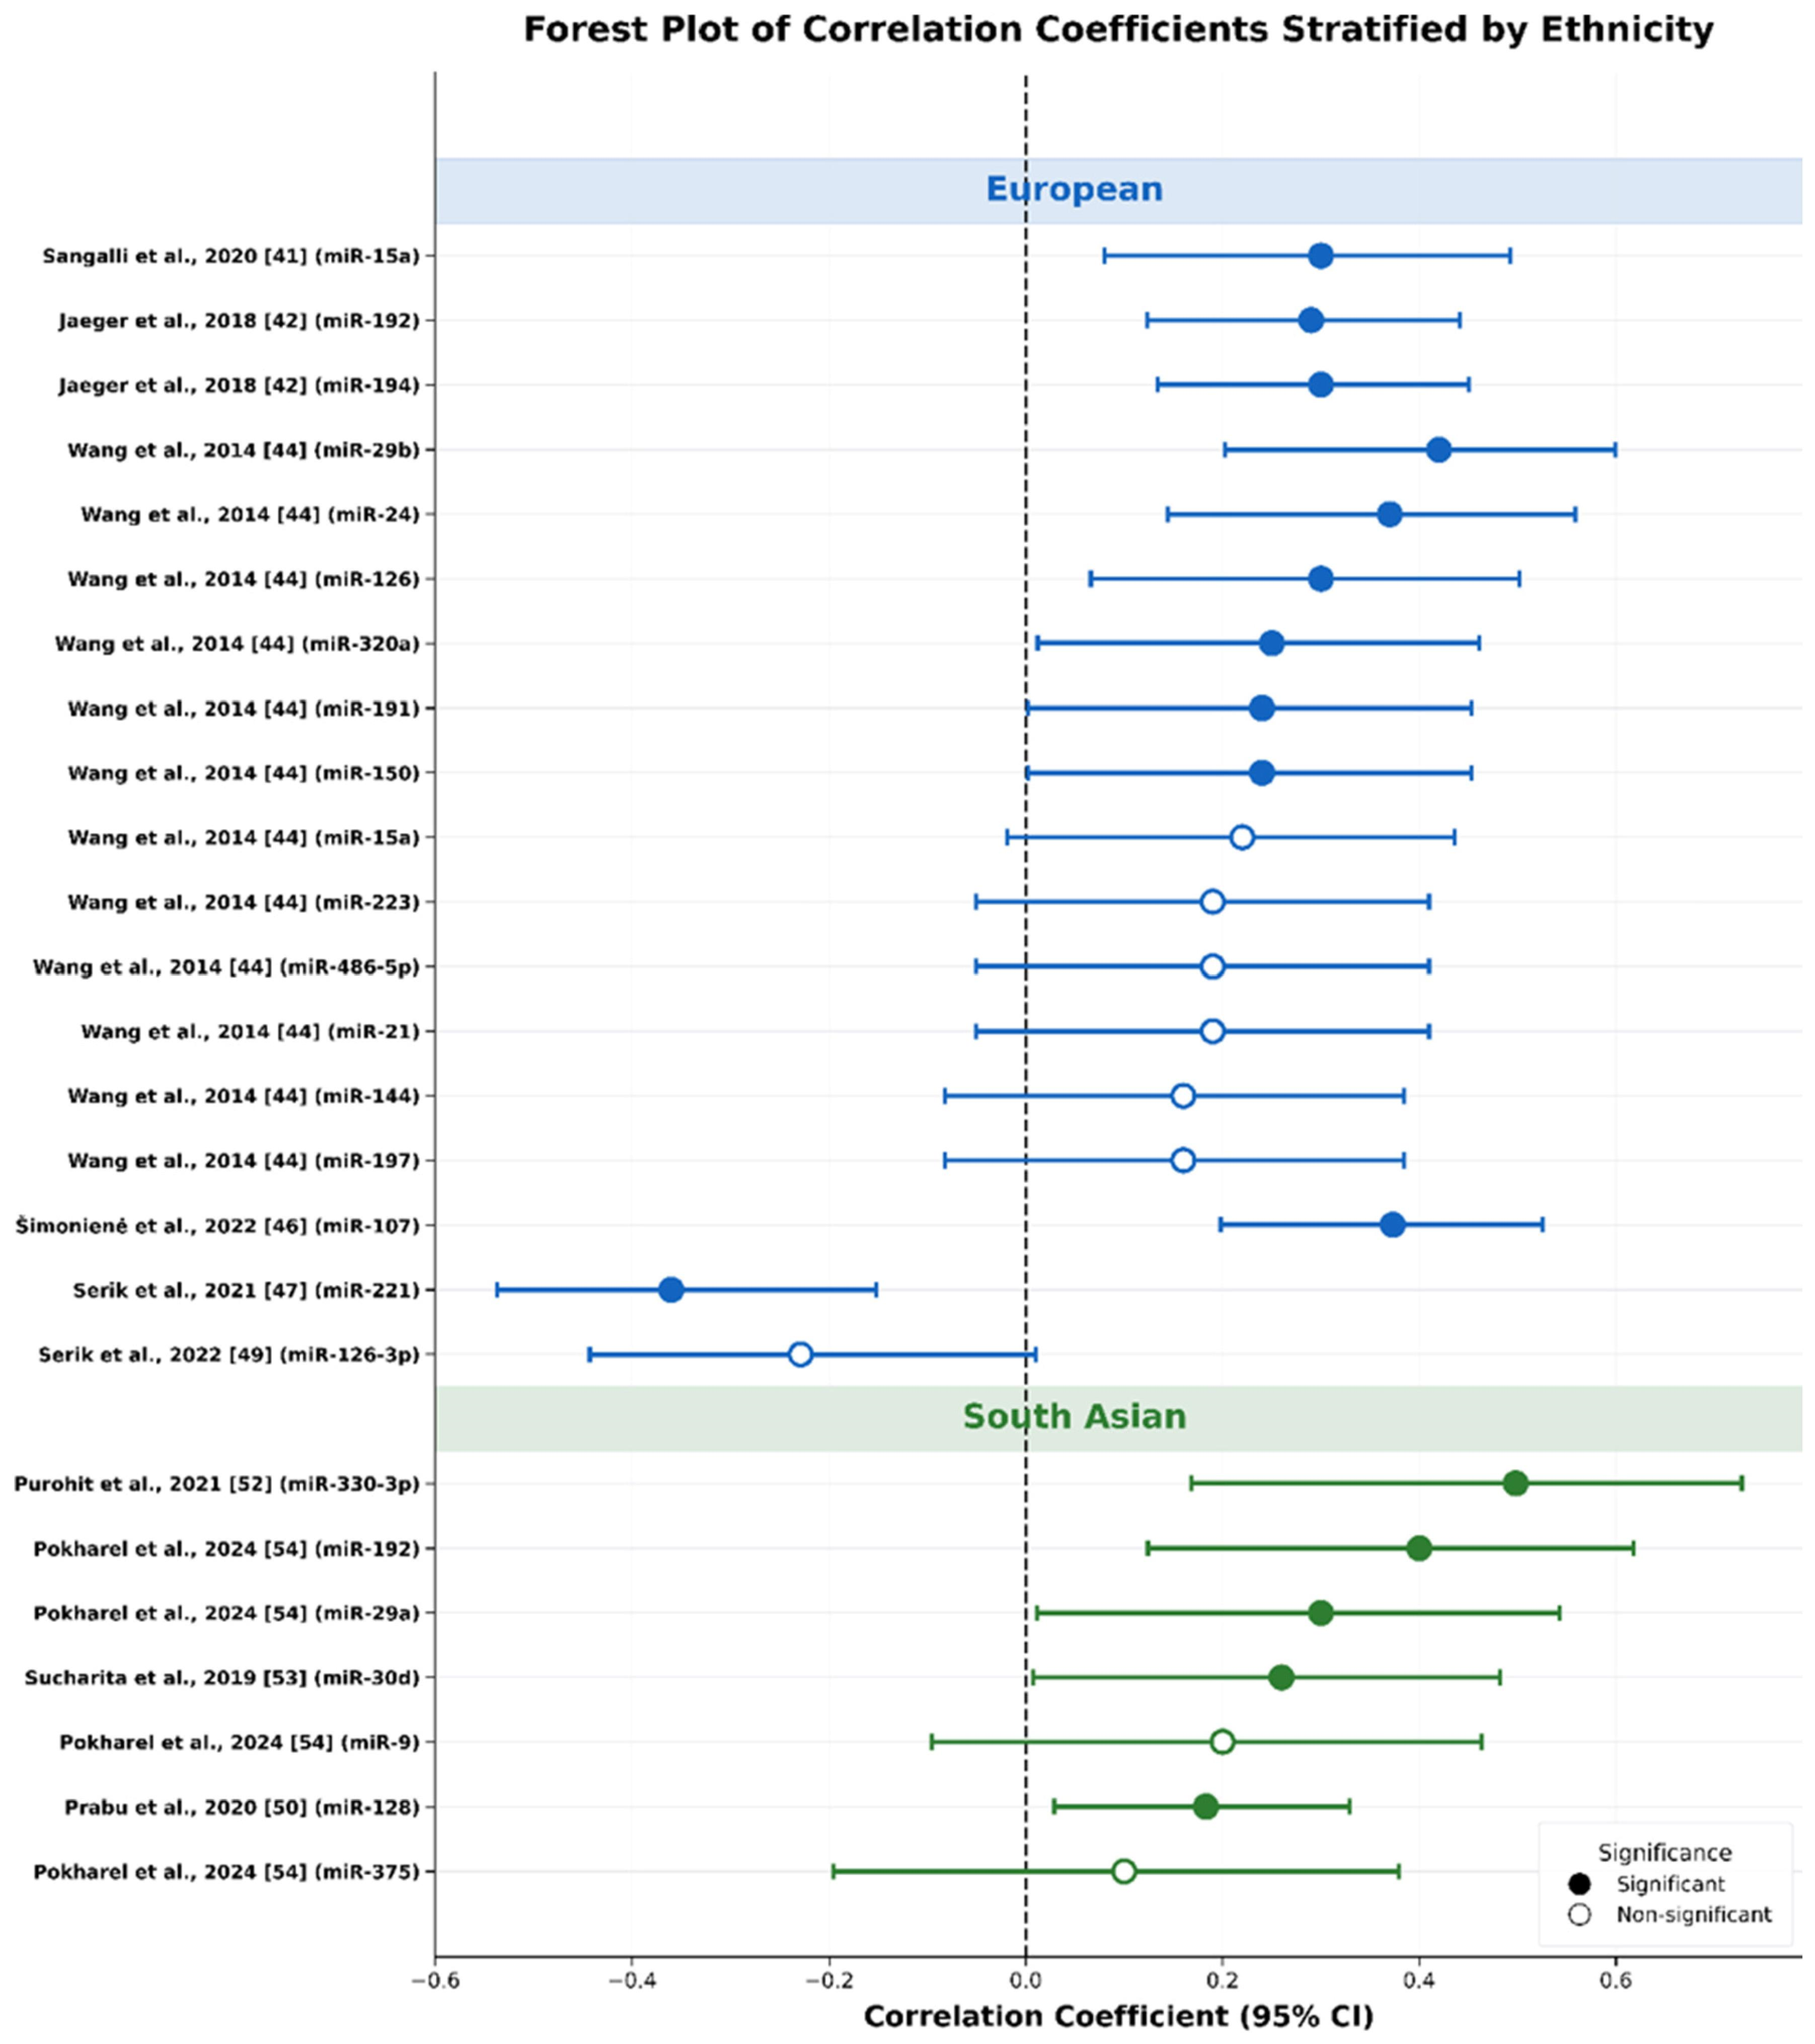
Across the 14 included studies, 29 circulating miRNA–HOMA-IR associations were reported, involving 21 distinct miRNA species. Most associations were positive, indicating that higher circulating miRNA expression was associated with higher insulin resistance. The main exceptions were miR-126-3p and miR-221, which showed negative associations in the CAD-comorbid studies by Serik and colleagues [45,47,48,49]. A total of 12 of the 29 associations reached statistical significance (p < 0.05). In interpreting the findings below, greater weight is given to associations that were statistically significant, derived from methodologically stronger studies, and observed across more than one cohort. Figure 3 presents a descriptive forest plot visualising comparisons of effect sizes and directions across both ethnic groups. The full synthesis of association data is presented in Table 6 and Supplementary Table S2.
Figure 3.
Descriptive forest plot of the 25 associations for which Pearson (r) or Spearman correlation coefficients were reported, allowing visual comparison of effect size and direction across both ethnic groups. Data were from Sangalli et al., 2020 [41], Jaeger et al., 2018 [42], Wang et al., 2014 [44], Šimonienė et al., 2022 [46], Serik et al., 2021 [47], Serik et al., 2022 [49], Prabu et al., 2020 [50], Purohit et al., 2021 [52], Sucharita et al., 2019 [53] and Pokharel et al., 2024 [54].
Table 6.
Summary of circulating miRNA–HOMA-IR associations across included studies (n = 29 associations from 14 studies).
3.5. miRNAs Reported in European Population
Overall, the European evidence base was mixed in both quality and reliability. The strongest finding was miR-122 in Willeit et al. [43], which stands out because it used a prospective design, included a large sample, log-transformed HOMA-IR, adjusted for covariates, and was the only study in this review to report confidence intervals (CIs). This makes it the most methodologically convincing association identified. The miR-192 and miR-194 findings from Jaeger et al. [42] seem plausible, but they carry less weight because the analyses were unadjusted, and it was unclear how HOMA-IR was handled. Wang et al. [36] reported the highest number of associations from a single European study, although these were unadjusted correlations from a combined cohort, and several did not reach significance. miR-107 in Šimonienė et al. [46] is also worth noting as a positive finding from a low-risk-of-bias study, although the correlation method was not clearly reported. The negative associations for miR-126-3p and miR-221 in the Ukrainian CAD cohorts [45,47,48,49] should be interpreted cautiously, as all were rated high risk of bias, none adjusted for confounding from CAD or related treatment, and two pairs of studies appear to use the same or overlapping cohorts rather than independent samples.
3.6. miRNAs Reported in South Asian Populations
Within the South Asian evidence base, Prabu et al. [50] carries the most interpretive weight. It was the only South Asian study rated as low overall risk of bias and reported explicit use of HOMA1, validated spike in normalisation, and a well-characterised population-based cohort. Prabu and colleagues [51] documented the statistically detailed South Asian findings for miR-374a-5p, with similar β coefficients in both unadjusted and sex-adjusted regression models, although confidence was reduced by the high confounding risk rating. The findings for miR-30d by Sucharita et al. [53] and miR-128 by Prabu et al. [50] are supported by reasonably valid methods, but both remain unreplicated. The hsa-miR-330-3p result from Purohit et al.’s study [51] should be treated as provisional because the sample included only 30 participants, methodological reporting was limited, and the study was rated high risk of bias across multiple domains. Pokharel et al.’s [54] study is still useful, especially as the only Nepali study and the only source of cross-ethnic overlap for miR-192 and the miR-29 family, but its findings should also be interpreted cautiously. This is because the correlation coefficients were only available as heatmap approximations, and the sample size of 46 limits confidence in the results.
3.7. Cross-Ethnic Comparisons and Patterns
In this review, direct cross-ethnic comparisons of miRNA–HOMA-IR associations were not possible, as no single study reported association data for both South Asian and European participants within the same design. Comparisons can therefore only be drawn at the cross-study level and should be interpreted cautiously.
Despite this, three main descriptive observations are worth documenting. First, miR-192 showed a significant positive association with HOMA-IR in both an independent European study (Jaeger et al. ρ = 0.29, p = 0.0007 [42]) and an independent South Asian study (Pokharel et al. ρ ≈ 0.4, p < 0.01 [54]). It was the only miRNA found in the literature which is studied in both populations. Second, some members of the miR-29 family also showed positive associations across regions: miR-29b in the European Wang et al. [36] cohort (ρ = 0.42, p = 0.0003) and miR-29a in the South Asian Pokharel et al. [54] cohort (ρ ≈ 0.3, p < 0.05). Although these are different family members rather than the same miRNA species, the shared positive direction is noteworthy. Third, miR-126-3p showed negative associations in two European studies [45,49] but was not examined in any South Asian studies available.
The majority of miRNAs were investigated in only one ethnic population. For example, miR-122 was reported only in European cohorts, whereas miR-374a-5p was reported only in South Asian cohorts. Therefore, the lack of cross-ethnic overlap may reflect a lack of research studies rather than the absence of evidence.
4. Discussion
This systematic review aimed to identify circulating miRNAs associated with insulin resistance, measured by HOMA-IR, in adults with T2D, and to explore whether association patterns are similar or divergent between South Asian and European populations. Across 14 included studies, 29 miRNA–HOMA-IR associations were reported, of which 12 reached statistical significance (p < 0.05), and all but four were positively associated.
Overall analysis supported that circulating miRNAs show consistent associations with HOMA-IR in the published literature, with the predominant direction being positive. This is consistent with prior reviews of circulating miRNA dysregulation in T2D more broadly [28], and with mechanistic evidence demonstrating that several of the miRNAs identified here regulate key nodes of the insulin signalling cascade, including components of the PI3K-AKT pathway and IRS proteins [22,26,27].
However, the absence of cross-ethnic data reflects a structural gap in the miRNA biomarker literature. No study directly compared circulating miRNA–HOMA-IR associations between South Asian and European populations, and cross-study comparisons remain limited by differences in study design and methodology. The observed patterns identified here are therefore hypothesis-generating rather than conclusive. The most defensible conclusion is that the literature reveals a substantial gap in cross-ethnic miRNA research, rather than definitive evidence on ethnic differences in circulating miRNA–HOMA-IR associations.
4.1. Associations Reported in European Populations: miR-122, miR-192, and miR-194 and “The Hepatic miRNA Cluster”
Together, miR-122, miR-192, and miR-194 may represent a putative hepatic metabolic miRNA signature: three liver-enriched, co-regulated molecules showing positive associations with HOMA-IR across independent European cohorts.
The strongest evidence comes from Willeit et al. [43], who reported a positive association between circulating miR-122 and log HOMA-IR in the Bruneck cohort. Given the study’s low risk of bias and appropriate covariate adjustment, this finding carries substantial weight. miR-122 accounts for approximately 70% of hepatic miRNA content and regulates lipid metabolism, including fatty acid oxidation and cholesterol biosynthesis [55]. Circulating miR-122 increases in hepatocyte stress and NAFLD and correlates with steatosis severity [56], suggesting that its relationship with HOMA-IR likely reflects hepatic lipid overload rather than a direct causal role in insulin resistance.
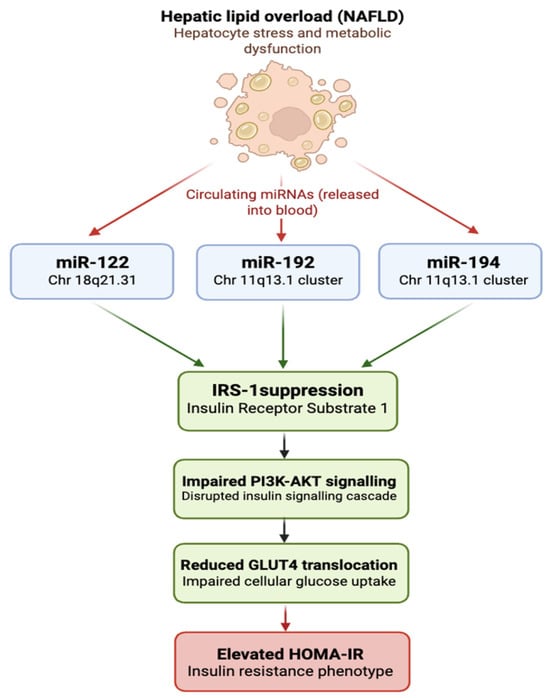
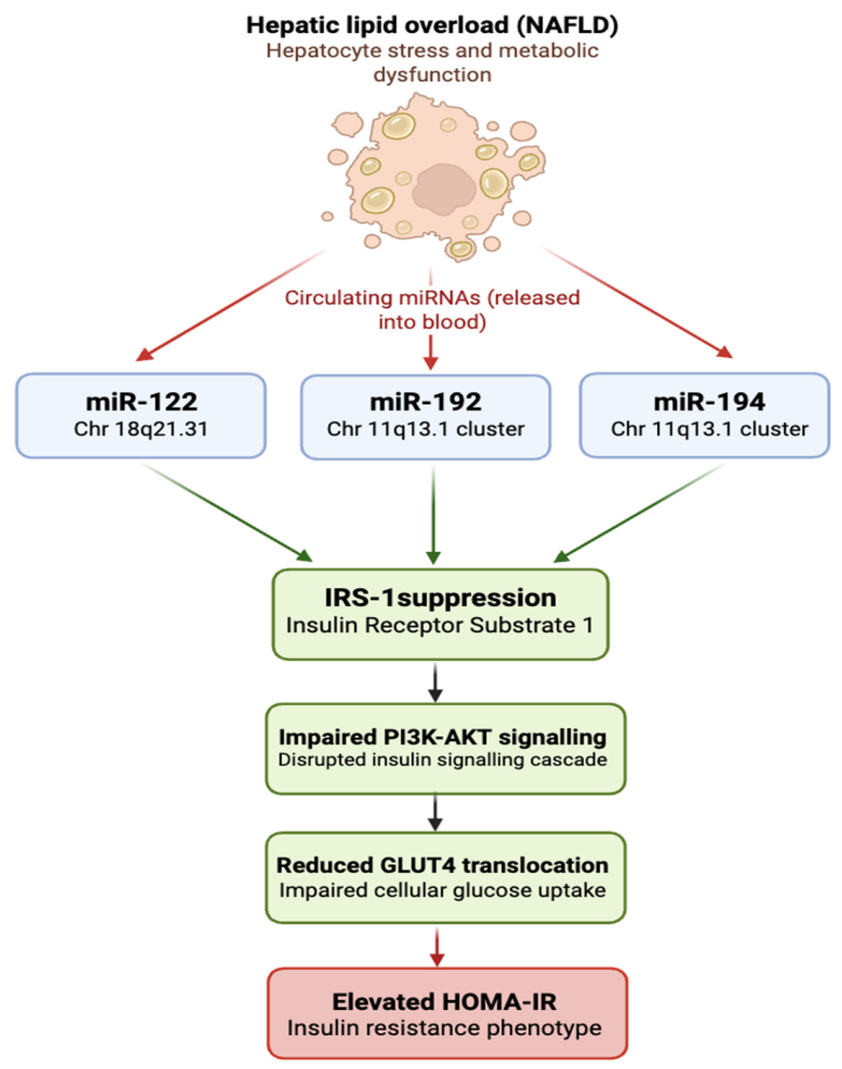
Jaeger et al. [42] reported significant positive correlations between HOMA-IR and both miR-192 (ρ = 0.29, p = 0.0007) and miR-194 (ρ = 0.30, p = 0.0005) in an Austrian/UK cohort. These miRNAs are co-encoded at chromosome 11q13.1 and highly expressed in the liver and intestinal epithelium [57], making their concordant upregulation consistent with shared transcriptional control during hepatic metabolic stress. A preliminary hypothesis for consideration is that NAFLD-related hepatocyte dysfunction drives release of miR-122 while activating the miR-192/194 cluster, converging on IRS-1 suppression and impaired PI3K-AKT signalling, thereby increasing HOMA-IR (Figure 4). Although this postulated hepatic signature could provide greater biomarker specificity than individual miRNAs, the findings of Jaeger et al. should be interpreted cautiously because analyses were unadjusted and confidence intervals were not reported. To validate this early hypothesis, studies within larger ethnically defined populations would need to be undertaken.
Figure 4.
Author-drawn preliminary hypothesis of hepatic metabolic miRNA signature. Hepatic lipid overload associated with NAFLD drives the co-release of three liver-enriched circulating miRNAs: miR-122 and the co-encoded miR-192/miR-194 cluster on chromosome 11q13.1. All three converge on suppression of IRS-1, impairing PI3K-AKT signalling and GLUT4-mediated glucose uptake, providing a mechanistic basis for their co-association with elevated HOMA-IR observed across independent European cohorts in this review.
4.2. Associations Reported in South Asian Populations
Prabu et al. [50] reported a significant positive Pearson correlation between circulating miR-128 and HOMA-IR (r = 0.183, p = 0.021) in a well-characterised Indian cohort. miR-128 has been reported to target SIRT1, a regulator of insulin sensitivity acting through IRS-1 and FOXO transcription factors [58]. Elevated miR-128 may therefore plausibly contribute to insulin resistance through suppression of SIRT1, although this has not been directly demonstrated in circulating miRNA studies in South Asian populations.
Prabu et al. [51] provided the most statistically informative South Asian result, reporting a positive association between circulating miR-374a-5p and HOMA-IR in both unadjusted (β = 0.109, p = 0.013) and sex-adjusted (β = 0.108, p = 0.015) models. However, miR-374a-5p remains poorly characterised in insulin resistance currently.
The finding for circulating miR-30d from Sucharita et al. [53] is also relevant to South Asians. miR-30d has been linked to lipid-mediated cell stress and pancreatic β-cell function under lipotoxic conditions [59]. South Asian populations characteristically exhibit greater visceral and ectopic fat deposition even at lower BMI values, contributing to elevated free fatty acid flux and intracellular lipid accumulation in metabolic tissues [11]. This pattern could plausibly influence miR-30d expression and its relationship with insulin resistance, but the evidence remains speculative due to limited sample size and lack of replication. Similarly, the hsa-miR-330-3p association reported by Purohit et al. [52], although statistically significant (ρ = 0.498, p = 0.005), should be treated as highly provisional given the very small sample, poor methodological documentation, and assigned high risk of bias.
4.3. Cross-Ethnic Signals: The miR-29 Family
The most plausible cross-ethnic signal identified in this review involves the miR-29 family. Wang et al. [44] reported the strongest individual Spearman’s correlation in the European evidence base for miR-29b (ρ = 0.42, p = 0.0003) in a Swedish cohort, while Pokharel et al. [54] reported a significant positive association for miR-29a (ρ ≈ 0.3, p < 0.05) in a Nepali cohort. miR-29a and miR-29b are members of the miR-29 family, along with miR-29c, encoded from two genomic clusters. All three members share an identical seed sequence (AGCACC), meaning they are predicted to regulate an overlapping set of target genes [60].
Evidence suggests the miR-29 family is mechanistically relevant to insulin resistance. Members of this family have been shown to target IRS-1, a central adaptor protein in the PI3K-AKT insulin signalling pathway, and their overexpression has been associated with impaired insulin-stimulated glucose uptake in adipocytes and attenuation of insulin action in hepatocytes [57,60]. Elevated circulating miR-29 in the context of higher HOMA-IR is therefore consistent with a model in which increased miR-29 expression suppresses IRS-1, disrupts downstream PI3K-AKT signalling, and contributes to reduced cellular insulin sensitivity.
Whether this reflects genuine cross-ethnic consistency or coincidental convergence cannot be resolved from the current data. The two studies differed not only in the miR-29 subgroup examined, but also in methodology, as Pokharel et al. [54] reported coefficients from a heatmap rather than tabulated data without confirmation of exact values. This comparison between miR-29a and miR-29b therefore limits direct cross-ethnic inference, even despite their shared seed sequence. Although the shared seed sequence supports the biological plausibility of similar functional effects, it is not a substitute for direct empirical evidence across ethnic groups. The miR-29 family finding is therefore best characterised as a hypothesis-generating cross-ethnic signal that requires direct investigation in future studies.
4.4. Negative Associations: miR-126-3p and miR-221
Serik and colleagues [45,47,48,49] reported negative associations between miR-126-3p and miR-221 and HOMA-IR. All four studied populations had both CAD and T2D. Each was rated as high overall risk of bias; none adjusted for the independent effects of CAD, and two pairs of studies appear to use the same or heavily overlapping cohorts rather than independent samples, so they cannot be treated as independent replications.
The negative directions are not inherently biologically implausible. miR-126-3p is mainly expressed in endothelial cells and is involved in vascular integrity and angiogenic signalling [61]. In advanced cardiovascular disease, circulating miR-126-3p may be reduced because of ongoing endothelial uptake and repair, so lower levels in patients with greater insulin resistance within a CAD cohort may reflect cardiovascular disease burden rather than insulin resistance itself. miR-221 is also involved in vascular smooth muscle cell biology and endothelial function [59,61], and its negative association with HOMA-IR in these cohorts is likewise difficult to separate from CAD severity, medication use, and the bidirectional relationship between CAD and insulin resistance. Without adjustment for these confounders, the associations cannot be attributed specifically to insulin resistance. These findings are therefore treated as exploratory and excluded from the primary synthesis conclusions.
4.5. Limitations of This Review and Primary Literature
A limitation of this review is that initial screening was performed by a single reviewer, rather than through independent dual screening. Consequently, the potential for selection bias and inadvertent exclusion or inclusion of studies cannot be entirely excluded, and inter-reviewer agreement could not be formally processed/assessed. However, predefined eligibility criteria within Covidence and prospective registration on OSF were used to standardise decision making and enhance transparency throughout the study selection process.
Study-specific concerns also apply. For Pokharel et al. [54], exact correlation coefficients were unavailable and had to be approximated from a heatmap colour scale, introducing some imprecision. In addition, the four Ukrainian studies [45,47,48,49] appeared to involve substantial cohort overlap, which could not be confirmed from the publications alone and may have led to overrepresentation of CAD-T2D populations in the synthesis.
Several recurring weaknesses in the primary literature also limit confidence in the findings. Most importantly, covariate adjustment was rare: only 3 of the 29 associations reported any adjustments for key factors such as BMI and medication, leaving many reported associations open to confounding.
HOMA-IR reporting was also inconsistent, with only six studies explicitly stating use of HOMA1 and only three confirming log transformation. CIs were reported for only 1 of the 29 associations, limiting direct visual comparison of uncertainty across the evidence base. To partially address this, 95% CIs were derived for plotted associations using Fisher’s z-transformation (Figure 3). This approach was originally derived for Pearson’s r but is conventionally applied to Spearman’s ρ [62]. Small sample sizes in several South Asian studies (n = 30–46) produced wide intervals that should be interpreted with caution. The derived CIs therefore provide an indicative uncertainty range rather than a definitive statistical inference.
Variation in miRNA laboratory measurements and normalisation methods introduce further technical heterogeneity and limitations which should be considered carefully in interpretation of results [38].
Ethnicity was not explicitly reported in nine studies and was therefore inferred from the country of recruitment. This introduces the potential for population misclassification, as country of residence does not necessarily reflect ethnic background. Consequently, the validity of cross-ethnic comparisons should be interpreted with caution, as some observed differences may reflect inaccuracies in population assignment rather than true ethnic variation.
The cross-ethnic findings should also be interpreted cautiously. Although several miRNAs appeared to show stronger associations in South Asian populations, many of these observations were derived from a small number of studies with relatively modest sample sizes. Furthermore, ethnicity was not consistently reported across the evidence base and, in some cases, had to be inferred from the country of recruitment. Given the ethnic heterogeneity present within many countries, this may have resulted in some misclassification of study populations. Consequently, apparent differences between South Asian and European cohorts may partly reflect limitations in study reporting and population assignment rather than true biological variation. The observed ethnic patterns are therefore best regarded as hypothesis-generating and warrant confirmation in larger, well-characterised cohorts with consistently reported ethnicity and standardised methodological approaches (refer to Future Research Directions and Wider Implications).
Additionally, the median sample size was approximately 111, below what is often considered desirable for biomarker correlation studies, increasing the risk of unstable estimates and chance findings.
4.6. Clinical Implications
Despite the limitations outlined above, the predominance of positive circulating miRNA–HOMA-IR associations provides preliminary support for circulating miRNAs as minimally invasive biomarkers of insulin resistance. Their stability in biological fluids, accessibility through routine blood sampling, and compatibility with RT-qPCR platforms support their potential feasibility for metabolic risk assessment [25,28], but caution is warranted here as the abundance of miRNA in circulation does not necessarily mean that its expression is also increased in specific cells or tissues or disease state.
The potential for ethnically specific miRNA biomarker profiles is particularly relevant to South Asian populations. Conventional metabolic risk algorithms, including those based on BMI thresholds and standard glycaemic parameters, are less sensitive for identifying T2D risk in South Asians. Ethnically calibrated circulating miRNA signatures could potentially complement existing risk stratification tools by capturing molecular features of metabolic risk that are not reflected in standard anthropometric or glycaemic measures. The associations of miR-374a-5p and miR-128 with HOMA-IR in South Asian cohorts provide a preliminary indication that such ethnically distinct molecular profiles may exist, though the evidence is currently insufficient to support clinical translation. Validation in large, ethnically stratified cohorts is essential before clinical application could be considered.
4.7. Future Research Directions and Wider Implications
The main research priority arising from this review is the design of adequately powered, prospective, multi-ethnic studies that include both South Asian and European participants within the same design, allowing direct comparison of circulating miRNA–HOMA-IR associations by ethnicity. These studies should pre-specify candidate miRNAs based on the current evidence, including miR-122, miR-192, the miR-29 family, miR-374a-5p, and miR-128, and should be powered to detect ethnicity-by-miRNA interaction effects rather than main effects alone.
Methodological standardisation is equally important. More consistent HOMA-IR reporting, including explicit statement of model version (HOMA1 or HOMA2), log transformation, and covariate adjustment for at least age, sex, BMI, and medication use, would reduce the heterogeneity that currently limits comparison across studies. Standardised normalisation protocols, for example, spike-in controls combined with validated endogenous reference miRNAs selected using GeNorm or NormFinder algorithms, would also improve technical reproducibility and inter-laboratory comparability [38].
Three replication priorities emerge. First, the positive miR-192 association with HOMA-IR, reported in independent South Asian and European studies, should be tested in a directly comparative multi-ethnic design. Second, the miR-29 family should be examined across both ethnic groups to establish whether the same species shows consistent positive associations and whether these reflect shared or distinct pathways. Third, the hepatic metabolic miRNA signature (miR-122, miR-192, miR-194) should be validated as a coordinated panel in a prospective multi-ethnic study. An ideal design would recruit matched South Asian and European participants from an established cohort such as UK Biobank, measuring all three miRNAs alongside MRI-derived proton density fat fraction (MRI-PDFF) as a gold-standard measure of hepatic steatosis. This would directly test whether the three miRNAs co-vary with liver fat across ethnic groups and whether the signature is associated within European populations or generalises to South Asians, where NAFLD prevalence and hepatic fat distribution differ phenotypically. To finalise these judgements and justify the prioritisation of miRNA candidates for future research, Table 7 presents a GRADE-adapted certainty of evidence assessment across the five priority targets identified in this review [63].
Table 7.
GRADE-adapted certainty of evidence for priority miRNA–HOMA-IR candidates for future research.
The fragmented literature identified in this review reflects not only scientific uncertainty but also the structural underrepresentation of South Asian populations in biomedical research. South Asians make up around 25% of the global population but fewer than 2% of participants in genetic and genomic studies [29]. A similar imbalance appears in the miRNA biomarker literature, with five South Asian studies identified compared with nine European studies, despite the greater T2D burden in South Asians. If circulating miRNA biomarkers are developed and validated mainly in European cohorts, they may perform poorly or inequitably when applied to South Asian patients, where earlier and more sensitive risk detection is especially needed. This translational risk should be addressed explicitly in future biomarker development programmes.
A related concern is that normalisation strategies, reference gene panels, and population-level miRNA expression data have largely been established in European-ancestry studies, raising doubts about their suitability for South Asian samples. Because population-specific genetic variation in miRNA gene sequences and regulatory regions can influence miRNA expression [30], future studies should validate normalisation approaches within each ethnic cohort rather than assume cross-ethnic transferability.
Finally, future research should move beyond observational biomarker studies towards mechanistic work explaining why miRNA-insulin resistance associations may differ across ethnic groups. Integrating circulating miRNA profiling with measures of visceral adiposity, ectopic fat deposition, and genetic variation in miRNA regulatory loci within multi-ethnic cohorts would help disentangle the contributions of biology, environment, and measurement. That would move the field beyond merely describing ethnic differences towards explaining them, which is the more important scientific and clinical goal.
5. Conclusions
This is the first systematic review to specifically examine and compare circulating miRNA signatures associated with insulin resistance, measured by HOMA-IR, across South Asian and European study populations. Across 14 included studies and 29 reported associations, circulating miRNAs showed predominantly positive associations with HOMA-IR. The most robust individual finding was the positive association between circulating miR-122 and log HOMA-IR in the Bruneck prospective cohort, in line with the recognised role of miR-122 as a hepatic metabolic biomarker. Co-directional associations for miR-192 and miR-194 in an independent European cohort further suggest a putative hepatic miRNA cluster linked to insulin resistance in European populations, although this remains to be replicated with appropriately adjusted analyses.
miR-192 and the miR-29 family were the most plausible cross-ethnic signals identified, but direct within-study ethnic comparison was not possible, and most miRNAs were investigated in only one ethnic population. This reflects a substantial gap in the literature rather than evidence of true ethnic differences in miRNA–HOMA-IR associations. The clinical and scientific implications of the findings underline the need for multi-ethnic, adequately powered, and methodologically standardised studies in this field. This review provides a mapped evidence base and highlights priority targets for future cross-ethnic research, particularly miR-122, miR-192, the miR-29 family, miR-128, and miR-374a-5p.
Supplementary Materials
The following supporting information can be downloaded at: https://www.mdpi.com/article/10.3390/ijms27219827/s1. References [41,42,43,44,45,46,47,48,49,50,51,52,53,54] are cited in the Supplementary Materials.
Author Contributions
Conceptualization, S.S.M. and T.K.; methodology, T.K., S.S.M., D.J.H., E.C.A., M.S., and P.S.; software, T.K.; validation, T.K. and S.S.M.; formal analysis, T.K.; investigation, T.K.; data curation, T.K.; writing—original draft preparation, T.K. and S.S.M.; writing—review and editing, T.K., S.S.M., D.J.H., E.C.A., M.S., and P.S.; visualization, T.K. and S.S.M.; supervision, S.S.M. All authors have read and agreed to the published version of the manuscript.
Funding
This research received no external funding.
Institutional Review Board Statement
Not applicable.
Informed Consent Statement
Not applicable.
Data Availability Statement
No new data were created or analyzed in this study. Data sharing is not applicable to this article.
Acknowledgments
During the preparation of this manuscript/study, the author(s) used Covidence for collation of searched publications and formulation of PRISMA figure (Figure 2). Covidence website states the use of AI for some aspects, which have not affected the overall integrity and analysis of our study. All data collection and analysis were cross-checked and confirmed by the authors. The authors have reviewed and edited the output and take full responsibility for the content of this publication.
Conflicts of Interest
The authors declare no conflicts of interest.
Abbreviations
The following abbreviations are used in this manuscript:
| T2D | Type 2 diabetes mellitus |
| miRNA | MicroRNAs |
| IRS | Insulin Resistance |
| IGT | Impaired glucose tolerance |
| eQTLs | Expression quantitative trait locus |
References
- International Diabetes Federation. IDF Diabetes Atlas, 11th ed.; International Diabetes Federation: Brussels, Belgium, 2025; Available online: https://diabetesatlas.org (accessed on 12 June 2026).
- American Diabetes Association Professional Practice Committee. 2. Diagnosis and classification of diabetes: Standards of care in diabetes 2026. Diabetes Care 2026, 49, S27–S49. [Google Scholar] [CrossRef] [Scilit] [PubMed]
- Zheng, Y.; Ley, S.H.; Hu, F.B. Global aetiology and epidemiology of type 2 diabetes mellitus and its complications. Nat. Rev. Endocrinol. 2018, 14, 88–98. [Google Scholar] [CrossRef] [Scilit] [PubMed]
- Jain, S.; Saraf, S. Type 2 diabetes mellitus: Its global prevalence and therapeutic strategies. Diabetes Metab. Syndr. 2010, 4, 48–56. [Google Scholar] [CrossRef] [Scilit]
- Ong, K.L.; Stafford, L.K.; McLaughlin, S.A.; Boyko, E.J.; Vollset, S.E.; Smith, A.E.; Dalton, B.E.; Duprey, J.; Cruz, J.A.; Hagins, H.; et al. Global, regional, and national burden of diabetes from 1990 to 2021, with projections of prevalence to 2050: A systematic analysis for the Global Burden of Disease Study 2021. Lancet 2023, 402, 203–234, Erratum in Lancet 2023, 402, 1132. https://doi.org/10.1016/S0140-6736(23)02044-5; Erratum in Lancet 2025, 405, 202. https://doi.org/10.1016/S0140-6736(25)00053-4.. [Google Scholar] [CrossRef] [Scilit] [PubMed]
- Genitsaridi, I.; Salpea, P.; Salim, A.; Sajjadi, S.F.; Tomic, D.; James, S.; Thirunavukkarasu, S.; Issaka, A.; Chen, L.; Basit, A.; et al. 11th edition of the IDF Diabetes Atlas: Global, regional, and national diabetes prevalence estimates for 2024 and projections for 2050. Lancet Diabetes Endocrinol. 2026, 14, 149–156, Erratum in Lancet Diabetes Endocrinol. 2026, 14, e12. https://doi.org/10.1016/S2213-8587(26)00238-X.. [Google Scholar] [CrossRef] [Scilit] [PubMed]
- Gujral, U.P.; Pradeepa, R.; Weber, M.B.; Narayan, K.M.V.; Mohan, V. Type 2 diabetes in South Asians: Similarities and differences with white Caucasian and other populations. Ann. N. Y. Acad. Sci. 2013, 1281, 51–63. [Google Scholar] [CrossRef] [Scilit] [PubMed]
- Garduño-Díaz, S.D.; Khokhar, S. Prevalence, risk factors and complications associated with type 2 diabetes in migrant South Asians. Diabetes Metab. Res. Rev. 2012, 28, 6–24. [Google Scholar] [CrossRef] [Scilit] [PubMed]
- Ranasinghe, P.; Rathnayake, N.; Wijayawardhana, S.; Jeyapragasam, H.; Meegoda, V.J.; Jayawardena, R.; Misra, A. Rising trends of diabetes in South Asia: A systematic review and meta-analysis. Diabetes Metab. Syndr. 2024, 18, 103160. [Google Scholar] [CrossRef] [Scilit] [PubMed]
- Mohan, V. Lessons learned from epidemiology of type 2 diabetes in South Asians: Kelly West Award Lecture 2024. Diabetes Care 2025, 48, 153–163. [Google Scholar] [CrossRef] [Scilit] [PubMed]
- McKeigue, P.M.; Pierpoint, T.; Ferrie, J.E.; Marmot, M.G. Relationship of glucose intolerance and hyperinsulinaemia to body fat pattern in South Asians and Europeans. Diabetologia 1992, 35, 785–791. [Google Scholar] [CrossRef] [Scilit] [PubMed]
- Misra, A.; Ramchandran, A.; Jayawardena, R.; Shrivastava, U.; Snehalatha, C. Diabetes in South Asians. Diabet. Med. 2014, 31, 1185–1198. [Google Scholar] [CrossRef] [Scilit] [PubMed]
- Wright, A.K.; Welsh, P.; Gill, J.M.R.; Kontopantelis, E.; Emsley, R.; Buchan, I.; Ashcroft, D.M.; Rutter, M.K.; Sattar, N. Age-, sex- and ethnicity-related differences in body weight, blood pressure, HbA1c and lipid levels at the diagnosis of type 2 diabetes relative to people without diabetes. Diabetologia 2020, 63, 1542–1553. [Google Scholar] [CrossRef] [Scilit] [PubMed]
- Chiu, M.; Austin, P.C.; Manuel, D.G.; Shah, B.R.; Tu, J.V. Deriving ethnic-specific BMI cutoff points for assessing diabetes risk. Diabetes Care 2011, 34, 1741–1748. [Google Scholar] [CrossRef] [Scilit] [PubMed]
- Lizcano, J.M.; Alessi, D.R. The insulin signalling pathway. Curr. Biol. 2002, 12, R236–R238. [Google Scholar] [CrossRef] [Scilit] [PubMed]
- Sesti, G. Pathophysiology of insulin resistance. Best Pract. Res. Clin. Endocrinol. Metab. 2006, 20, 665–679. [Google Scholar] [CrossRef] [Scilit] [PubMed]
- Zatterale, F.; Longo, M.; Naderi, J.; Raciti, G.A.; Desiderio, A.; Miele, C.; Beguinot, F. Chronic adipose tissue inflammation linking obesity to insulin resistance and type 2 diabetes. Front. Physiol. 2020, 10, 1607. [Google Scholar] [CrossRef] [Scilit] [PubMed]
- Yaribeygi, H.; Rashid Farrokhi, F.; Butler, A.E.; Sahebkar, A. Insulin resistance: Review of the underlying molecular mechanisms. J. Cell. Physiol. 2019, 234, 8152–8161. [Google Scholar] [CrossRef] [Scilit] [PubMed]
- Matthews, D.R.; Hosker, J.P.; Rudenski, A.S.; Naylor, B.A.; Treacher, D.F.; Turner, R.C. Homeostasis model assessment: Insulin resistance and beta-cell function from fasting plasma glucose and insulin concentrations in man. Diabetologia 1985, 28, 412–419. [Google Scholar] [CrossRef] [Scilit] [PubMed]
- Wallace, T.M.; Levy, J.C.; Matthews, D.R. Use and abuse of HOMA modeling. Diabetes Care 2004, 27, 1487–1495. [Google Scholar] [CrossRef] [Scilit] [PubMed]
- Ling, C.; Rönn, T. Epigenetics in human obesity and type 2 diabetes. Cell Metab. 2019, 29, 1028–1044. [Google Scholar] [CrossRef] [Scilit] [PubMed]
- Deng, J.; Guo, F. MicroRNAs and type 2 diabetes. ExRNA 2019, 1, 36. [Google Scholar] [CrossRef] [Scilit]
- Turchinovich, A.; Weiz, L.; Burwinkel, B. Extracellular miRNAs: The mystery of their origin and function. Trends Biochem. Sci. 2012, 37, 460–465. [Google Scholar] [CrossRef] [Scilit] [PubMed]
- Valadi, H.; Ekström, K.; Bossios, A.; Sjöstrand, M.; Lee, J.J.; Lötvall, J.O. Exosome-mediated transfer of mRNAs and microRNAs is a novel mechanism of genetic exchange between cells. Nat. Cell Biol. 2007, 9, 654–659. [Google Scholar] [CrossRef] [Scilit] [PubMed]
- Mitchell, P.S.; Parkin, R.K.; Kroh, E.M.; Fritz, B.R.; Wyman, S.K.; Pogosova-Agadjanyan, E.L.; Peterson, A.; Noteboom, J.; O’Briant, K.C.; Allen, A.; et al. Circulating microRNAs as stable blood-based markers for cancer detection. Proc. Natl. Acad. Sci. USA 2008, 105, 10513–10518. [Google Scholar] [CrossRef] [Scilit] [PubMed]
- Mendonca, A.; Thandapani, P.; Nagarajan, P.S.; Venkatesh, S.; Sundaresan, S. Role of microRNAs in regulation of insulin secretion and insulin signaling involved in type 2 diabetes mellitus. J. Biosci. 2022, 47, 36. [Google Scholar] [CrossRef] [Scilit]
- Kaur, P.; Kotru, S.; Singh, S.; Behera, B.S.; Munshi, A. Role of miRNAs in the pathogenesis of T2DM, insulin secretion, insulin resistance, and β cell dysfunction: The story so far. J. Physiol. Biochem. 2020, 76, 485–502. [Google Scholar] [CrossRef] [Scilit] [PubMed]
- Grieco, G.E.; Besharat, Z.M.; Licata, G.; Fignani, D.; Brusco, N.; Nigi, L.; Formichi, C.; Po, A.; Sabato, C.; Dardano, A.; et al. Circulating microRNAs as clinically useful biomarkers for Type 2 Diabetes Mellitus: miRNomics from bench to bedside. Transl. Res. 2022, 247, 137–157. [Google Scholar] [CrossRef] [Scilit] [PubMed]
- Dokuru, D.R.; Horwitz, T.B.; Freis, S.M.; Stallings, M.C.; Ehringer, M.A. South Asia: The Missing Diverse in Diversity. Behav. Genet. 2024, 54, 51–62. [Google Scholar] [CrossRef] [Scilit] [PubMed]
- Rawlings-Goss, R.A.; Campbell, M.C.; Tishkoff, S.A. Global population-specific variation in miRNA associated with cancer risk and clinical biomarkers. BMC Med. Genom. 2014, 7, 53. [Google Scholar] [CrossRef] [Scilit] [PubMed]
- Huan, T.; Rong, J.; Liu, C.; Zhang, X.; Tanriverdi, K.; Joehanes, R.; Chen, B.H.; Murabito, J.M.; Yao, C.; Courchesne, P.; et al. Genome-wide identification of microRNA expression quantitative trait loci. Nat. Commun. 2015, 6, 6601. [Google Scholar] [CrossRef] [Scilit] [PubMed]
- Lappalainen, T.; Sammeth, M.; Friedländer, M.R.; ‘t Hoen, P.A.C.; Monlong, J.; Rivas, M.A.; Gonzàlez-Porta, M.; Kurbatova, N.; Griebel, T.; Ferreira, P.G.; et al. Transcriptome and genome sequencing uncovers functional variation in humans. Nature 2013, 501, 506–511. [Google Scholar] [CrossRef] [Scilit] [PubMed]
- Page, M.J.; McKenzie, J.E.; Bossuyt, P.M.; Boutron, I.; Hoffmann, T.C.; Mulrow, C.D.; Shamseer, L.; Tetzlaff, J.M.; Akl, E.A.; Brennan, S.E.; et al. The PRISMA 2020 statement: An updated guideline for reporting systematic reviews. BMJ 2021, 372, n71. [Google Scholar] [CrossRef] [Scilit] [PubMed]
- Campbell, M.; McKenzie, J.E.; Sowden, A.; Katikireddi, S.V.; Brennan, S.E.; Ellis, S.; Hartmann-Boyce, J.; Ryan, R.; Shepperd, S.; Thomas, J.; et al. Synthesis without meta-analysis (SWiM) in systematic reviews: Reporting guideline. BMJ 2020, 368, l6890. [Google Scholar] [CrossRef] [Scilit] [PubMed]
- Covidence Systematic Review Software. Available online: https://www.covidence.org (accessed on 12 June 2026).
- Whiting, P.F.; Rutjes, A.W.S.; Westwood, M.E.; Mallett, S.; Deeks, J.J.; Reitsma, J.B.; Leeflang, M.M.G.; Sterne, J.A.C.; Bossuyt, P.M.M.; QUADAS-2 Group. QUADAS-2: A revised tool for the quality assessment of diagnostic accuracy studies. Ann. Intern. Med. 2011, 155, 529–536. [Google Scholar] [CrossRef] [Scilit] [PubMed]
- Sterne, J.A.C.; Hernán, M.A.; Reeves, B.C.; Savović, J.; Berkman, N.D.; Viswanathan, M.; Henry, D.; Altman, D.G.; Ansari, M.T.; Boutron, I.; et al. ROBINS-I: A tool for assessing risk of bias in non-randomised studies of interventions. BMJ 2016, 355, i4919. [Google Scholar] [CrossRef] [Scilit] [PubMed]
- Marabita, F.; de Candia, P.; Torri, A.; Tegnér, J.; Abrignani, S.; Rossi, R.L. Normalization of circulating microRNA expression data obtained by quantitative real-time RT-PCR. Brief. Bioinform. 2016, 17, 204–212. [Google Scholar] [CrossRef] [Scilit] [PubMed]
- Schober, P.; Boer, C.; Schwarte, L.A. Correlation coefficients: Appropriate use and interpretation. Anesth. Analg. 2018, 126, 1763–1768. [Google Scholar] [CrossRef] [Scilit] [PubMed]
- Fisher, R.A. On the “probable error” of a coefficient of correlation deduced from a small sample. Metron 1921, 1, 3–32. [Google Scholar]
- Sangalli, E.; Tagliabue, E.; La Sala, L.; Prattichizzo, F.; Uccellatore, A.; Spada, D.; Lorino, F.; de Candia, P.; Lupini, S.; Cantone, L.; et al. Circulating microRNA-15a associates with retinal damage in patients with early-stage type 2 diabetes. Front. Endocrinol. 2020, 11, 254. [Google Scholar] [CrossRef] [Scilit] [PubMed]
- Jaeger, A.; Zollinger, L.; Saely, C.H.; Muendlein, A.; Evangelakos, I.; Nasias, D.; Charizopoulou, N.; Schofield, J.D.; Othman, A.; Soran, H.; et al. Circulating microRNAs-192 and -194 are associated with the presence and incidence of diabetes mellitus. Sci. Rep. 2018, 8, 14274. [Google Scholar] [CrossRef] [Scilit] [PubMed]
- Willeit, P.; Skroblin, P.; Moschen, A.R.; Yin, X.; Kaudewitz, D.; Zampetaki, A.; Barwari, T.; Whitehead, M.; Ramírez, C.M.; Goedeke, L.; et al. Circulating microRNA-122 is associated with the risk of new-onset metabolic syndrome and type 2 diabetes. Diabetes 2017, 66, 347–357. [Google Scholar] [CrossRef] [Scilit] [PubMed]
- Wang, X.; Sundquist, J.; Zöller, B.; Memon, A.A.; Palmér, K.; Sundquist, K.; Bennet, L. Determination of 14 circulating microRNAs in Swedes and Iraqis with and without diabetes mellitus type 2. PLoS ONE 2014, 9, e86792. [Google Scholar] [CrossRef] [Scilit] [PubMed]
- Serik, S.A.; Mavrycheva, N.; Riabukha, V.; Malko, V.; Bondar, T.; Chenchik, T. The association of circulating microRNA-126 with inflammation and insulin resistance in patients with coronary artery disease with type 2 diabetes mellitus. Atherosclerosis 2023, 379, S139. [Google Scholar] [CrossRef] [Scilit]
- Šimonienė, D.; Stukas, D.; Daukša, A.; Veličkienė, D. Clinical role of serum miR-107 in type 2 diabetes and related risk factors. Biomolecules 2022, 12, 558. [Google Scholar] [CrossRef] [Scilit] [PubMed]
- Serik, S.A.; Serdobinska-Kanivets, E.; Kurinna, O.; Bondar, T. Circulating microRNA-27a, -126, -146a, -221 levels in coronary artery disease and type 2 diabetes mellitus. Metabolism 2021, 116, 154544. [Google Scholar] [CrossRef] [Scilit]
- Serik, S.A.; Serdobinska-Kanivets, E.M.; Kurinna, O.H.; Tkachenko, O.V. Circulating microRNA-27a, -221 in coronary artery disease and type 2 diabetes mellitus. Am. Heart J. 2020, 229, 173–174. [Google Scholar] [CrossRef] [Scilit]
- Serik, S.A.; Mavrycheva, N.R.; Bondar, T.M. Circulating microRNA-126 in patients with ischemic heart disease with type 2 diabetes mellitus and its relationship with glucometabolic disorders. Zaporozhye Med. J. 2022, 24, 501–508. [Google Scholar] [CrossRef] [Scilit]
- Prabu, P.; Poongothai, S.; Shanthirani, C.S.; Anjana, R.M.; Mohan, V.; Balasubramanyam, M. Altered circulatory levels of miR-128, BDNF, cortisol and shortened telomeres in patients with type 2 diabetes and depression. Acta Diabetol. 2020, 57, 799–807. [Google Scholar] [CrossRef] [Scilit] [PubMed]
- Prabu, P.; Rome, S.; Sathishkumar, C.; Aravind, S.; Mahalingam, B.; Shanthirani, C.S.; Gastebois, C.; Villard, A.; Mohan, V.; Balasubramanyam, M. Circulating miRNAs of “Asian Indian phenotype” identified in subjects with impaired glucose tolerance and patients with type 2 diabetes. PLoS ONE 2015, 10, e0128372. [Google Scholar] [CrossRef] [Scilit] [PubMed]
- Purohit, P.; Roy, D.; Modi, A.; Choudhary, R.; Shukla, R.P.; Sharma, P. Circulating and visceral adipose tissue miR-330-3p is associated with insulin resistance in type II diabetes mellitus. Metabolism 2021, 116, 154552. [Google Scholar] [CrossRef] [Scilit]
- Sucharita, S.; Ashwini, V.; Prabhu, J.S.; Avadhany, S.T.; Ayyar, V.; Bantwal, G. The role of circulating microRNA in the regulation of beta cell function and insulin resistance among Indians with type 2 diabetes. Indian J. Endocrinol. Metab. 2019, 22, 770–773. [Google Scholar] [CrossRef] [Scilit] [PubMed]
- Pokharel, D.R.; Maskey, A.; Kafle, R.; Batajoo, A.; Dahal, P.; Raut, R.; Adhikari, S.; Manandhar, B.; Das Manandhar, K. Evaluation of circulating plasma miR-9, miR-29a, miR-192, and miR-375 as potential biomarkers for predicting prediabetes and type 2 diabetes in Nepali adult population. Noncoding RNA Res. 2024, 9, 1324–1332. [Google Scholar] [CrossRef] [Scilit] [PubMed]
- Jopling, C. Liver-specific microRNA-122: Biogenesis and function. RNA Biol. 2012, 9, 137–142. [Google Scholar] [CrossRef] [Scilit] [PubMed]
- Pirola, C.J.; Fernández Gianotti, T.; Castaño, G.O.; Mallardi, P.; San Martino, J.; Mora Gonzalez Lopez Leiva, M.; Flichman, D.; Mirshahi, F.; Sanyal, A.J.; Sookoian, S. Circulating microRNA signature in non-alcoholic fatty liver disease: From serum non-coding RNAs to liver histology and disease pathogenesis. Gut 2015, 64, 800–812. [Google Scholar] [CrossRef] [Scilit] [PubMed]
- Pandey, A.K.; Verma, G.; Vig, S.; Srivastava, S.; Srivastava, A.K.; Datta, M. miR-29a levels are elevated in the db/db mice liver and its overexpression leads to attenuation of insulin action on PEPCK gene expression in HepG2 cells. Mol. Cell. Endocrinol. 2011, 332, 125–133. [Google Scholar] [CrossRef] [Scilit] [PubMed]
- Huang, W.; Feng, Y.; Liang, J.; Yu, H.; Wang, C.; Wang, B.; Wang, M.; Jiang, L.; Meng, W.; Cai, W.; et al. Loss of microRNA-128 promotes cardiomyocyte proliferation and heart regeneration. Nat. Commun. 2018, 9, 700. [Google Scholar] [CrossRef] [Scilit] [PubMed]
- Zhao, X.; Mohan, R.; Özcan, S.; Tang, X. MicroRNA-30d induces insulin transcription factor MafA and insulin production by targeting mitogen-activated protein 4 kinase 4 (MAP4K4) in pancreatic β-cells. J. Biol. Chem. 2012, 287, 31155–31164. [Google Scholar] [CrossRef] [Scilit] [PubMed]
- Kriegel, A.J.; Liu, Y.; Fang, Y.; Ding, X.; Liang, M. The miR-29 family: Genomics, cell biology, and relevance to renal and cardiovascular injury. Physiol. Genom. 2012, 44, 237–244. [Google Scholar] [CrossRef] [Scilit] [PubMed]
- Fish, J.E.; Santoro, M.M.; Morton, S.U.; Yu, S.; Yeh, R.F.; Wythe, J.D.; Ivey, K.N.; Bruneau, B.G.; Stainier, D.Y.R.; Srivastava, D. miR-126 regulates angiogenic signaling and vascular integrity. Dev. Cell 2008, 15, 272–284. [Google Scholar] [CrossRef] [Scilit] [PubMed]
- Ruscio, J. Constructing confidence intervals for Spearman’s rank correlation with ordinal data: A simulation study comparing analytic and bootstrap methods. J. Mod. Appl. Stat. Methods 2008, 7, 416–434. [Google Scholar] [CrossRef] [Scilit]
- Guyatt, G.H.; Oxman, A.D.; Vist, G.E.; Kunz, R.; Falck-Ytter, Y.; Alonso-Coello, P.; Schünemann, H.J.; GRADE Working Group. GRADE: An emerging consensus on rating quality of evidence and strength of recommendations. BMJ 2008, 336, 924–926. [Google Scholar] [CrossRef] [Scilit] [PubMed]

Disclaimer/Publisher’s Note: The statements, opinions and data contained in all publications are solely those of the individual author(s) and contributor(s) and not of MDPI and/or the editor(s). MDPI and/or the editor(s) disclaim responsibility for any injury to people or property resulting from any ideas, methods, instructions or products referred to in the content. |
© 2026 by the authors. Licensee MDPI, Basel, Switzerland. This article is an open access article distributed under the terms and conditions of the Creative Commons Attribution (CC BY) license.