


Abstract
In prokaryotes, translation initiation orchestrates protein synthesis through a network of dynamic interactions among the ribosome, mRNA, initiator tRNAfMet, and initiation factors (IFs). Traditional approaches that rely on radioactive labeling or surface immobilization are hindered by inherent safety risks and methodological constraints. We present a fluorescence-based analytical platform that integrates microscale thermophoresis (MST) as a unified, multiparametric toolkit for comprehensive interrogation of bacterial translation initiation at the molecular level. By systematically applying MST to a panel of fluorescently labeled components—initiator tRNAfMet, mRNAs, and initiation factors—we quantify assembly pathways and equilibria as initiation progresses from simple bimolecular interactions to higher-order, multicomponent complexes. To broaden the fluorescence toolbox for ribosomal studies, we developed a robust BODIPY-labeling protocol for 70S ribosomes and confirmed preservation of structural integrity and function by nano differential scanning fluorimetry, stopped-flow kinetic assays, and peptide-synthesis activity tests. Our microscale fluorescent system facilitates probing initiation at a variety of steps, since the role of magnesium ions and initiation factors upon 30S initiation complex formation. The same platform can be applied to investigate the effects of different compounds on translation initiation, as demonstrated for a number of antibiotics, aptamers, and antimicrobial peptides. Using this approach, we determined the antibiotic streptomycin dissociation constant for both 30S and 70S ribosomes, which proved identical at 0.3 ± 0.1 μM, and demonstrated the effect of the antimicrobial peptide rumicidin-1 on translation initiation. Offering a cost-effective and high-sensitivity alternative to conventional methods, this approach advances mechanistic understanding of prokaryotic translation and provides a versatile framework for the discovery of novel protein synthesis inhibitors.
1. Introduction
Messenger RNA (mRNA) translation constitutes a fundamental biological process that decodes genetic information into functional proteins. While the overall mechanism is conserved among archaea, bacteria, and eukaryotes, the initiation phase exhibits substantial divergence across these domains [1]. In bacteria, the rate-limiting step of translation initiation entails coordinated interactions among the 30S ribosomal subunit, mRNA, initiator fMet-tRNAfMet (tRNAfMet), and the three initiation factors IF1, IF2, and IF3 [2,3,4] (Figure 1). Within the canonical pathway, the stable 30S initiation complex (IC) forms through codon–anticodon pairing between mRNA and tRNAfMet, followed by 50S subunit joining to yield the mature 70S IC competent for polypeptide synthesis [4,5]. This highly coordinated sequence of events governs both the rate and fidelity of translation. The initiation machinery integrates a network of intra- and intermolecular interactions that shape the cellular proteome [4,6]. Owing to its central role and molecular complexity, the bacterial initiation pathway represents a principal target for diverse translation inhibitors [2,7,8].
Figure 1.
Schematic representation of initiation and elongation of bacterial translation cycles. Initiation starts on the binding of the initiator fMet-tRNAfMet and mRNA to the small (30S) ribosomal subunit in the presence of initiation factors (IF1, IF2, IF3), forming a transient 30S pre-initiation complex (30S pre-IC). Upon correct codon–anticodon pairing, the equilibrium shifts toward the assembly of a stable 30S initiation complex (30S IC). Subsequent joining of the large (50S) subunit and release of initiation factors yield the mature 70S initiation complex (70S IC), competent for polypeptide synthesis. The elongation stage, which follows initiation, consists of decoding, peptide bond formation, and translocation steps. The aminoacyl-tRNA (aa-tRNA), as part of a ternary complex with the elongation factor EF-Tu and GTP, is recruited to the ribosomal A site. Following successful codon–anticodon recognition between the aa-tRNA and mRNA, GTP hydrolysis, and dissociation of EF-Tu from the ribosome, peptide bond formation occurs in the peptidyl transferase center of the 50S ribosomal subunit. Following the subsequent translocation of mRNA and tRNA relative to the 30S subunit, catalyzed by the GTPase elongation factor EF-G, the next mRNA codon becomes exposed in the ribosomal A site, ready to accept the cognate aminoacyl-tRNA. The deacylated tRNA leaves the ribosome through the E site. The process ends in the termination stage, where termination factors RF1 or RF2 recognize the stop codon on the mRNA and catalyze the release of the polypeptide chain from the P-site tRNA.
Differences in order, kinetics, and affinities of ligands’ interaction with the ribosome reveal the elaborate structure of the bacterial translation initiation process [5,9,10,11,12]. Conventional in vitro approaches rely on radioactively labeled ligands. It requires stringent safety procedures and entails substantial disposal costs. Fluorescence-based techniques provide a safer and more versatile alternative for investigating the biophysical and biochemical properties of translation [13,14,15,16]. Here, we go beyond simply applying fluorescence methods: we developed and integrated microscale thermophoresis (MST) into a unified, multiparametric platform that enables systematic, low-consumption measurement of binding equilibria, kinetics, and cooperative assembly across multiple initiation components and steps. This comprehensive MST toolkit not only removes the need for radioactivity but also permits parallel, quantitative interrogation of how magnesium concentration, individual initiation factors, and mRNA sequence influence 30S and 70S complex formation. One of the earliest applications of MST in translation research examined the stringent response in Escherichia coli (E. coli) by reconstituting the reaction with all essential components, including ribosomes, mRNA, initiator tRNAfMet, and initiation factors [15].
Titration experiments using MST enable the determination of binding affinities across a wide range of dissociation constants (10−12–10−3 M, KD) and the quantification of inhibition (half-maximal inhibitory concentration, IC50) or activation (half-maximal effective concentration, EC50) with minimal sample volumes (<5 µL) (Figure 2a). Fluorescence from ligands—through intrinsic tryptophan residues or covalently attached fluorophores—allows monitoring molecular movement within glass capillaries. An infrared (IR) laser (1480 nm) locally heats approximately 2 nL of sample, generating a temperature gradient of 1–6 K (Figure 2b). The initial fluorescence measurement serves as a quality control step for detecting aggregation or pipetting inconsistencies. Upon IR laser activation, molecules undergo directed thermal diffusion until an equilibrium is reached; after the laser is switched off, back-diffusion occurs (Figure 2c). Thermophoretic mobility variations reflect binding-induced changes in molecular conformation, charge, size, or hydration shell. Measurements are performed without additional sample immobilization, thereby preserving near-native experimental conditions and highlighting the method’s equilibrium nature [17,18,19]. The thermophoretic curve reflects fluorescence changes as molecules accumulate or spread away from the observation point during heating cycles (Figure 2d).
Figure 2.
Microscale thermophoresis (MST) technology. (a) Schematic representation of an MST assay used to analyze bimolecular and multicomponent interactions. In a typical titration experiment, a fluorescently labeled reporter molecule (the yellow star symbolizes the fluorophore) is kept at a constant concentration, while the binding partner (ligand) is serially titrated. (b) Reaction samples are loaded into glass capillaries for analysis. (c) The absence of sample aggregation and pipetting errors is verified by monitoring the initial fluorescence signal. Each measurement follows this sequence: recording the initial fluorescence signal (“initial state”), activation of the infrared (IR) laser to induce thermal diffusion (“thermophoresis”) until equilibrium (“steady state”) is reached, and detection of the reverse diffusion process after the IR laser is switched off (“back diffusion”). (d) Representative MST time traces illustrating ligand binding. The assay monitors one fluorescently labeled ligand at a constant concentration while titrating the unlabeled ligand. Bound (red), partially bound (light red, orange, light blue), and unbound (blue) molecular states display distinct thermophoretic behaviors upon IR heating. The MST response is expressed as the normalized fluorescence ratio during and before heating (Fhot/Fcold). The MST signal correlates with the fraction of bound molecules, enabling the determination of ligand affinities and calculation of dissociation constants (KD), half-maximal effective concentrations (EC50), and half-maximal inhibitory concentrations (IC50).
We provide detailed quantitative insights into the fundamental steps of bacterial translation initiation using a diverse set of fluorescent reporter ligands. This microscale thermophoresis approach delivers precise binding affinity measurements while offering a cost-effective, accessible platform for investigating core biochemical principles of the process. Notably, the versatility of this approach extends to other complex molecular assemblies, particularly those involving components that are challenging to produce or obtainable only in limited quantities.
2. Results
2.1. A Novel Method for BODIPY Labeling of Ribosomes as Reporters
Visualizing ligand interactions on the ribosome is crucial for understanding translation; however, modifications such as fluorescent labeling must be carefully controlled to avoid disrupting molecule function. Methods for labeling ribosomes include modification of purified proteins or RNA followed by reconstitution of subunits [20,21], the use of reporter oligonucleotides for structural studies [22,23], the use of site-directed mutagenesis to attach dyes via cysteines [24,25], or labeling directly at lysine amino acid residues [3]. We introduce a fast and simple method for fluorescently labeling lysine residues in E. coli 70S ribosomes with BODIPY (Bpy) dye. Considering the large number of lysine residues in ribosome proteins, we optimized the necessary dye excess to preserve ribosome functional activity while maximizing the sensitivity of fluorescence signal changes during analysis. Importantly, to obtain Bpy-subunits, it is essential to label the entire 70S ribosomes prior to subunit splitting, since labeling the 30S and 50S subunits directly alters the intersubunit surface (Figure 3a), potentially hampering 70S formation. We assessed the labeling efficiency using SDS-PAGE (Figure S1a).
Figure 3.
BODIPY fluorescent labeling of ribosomes. (a) Labeling scheme. After dissociation of BODIPY-70S ribosomes, the resulting BODIPY-labeled 30S and BODIPY-50S subunits were separated using a 10–40% sucrose gradient. (b) Light-scattering analysis of BODIPY-70S ribosome dissociation kinetics in the presence of initiation factor IF3, and (c) re-association of BODIPY-30S and BODIPY-50S subunits compared with native ribosomes. (d) Comparison of dipeptide synthesis efficiency using native and BODIPY-labeled 70S, 30S, and 50S ribosomes. (e) Melting curves of native and fluorescently labeled 30S, 50S, and 70S ribosomes measured by nanodifferential scanning fluorimetry (nanoDSF). The left axis shows the fluorescence ratio F350 nm/F330 nm, which reports on the intrinsic aromatic amino acid fluorescence change during thermal unfolding, with the largest contribution coming from tryptophans. The right axis shows the first derivative of this ratio with respect to temperature (∂F/∂T), which highlights the inflection point of the melting transition and is used to determine the melting temperature (Tm). The melting temperatures (Tm) were: 30S—53.6 °C, 69.2 °C; Bpy-30S—52.1 °C, 71.8 °C; 50S—70.1 °C; Bpy-50S—67.9 °C; 70S—51.3, 69.5; Bpy-70S—56.4 °C, 69.5 °C.
2.1.1. Functional Activity of BODIPY-Ribosomes
The association of 30S and 50S subunits into the 70S ribosome, as well as the reverse process of dissociation into subunits, is critically important for maintaining a pool of functional ribosomes by regulating the balance between monomers and dimers [26,27]. We measured the kinetics of both reactions by the stopped-flow technique, monitoring the light-scattering signal change. The association rates of native and fluorescently labeled 30S and 50S subunits were very close, yielding values of 1.01 ± 0.02 s−1 and 1.33 ± 0.04 s−1, respectively (Figure 3c). The kinetics of 70S dissociation into subunits were measured in the presence of IF3 to exclude the re-association step [28,29,30,31,32]. The dissociation rates of native ((5.6 ± 0.1) × 10−3 s−1) and Bpy-70S ((6.2 ± 0.1) × 10−3 s−1) ribosomes were also virtually indistinguishable (Figure 3b). Importantly, the amplitudes of all the corresponding light-scattering signals were essentially identical, highlighting the equal amount of the functional ribosomes. Thus, fluorescent labeling of ribosomes had no impact on the structural integrity of the intersubunit interface and the dynamics of the ribosome assembly—critical hallmarks of translation efficiency.
Although the fluorescent dye uniformly localizes to ribosomal subunit surfaces without making significant contributions to the functionally active centers, we analyzed signal variations under translation initiation kinetics conditions. We monitored the formation of the 30S IC and 70S IC by recording changes in the fluorescence of labeled ribosomes (Figure S1b). As expected, assembly of the 30S initiation complex elicited no noticeable fluorescence signal shift, as ligand binding occurs in the intersubunit interface, the unlabeled region. Use of Bpy-70S or Bpy-30S and Bpy-50S ribosomes resulted in a marked increase in the fluorescence signal upon 70S initiation complex formation, with observed rates of 0.075 ± 0.004 min−1 and 0.049 ± 0.006 min−1 (Figure S1b), respectively. To confirm the functionality of the fluorescent initiation complexes, we tested their ability to participate in the peptidyl transferase reaction (Figure 3d). The use of Bpy-labeled 70S ribosomes, as well as isolated Bpy-30S and Bpy-50S subunits, supported efficient peptide bond formation comparable to that of native ribosomes.
2.1.2. Probing Ribosomal Stability with Nano Differential Scanning Fluorimetry
Differential scanning calorimetry (DSC) and nano differential scanning fluorimetry (nanoDSF) are classical approaches for assessing the conformational stability of protein preparations [33,34,35,36]. We applied nanoDSF technology to monitor the preservation of conformational stability of native and fluorescently labeled 70S ribosomes, as well as in their 30S and 50S subunits (Figure 3e). Interestingly, the 30S subunit and 70S ribosome showed lower thermal stability (melting temperatures—Tm—53.6 °C and 51.3 °C, respectively) than the 50S subunit, which remained stable up to 70.1 °C under the conditions of the experiment. The higher stability of the large ribosomal subunit is most likely based on the high content of rigidly ordered and densely packed rRNA, forming, among other things, the evolutionarily most ancient parts of the ribosome, such as the peptidyl transferase center and the nascent peptide exit tunnel. The melting profiles of fluorescently labeled ribosomes were indistinguishable from those of their native counterparts (Figure 3e), confirming that labeling did not disrupt ribosomal stability. To more thoroughly examine the impact of the performed modification on ribosome conformational stability, we conducted nanoDSF analysis under varying ionic conditions, which play a decisive role in ribosomal structural and functional organization [37,38,39,40,41,42,43]. Among the major contributors, magnesium (Mg2+) and potassium (K+) ions are particularly essential to maintain the stability and translational competence of the 70S ribosome. Mg2+ primarily governs the structural integrity of the ribosome, whereas K+ ions influence both stability and translational dynamics [42,44,45,46,47,48,49,50,51] (Figure S1c). Melting curves of native and BODIPY-labeled 70S ribosomes, as well as 30S and 50S ribosomal subunits, remained identical across varying ionic conditions. Only the 50S subunit exhibited reduced sensitivity to Mg2+ concentration changes, which did not affect its activity in our conducted control analyses. A more detailed analysis of conformational stability dependence for native and modified ribosomes across varying ionic conditions is available in the Supplementary Materials.
2.2. Bimolecular Ligand Interactions in Translation Initiation Probed by MST
Assembly of the bacterial translation initiation complex proceeds through multiple sequential stages, requiring the presence of all ligands for optimal efficiency. Individual components, including IFs, tRNAfMet, and mRNA, form bimolecular complexes with the 30S ribosomal subunit with varying affinities [4,11,52,53,54]. We initiated MST studies of translation initiation through step-wise analysis. Initially, we examined bimolecular interaction affinities by determining dissociation constant (KD) values of ligands. We quantified the binding affinities of the IF1, IF2, IF3, mRNA, and tRNAfMet to the 30S subunit, employing each as a fluorescent reporter in MST assays.
IF1, IF2, and IF3 were site-specifically fluorescently labeled with Cy5 via maleimide chemistry, targeting solvent-accessible cysteine residues to yield IF1Cy5, IF2Cy5, and IF3Cy5 (Figure S2a,b). The measured dissociation constants were 214 ± 98 nM for IF1, 73 ± 32 nM for IF2, and 9 ± 8 nM for IF3 in excellent agreement with values obtained previously by pre-steady-state kinetics (Figure 4a,b and Figure S2c) [10].
Figure 4.
Determination of dissociation constants (KD) using different fluorescently labeled ligands as reporters. (a) Binding curves of IF1Cy5, IF2Cy5, and IF3Cy5 to the 30S ribosomal subunit. (b) The KD values of IF1Cy5•30S (magenta), IF2Cy5•30S (green), and IF3Cy5•30S (blue) complexes. (c) Binding curves of mRNA-Flu or Bpy-tRNAfMet to the 30S or 70S ribosomes. (d) The KD values of mRNA-Flu•30S (magenta), mRNA-Flu•70S (violet), Bpy-tRNAfMet•30S (light blue), Bpy-tRNAfMet•70S (blue) complexes. Error bars represent standard deviations from three independent measurements. An upward arrow indicates lower bounds for KD when the curve did not reach saturation (actual KD is ≥the indicated value).
Although mRNA and tRNAfMet can bind the 30S subunit independently, the 30S•mRNA complex exhibits substantially greater stability than the 30S•tRNAfMet complex [55,56,57,58]. 30S•mRNA association is mediated by complementary base pairing between the anti-Shine–Dalgarno (anti-SD) sequence in 16S rRNA and the Shine–Dalgarno (SD) sequence in mRNA, positioning the mRNA within a dedicated channel on the subunit surface [4]. In contrast, formation of the 30S•tRNAfMet bimolecular complex is less stable due to the requirement for the presence of IF2, which is responsible for recruiting tRNAfMet to the P site of the ribosome [11,59].
We quantified the bimolecular interactions of mRNA and tRNAfMet with 30S and 70S ribosomes using MST with fluorescein-labeled mRNA (mRNA-Flu) or BODIPY-labeled tRNAfMet (Bpy-tRNAfMet) as the reporters (Figure 4c,d and Figure S2d). mRNA-Flu exhibited high-affinity binding to 30S and 70S, with dissociation constants (KD) of 115 ± 14 nM and 45 ± 4 nM respectively. Bpy-tRNAfMet bound efficiently to 70S ribosomes (KD = 1.0 ± 0.1 μM), but showed markedly weaker affinity for 30S alone (the KD value could not be determined).
2.3. MST Measurements of Initiation Complex Formation Efficiency
Bacterial translation initiation represents a multifaceted process that can proceed via distinct pathways involving either 30S or 70S ribosomes [4,52,60,61,62,63]. In the canonical pathway, formation of the 30S initiation complex is orchestrated by synergistic interactions of IF1, IF2, and IF3, which modulate mutual binding affinities to optimize tRNAfMet recruitment to 30S [4,10]. Codon–anticodon recognition stabilizes the 30S IC, enabling subsequent 50S subunit joining [4,64], IF dissociation, and progression to the elongation-competent 70S IC [4,9,10,65,66,67,68,69,70,71]. Non-canonical 70S initiation complex formation pathways include leaderless mRNA initiation [62,63], translation re-initiation [72,73], polysome-associated initiation [74,75,76,77], and 70S scanning [61].
We progressively expanded the system toward a multicomponent complex using Bpy-tRNAfMet as the reporter molecule. Elevated concentrations of Mg2+ stabilize the tertiary structure of rRNA, potentially facilitating binding of mRNA and tRNAfMet to the 30S subunit [42,55,58,78]. Thus, we examined initiator tRNAfMet binding to the 30S•mRNA bimolecular complex (Figure 4c) across a range of magnesium ion concentrations (Figure S3a). We observed robust ternary 30S•mRNA•Bpy-tRNAfMet complex formation under increasing Mg2+ conditions (3.1–100 mM) (Figure S3a). Subsequent system expansion involved adding individual initiation factors to dissect their roles, with each titrated against the 30S•mRNA•Bpy-tRNAfMet ternary complex to assess contributions to tRNA binding efficiency. Considering the role of magnesium ions in Bpy-tRNAfMet binding to the ribosome (Figure S3a), we conducted experiments at 7 mM or 20 mM Mg2+ (Figure S3b). Thermophoretic shifts occurred only with IF2, reflecting its role in recruiting tRNAfMet by adopting an extended conformation and enhancing tRNA association [59,77,78,79]. Additionally, we demonstrated the versatility of the system by analyzing 30S IC formation efficiency as a function of IF3 in the presence of mRNA lacking a canonical start codon and regulatory elements (polyU mRNA) (Figure S3c). 30S ICs were practically not formed in the presence of polyU mRNA, potentially reflecting both the absence of productive interaction and the proofreading function of IF3 during codon–anticodon checking.
We next investigated 30S IC and 70S IC formation as a function of mRNA, using initiator Bpy-tRNAfMet or Bpy-70S as reporter molecules or performing label-free measurements, while sequentially adding initiation factors to the system (Figure 5). mRNA titration revealed maximal efficiency of 30S IC formation when all three IFs were present (Figure 5a). The observed ≈2-fold drop in mRNA binding affinity and reduced thermophoresis in the absence of IF3 (or IF3 + IF1) support a stabilizing role for IF3 CTD–mRNA contacts in maintaining the SD:anti-SD placement and promoting accurate start-codon positioning before tRNA arrival [59]. The ≈3-fold drop in affinity upon IF1 removal, without a substantial change in signal amplitude, is consistent with IF1 providing key anchoring points for IF2 and IF3 that enhance their activity [59]. Thus, IF1 appears to reinforce factor-mediated mRNA engagement and fidelity without markedly altering the predominant conformational state detected by thermophoresis (Figure 5a,d). These findings demonstrate the synergistic contributions of IF1, IF2, and IF3 to 30S IC formation.
Figure 5.
MST analysis of stepwise translation initiation complex assembly. 30S IC and 70S IC formation as a function of mRNA concentration, depending on the presence of initiation factors, using Bpy-tRNAfMet (a,b) or (c) Bpy-30S/Bpy-70S as reporter ligands or label-free conditions. EC50 values for 30S IC and 70S IC formation using Bpy-tRNAfMet (d), Bpy-30S/Bpy-70S ribosomes, or label-free conditions (e). Error bars indicate standard deviations from triplicate measurements. The upward arrow indicates lower bounds for KD when the curve did not reach saturation (actual KD is ≥the indicated value).
Binding of Bpy-tRNAfMet to the 70S ribosome is characterized by a decrease in fluorescence signal with minimal change in signal amplitude (Figure 4c), corresponding to a KD of 1 ± 0.1 μM (Figure 4d). Addition of mRNA to the 70S•Bpy-tRNAfMet bimolecular complex reversed the thermophoretic direction and increased signal amplitude (Figure 5b,d), yielding a ternary 70S•mRNA•tRNAfMet complex with an affinity of approximately 2.7 ± 0.3 μM. We observe formation of the ternary complex at excess mRNA concentrations (up to 40 μM), while Bpy-tRNAfMet is present at sub-stoichiometric amounts (0.5 μM relative to 1 μM ribosomes), which may suggest a scaffolding or organizing role for mRNA in driving factor-independent 70S IC assembly. The high affinity of 70S for mRNA alone (KD of 45 ± 4 nM) (Figure 4c,d) compared to tRNA suggests that mRNA binding is the primary event. Notably, in our experiments, we did not pre-dissociate 70S ribosomes into subunits before the assay; nevertheless, we observed efficient mRNA binding and ternary complex formation under these conditions, which may represent an expansion of our understanding of 70S-scanning initiation [61]. The opposite signal direction indicates that the 70S•mRNA•tRNAfMet complex has altered thermophoretic properties (size, charge, or hydration shell) compared to the binary complexes, confirming genuine ternary complex formation rather than competitive binding. As observed for 70S IC, absence of any IFs decreased mRNA affinity relative to the complete system; exclusion of IF3 alone caused a >2-fold reduced affinity, while combined omission of IF3 and IF1 caused a >50-fold decreased affinity, accompanied by reduced thermophoretic amplitude. The absence of IF1 had minimal impact on 70S IC assembly efficiency. We further analyzed 70S IC formation efficiency as a function of mRNA concentration using Bpy-70S ribosomes, in the presence or absence of initiation factors (Figure S3d). The Bpy-70S•mRNA•tRNAfMet ternary complex formed with comparable efficiency (3.1 ± 0.2 μM; Figure S3d) to that measured using Bpy-tRNAfMet (2.7 ± 0.3 μM; Figure 5d). In the absence of IF1/IF3, mRNA binding to Bpy-70S•IF2•tRNAfMet during 70S IC formation occurred with higher affinity (4.8 ± 0.9 μM; Figure S3d) than for complexes using Bpy-tRNAfMet as the reporter molecule (Figure 5d).
We further used three complementary MST strategies to monitor 30S IC and 70S IC formation, employing labeled ribosomes or label-free configurations (Figure 5c,e). Ligand affinities during IC assembly were comparable across all approaches and aligned with values obtained using Bpy-tRNAfMet as reporter (Figure 5d,e). The directionality of thermophoretic signals was identical for Bpy-tRNAfMet and Bpy-30S during 30S IC formation (Figure 5a,c). For 70S IC assembly, Bpy-70S or unlabeled ligands produced descending MST traces with increasing mRNA concentration—opposite to the Bpy-tRNAfMet signal (Figure 5c)—while IFs absence experiments (lacking IF1, IF3, or all IFs) with Bpy-70S yielded ascending traces as to Bpy-tRNAfMet (Figure S3d). All the configurations delivered consistent EC50 values (0.3–1 μM).
2.4. MST Detection of Translation Inhibitors
Inhibitors of diverse chemical nature frequently target critical stages of translation, ultimately arresting or disordering protein synthesis [80,81,82,83]. These compounds bind to specific functional centers on the ribosome and disrupt key steps in codon recognition, peptide bond formation, and others. Such specificity minimizes impact on host eukaryotic ribosomes, making antibiotics a cornerstone therapy against bacterial infections [81,84,85,86,87]. Quantifying the binding affinities of antibiotics to their targets on the ribosome is an important parameter for developing novel therapeutics and combating emerging antibiotic resistance.
Streptomycin (Str), an aminoglycoside antibiotic, binds protein S12 and 16S rRNA within the 30S subunit and induces translational errors [88,89,90,91]. Despite extensive studies of streptomycin’s mechanism of action, direct quantitative data on its affinity for the bacterial ribosome were previously absent. Dihydrostreptomycin (DHSM), the most stable reduced analog of streptomycin (with –CHO replaced by –CH2OH), similarly binds to 16S rRNA of the 30S subunit and induces translational misreading. Equilibrium binding studies with E. coli ribosomes at 25 °C and 10 mM Mg2+ revealed KD values of 94 nM (70S) and 1 μM (30S), respectively [89,92,93]. Using MST with Bpy-labeled ribosomes, we measured streptomycin dissociation constants of 0.3 ± 0.1 μM for both 30S and 70S ribosomes in the presence of 7 mM Mg2+, showing comparable affinities. The thermophoretic signals were in opposite directions (Figure 6a). The obtained affinity values fell within the range reported for dihydrostreptomycin.
Figure 6.
Bimolecular ribosome–inhibitor interactions by MST. (a) Streptomycin affinity for 30S/70S ribosomes: KD = 0.3 ± 0.1 µM (both). (b) Bpy-erythromycin affinity for 50S/70S: KD (Bpy-Ery•50S) = 74 ± 20 nM; KD (Bpy-Ery•70S) ≈ 1 nM. (c) Thermophoresis shift in fluorescently labeled ribosomes in the presence of translation inhibitors: the antibiotics viomycin (Vio), spectinomycin (Spc), hygromycin B (HygB), streptomycin (Str), and etamycin A (EtaA).
MST’s versatility enables the use of virtually any ligand as a fluorescent reporter. In our study, we validate this statement using macromolecules (ribosomes), medium-sized proteins (initiation factors), and small molecules (antibiotics) as reporter molecules. We employed BODIPY-labeled erythromycin (Bpy-Ery) as a reporter to probe macrolide binding with the ribosome (Figure 6b). Erythromycin reversibly binds the 50S exit tunnel through direct contacts with 23S rRNA and influences nascent peptide egress [87,94,95,96]. Obtained affinities (KD = 74 ± 20 nM for Bpy-Ery•50S; ~1 nM for Bpy-Ery•70S) aligned closely with prior reports [97].
In pharmaceutical development and biotechnology, rapid screening of small molecules as potential inhibitors represents an indispensable strategy for discovering novel therapeutic compounds. Microscale thermophoresis enables high-throughput screening of ligand specificity with high accuracy, requiring minimal sample volumes and time. Therefore, we screened changes in the mobility of Bpy-labeled ribosomes resulting from their binding to known antibiotics targeting the 30S subunit (viomycin, spectinomycin, hygromycin B, kasugamycin, and streptomycin) [80,81,90,98,99,100,101,102,103,104] and the 50S subunit (etamycin A) [105]. Pronounced mobility shifts were observed with isolated 30S and 50S subunits in complexes with the analyzed inhibitors, whereas 70S complexes exhibited muted thermophoretic responses.
2.5. MST Assessment of Inhibitor Effects on Translation Initiation
Elucidating the action mechanisms of translation inhibitors is essential for developing novel antimicrobials and understanding bacterial resistance profiles. Moreover, comprehensively studied inhibitors serve as probes for exploring fundamental aspects of translation. Therefore, we examined the effects of antibiotics, DNA aptamers, and a proline-rich antimicrobial peptide on 70S initiation complex formation using diverse fluorescent reporters.
We first investigated streptomycin binding to the 30S•IFs complex by monitoring IF1Cy5, given that both agents target the ribosomal A site. Str titration produced upward MST traces, opposite to the 30S•IF1Cy5 binding signal (Figure 4a), that can be suggesting Str reduces IF1 affinity (Figure 7a). Dose–response fitting yielded an EC50 of 0.14 μM.
Figure 7.
MST analysis of translation initiation complex formation in the presence of diverse inhibitors. (a) Monitoring the effects of A site binder streptomycin (Str), E site binder kasugamycin (Ksg), and translation-unrelated ampicillin (Amp) using IF1Cy5 on 30S•IFs. (b) Effects of IF2-targeting aptamers (Apt311, Apt721) on 30S IC formation, monitored using Bpy-tRNAfMet. (c) Binding curves of the bimolecular 70S•mRNA-Flu complex in the presence of rumicidin-1. (d) Efficiency of 70S IC formation in the presence of the proline-rich rumicidin-family peptide Rum-1. Analysis of 70S IC formation in the presence of Rum-1, dependent on initiation factors (IFs), was conducted via mRNA titration using Bpy-tRNAfMet as the reporter ligand.
Another antibiotic targeting the 30S ribosome that we investigated was kasugamycin (Ksg). This aminoglycoside representative [106] binds to the 30S ribosomal subunit at the E site in the mRNA binding channel region between h24 and h28 of 16S rRNA, disrupting the transition from 30S PIC to 30S IC [107,108]. Kasugamycin is thought to sterically hinder mRNA positioning at the E site, thereby affecting initiator tRNAfMet placement at the ribosomal P site. Meanwhile, Ksg shows no significant effect on mRNA, IF1, or IF3 binding to the 30S ribosome [108]. In our experiments, kasugamycin presence in the 30S•IFs complex, monitored via IF1Cy5, did not alter the thermophoresis signal, consistent with existing data showing no effect on IF1.
We also examined the effect of ampicillin (Amp) on 30S•IFs complex formation, monitored via IF1Cy5. This β-lactam antibiotic from the aminopenicillin class inhibits bacterial cell wall peptidoglycan synthesis by binding to penicillin-binding proteins and exerts no direct effect on translation [109,110]. In our experiments, the presence of Amp exerted no effect on 30S•IFs formation (Figure 7a).
Aptamers are chemically synthesized short oligonucleotides selected by SELEX (Systematic Evolution of Ligands by EXponential enrichment) that specifically bind target molecules [111,112]. We next employed the 30S IC assembly assay to evaluate IF-targeting DNA aptamers using Bpy-tRNAfMet—which binds IF2—as the reporter ligand (Figure 7b). Titration of Apt311 and Apt721, both specific for IF2, produced downward MST traces [113], yielding EC50 values of 0.3 and 0.4 μM, respectively, upon dose–response fitting.
Proline-rich antimicrobial peptides represent promising antibacterial candidates, exhibiting broad-spectrum activity against bacteria, viruses, fungi, and cancer cells, and offering an alternative to conventional drugs amid rising antibiotic resistance [114,115,116]. Given the established finding that Rum-1 occupies the 50S exit tunnel, sterically impeding P and A site tRNA accommodation at the peptidyl transferase center and thereby inhibiting peptide bond formation [117], we examined the effects of this proline-rich rumicidin-family peptide on 70S initiation complex formation efficiency (Figure 7c,d and Figure S4). Rum-1 did not perturb mRNA affinity in the 70S•mRNA bimolecular complex, though a modest thermophoretic amplitude increase suggested altered complex mobility without direct competition at the mRNA binding site (Figure 7c). However, Rum-1 enhanced mRNA affinity by 15.5-fold in the 70S•mRNA•Bpy-tRNAfMet ternary complex, accompanied by a 15-fold reduction in MST amplitude. Addition of initiation factors partially counteracted this effect, modestly reducing mRNA affinity while diminishing MST amplitude 1.7-fold (Figure 7d and Figure S4).
3. Discussion
Translation initiation in prokaryotes constitutes a tightly regulated, multicomponent process that governs the efficiency and fidelity of protein synthesis (Figure 1). Biochemical study of this pathway faces significant challenges due to the complex system of cooperative and sequential interactions between the ribosome, mRNA, initiator tRNAfMet, and initiation factors, in addition to limitations of traditional approaches such as radiolabeling. Biophysical methods, including surface plasmon resonance (SPR) and isothermal titration calorimetry (ITC), are commonly employed to determine biomolecular affinities. We utilize a fluorescence-based analytical platform centered on microscale thermophoresis, which provides a robust, near-native environment for translation initiation studies (Figure 2). The MST-method offers key advantages over SPR and ITC, including no requirement for sample immobilization, lower sensitivity to buffer conditions, rapid experimental throughput, and minimal sample consumption. However, microscale thermophoresis requires one interaction partner to bear a fluorescent label, which can be limiting in cases where labeling is challenging or undesirable; at the same time, this requirement imparts flexibility by allowing selection of the reporter molecule, enabling analysis across multiple labeling strategies and configurations. Thermophoresis can be described as a directed particle flux proportional to the temperature gradient, which in steady state is balanced by ordinary diffusion:
where j—particle flux, c—molecular concentration, DT—thermodiffusion coefficient, and T—temperature; the resulting thermophoretic concentration change is defined by the Soret coefficient (ST = DT/D, where DT is the thermophoretic coefficient, and D is the diffusion coefficient [118]. For a given spatial temperature difference ΔT, the concentration change in the steady state is determined as
where chot is the molecular concentration in the heated region, and ccold is the molecular concentration in the cold region. The Soret coefficient can be either positive or negative depending on the properties of the labeled molecule (size, charge, and solvation), resulting in a steady-state concentration in the heated zone that is either lower or higher than the initial concentration, and thus MST signals that increase or decrease with ligand concentration [118]. In multi-component systems such as bacterial translation initiation involving ribosomes, tRNA, and initiation factors, different fluorescently labeled components (for example, Bpy-Met-tRNAfMet and Bpy-70S) exhibit fundamentally different thermophoretic properties due to their vastly different sizes (~25 kDa vs. ~2.5 MDa), surface charges, and hydration shells, which can result in opposite signal directions for the same binding event (Figure 5b,c). However, this variation in signal direction does not affect the accuracy of KD determination, as both positive and negative thermophoresis yield equivalent dissociation constants. Since at least one of these parameters changes upon binding, MST enables the detection of a wide range of interactions. The technique quantifies binding through the change in normalized fluorescence, reflecting global changes in the fluorescently labeled species rather than localized effects. This is particularly advantageous for studying multi-component complexes such as the bacterial translation initiation system, where MST requires fluorescent labeling of only one component while all other proteins/ligands remain in their native state, enabling analysis of interdependencies between multiple interaction partners with minimal material consumption and without the stability issues associated with surface-coupled assays. The use of different reporter molecules in our work serves as internal validation, as consistent KD values obtained with different labels confirm that the same interaction is being measured regardless of signal direction.
In our study, we performed a sequential analysis of molecular affinities of ligands during the formation of 30S and 70S initiation complexes, employing each of them as the fluorescent reporter in turn. We introduce a rapid BODIPY-labeling protocol for ribosomes and subunits (Figure 3a), with labeling efficiency and functional integrity—including formation of active 70S initiation complexes capable of peptide bond formation—confirmed in control tests (Figure S1a and Figure 3b–d). Maintaining conformational stability and resistance to aggregation in protein preparations is critical for preserving functional activity, particularly upon modifications; here, we comprehensively confirmed ribosomal integrity across extensive control tests—including, for the first time, nanoDSF application to ribosomes under varying ionic conditions—demonstrating no significant structural perturbations from BODIPY labeling (Figure 3e and Figure S1c; Table S1).
We initiated the analysis of translation initiation using our platform by examining bimolecular interactions between 30S/70S ribosomes and ligands serving as reporter molecules (IF1Cy5, IF2Cy5, IF3Cy5, mRNA-Flu, and Bpy-tRNAfMet). We observed high-affinity binding of initiation factors and mRNA to the 30S ribosome (Figure 4a–d). Initiator tRNAfMet binding was notably less efficient, consistent with its dependence on initiation factors (Figure 4c,d).
Microscale thermophoresis offers high sensitivity and solution-phase flexibility for dissecting dynamic supramolecular assemblies across diverse biological systems [18,119,120]. We utilized the MST platform to investigate translation initiation as a multicomponent system using a diverse set of fluorescently labeled molecules. By progressively increasing system complexity, we demonstrated the role of magnesium ions in mRNA and tRNAfMet binding to the 30S ribosome (Figure S3a,b). Quantitative analysis of 30S IC formation showed the individual and synergistic contributions of IF1, IF2, and IF3, confirming IF2’s dominant role in initiator tRNAfMet recruitment [10,121] while revealing IF1/IF3-mediated modulation of mRNA and tRNAfMet affinities (Figure 5 and Figure S3d). These equilibrium measurements complement kinetic insights from stopped-flow approaches and highlight the unique capacity of MST to capture cooperative binding under near-native conditions. We applied our model system to analyze the formation of both 30S and 70S initiation complexes, using labeled tRNAfMet as an example of a reporter ligand, along with labeled ribosomes or a completely label-free setup in our experiments (Figure 5). Remarkably, all the approaches yielded consistent EC50 values (0.3–1.2 μM) despite execution across distinct project phases, instruments, locations, and operators. This underscores the system’s experimental robustness.
Translation is a frequent target for inhibitors of diverse origins. Accordingly, developing model systems that support not only the elucidation of fundamental mechanisms but also the assessment of potential inhibitors holds substantial importance—this approach enables both decoding their mechanisms of action for therapeutic development and addressing key questions in basic translation research. In addition to analyzing the affinity of interacting molecules, the model system we present can also be used for these purposes, namely, evaluating the effects of potential inhibitors on the translation initiation stage. Using microscale thermophoresis, we analyzed the effects of antibiotics, DNA aptamers, and an antimicrobial peptide on translation initiation. We showed the potential of our system as a platform for rapid screening of potential inhibitors’ binding efficiency to their target, exemplified by the interaction of known antibiotics (viomycin, spectinomycin, hygromycin B, kasugamycin, streptomycin, and etamycin A) with the ribosome (Figure 6c). As an example of targeted affinity analysis for small molecules such as the antibiotics streptomycin or erythromycin with the ribosome, we performed measurements under alternative experimental configurations in which the reporter molecule was either the target (ribosome) (Figure 6a) or the ligand (antibiotic) (Figure 6b). As a result, we determined that streptomycin binds the 70S ribosome and the 30S ribosomal subunit with similar affinity. Analysis of Bpy-erythromycin binding to the 70S ribosome and the 50S ribosomal subunit revealed high-affinity interactions, with dissociation constants of ≈1 nM and 74 ± 20 nM, respectively, in agreement with previously reported data [97].
In addition to analyzing bimolecular interactions, we used our model system to assess the effects of inhibitors on translation initiation within a multicomponent complex. We showed that Rum-1 also affects the formation of the 70S initiation complex, in which the presence of initiation factors plays an important role in this process. These findings open a new direction for investigating how potential antimicrobial inhibitors act on the translation process. We also demonstrated the use of this model system to analyze the effects of antibiotics, using streptomycin and kasugamycin as examples, as well as IF2-targeting DNA aptamers, on the ribosomal translation initiation complex (Figure 7a,b).
The model system we present, based on the MST platform, provides a sensitive biophysical toolkit for dissecting bacterial translation initiation by minimizing sample consumption while preserving sensitivity and physiological relevance, thereby enabling comprehensive characterization of initiation complex intermediates and surpassing fluorescence methods that require extensive manipulation or specialized instrumentation. Its versatility may extend beyond bacterial systems to eukaryotic initiation complexes, ribosome biogenesis, elongation/termination, and other supramolecular assemblies like spliceosomes, expressome complexes, RNPs, and transcription machineries, addressing core questions in complex assembly, regulation, and stability across organisms; nanoDSF integration further enables monitoring of protein modifications, while rapid affinity screening—including for limited samples—supports drug development.
4. Materials and Methods
4.1. Biological Preparations
4.1.1. 70S Ribosomes and Ribosomal Subunits
The 70S ribosomes and 30S/50S subunits were prepared as described previously [3]. Subunits were isolated from purified 70S ribosomes by sucrose gradient centrifugation (Ti-15 rotor, Beckman Coulter, Brea, CA, USA) under dissociating conditions in buffer TAKM1.25 (50 mM Tris-HCl, pH 7.5, 70 mM NH4Cl, 30 mM KCl, 1.25 mM MgCl2). Ribosome concentration was determined by measuring the absorbance at 260 nm, where 1 unit corresponds to 23 pmol of 70S, 63 pmol of 30S, and 37 pmol of 50S ribosomes, respectively.
4.1.2. Translation Factors Purification
Initiation factors IF1, IF2, and IF3 were purified as described previously [15]. Elongation factors EF-Tu and EF-G were isolated following established protocols [122]. Mutant variants engineered for site-specific labeling—IF1 D5C, IF2γ G810C, and IF3 E166C—were expressed and purified according to published procedures [3,122,123].
4.2. Fluorescence Ligands
4.2.1. BODIPY-Met-tRNAfMet (Bpy-tRNAfMet)
The fluorescent BODIPY FL SSE dye (D6140, Invitrogen, San-Diego, CA, USA) was used to generate fluorescently labeled initiator Met-tRNAfMet, following a labeling procedure analogous to that described previously [15].
4.2.2. Fluorescein-Labeled mRNA (mRNA-Flu)
Synthetic mRNA mMF1 (5′-ACUAUGUUU-3′) [15] was produced by in vitro transcription for 3 h at 37 °C. Reactions contained transcription buffer (40 mM Tris-HCl, pH 7.5, 15 mM MgCl2, 2 mM spermidine, 10 mM NaCl), 10 mM DTT, 2.5 mM NTPs, 5 mM GMP, 0.01 U/ µL inorganic pyrophosphatase, 2 U/ µL T7 RNA polymerase, and 5 ng/ µL DNA template. Transcripts were purified by three sequential ethanol precipitations followed by anion-exchange chromatography on a HiTrap Q column (5 mL; 17-1151-01, GE Healthcare, Chicago, IL, USA), equilibrated with buffer A (50 mM Tris-HCl, pH 7.0, 5 mM EDTA, 0.3 M NaCl). mRNA was eluted by a linear gradient of 0.3–1.5 M NaCl in buffer A, visualized by 8 M urea-PAGE and Methylene blue staining, pooled, and recovered by three additional ethanol precipitations. mRNA was fluorescently labeled with fluorescein (M041030, Sigma-Aldrich, St. Louis, MO, USA) as described previously [3].
4.2.3. Fluorescent Labeling of IFs (IF1Cy5, IF2Cy5, IF3Cy5)
Mutant IFs (pre-incubated with 300 µM TCEP for 10 min at 37 °C) were mixed with maleimide-Cy5 (GE Healthcare Life Sciences, Chicago, IL, USA) at a 10:1 molar ratio in labeling buffer (25 mM Tris-HCl, pH 7.1, 100 mM NH4Cl, 10% glycerol). Reactions proceeded for 2 h at room temperature in the dark with gentle mixing every 30 min, then were quenched with 6 mM β-mercaptoethanol. Labeled proteins were purified by cation-exchange chromatography on HiTrap SP HP columns (GE Healthcare Life Sciences, Chicago, IL, USA). IF1 and IF3 were eluted by a gradient of 50–1000 mM NH4Cl; IF2 by a gradient of 30–750 mM NaCl. Purified proteins were dialyzed against storage buffer (25 mM Tris-HCl, pH 7.1, 200 mM NH4Cl, 10% glycerol, 6 mM β-mercaptoethanol), aliquoted, and stored at −80 °C. Fractions were analyzed by SDS-PAGE (15% for IF1/IF3; 10% for IF2) with Coomassie brilliant blue staining. Protein concentrations and degree of labeling were determined using the Cy5 extinction coefficient (ε = 250,000 M−1 cm−1).
4.2.4. BODIPY-Labeled Ribosomes (Bpy-70S, Bpy-50S, Bpy-30S)
Ribosomes were fluorescently labeled at free surface amino groups of ribosomal proteins using NHS-ester BODIPY FL SSE dye (Bpy, D6140, Invitrogen, San-Diego, CA, USA). The 70S ribosomes (5 µM) were incubated with Bpy (1:10 molar ratio) in HAKM7 buffer (50 mM HEPES, pH 8.7, 70 mM NH4Cl, 30 mM KCl, 7 mM MgCl2) for 1 h at 25 °C in the dark. Unbound dye was removed by centrifugation through a 1.1 M sucrose cushion in TAKM7 buffer (50 mM Tris-HCl, pH 7.5, 70 mM NH4Cl, 30 mM KCl, 7 mM MgCl2) at 259,000× g for 2 h at 4 °C (TLS-55 rotor, Beckman Coulter, Brea, CA, USA). Pellets were resuspended in TAKM7.
Fluorescently labeled 30S and 50S subunits were obtained by dissociating Bpy-70S in TAKM1.25 buffer (50 mM Tris-HCl, pH 7.5, 70 mM NH4Cl, 30 mM KCl, 1.25 mM MgCl2) for ≥1 h at 4 °C, followed by separation through a 10–40% sucrose gradient at 28,000 rpm for 19 h at 4 °C (SW28 rotor, Beckman Coulter, Brea, CA, USA) (Figure 3a). Gradients were fractionated based on absorbance profiles at 260 nm, and the fractions containing ribosomal subunits were collected and pelleted by centrifugation at 50,000 rpm for 18 h at 4 °C (SW55 rotor, Beckman Coulter, Brea, CA, USA). Labeling efficiency was verified by 10% SDS-PAGE.
4.3. Biochemical Reactions
4.3.1. MST Experiments
MST samples were prepared on ice in the dark with fixed fluorescent reporter concentrations (Bpy-tRNAfMet, mRNA-Flu, IFsCy5, Bpy-70S, Bpy-30S) and serial 1:1 dilutions of titrants, mixed by gentle pipetting. Mixtures were incubated for 30 min at 37 °C in TAKM7 (50 mM Tris-HCl, pH 7.5, 70 mM NH4Cl, 30 mM KCl, 7 mM MgCl2) or TAKM20 (50 mM Tris-HCl, pH 7.5, 70 mM NH4Cl, 30 mM KCl, 20 mM MgCl2), centrifuged (13,000 rpm, 5 min, 25 °C) and loaded into standard treated capillaries (MO-K022) or label-free capillaries (MO-Z022) (NanoTemper Technologies GmbH, Munich, Germany).
Samples containing Bpy or Flu fluorophores were measured on a Monolith NT.115 instrument (green LED, 40% IR laser, NanoTemper Technologies GmbH, Munich, Germany). Samples containing Cy5-labeled components were measured on a Monolith NT.LabelFree instrument (red LED, 10% IR laser, NanoTemper Technologies GmbH, Munich, Germany). Label-free measurements employed 10% IR laser. The 30S subunits were activated for 1 h at 37 °C in TAKM20 prior to assays.
The use of diverse fluorescent reporters throughout this study enabled analysis of binding interactions in different detection channels (green and red LEDs) and in the absence of fluorescence labels (label-free mode). This versatility allowed cross-validation of results across multiple detection filters and minimized potential artifacts arising from a single reporter type. The consistency of ligand binding affinities obtained with different reporters confirmed that the observed thermophoretic changes reflected genuine binding events rather than reporter-specific effects. This multi-reporter approach strengthens the reliability of our conclusions and enables direct comparison of results across experiments.
Bimolecular Binding
Binding affinities of Cy5-labeled IFs to 30S subunits were measured at fixed IF concentrations (0.05 µM IF1Cy5/0.15 µM IF2Cy5/0.15 µM IF3Cy5) with varying 30S (7.8 nM–2 µM) concentrations. mRNA binding to ribosomes was assessed using 0.025 µM mRNA-Flu reporter with 30S (3.9 nM–2 µM) or 70S (2 nM–3.5 µM) ribosomes. Initiator tRNAfMet binding employed 0.5 µM Bpy-tRNAfMet with 30S (1 nM–6 µM) or 70S (5 nM–10 µM). All complexes were incubated for 30 min at 37 °C.
The affinity of streptomycin was analyzed using 0.5 µM Bpy-30S or 0.2 µM Bpy-70S with antibiotic concentrations from 9.8 nM to 20 µM. Erythromycin binding employed varying ribosome concentrations (0.1 nM–1 µM) at fixed 0.05 µM Bpy-Ery. Diffusion shifts in the inhibitors were assessed with 0.5 µM Bpy-30S, 0.5 µM Bpy-50S, and 0.2 µM Bpy-70S in the presence of 200 µM of each antibiotic: viomycin (Vio), spectinomycin (Spc), hygromycin B (Hyg B), kasugamycin (Ksg), streptomycin (Str), and etamycin A (Eta A).
Multicomponent System
The effect of Mg2+ on mRNA and tRNAfMet binding to 30S ribosomes was analyzed using 0.5 µM Bpy-tRNAfMet, 4 µM mRNA, 1 µM 30S, and Mg2+ concentrations from 3.1 to 100 mM. IF-dependent 30S initiation complex formation was assessed with 1 µM 30S, 0.5 µM Bpy-tRNAfMet, 4 µM mRNA, 0.5 mM GTP, and 0.3–10 µM IFi in TAKM7 and TAKM20 buffers.
The 30S/70S initiation complex formation was analyzed in the presence of initiation factors using 0.5 µM Bpy-tRNAfMet, 1 µM 30S/70S, 2 µM IF1, 1 µM IF2, 1.5 µM IF3, 0.5 mM GTP, and mRNA (4 nM–8 µM for 30S IC; 5 nM–40 µM for 70S IC), with incubation at 37 °C for 30 min. Ribosome-monitored assays employed 0.5 µM Bpy-30S and 0.2 µM Bpy-70S; label-free setups used 1 µM 70S. 70S IC formation with Bpy-70S followed identical ligand conditions. 30S IC formation as a function of IF3 (1 nM–2.5 µM) was assessed with mRNA-Flu or polyU mRNA (UUU-UUU-UUU-…) under the same conditions.
Inhibitors Action Analysis
The effects of 40 µM streptomycin, 100 µM kasugamycin, and 100 µM ampicillin on initiation factor binding to 30S ribosomes were analyzed by monitoring thermodiffusion changes of 0.05 µM IF1Cy5, with complex ligands at 0.05 µM 30S, 0.15 µM IF2, and 0.15 µM IF3 in TAKM7 buffer. IF2-targeted aptamer effects on 30S IC formation were assessed using 0.5 µM Bpy-tRNAfMet, 1 µM 30S, 2 µM IF1, 1 µM IF2, 1.5 µM IF3, 0.5 mM GTP, and 4 µM mRNA. The aptamers (Apt311, Apt721) were activated by heating at 95 °C for 5 min, followed by 30 min incubation at room temperature, and tested across 0.1 nM–2 µM concentrations.
The effect of rumicidin-1 on 70S•mRNA (mRNA-Flu) and 70S IC ± IFs (Bpy-tRNAfMet) complex formation was assessed using a twofold serial dilution starting from 20 µM. An experiment on the effect of Rum-1 on the formation of the bimolecular 70S•mRNA-Flu complex was performed in the presence of 2 µM peptide. The efficiency of 70S IC formation as a function of mRNA in the presence of Rum-1 was assessed analogously to the experiments on initiation complex formation efficiency described above. The concentrations of the ligands were 0.5 µM Bpy-tRNAfMet, 1 µM 70S, 2 µM IF1, 1 µM IF2, 1.5 µM IF3, 0.5 mM GTP, 4 µM mRNA, and 2 µM rumicidin-1.
4.3.2. nanoDSF Experiments
Conformational integrity and aggregation stability of fluorescently labeled Bpy-70S, Bpy-50S, and Bpy-30S were monitored by nanoDSF using a Prometheus NT.48 (NanoTemper Technologies GmbH, Munich, Germany) in TAKxMy buffer (50 mM Tris-HCl, pH 7.5, 70 mM NH4Cl, X mM KCl, Y mM MgCl2). K+ concentration was either 30 or 360 mM; Mg2+ was used at 0, 1, 5, 7, 20, or 50 mM concentration.
The samples (1 µM 70S/50S/30S/Bpy-70S/Bpy-50S/Bpy-30S in a 10 µL volume) were loaded into the glass capillaries (PR-C002, NanoTemper Technologies GmbH, Munich, Germany). Optimal LED intensity (10–30%) was determined by initial fluorescence scan, followed by heating in the range of 20–95 °C at 1 °C/min. Melting points (Tm) and aggregation onset temperatures were calculated using PR.ThermControl software v2.0.2 (NanoTemper Technologies GmbH, Munich, Germany).
4.3.3. Kinetic Experiments
Rapid Kinetics
The 70S association and dissociation were monitored by stopped-flow light scattering (λex = 430 nm) on an SX-20 system (Applied Photophysics, Leatherhead, UK) using native or fluorescently labeled ribosomes and IF3. Association reactions employed final concentrations of 0.15 µM Bpy-30S and 0.05 µM Bpy-50S. Dissociation of 0.1 µM 70S/Bpy-70S was initiated upon addition of 0.3 µM IF3. All the reactions were performed in TAKM7 buffer at 25 °C.
Slow Kinetics
The 30S IC formation was analyzed using 0.5 µM Bpy-30S (30S was reactivated as for MST experiments), 0.75 µM each of IF1, IF2, IF3, 0.75 µM fMet-tRNAfMet, 1 mM GTP, 1 mM DTT, and 2 µM mRNA in TAKM7 buffer. 70S IC formation was employed using 0.5 µM Bpy-70S/Bpy-30S + Bpy-50S mixtures with the same IFs, fMet-tRNAfMet, GTP, DTT, and mRNA concentrations in TAKM7. The mixtures were incubated for 60 min at 37 °C, and fluorescence emission was monitored at 512 nm. The efficiency of dipeptide bond formation in the resulting complexes was assessed according to the peptide synthesis protocol.
4.3.4. Peptide Bond Formation
Peptide bond formation efficiency was assessed using native and fluorescently labeled 70S, 30S, and 50S ribosomes. The 70S ICs were formed by incubating 0.4 µM ribosomes, 1.6 µM mRNA (AUG-GUU-UUC) [16], 0.6 µM each IF1, IF2, IF3, and fMet-tRNAfMet with 1 mM GTP and 1 mM DTT for 1 h at 37 °C. The 30S subunits were activated as described above. Ternary complexes (0.8 µM [14C]Val-tRNAVal•EF-Tu•GTP) were prepared by incubating 1.6 µM EF-Tu with 3 mM PEP, 1 mM GTP, and pyruvate kinase (1/100 vol) for 15 min at 37 °C, followed by the addition of 0.8 µM [14C]Val-tRNAVal (2:1 EF-Tu:tRNA ratio) for 5 min at 37 °C.
Pre-translocation complexes were formed by mixing 70S ICs with the ternary complexes for 5 min at 37 °C. Dipeptide fMet-[14C]Val hydrolysis from peptidyl-tRNA was induced with 0.5 M KOH (1/10 vol) for 30 min at 37 °C and neutralized with glacial acetic acid (1/10 vol). Peptide bond formation efficiency was quantified by reversed-phase HPLC (RP-C8 column, Waters, Milford, MA, USA) using a 0–65% CH3CN gradient in 0.1% TFA, measuring radioactive label incorporation as described previously [124].
4.4. Data Analysis
Relative fluorescence was calculated using MO.Control software v1.6.1 (NanoTemper Technologies GmbH) from the Fhot and Fcold regions of MST traces. Binding affinities (KD) were determined for bimolecular interactions (Figure 4 and Figure 6), while EC50 was determined for larger multi-component complexes (Figure 5 and Figure 7), by fitting thermophoresis data as a function of ligand concentration using GraphPad Prism v.8.0.1 (GraphPad, San Diego, CA, USA). All data points represent the mean of 3–4 independent experimental replicates, with error bars showing standard deviation. The equilibrium dissociation constants (KD) were obtained by fitting a quadratic binding equation (Y = YMin + (YMax − YMin)/2 × ([Z + X + KD] − [sqrt(((Z + X + KD)2) − (4ZX))])), where Z is the reporter concentration and X is the total ligand concentration. This full quadratic dependency based on the law of mass action allows precise determination of KD even at reporter concentrations slightly higher than KD, since both the inflection point and the shape of the dose–response curve are taken into account. EC50 values were obtained by nonlinear regression using the equation (Y = YMin + (YMax − YMin)/(1 + (EC50/X) n), where n is the Hill slope. For all reported KD/EC50 values, 95% confidence intervals were calculated, and the goodness of fit (R2) was ≥0.98. For experiments with relatively small signal changes, the following R2 values were obtained: Figure 4a: 0.82 for IF1Cy5•30S, 0.84 for IF2Cy5•30S, 0.74 for IF3Cy5•30S; Figure 4c: 0.86 for Bpy-Met-tRNAfMet•30S; Figure 5c: 0.90 for Bpy-70S IC, 0.96 for LabelFree experiment; Figure 6a: 0.91 for Bpy-30S•Strep, 0.86 for Bpy-70S•Strep; Figure 6b: 0.94 for Bpy-Ery•50S; Figure 7d: 0.91 for 70S IC with Rum1. The limitations of these parameters include EC50 values representing potency rather than true KD when interactions are non-1:1 or show cooperativity (Hill slope ≠ 1); KD determination may be less accurate when reporter concentration significantly exceeds KD, although the quadratic binding equation partially corrects for this. All graphs show individual data points with the corresponding nonlinear regression fits and 95% confidence bands.
Supplementary Materials
The following supporting information can be downloaded at: https://www.mdpi.com/article/10.3390/ijms27114953/s1, Refs. [125,126,127,128,129,130,131,132] are cited in this part.
Author Contributions
Conceptualization, D.S.V. and P.M.; methodology, D.S.V., P.S.K., Z.A.S., S.L., A.S.-C. and K.P.; validation, D.S.V., A.P., P.M. and A.L.K.; formal analysis, D.S.V., P.S.K., Z.A.S., S.L., A.S.-C. and K.P.; investigation, D.S.V., P.S.K., Z.A.S., S.L., A.S.-C., K.P. and P.S.; resources, D.S.V., P.M. and A.L.K.; data curation, D.S.V., P.M. and A.L.K.; writing—original draft preparation, D.S.V.; writing—review and editing, D.S.V., A.S.-C., K.P., V.Z., A.P., P.M. and A.L.K.; visualization, D.S.V. and A.S.-C.; supervision, D.S.V., P.M. and A.L.K.; project administration, D.S.V.; funding acquisition, D.S.V. and P.M. All authors have read and agreed to the published version of the manuscript.
Funding
This work was supported by the Russian Science Foundation № 23-74-10088 to D.S.V. (preparative amounts of native reagents were obtained, including labeling of tRNA, mRNA, and ribosomes; development and optimization of ribosome labeling protocols; analysis of labeled ribosome conformation, stability, and activity; affinity measurements of binary and multi-component complexes with labeled tRNA, mRNA, ribosomes, and erythromycin) and the Concytec/Prociencia program grant PE501079419-2022 to P.M. (preparation of labeled initiation factors and corresponding binding experiments with them; label-free MST experiments).
Institutional Review Board Statement
Not applicable.
Informed Consent Statement
Not applicable.
Data Availability Statement
The original contributions presented in this study are included in the article/Supplementary Materials and pre-print in BIORXIV/2026/719552. Further inquiries can be directed to the corresponding author.
Acknowledgments
We are grateful to Nanotemper Technologies Rus (Daria S. Vinogradova and Andrey L. Konevega) for providing the equipment and for their valuable methodological and technical support.
Conflicts of Interest
The authors declare no competing interests.
References
- Schmitt, E.; Coureux, P.-D.; Monestier, A.; Dubiez, E.; Mechulam, Y. Start Codon Recognition in Eukaryotic and Archaeal Translation Initiation: A Common Structural Core. Int. J. Mol. Sci. 2019, 20, 939. [Google Scholar] [CrossRef] [Scilit]
- Kozak, M. Initiation of translation in prokaryotes and eukaryotes. Gene 1999, 234, 187–208. [Google Scholar] [CrossRef] [Scilit]
- Milon, P.; Konevega, A.L.; Peske, F.; Fabbretti, A.; Gualerzi, C.O.; Rodnina, M.V. Transient kinetics, fluorescence, and FRET in studies of initiation of translation in bacteria. Methods Enzymol. 2007, 430, 1–30. [Google Scholar] [CrossRef] [Scilit]
- Gualerzi, C.O.; Pon, C.L. Initiation of mRNA translation in bacteria: Structural and dynamic aspects. Cell. Mol. Life Sci. 2015, 72, 4341–4367. [Google Scholar] [CrossRef] [Scilit] [PubMed]
- Milón, P.; Maracci, C.; Filonava, L.; Gualerzi, C.O.; Rodnina, M.V. Real-time assembly landscape of bacterial 30S translation initiation complex. Nat. Struct. Mol. Biol. 2012, 19, 609–615. [Google Scholar] [CrossRef] [Scilit]
- Duval, M.; Simonetti, A.; Caldelari, I.; Marzi, S. Multiple ways to regulate translation initiation in bacteria: Mechanisms, regulatory circuits, dynamics. Biochimie 2015, 114, 18–29. [Google Scholar] [CrossRef] [Scilit] [PubMed]
- Woese, C.R.; Kandler, O.; Wheelis, M.L. Towards a natural system of organisms: Proposal for the domains Archaea, Bacteria, and Eucarya. Proc. Natl. Acad. Sci. USA 1990, 87, 4576–4579. [Google Scholar] [CrossRef] [Scilit]
- Kyrpides, N.C.; Woese, C.R. Universally conserved translation initiation factors. Proc. Natl. Acad. Sci. USA 1998, 95, 224–228. [Google Scholar] [CrossRef] [Scilit]
- Rodnina, M.V. Translation in Prokaryotes. Cold Spring Harb. Perspect. Biol. 2018, 10, a032664. [Google Scholar] [CrossRef] [Scilit]
- Milón, P.; Rodnina, M.V. Kinetic control of translation initiation in bacteria. Crit. Rev. Biochem. Mol. Biol. 2012, 47, 334–348. [Google Scholar] [CrossRef] [Scilit]
- Milon, P.; Carotti, M.; Konevega, A.L.; Wintermeyer, W.; Rodnina, M.V.; Gualerzi, C.O. The ribosome-bound initiation factor 2 recruits initiator tRNA to the 30S initiation complex. EMBO Rep. 2010, 11, 312–316. [Google Scholar] [CrossRef] [Scilit] [PubMed]
- Studer, S.M.; Joseph, S. Unfolding of mRNA secondary structure by the bacterial translation initiation complex. Mol. Cell 2006, 22, 105–115. [Google Scholar] [CrossRef] [Scilit] [PubMed]
- Milon, P.; Konevega, A.L.; Gualerzi, C.O.; Rodnina, M.V. Kinetic Checkpoint at a Late Step in Translation Initiation. Mol. Cell 2008, 30, 712–720. [Google Scholar] [CrossRef] [Scilit]
- Antoun, A.; Pavlov, M.Y.; Lovmar, M.; Ehrenberg, M. How initiation factors tune the rate of initiation of protein synthesis in bacteria. EMBO J. 2006, 25, 2539–2550. [Google Scholar] [CrossRef] [Scilit]
- Vinogradova, D.S.; Zegarra, V.; Maksimova, E.; Nakamoto, J.A.; Kasatsky, P.; Paleskava, A.; Konevega, A.L.; Milón, P. How the initiating ribosome copes with ppGpp to translate mRNAs. PLoS Biol. 2020, 18, e3000593. [Google Scholar] [CrossRef] [Scilit]
- Maksimova, E.M.; Vinogradova, D.S.; Osterman, I.A.; Kasatsky, P.S.; Nikonov, O.S.; Milón, P.; Dontsova, O.A.; Sergiev, P.V.; Paleskava, A.; Konevega, A.L. Multifaceted Mechanism of Amicoumacin A Inhibition of Bacterial Translation. Front. Microbiol. 2021, 12, 618857. [Google Scholar] [CrossRef] [Scilit] [PubMed]
- Jerabek-Willemsen, M.; Wienken, C.J.; Braun, D.; Baaske, P.; Duhr, S. Molecular Interaction Studies Using Microscale Thermophoresis. ASSAY Drug Dev. Technol. 2011, 9, 342–353. [Google Scholar] [CrossRef] [Scilit]
- Seidel, S.A.I.; Dijkman, P.M.; Lea, W.A.; Van Den Bogaart, G.; Jerabek-Willemsen, M.; Lazic, A.; Joseph, J.S.; Srinivasan, P.; Baaske, P.; Simeonov, A.; et al. Microscale thermophoresis quantifies biomolecular interactions under previously challenging conditions. Methods 2013, 59, 301–315. [Google Scholar] [CrossRef] [Scilit]
- Spiewla, T.; Grab, K.; Depaix, A.; Ziemkiewicz, K.; Warminski, M.; Jemielity, J.; Kowalska, J. An MST-based assay reveals new binding preferences of IFIT1 for canonically and noncanonically capped RNAs. RNA 2025, 31, 181–192. [Google Scholar] [CrossRef] [Scilit]
- Heilek, G.M.; Marusak, R.; Meares, C.F.; Noller, H.F. Directed hydroxyl radical probing of 16S rRNA using Fe(II) tethered to ribosomal protein S4. Proc. Natl. Acad. Sci. USA 1995, 92, 1113–1116. [Google Scholar] [CrossRef] [Scilit]
- Odom, O.W.; Robbins, D.J.; Lynch, J.; Dottavio-Martin, D.; Kramer, G.; Hardesty, B. Distances between 3′ ends of ribosomal ribonucleic acids reassembled into Escherichia coli ribosomes. Biochemistry 1980, 19, 5947–5954. [Google Scholar] [CrossRef] [Scilit] [PubMed]
- Auerbach, T.; Pioletti, M.; Avila, H.; Anagnostopoulos, K.; Weinstein, S.; Franceschi, F.; Yonath, A. Genetic and Biochemical Manipulations of the Small Ribosomal Subunit from Thermus thermophilus HB8. J. Biomol. Struct. Dyn. 2000, 17, 617–628. [Google Scholar] [CrossRef] [Scilit]
- Oakes, M.I.; Clark, M.W.; Henderson, E.; Lake, J.A. DNA hybridization electron microscopy: Ribosomal RNA nucleotides 1392–1407 are exposed in the cleft of the small subunit. Proc. Natl. Acad. Sci. USA 1986, 83, 275–279. [Google Scholar] [CrossRef] [Scilit]
- Klimova, M.; Senyushkina, T.; Samatova, E.; Peng, B.Z.; Pearson, M.; Peske, F.; Rodnina, M.V. EF-G–induced ribosome sliding along the noncoding mRNA. Sci. Adv. 2019, 5, eaaw9049. [Google Scholar] [CrossRef] [Scilit]
- Sharma, H.; Adio, S.; Senyushkina, T.; Belardinelli, R.; Peske, F.; Rodnina, M.V. Kinetics of Spontaneous and EF-G-Accelerated Rotation of Ribosomal Subunits. Cell Rep. 2016, 16, 2187–2196. [Google Scholar] [CrossRef] [Scilit] [PubMed]
- Görisch, H.; Goss, D.J.; Parkhurst, L.J. Kinetics of ribosome dissociation and subunit association studied in a light-scattering stopped-flow apparatus. Biochemistry 1976, 15, 5743–5753. [Google Scholar] [CrossRef] [Scilit]
- Zhang, Y.; Inouye, M. RatA (YfjG), an Escherichia coli toxin, inhibits 70S ribosome association to block translation initiation. Mol. Microbiol. 2011, 79, 1418–1429. [Google Scholar] [CrossRef] [Scilit]
- Hershey, J.W.B. Protein synthesis. In Escherichia coli and Salmonella typhimurium: Cellular and Molecular Biology; Neidhardt, F.C., Ingraham, J.L., Low, K.B., Magasanik, B., Schaechter, M., Umbarger, H.E., Eds.; ASM Press: Washington, DC, USA, 1987; pp. 613–647. [Google Scholar]
- Liiv, A.; Karitkina, D.; Maiväli, U.; Remme, J. Analysis of the function of E. coli 23S rRNA helix-loop 69 by mutagenesis. BMC Mol. Biol. 2005, 6, 18. [Google Scholar] [CrossRef] [Scilit] [PubMed]
- Yusupov, M.M.; Yusupova, G.Z.; Baucom, A.; Lieberman, K.; Earnest, T.N.; Cate, J.H.; Noller, H.F. Crystal structure of the ribosome at 5.5 A resolution. Science 2001, 292, 883–896. [Google Scholar] [CrossRef] [Scilit]
- Harms, J.; Schluenzen, F.; Zarivach, R.; Bashan, A.; Gat, S.; Agmon, I.; Bartels, H.; Franceschi, F.; Yonath, A. High Resolution Structure of the Large Ribosomal Subunit from a Mesophilic Eubacterium. Cell 2001, 107, 679–688. [Google Scholar] [CrossRef] [Scilit]
- d’Aquino, A.E.; Azim, T.; Aleksashin, N.A.; Hockenberry, A.J.; Krüger, A.; Jewett, M.C. Mutational characterization and mapping of the 70S ribosome active site. Nucleic Acids Res. 2020, 48, 2777–2789. [Google Scholar] [CrossRef] [Scilit]
- Wen, J.; Lord, H.; Knutson, N.; Wikström, M. Nano differential scanning fluorimetry for comparability studies of therapeutic proteins. Anal. Biochem. 2020, 593, 113581. [Google Scholar] [CrossRef] [Scilit] [PubMed]
- Johnson, C.M. Differential scanning calorimetry as a tool for protein folding and stability. Arch. Biochem. Biophys. 2013, 531, 100–109. [Google Scholar] [CrossRef] [Scilit] [PubMed]
- Real-Hohn, A.; Groznica, M.; Löffler, N.; Blaas, D.; Kowalski, H. nanoDSF: In vitro Label-Free Method to Monitor Picornavirus Uncoating and Test Compounds Affecting Particle Stability. Front. Microbiol. 2020, 11, 1442. [Google Scholar] [CrossRef] [Scilit] [PubMed]
- Vinogradova, D.S.; Spiridonova, Z.A.; Antysheva, T.A.; Sidorova, Z.Y.; Kasatsky, P.S.; Tolstyko, E.A.; Paleskava, A.; Konevega, A.L. (p)ppGpp Binding to the Bifunctional Enzyme RelSeq Increases Its Conformational Stability. Nanobiotechnol. Rep. 2025, 20, 903–915. [Google Scholar] [CrossRef] [Scilit]
- Bashan, A.; Yonath, A. The linkage between ribosomal crystallography, metal ions, heteropolytungstates and functional flexibility. J. Mol. Struct. 2008, 890, 289–294. [Google Scholar] [CrossRef] [Scilit]
- Allen, S.H.; Wong, K.-P. The role of magnesium and potassium ions in the molecular mechanism of ribosome assembly: Hydrodynamic, conformational, and thermal stability studies of 16 S RNA from Escherichia coli ribosomes. Arch. Biochem. Biophys. 1986, 249, 137–147. [Google Scholar] [CrossRef] [Scilit]
- Jelenc, P.C.; Kurland, C.G. Nucleoside triphosphate regeneration decreases the frequency of translation errors. Proc. Natl. Acad. Sci. USA 1979, 76, 3174–3178. [Google Scholar] [CrossRef] [Scilit]
- Bartetzko, A.; Nierhaus, K.H. Mg2+/NH4+/polyamine system for polyuridine-dependent polyphenylalanine synthesis with near in vivo characteristics. Methods Enzymol. 1988, 164, 650–658. [Google Scholar] [CrossRef] [Scilit]
- Rheinberger, H.J.; Nierhaus, K.H. The ribosomal E site at low Mg2+: Coordinate inactivation of ribosomal functions at Mg2+ concentrations below 10 mM and its prevention by polyamines. J. Biomol. Struct. Dyn. 1987, 5, 435–446. [Google Scholar] [CrossRef] [Scilit]
- Nierhaus, K.H. Mg2+, K+, and the Ribosome. J. Bacteriol. 2014, 196, 3817–3819. [Google Scholar] [CrossRef] [Scilit]
- Rivalta, A.; Hiregange, D.-G.; Bose, T.; Rajan, K.S.; Yonath, A.; Zimmerman, E.; Waghalter, M.; Fridkin, G.; Martinez-Roman, I.; Rosenfield, L.; et al. Ribosomes: From conserved origin to functional/medical mobility and heterogeneity. Philos. Trans. R. Soc. B Biol. Sci. 2025, 380, 20230393. [Google Scholar] [CrossRef] [Scilit] [PubMed]
- McCarthy, B.J. The effects of magnesium starvation on the ribosome content of Escherichia coli. Biochim. Biophys. Acta 1962, 55, 880–889. [Google Scholar] [CrossRef] [Scilit]
- Gesteland, R.F. Unfolding of Escherichia coli ribosomes by removal of magnesium. J. Mol. Biol. 1966, 18, 356–371, IN12–IN14. [Google Scholar] [CrossRef] [Scilit]
- Gavrilova, L.P.; Ivanov, D.A.; Spirin, A.S. Studies on the structure of ribosomes. J. Mol. Biol. 1966, 16, 473–489, IN25–IN28. [Google Scholar] [CrossRef] [Scilit]
- Gordon, J.; Lipmann, F. Role of divalent ions in poly U-directed phenylalanine polymerization. J. Mol. Biol. 1967, 23, 23–33. [Google Scholar] [CrossRef] [Scilit]
- Weiss, R.L.; Kimes, B.W.; Morris, D.R. Cations and ribosome structure. III. Effects on the 30S and 50S subunits of replacing bound Mg2+ by inorganic cations. Biochemistry 1973, 12, 450–456. [Google Scholar] [CrossRef] [Scilit]
- Stahli, C.; Noll, H. Structural dynamics of bacterial ribosomes: VI. Denaturation of active ribosomes by Mg2+ dependent conformational transitions. Mol. Gen. Genet. 1977, 153, 159–168. [Google Scholar] [CrossRef] [Scilit]
- Näslund, P.H.; Hultin, T. Effects of potassium deficiency on mammalian ribosomes. Biochim. Biophys. Acta 1970, 204, 237–247. [Google Scholar] [CrossRef] [Scilit] [PubMed]
- Rozov, A.; Khusainov, I.; El Omari, K.; Duman, R.; Mykhaylyk, V.; Yusupov, M.; Westhof, E.; Wagner, A.; Yusupova, G. Importance of potassium ions for ribosome structure and function revealed by long-wavelength X-ray diffraction. Nat. Commun. 2019, 10, 2519. [Google Scholar] [CrossRef] [Scilit]
- Uday, A.B.; Mishra, R.K.; Hussain, T. Initiation factor 3 bound to the 30S ribosomal subunit in an initial step of translation. Proteins 2025, 93, 279–286. [Google Scholar] [CrossRef] [Scilit] [PubMed]
- De Smit, M.H.; Van Duin, J. Translational Standby Sites: How Ribosomes May Deal with the Rapid Folding Kinetics of mRNA. J. Mol. Biol. 2003, 331, 737–743. [Google Scholar] [CrossRef] [Scilit]
- Jay, G.; Abrams, W.R.; Kaempfer, R. Resistance of bacterial protein synthesis to double-stranded RNA. Biochem. Biophys. Res. Commun. 1974, 60, 1357–1364. [Google Scholar] [CrossRef] [Scilit]
- Katunin, V.I.; Semenkov, Y.P.; Makhno, V.I.; Kirillov, S.V. Comparative study of the interaction of polyuridylic acid with 30S subunits and 70S ribosomes of Escherichia coli. Nucleic Acids Res. 1980, 8, 403–421. [Google Scholar] [CrossRef] [Scilit] [PubMed]
- Evstafieva, A.G.; Shatsky, I.N.; Bogdanov, A.A.; Semenkov, Y.P.; Vasiliev, V.D. Localization of 5′ and 3′ ends of the ribosome-bound segment of template polynucleotides by immune electron microscopy. EMBO J. 1983, 2, 799–804. [Google Scholar] [CrossRef] [Scilit]
- Romilly, C.; Deindl, S.; Wagner, E.G.H. The ribosomal protein S1-dependent standby site in tisB mRNA consists of a single-stranded region and a 5′ structure element. Proc. Natl. Acad. Sci. USA 2019, 116, 15901–15906. [Google Scholar] [CrossRef] [Scilit] [PubMed]
- Hüttenhofer, A.; Noller, H.F. Footprinting mRNA-ribosome complexes with chemical probes. EMBO J. 1994, 13, 3892–3901. [Google Scholar] [CrossRef] [Scilit] [PubMed]
- Hussain, T.; Llácer, J.L.; Wimberly, B.T.; Kieft, J.S.; Ramakrishnan, V. Large-Scale Movements of IF3 and tRNA during Bacterial Translation Initiation. Cell 2016, 167, 133–144.e13. [Google Scholar] [CrossRef] [Scilit]
- Kaledhonkar, S.; Fu, Z.; Caban, K.; Li, W.; Chen, B.; Sun, M.; Gonzalez, R.L.; Frank, J. Late steps in bacterial translation initiation visualized using time-resolved cryo-EM. Nature 2019, 570, 400–404. [Google Scholar] [CrossRef] [Scilit]
- Yamamoto, H.; Wittek, D.; Gupta, R.; Qin, B.; Ueda, T.; Krause, R.; Pech, M.; Nierhaus, K.H. 70S-scanning initiation is a novel and frequent initiation mode of ribosomal translation in bacteria. Proc. Natl. Acad. Sci. USA 2016, 113, E1180–E1189. [Google Scholar] [CrossRef] [Scilit]
- Moll, I. Translation initiation with 70S ribosomes: An alternative pathway for leaderless mRNAs. Nucleic Acids Res. 2004, 32, 3354–3363. [Google Scholar] [CrossRef] [Scilit] [PubMed]
- Leiva, L.E.; Katz, A. Regulation of Leaderless mRNA Translation in Bacteria. Microorganisms 2022, 10, 723. [Google Scholar] [CrossRef] [Scilit] [PubMed]
- Gualerzi, C.O.; Brandi, L.; Caserta, E.; Garofalo, C.; Lammi, M.; La Teana, A.; Petrelli, D.; Spurio, R.; Tomsic, J.; Pon, C. Initiation Factors in the Early Events of mRNA Translation in Bacteria. Cold Spring Harb. Symp. Quant. Biol. 2001, 66, 363–376. [Google Scholar] [CrossRef] [Scilit] [PubMed]
- Boelens, R.; Gualerzi, C.O. Structure and Function of Bacterial Initiation Factors. Curr. Protein Pept. Sci. 2002, 3, 107–119. [Google Scholar] [CrossRef] [Scilit] [PubMed]
- Myasnikov, A.G.; Simonetti, A.; Marzi, S.; Klaholz, B.P. Structure–function insights into prokaryotic and eukaryotic translation initiation. Curr. Opin. Struct. Biol. 2009, 19, 300–309. [Google Scholar] [CrossRef] [Scilit]
- Simonetti, A.; Marzi, S.; Jenner, L.; Myasnikov, A.; Romby, P.; Yusupova, G.; Klaholz, B.P.; Yusupov, M. A structural view of translation initiation in bacteria. Cell. Mol. Life Sci. 2009, 66, 423–436. [Google Scholar] [CrossRef] [Scilit] [PubMed]
- Laursen, B.S.; Sørensen, H.P.; Mortensen, K.K.; Sperling-Petersen, H.U. Initiation of Protein Synthesis in Bacteria. Microbiol. Mol. Biol. Rev. 2005, 69, 101–123. [Google Scholar] [CrossRef] [Scilit]
- Allen, G.S.; Frank, J. Structural insights on the translation initiation complex: Ghosts of a universal initiation complex. Mol. Microbiol. 2007, 63, 941–950. [Google Scholar] [CrossRef] [Scilit]
- Julián, P.; Milon, P.; Agirrezabala, X.; Lasso, G.; Gil, D.; Rodnina, M.V.; Valle, M. The Cryo-EM Structure of a Complete 30S Translation Initiation Complex from Escherichia coli. PLoS Biol. 2011, 9, e1001095. [Google Scholar] [CrossRef] [Scilit] [PubMed]
- Goyal, A.; Belardinelli, R.; Maracci, C.; Milón, P.; Rodnina, M.V. Directional transition from initiation to elongation in bacterial translation. Nucleic Acids Res. 2015, 43, 10700–10712. [Google Scholar] [CrossRef] [Scilit]
- Yoo, J.; RajBhandary, U.L. Requirements for translation re-initiation in Escherichia coli: Roles of initiator tRNA and initiation factors IF2 and IF3. Mol. Microbiol. 2008, 67, 1012–1026. [Google Scholar] [CrossRef] [Scilit] [PubMed]
- Chemla, Y.; Peeri, M.; Heltberg, M.L.; Eichler, J.; Jensen, M.H.; Tuller, T.; Alfonta, L. mRNA secondary structure stability regulates bacterial translation insulation and re-initiation. bioRxiv 2020. [Google Scholar] [CrossRef] [Scilit]
- Flügel, T.; Schacherl, M.; Unbehaun, A.; Schroeer, B.; Dabrowski, M.; Bürger, J.; Mielke, T.; Sprink, T.; Diebolder, C.A.; Schlippe, Y.V.G.; et al. Transient disome complex formation in native polysomes during ongoing protein synthesis captured by cryo-EM. Nat. Commun. 2024, 15, 1756. [Google Scholar] [CrossRef] [Scilit]
- Tsai, Y.-J.; Lee, H.-I.; Lin, A. Ribosome Distribution in HeLa Cells during the Cell Cycle. PLoS ONE 2012, 7, e32820. [Google Scholar] [CrossRef] [Scilit]
- Bakshi, S.; Choi, H.; Weisshaar, J.C. The spatial biology of transcription and translation in rapidly growing Escherichia coli. Front. Microbiol. 2015, 6, 00636. [Google Scholar] [CrossRef] [Scilit]
- Simonetti, A.; Marzi, S.; Billas, I.M.L.; Tsai, A.; Fabbretti, A.; Myasnikov, A.G.; Roblin, P.; Vaiana, A.C.; Hazemann, I.; Eiler, D.; et al. Involvement of protein IF2 N domain in ribosomal subunit joining revealed from architecture and function of the full-length initiation factor. Proc. Natl. Acad. Sci. USA 2013, 110, 15656–15661. [Google Scholar] [CrossRef] [Scilit] [PubMed]
- Yu, T.; Jiang, J.; Yu, Q.; Li, X.; Zeng, F. Structural Insights into the Distortion of the Ribosomal Small Subunit at Different Magnesium Concentrations. Biomolecules 2023, 13, 566. [Google Scholar] [CrossRef] [Scilit]
- Laalami, S.; Sacerdot, C.; Vachon, G.; Mortensen, K.; Sperling-Petersen, H.U.; Cenatiempo, Y.; Grunberg-Manago, M. Structural and functional domains of E coli initiation factor IF2. Biochimie 1991, 73, 1557–1566. [Google Scholar] [CrossRef] [Scilit]
- Wilson, D.N. The A–Z of bacterial translation inhibitors. Crit. Rev. Biochem. Mol. Biol. 2009, 44, 393–433. [Google Scholar] [CrossRef] [Scilit] [PubMed]
- Wilson, D.N. Ribosome-targeting antibiotics and mechanisms of bacterial resistance. Nat. Rev. Microbiol. 2014, 12, 35–48. [Google Scholar] [CrossRef] [Scilit] [PubMed]
- Brandi, L.; Fabbretti, A.; La Teana, A.; Abbondi, M.; Losi, D.; Donadio, S.; Gualerzi, C.O. Specific, efficient, and selective inhibition of prokaryotic translation initiation by a novel peptide antibiotic. Proc. Natl. Acad. Sci. USA 2006, 103, 39–44. [Google Scholar] [CrossRef] [Scilit] [PubMed]
- Sutcliffe, J.A. Improving on nature: Antibiotics that target the ribosome. Curr. Opin. Microbiol. 2005, 8, 534–542. [Google Scholar] [CrossRef] [Scilit]
- Poehlsgaard, J.; Douthwaite, S. The bacterial ribosome as a target for antibiotics. Nat. Rev. Microbiol. 2005, 3, 870–881. [Google Scholar] [CrossRef] [Scilit] [PubMed]
- Tenson, T.; Mankin, A. Antibiotics and the ribosome. Mol. Microbiol. 2006, 59, 1664–1677. [Google Scholar] [CrossRef] [Scilit]
- Lin, J.; Zhou, D.; Steitz, T.A.; Polikanov, Y.S.; Gagnon, M.G. Ribosome-Targeting Antibiotics: Modes of Action, Mechanisms of Resistance, and Implications for Drug Design. Annu. Rev. Biochem. 2018, 87, 451–478. [Google Scholar] [CrossRef] [Scilit]
- Krawczyk, S.J.; Leśniczak-Staszak, M.; Gowin, E.; Szaflarski, W. Mechanistic Insights into Clinically Relevant Ribosome-Targeting Antibiotics. Biomolecules 2024, 14, 1263. [Google Scholar] [CrossRef] [Scilit]
- Gromadski, K.B.; Rodnina, M.V. Streptomycin interferes with conformational coupling between codon recognition and GTPase activation on the ribosome. Nat. Struct. Mol. Biol. 2004, 11, 316–322. [Google Scholar] [CrossRef] [Scilit]
- Biswas, D.K.; Gorini, L. The Attachment Site of Streptomycin to the 30S Ribosomal Subunit. Proc. Natl. Acad. Sci. USA 1972, 69, 2141–2144. [Google Scholar] [CrossRef] [Scilit]
- Demirci, H.; Murphy, F.; Murphy, E.; Gregory, S.T.; Dahlberg, A.E.; Jogl, G. A structural basis for streptomycin-induced misreading of the genetic code. Nat. Commun. 2013, 4, 1355. [Google Scholar] [CrossRef] [Scilit]
- Paternoga, H.; Crowe-McAuliffe, C.; Bock, L.V.; Koller, T.O.; Morici, M.; Beckert, B.; Myasnikov, A.G.; Grubmüller, H.; Nováček, J.; Wilson, D.N. Structural conservation of antibiotic interaction with ribosomes. Nat. Struct. Mol. Biol. 2023, 30, 1380–1392. [Google Scholar] [CrossRef] [Scilit] [PubMed]
- Chang, F.N.; Flaks, J.G. Binding of dihydrostreptomycin to Escherichia coli ribosomes: Characteristics and equilibrium of the reaction. Antimicrob. Agents Chemother. 1972, 2, 294–307. [Google Scholar] [CrossRef] [Scilit] [PubMed]
- Carter, A.P.; Clemons, W.M.; Brodersen, D.E.; Morgan-Warren, R.J.; Wimberly, B.T.; Ramakrishnan, V. Functional insights from the structure of the 30S ribosomal subunit and its interactions with antibiotics. Nature 2000, 407, 340–348. [Google Scholar] [CrossRef] [Scilit] [PubMed]
- Schlünzen, F.; Zarivach, R.; Harms, J.; Bashan, A.; Tocilj, A.; Albrecht, R.; Yonath, A.; Franceschi, F. Structural basis for the interaction of antibiotics with the peptidyl transferase centre in eubacteria. Nature 2001, 413, 814–821. [Google Scholar] [CrossRef] [Scilit] [PubMed]
- Sothiselvam, S.; Liu, B.; Han, W.; Ramu, H.; Klepacki, D.; Atkinson, G.C.; Brauer, A.; Remm, M.; Tenson, T.; Schulten, K.; et al. Macrolide antibiotics allosterically predispose the ribosome for translation arrest. Proc. Natl. Acad. Sci. USA 2014, 111, 9804–9809. [Google Scholar] [CrossRef] [Scilit]
- Vester, B.; Douthwaite, S. Macrolide Resistance Conferred by Base Substitutions in 23S rRNA. Antimicrob. Agents Chemother. 2001, 45, 1–12. [Google Scholar] [CrossRef] [Scilit]
- Pichkur, E.B.; Paleskava, A.; Tereshchenkov, A.G.; Kasatsky, P.; Komarova, E.S.; Shiriaev, D.I.; Bogdanov, A.A.; Dontsova, O.A.; Osterman, I.A.; Sergiev, P.V.; et al. Insights into the improved macrolide inhibitory activity from the high-resolution cryo-EM structure of dirithromycin bound to the E. coli 70S ribosome. RNA 2020, 26, 715–723. [Google Scholar] [CrossRef] [Scilit] [PubMed]
- Stanley, R.E.; Blaha, G.; Grodzicki, R.L.; Strickler, M.D.; Steitz, T.A. The structures of the anti-tuberculosis antibiotics viomycin and capreomycin bound to the 70S ribosome. Nat. Struct. Mol. Biol. 2010, 17, 289–293. [Google Scholar] [CrossRef] [Scilit] [PubMed]
- Holm, M.; Borg, A.; Ehrenberg, M.; Sanyal, S. Molecular mechanism of viomycin inhibition of peptide elongation in bacteria. Proc. Natl. Acad. Sci. USA 2016, 113, 978–983. [Google Scholar] [CrossRef] [Scilit] [PubMed]
- Zhang, L.; Wang, Y.-H.; Zhang, X.; Lancaster, L.; Zhou, J.; Noller, H.F. The structural basis for inhibition of ribosomal translocation by viomycin. Proc. Natl. Acad. Sci. USA 2020, 117, 10271–10277. [Google Scholar] [CrossRef] [Scilit]
- Carter, S.D.; Hampton, C.M.; Langlois, R.; Melero, R.; Farino, Z.J.; Calderon, M.J.; Li, W.; Wallace, C.T.; Tran, N.H.; Grassucci, R.A.; et al. Ribosome-associated vesicles: A dynamic subcompartment of the endoplasmic reticulum in secretory cells. Sci. Adv. 2020, 6, eaay9572. [Google Scholar] [CrossRef] [Scilit]
- Borovinskaya, M.A.; Shoji, S.; Holton, J.M.; Fredrick, K.; Cate, J.H.D. A Steric Block in Translation Caused by the Antibiotic Spectinomycin. ACS Chem. Biol. 2007, 2, 545–552. [Google Scholar] [CrossRef] [Scilit]
- Borovinskaya, M.A.; Shoji, S.; Fredrick, K.; Cate, J.H.D. Structural basis for hygromycin B inhibition of protein biosynthesis. RNA 2008, 14, 1590–1599. [Google Scholar] [CrossRef] [Scilit]
- Peske, F.; Savelsbergh, A.; Katunin, V.I.; Rodnina, M.V.; Wintermeyer, W. Conformational Changes of the Small Ribosomal Subunit During Elongation Factor G-dependent tRNA–mRNA Translocation. J. Mol. Biol. 2004, 343, 1183–1194. [Google Scholar] [CrossRef] [Scilit] [PubMed]
- Hanh, B.T.B.; Kim, T.H.; Park, J.-W.; Lee, D.-G.; Kim, J.-S.; Du, Y.E.; Yang, C.-S.; Oh, D.-C.; Jang, J. Etamycin as a Novel Mycobacterium abscessus Inhibitor. Int. J. Mol. Sci. 2020, 21, 6908. [Google Scholar] [CrossRef] [Scilit]
- Umezawa, H.; Hamada, M.; Suhara, Y.; Hashimoto, T.; Ikekawa, T. Kasugamycin, a new antibiotic. Antimicrob. Agents Chemother. 1965, 5, 753–757. [Google Scholar]
- Schuwirth, B.S.; Day, J.M.; Hau, C.W.; Janssen, G.R.; Dahlberg, A.E.; Cate, J.H.D.; Vila-Sanjurjo, A. Structural analysis of kasugamycin inhibition of translation. Nat. Struct. Mol. Biol. 2009, 13, 879–886. [Google Scholar] [CrossRef] [Scilit]
- Safdari, H.A.; Morici, M.; Sanchez-Castro, A.; Dallapè, A.; Paternoga, H.; Giuliodori, A.N.; Fabbretti, A.; Milón, P.; Wilson, D.N. The translation inhibitors kasugamycin, edeine and GE81112 target distinct steps during 30S initiation complex formation. Nat. Commun. 2025, 16, 2470. [Google Scholar] [CrossRef] [Scilit] [PubMed]
- Kaldalu, N.; Mei, R.; Lewis, K. Killing by Ampicillin and Ofloxacin Induces Overlapping Changes in Escherichia coli Transcription Profile. Antimicrob. Agents Chemother. 2004, 48, 890–896. [Google Scholar] [CrossRef] [Scilit] [PubMed]
- Jiang, M.; Su, Y.; Ye, J.; Li, H.; Kuang, S.; Wu, J.; Li, S.; Peng, X.; Peng, B. Ampicillin-controlled glucose metabolism manipulates the transition from tolerance to resistance in bacteria. Sci. Adv. 2023, 9, eade8582. [Google Scholar] [CrossRef] [Scilit]
- Tuerk, C.; Gold, L. Systematic evolution of ligands by exponential enrichment: RNA ligands to bacteriophage T4 DNA polymerase. Science 1990, 249, 505–510. [Google Scholar] [CrossRef] [Scilit]
- Peñaranda, K.; Pereira, N.; Savva, O.; Petrelli, D.; Spurio, R.; Corrigan, R.M.; Milon, P. DNA aptamer AptERA 2 targets ERA from Staphylococcus aureus and limits GTP hydrolysis. Sci. Rep. 2025, 15, 30879. [Google Scholar] [CrossRef] [Scilit]
- Milon, P.; Penaranda, K.; Sanchez-Castro, A. Synthetic Aptamers for the Detection of the Biomarker IF2 wt and IF2 ctd of Escherichia coli. Patent PE20190573A1, 12 March 2019. [Google Scholar]
- Tincho, M.B.; Morris, T.; Meyer, M.; Pretorius, A. Antibacterial Activity of Rationally Designed Antimicrobial Peptides. Int. J. Microbiol. 2020, 2131535. [Google Scholar] [CrossRef] [Scilit]
- Huan, Y.; Kong, Q.; Mou, H.; Yi, H. Antimicrobial Peptides: Classification, Design, Application and Research Progress in Multiple Fields. Front. Microbiol. 2020, 11, 582779. [Google Scholar] [CrossRef] [Scilit]
- Shulenina, O.V.; Tolstyko, E.A.; Konevega, A.L.; Paleskava, A. New Aspects of Protein Biosynthesis Inhibition by Proline-Rich Antimicrobial Peptides. Biochem. Mosc. 2025, 90, 1536–1552. [Google Scholar] [CrossRef] [Scilit]
- Panteleev, P.V.; Pichkur, E.B.; Kruglikov, R.N.; Paleskava, A.; Shulenina, O.V.; Bolosov, I.A.; Bogdanov, I.V.; Safronova, V.N.; Balandin, S.V.; Marina, V.I.; et al. Rumicidins are a family of mammalian host-defense peptides plugging the 70S ribosome exit tunnel. Nat. Commun. 2024, 15, 8925. [Google Scholar] [CrossRef] [Scilit]
- Duhr, S.; Braun, D. Why molecules move along a temperature gradient. Proc. Natl. Acad. Sci. USA 2006, 103, 19678–19682. [Google Scholar] [CrossRef] [Scilit]
- Magnez, R.; Bailly, C.; Thuru, X. Microscale Thermophoresis as a Tool to Study Protein Interactions and Their Implication in Human Diseases. Int. J. Mol. Sci. 2022, 23, 7672. [Google Scholar] [CrossRef] [Scilit]
- Seidel, S.A.I.; Wienken, C.J.; Geissler, S.; Jerabek-Willemsen, M.; Duhr, S.; Reiter, A.; Trauner, D.; Braun, D.; Baaske, P. Label-Free Microscale Thermophoresis Discriminates Sites and Affinity of Protein–Ligand Binding. Angew. Chem. Int. Ed. 2012, 51, 10656–10659. [Google Scholar] [CrossRef] [Scilit]
- Roy, B.; Liu, Q.; Shoji, S.; Fredrick, K. IF2 and unique features of initiator tRNAfMet help establish the translational reading frame. RNA Biol. 2018, 15, 604–613. [Google Scholar] [CrossRef] [Scilit]
- Chulluncuy, R.; Espiche, C.; Nakamoto, J.; Fabbretti, A.; Milón, P. Conformational Response of 30S-bound IF3 to A-Site Binders Streptomycin and Kanamycin. Antibiotics 2016, 5, 38. [Google Scholar] [CrossRef] [Scilit]
- Fei, J.; Wang, J.; Sternberg, S.H.; MacDougall, D.D.; Elvekrog, M.M.; Pulukkunat, D.K.; Englander, M.T.; Gonzalez, R.L. A Highly Purified, Fluorescently Labeled In Vitro Translation System for Single-Molecule Studies of Protein Synthesis. Methods Enzymol. 2010, 472, 221–259. [Google Scholar] [CrossRef] [Scilit]
- Szkaradkiewicz, K.; Zuleeg, T.; Limmer, S.; Sprinzl, M. Interaction of fMet-tRNAfMet and fMet-AMP with the C-terminal domain of Thermus thermophilus translation initiation factor 2. Eur. J. Biochem. 2000, 267, 4290–4299. [Google Scholar] [CrossRef]
- Warner, B.R.; Fredrick, K. Contribution of an alternative 16S rRNA helix to biogenesis of the 30S subunit of the ribosome. RNA 2024, 30, 770–778. [Google Scholar] [CrossRef] [Scilit]
- Abeysirigunawardena, S.C.; Woodson, S.A. Differential effects of ribosomal proteins and Mg2+ ions on a conformational switch during 30S ribosome 5′-domain assembly. RNA 2015, 21, 1859–1865. [Google Scholar] [CrossRef] [Scilit]
- Connolly, K.; Culver, G. Overexpression of RbfA in the absence of the KsgA checkpoint results in impaired translation initiation. Mol. Microbiol. 2013, 87, 968–981. [Google Scholar] [CrossRef] [Scilit]
- Davis, J.H.; Williamson, J.R. Structure and dynamics of bacterial ribosome biogenesis. Philos. Trans. R. Soc. B Biol. Sci. 2017, 372, 20160181. [Google Scholar] [CrossRef] [Scilit]
- Klein, D.J.; Moore, P.B.; Steitz, T.A. The contribution of metal ions to the structural stability of the large ribosomal subunit. RNA 2004, 10, 1366–1379. [Google Scholar] [CrossRef] [Scilit]
- Nissen, P.; Ippolito, J.A.; Ban, N.; Moore, P.B.; Steitz, T.A. RNA tertiary interactions in the large ribosomal subunit: The A-minor motif. Proc. Natl. Acad. Sci. USA 2001, 98, 4899–4903. [Google Scholar] [CrossRef] [Scilit]
- Zitomer, R.S.; Flaks, J.G. Magnesium dependence and equilibrium of the Escherichia coli ribosomal subunit association. J. Mol. Biol. 1972, 71, 263–279. [Google Scholar] [CrossRef] [Scilit]
- Sanchez-Castro, A.; Peñaranda, K.; Dallapè, A.; Safdari, H.A.; Nakamoto, J.A.; Morici, M.; Vinogradova, D.S.; Paleskava, A.; Wilson, D.N.; Konevega, A.L.; et al. Blocking IF3N delays bacterial translation initiation. bioRxiv 2025. [Google Scholar] [CrossRef] [Scilit]
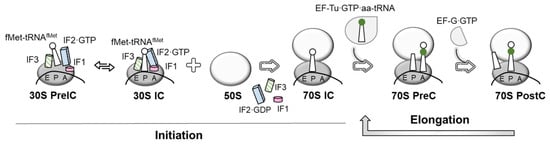
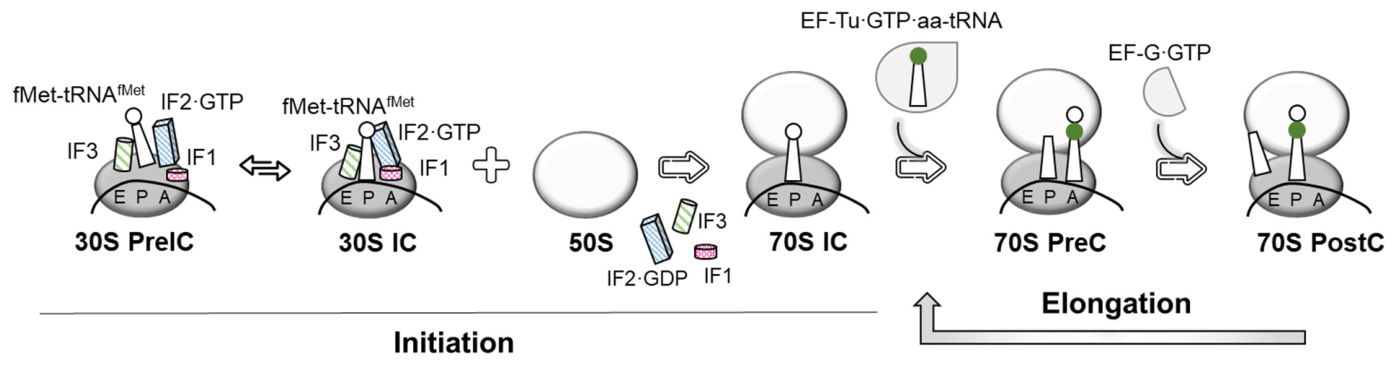
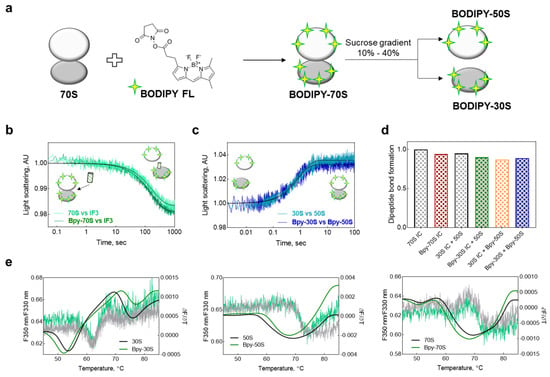
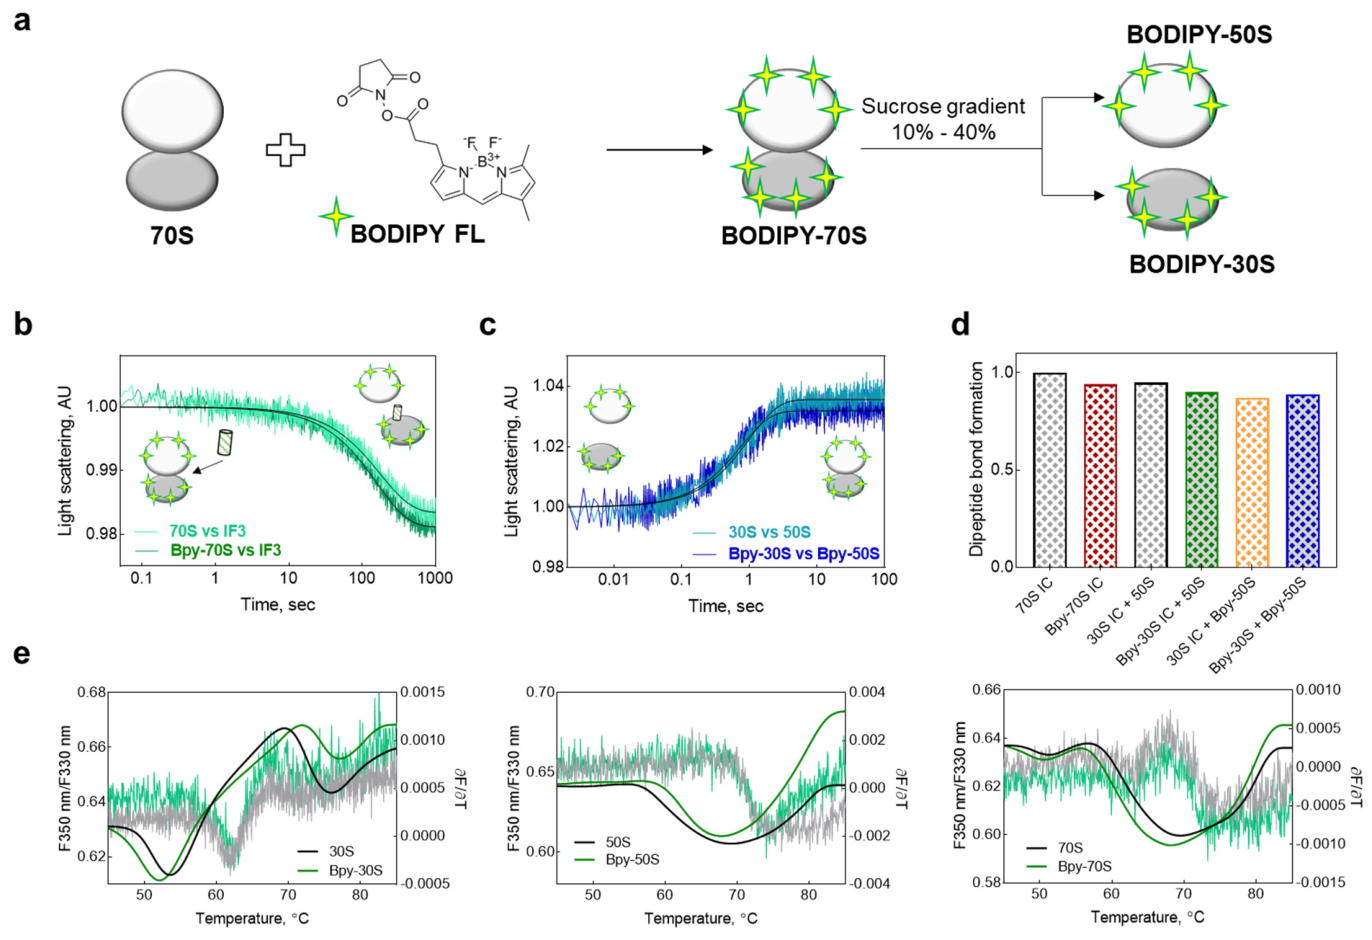
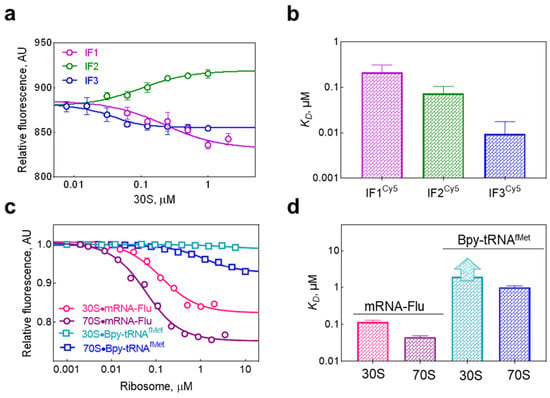
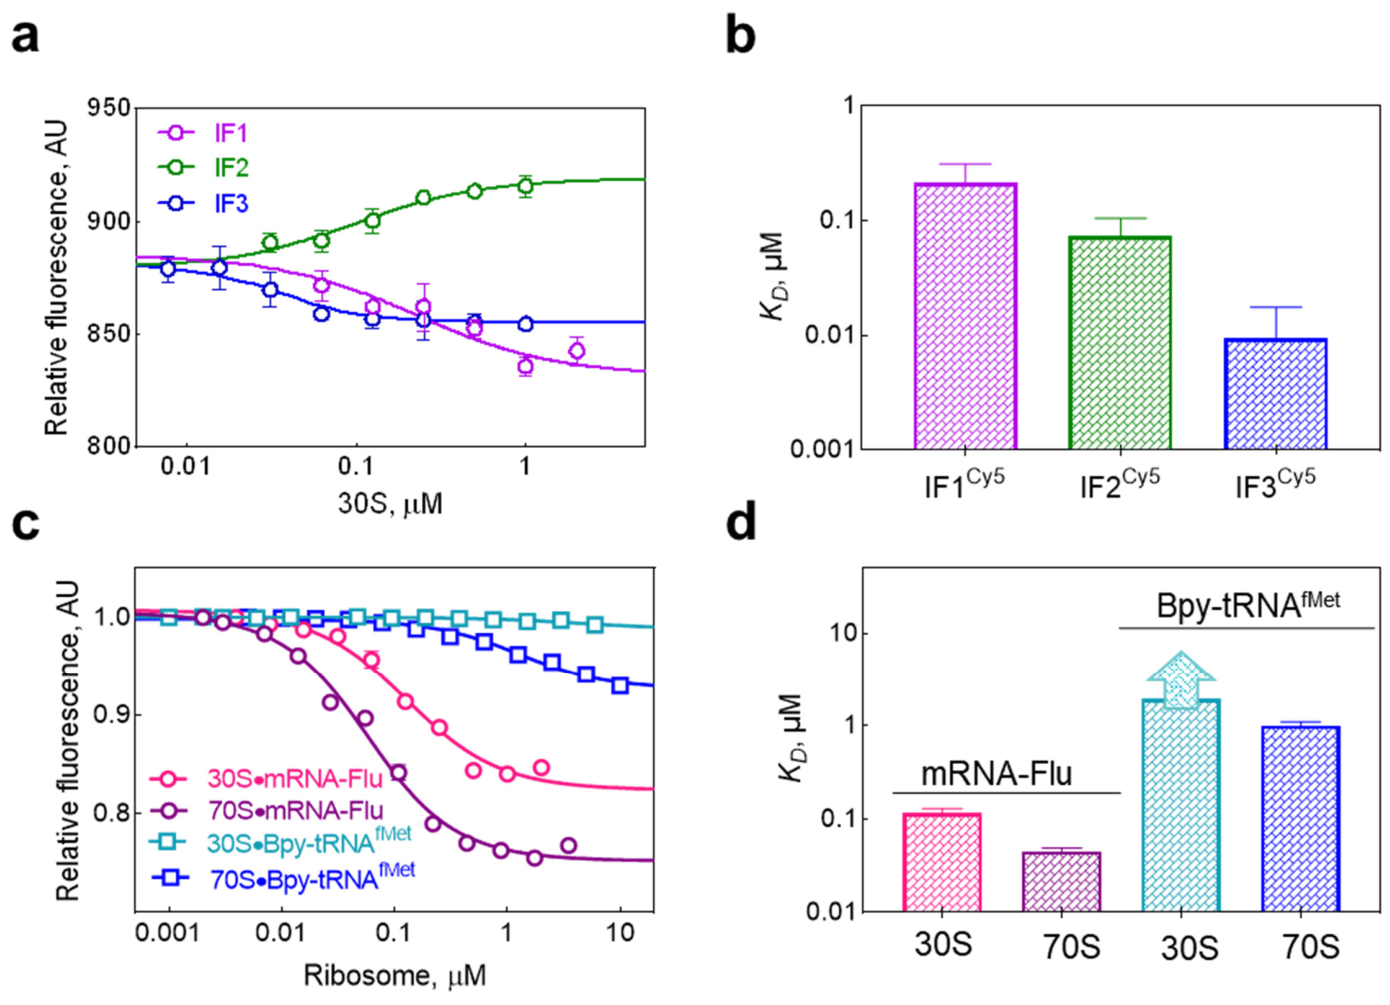
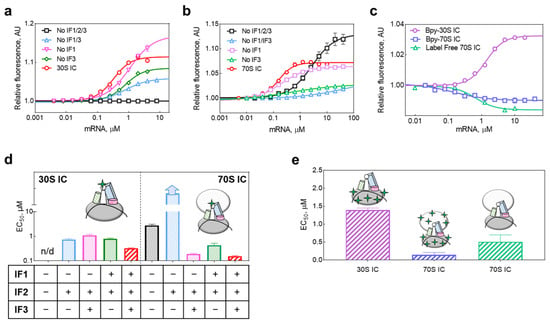
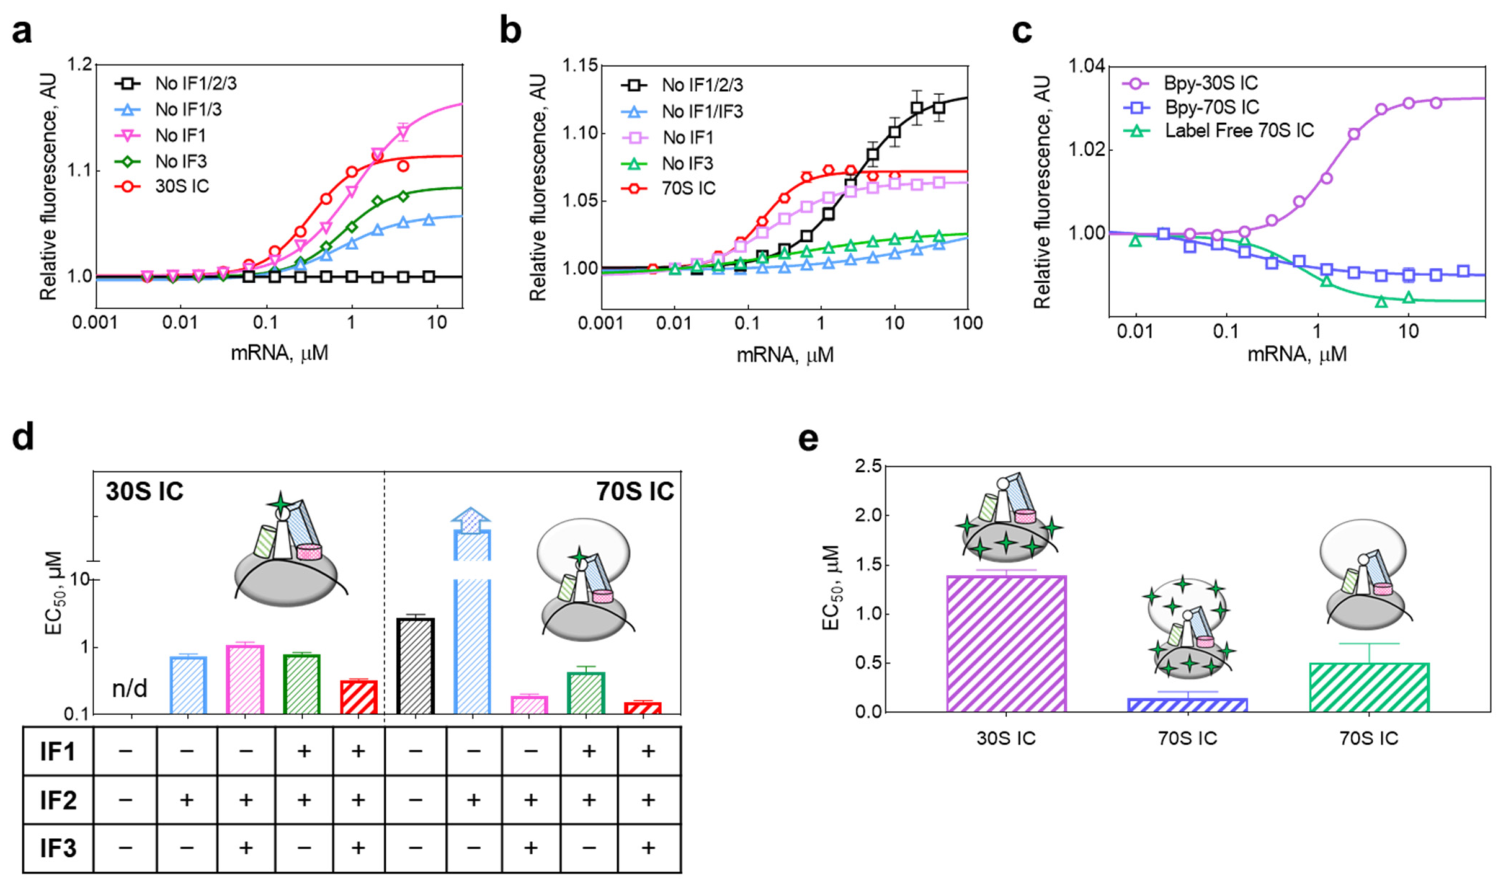
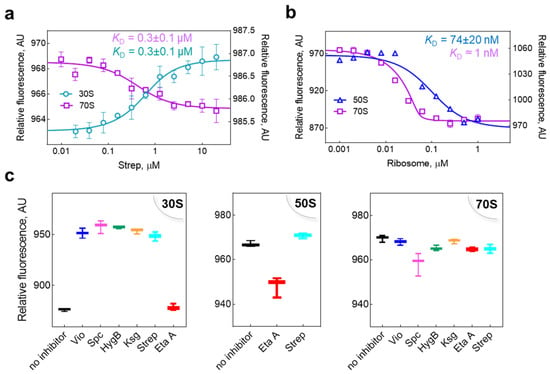
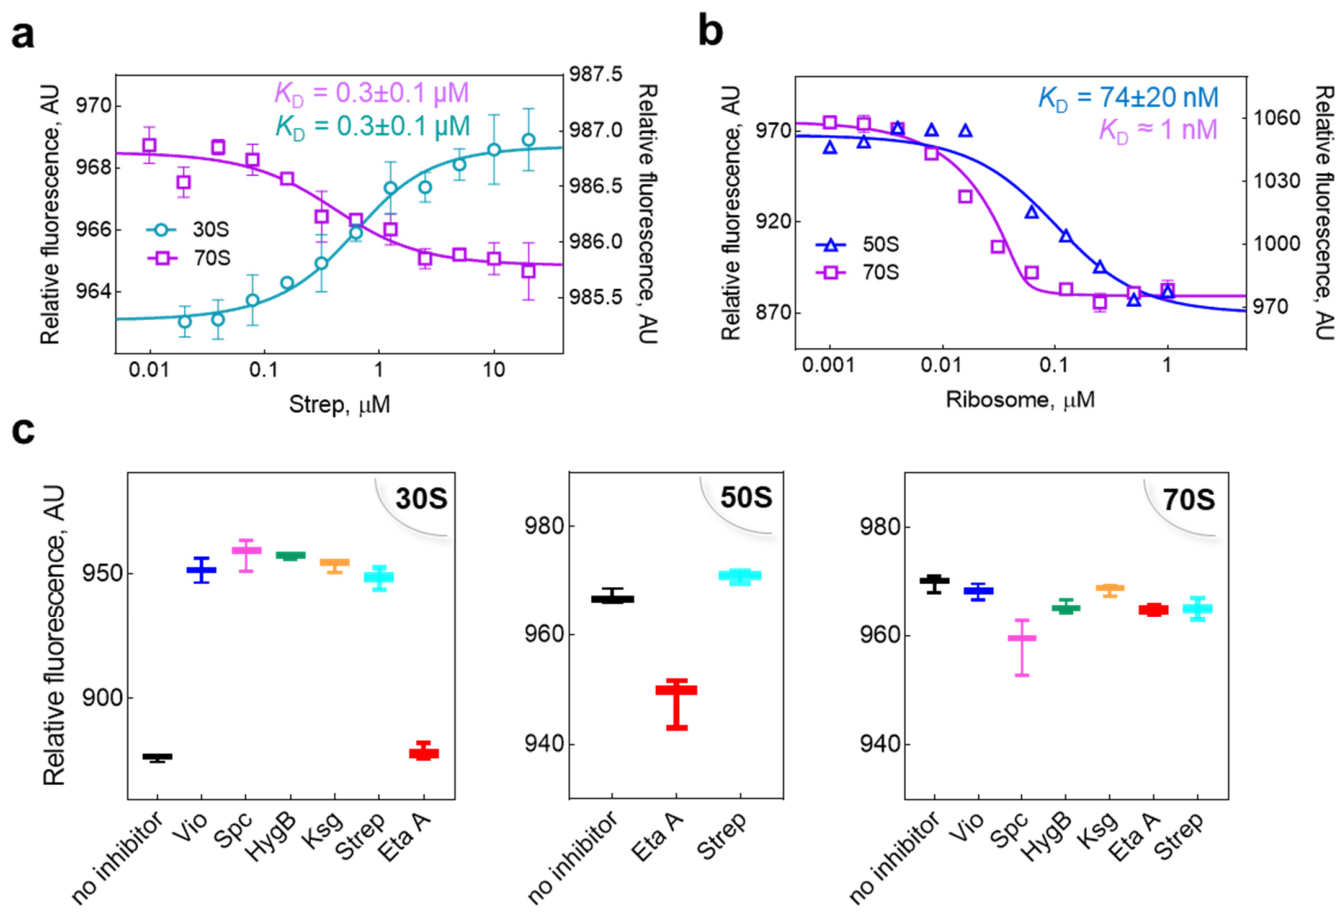
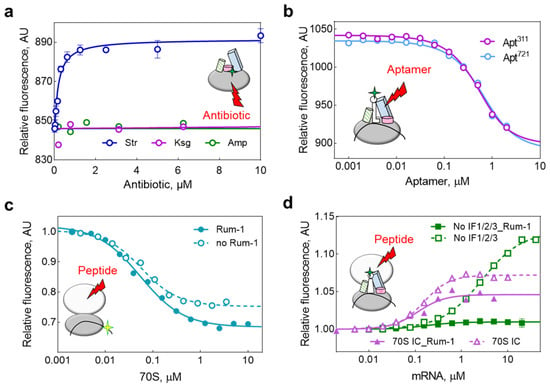
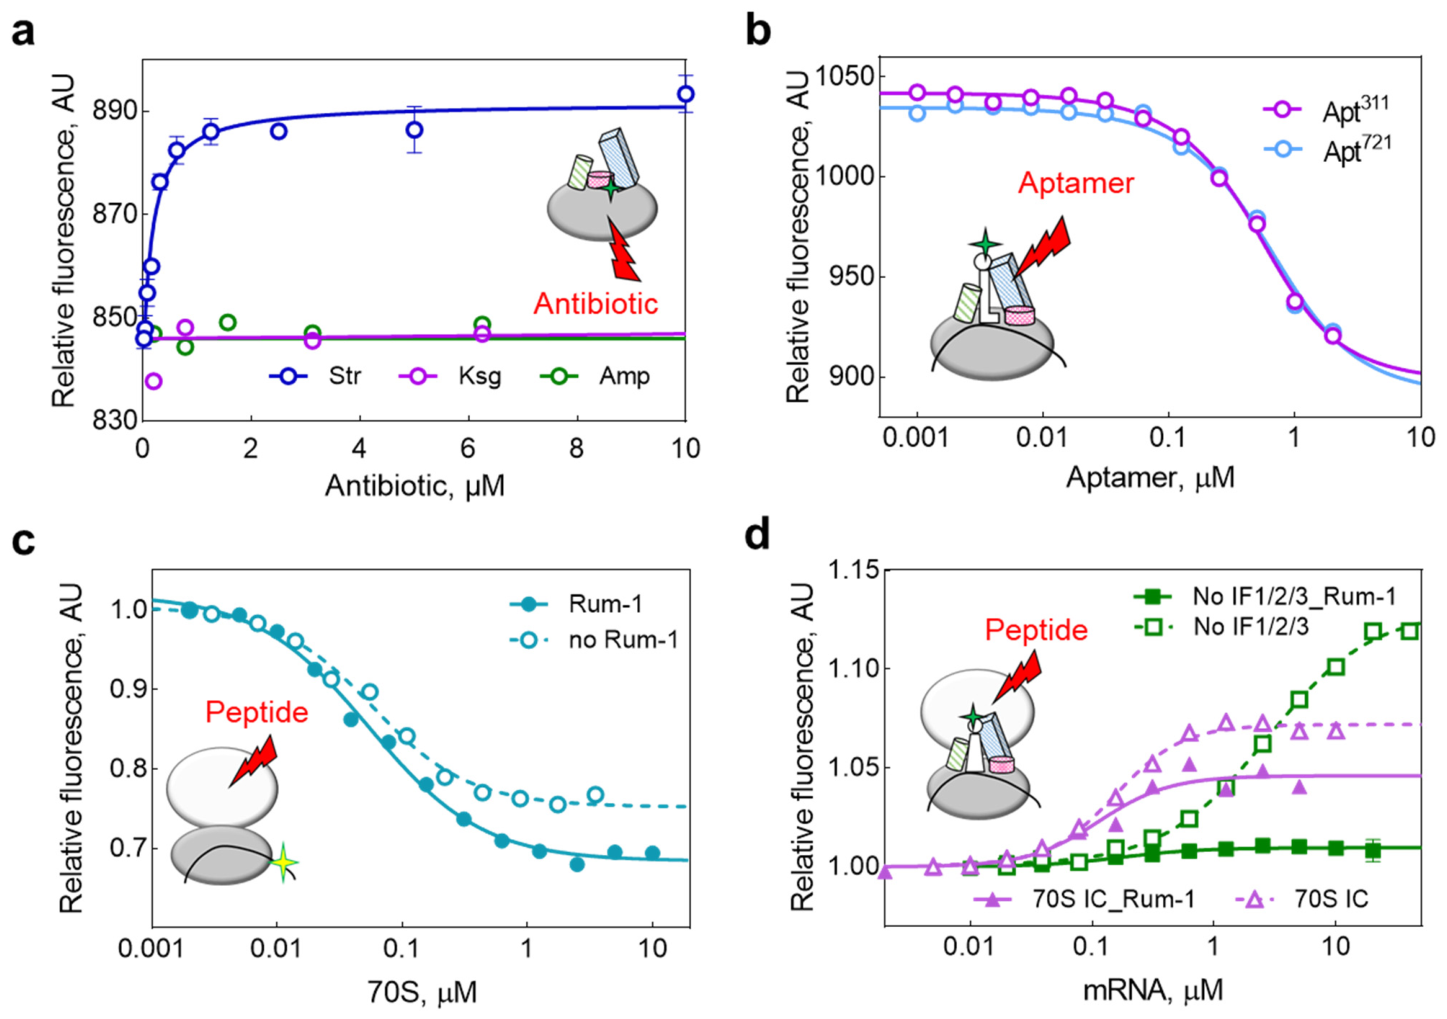
Disclaimer/Publisher’s Note: The statements, opinions and data contained in all publications are solely those of the individual author(s) and contributor(s) and not of MDPI and/or the editor(s). MDPI and/or the editor(s) disclaim responsibility for any injury to people or property resulting from any ideas, methods, instructions or products referred to in the content. |
© 2026 by the authors. Licensee MDPI, Basel, Switzerland. This article is an open access article distributed under the terms and conditions of the Creative Commons Attribution (CC BY) license.