


Abstract
Molecular self–assembly offers a versatile route to two–dimensional carbon nanomembranes (CNMs) for selective ion transport and salinity–gradient energy conversion. However, efficiently harvesting this abundant blue energy resource remains challenging. Here, porous freestanding CNMs were prepared from self–assembled terphenyl–4–carboxylic acid (TPC) monolayers by electron–induced cross–-linking. Before self–assembly, silver was electrochemically deposited on gold substrates to provide a coordination surface for the formation of TPC precursor monolayers. Spectroscopy showed chemical changes in the molecular layers after irradiation. Electron microscopy confirmed that the membranes were continuous and sufficiently intact to remain freestanding. The osmotic energy conversion performance of the membranes was measured under different KCl concentration gradients. Increasing the concentration ratio raised the estimated maximum power density from 1.5 to 4.3 W m−2, supporting the potential of TPC–derived CNMs for osmotic energy conversion. Molecular self–assembly followed by electron–induced cross–linking therefore offers a route to two–dimensional carbon membranes for osmotic energy harvesting.
1. Introduction
Osmotic energy, also known as “blue energy”, originates from the Gibbs free energy released upon mixing solutions of different salinities, such as seawater and freshwater, and represents an abundant and sustainable resource for electricity generation without direct carbon emissions [1,2]. Ion–selective membranes enable the conversion of this energy into electricity through the preferential transport of cations or anions across a membrane separating solutions of different concentrations [3]. Ion–selective membranes harvest osmotic energy by preferentially transporting cations or anions between solutions of different concentrations [4]. The potential difference across the membrane drives current in an external circuit. Conventional ion–exchange membranes continue to constrain energy conversion, with reported system power densities of approximately 2.2 W m−2 remaining below the 5 W m−2 benchmark for commercial applications. Improved performance requires high ion flux and selectivity without sacrificing membrane strength [5,6,7].
Fabrication of conventional separation membranes can be costly and may involve toxic monomers and complex synthetic procedures. Precise control over pore architecture remains challenging [8,9,10,11]. A trade–off between ion selectivity and permeability further limits osmotic energy conversion. Two–dimensional nanochannel membranes offer tunable channel structures and surface chemistry for regulating ion transport. Suitable membrane materials include molybdenum disulfide (MoS2) [12] as well as MXenes [13,14] and metal–organic frameworks (MOFs) [15]. For example, Zhou et al. reported a power density of 6.48 W m−2 for a MoS2/cotton nanofiber composite membrane under a 50–fold NaCl concentration gradient [16]. A bioinspired MXene–based composite membrane reached a power density of 126 W m−2. The asymmetric channel sizes and surface potentials of the MXene–based membrane promoted rapid directional cation transport while substantially reducing the transport energy barrier [13]. Both studies demonstrate improvements in osmotic energy conversion through nanochannel engineering. Structural stability nevertheless remains a concern for many membranes assembled from two–dimensional materials. The constituent layers of assembled membranes are bound by noncovalent interactions such as van der Waals forces and hydrogen bonds. Hydrodynamic shear, high salinity or prolonged immersion may induce layer separation or swelling, compromising structural integrity and altering channel dimensions. Stable channels for nanoconfined ion transport therefore require spatially controlled membrane networks rather than disordered assemblies.
Carbon nanomembranes (CNMs) are freestanding two–dimensional carbon materials with a typical thickness of about 1 to few nanometers [17,18]. Aromatic self–assembled monolayers (SAMs) serve as CNM precursors whose molecular composition and packing define the initial film, while electron irradiation induces lateral cross–linking to form a network [19]. The resulting CNMs combine molecular–scale thickness with tunable surface chemistry. Transport pathways can thus be tailored chemically through a bottom–up process rather than solely by stacking preformed nanosheets. Previous studies have reported rapid water permeation through CNMs, strong ion exclusion in terphenylthiol–derived membranes, and selective metal–ion transport through pyrene–derived membranes [20,21,22]. Thus, transport behavior varies among CNMs: precursor packing, irradiation–induced restructuring, interfacial groups, and transfer–related defects can all affect the accessible pathways. Applying CNMs to energy conversion requires an understanding of how the chemical transformations influence transport in aqueous solutions. Aromatic carboxylates are of interest because the anchoring chemistry of aromatic carboxylates differs from that of the widely studied aromatic thiols. Molecularly derived carbon membranes have also been investigated for osmotic energy conversion. Liu et al. demonstrated reverse electrodialysis using nanoporous membranes fabricated by thermal cross–linking of core–rim polycyclic aromatic hydrocarbon monomers [23]. And a previous study demonstrated that terphenyl–4–carboxylic acid (TPC) monolayers deposited on silver–coated gold substrates could be transformed into freestanding CNMs to characterize water transport properties [24]. Related studies showed that TPC molecules coordinate to electrodeposited silver through their carboxylate groups and form ordered monolayers with an upright molecular arrangement. These findings provide a structural basis for selecting silver–modified Au substrates for TPC self–assembly. However, the influence of silver deposition conditions on the pore structure and ionic transport properties of the cross–linked membranes remains to be explored.
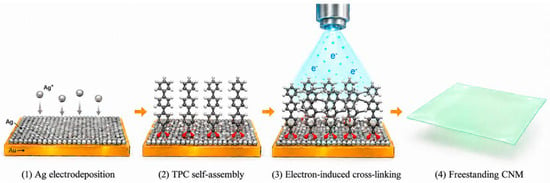
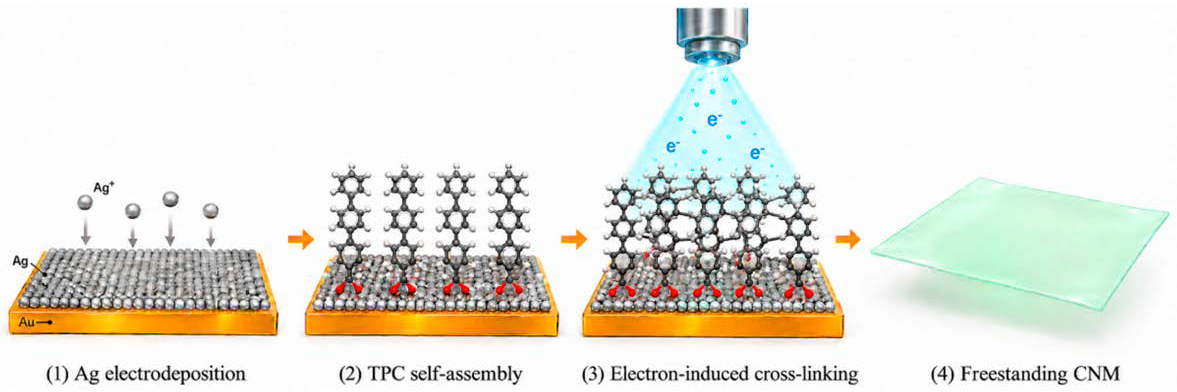
Here, TPC–derived CNMs were prepared by self–assembly and electron irradiation and evaluated as freestanding membranes for osmotic energy conversion (Figure 1). Chemical changes in the precursor monolayer were examined by polarization–modulation infrared reflection–absorption spectroscopy (PM–IRRAS) and X–ray photoelectron spectroscopy (XPS). Membrane coverage after transfer was assessed by helium ion microscopy (HIM), and ion transport in aqueous KCl was investigated by concentration–dependent electrical measurements. The membranes achieved an estimated maximum power density of 4.3 W m−2 under a 1000–fold concentration gradient, supporting the potential of the membranes for osmotic energy conversion. This work will extend the application of CNMs to osmotic energy conversion, broadening the functional scope of CNMs and contributing to the exploration of two–dimensional membranes for energy harvesting.
Figure 1.
Schematic illustration of TPC–derived CNM preparation: Ag electrodeposition on an Au/mica substrate, TPC self–assembly, electron–induced cross–linking, and release of the resulting freestanding membrane.
2. Results and Discussion
2.1. Chemical Transformation Revealed by PM–IRRAS and XPS
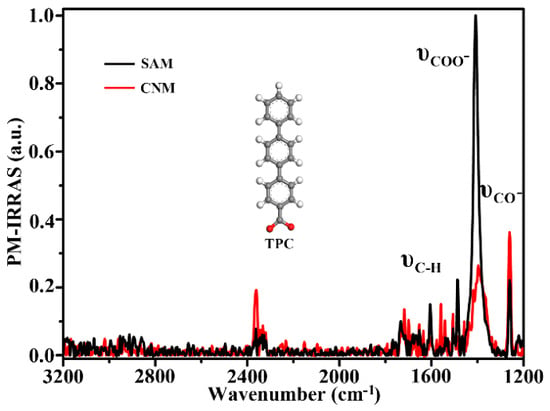
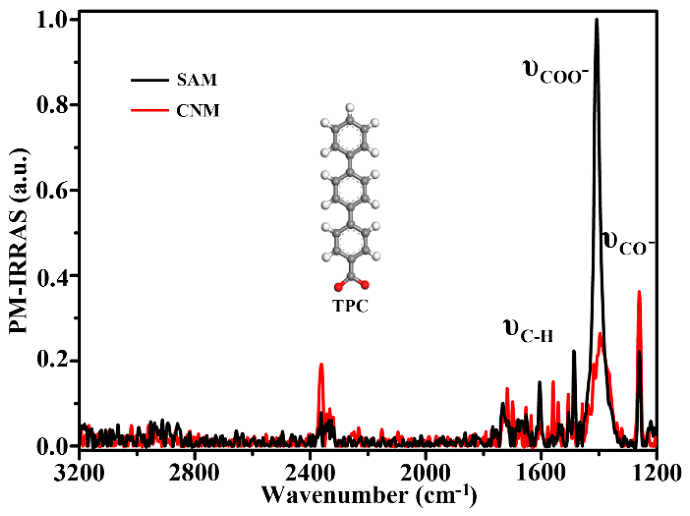
Figure 2 compares the PM–IRRAS spectra of the TPC SAM and the cross–linked CNM. The TPC–SAM spectrum is dominated by a narrow band near 1400 cm−1, consistent with the symmetric stretching vibration of a surface-bound carboxylate group [25,26]. The carboxylate (COO−) stretching band is markedly attenuated after irradiation, suggesting cleavage of bonds involving the carboxylate groups and substantial changes in chemical composition. Changes are also evident in the 1500–1600 cm−1 region, assigned here to aromatic skeletal vibrations, with the corresponding band nearly disappearing after irradiation. In addition, the feature near 1250 cm−1 becomes more pronounced after irradiation, possibly reflecting changes in C–O–related vibrational contributions associated with restructuring of the oxygen–containing groups [27]. Consistent with previous study, the decrease in the band intensities suggests substantial changes in molecular arrangement and chemical structure between TPC–SAM and CNM. The remaining characteristic bands nevertheless indicate that cross–linking preserves some precursor structural motifs without completely disrupting the molecular framework. Partial retention of the precursor structural features is an advantage of low–energy electron–induced cross–linking.
Figure 2.
PM–IRRAS spectra of the TPC SAM before electron irradiation and the resulting CNM after irradiation.
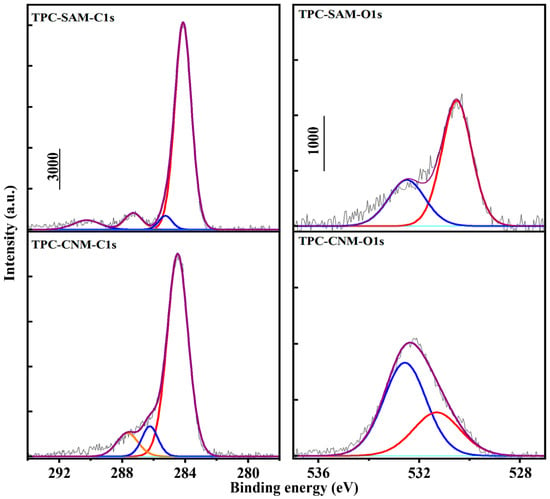
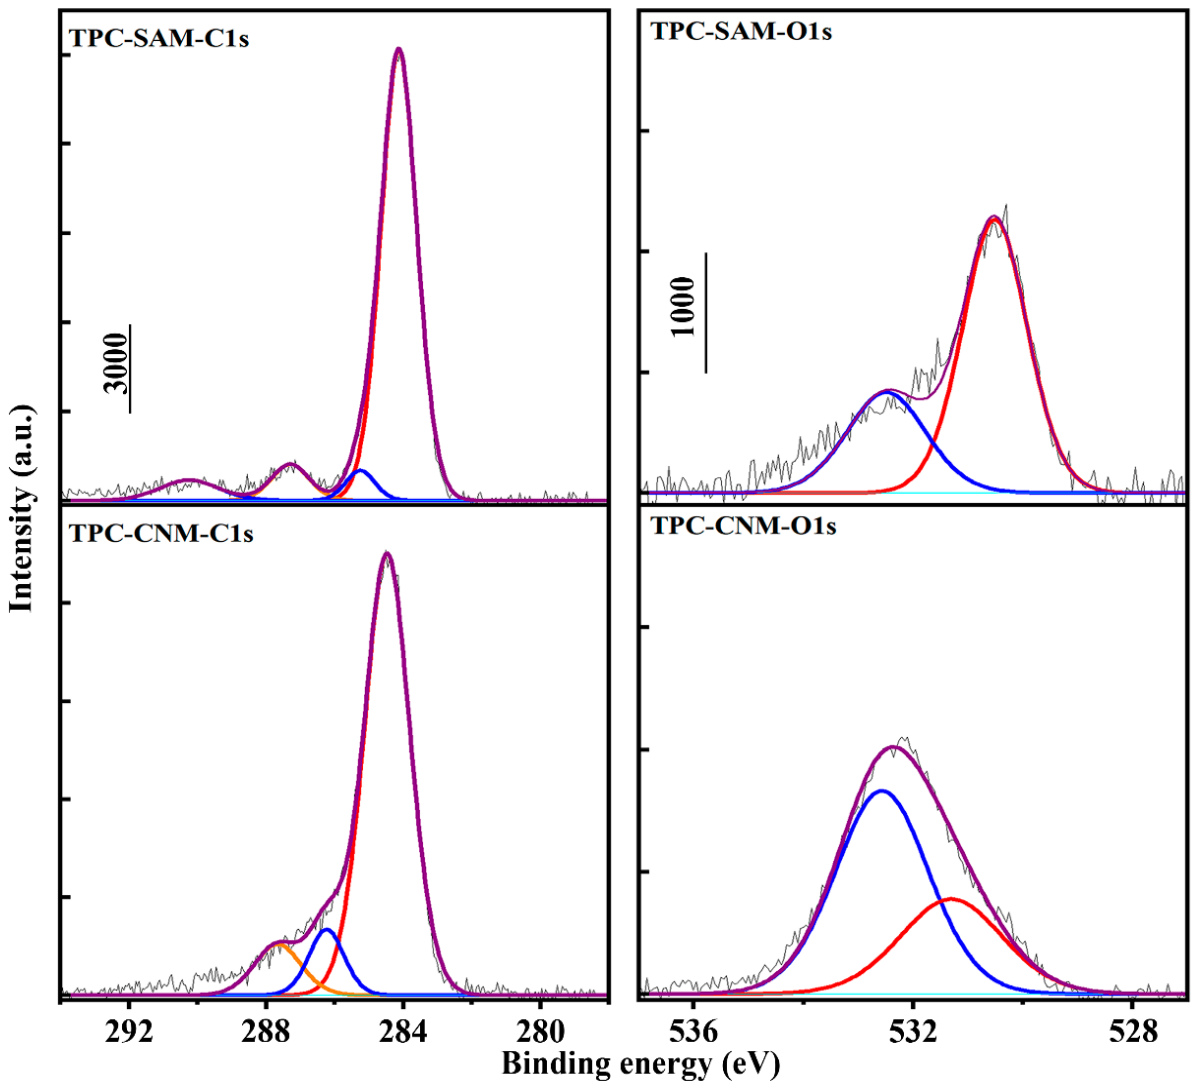
Figure 3 compares the high–resolution C 1s and O 1s XPS spectra of TPC sample before and after electron–induced cross–linking. Following irradiation, the dominant C 1s peak at 284.1 eV, associated primarily with aromatic carbon, shifts slightly toward higher binding energy around 284.3 eV, accompanied by a redistribution of intensity on its high–binding–energy side [28]. These changes suggest modifications to the local electronic environments within the terphenyl–derived framework, consistent with the IRRAS observations. The component near 287 eV in the pristine SAM can be associated with carboxylate carbon. After irradiation, however, overlapping contributions from chemically modified and oxygen–containing carbon sites in the 285–287 eV region complicate the independent assessment of this component. Although the main peak exhibits a modest decrease in height, the C 1s spectra profile remains dominated by carbon–carbon bonding environments, consistent with retention of a carbonaceous framework in the resulting CNM.
Figure 3.
High–resolution C 1s spectra and O 1s spectra of the TPC SAM and the TPC–derived CNM.
More obvious changes are observed in the O 1s spectra. The pristine TPC SAM exhibits a dominant peak at approximately 530.5 eV, attributable to oxygen in surface–coordinated carboxylate groups [29]. The weaker contribution between 532 and 533 eV may originate from adventitious oxygen–containing species introduced during exposure to ambient air and TPC molecules. Following irradiation, the low–binding–energy feature characteristic of the original carboxylate anchoring groups becomes less prominent, while a broad peak develops around 532.4 eV. The broad peak may tentatively be assigned to overlapping contributions from carbonyl or carboxylate groups with oxygen atoms no longer directly coordinated to the substrate. Other oxygen–containing functional groups may also contribute, as the breadth of the peak suggests multiple chemical environments of oxygen rather than a single well–defined species (Table S3).
Due to the irradiated samples were subsequently exposed to air, the enhanced high–binding–energy contribution may also reflect reactions of irradiation–generated reactive sites with atmospheric oxygen and water vapor. Such post–irradiation oxidation could contribute to the enhanced high–binding–energy signals in both the O 1s and C 1s spectra (Table S4), alongside changes associated with the transformation of the original carboxylate anchoring groups.
2.2. Morphology of Transferred Membranes
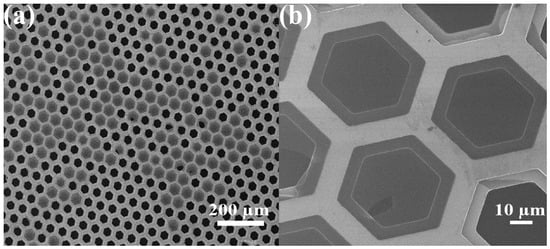
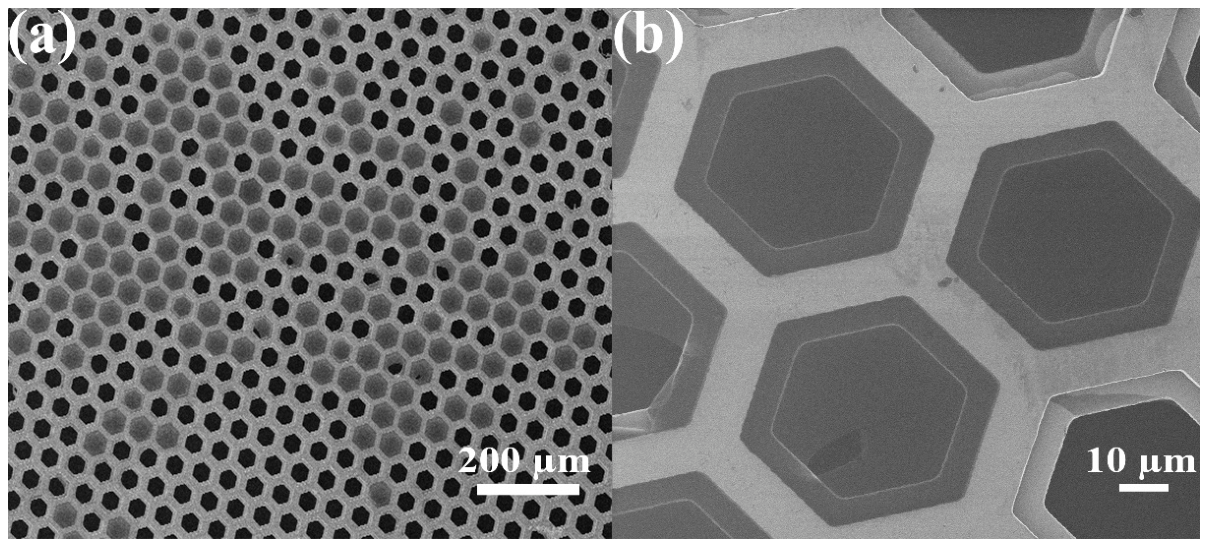
Figure 4 shows HIM images of TPC–derived CNMs after transferred onto a perforated TEM grid. At low–magnification image (Figure 4a), the membranes cover numerous support apertures and remain suspended across the openings. The CNMs bridge the openings and remain suspended, demonstrating sufficient mechanical integrity to withstand transfer and maintain a freestanding configuration. The sustained freestanding configuration is consistent with electron–induced cross–linking producing a cohesive film and supports the use of freestanding membranes in transport measurements. At higher–magnification image (Figure 4b) provides further insight into membrane continuity and local defects. Differences in contrast distinguish membrane–covered apertures from darker exposed regions, with localized openings and disrupted edges consistent with partial membrane rupture. Nevertheless, continuous suspended films remain visible across neighboring apertures, exhibiting relatively uniform contrast over micrometer–scale areas. Local folds near some aperture boundaries indicate slight deformation, while the surrounding membrane retains its structural integrity. The persistence of these suspended regions is consistent with extensive lateral connectivity within the cross–linked film. Combined with the IRRAS and XPS results, these morphological observations support the transformation of the original TPC monolayer into an interconnected carbon network capable of maintaining a continuous two–dimensional sheet across the support openings.
Figure 4.
HIM images of transferred TPC–derived CNMs at (a) low–magnification and (b) high–magnification.
2.3. Concentration–Dependent Ion Transport
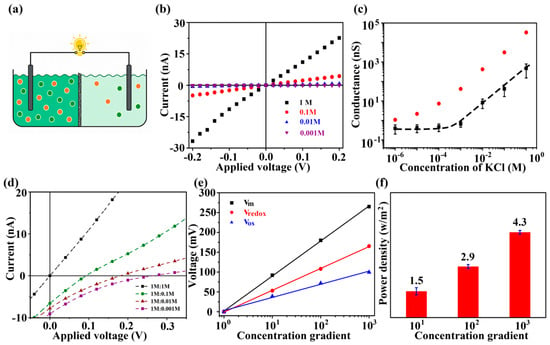
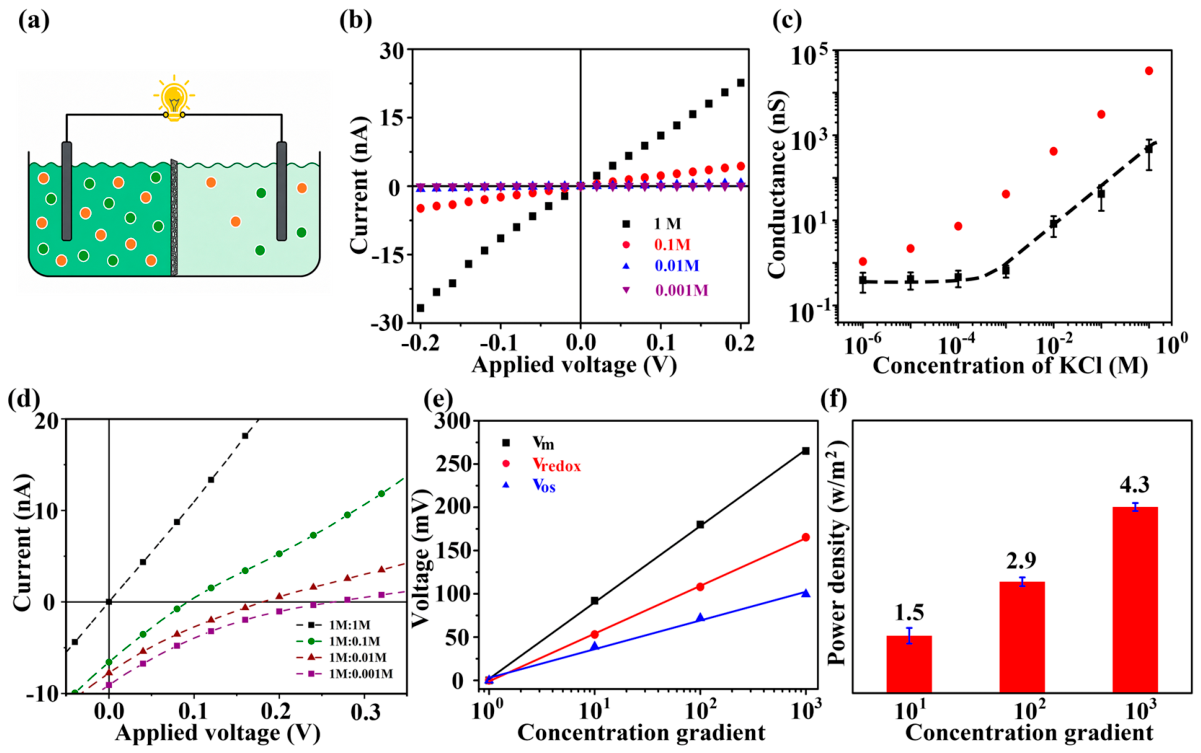
Figure 5 presents the ionic transport behavior and osmotic energy conversion performance for TPC–derived CNMs. The experimental configuration is illustrated in Figure 5a, where the membrane separates two electrolyte reservoirs connected through an external circuit. At equal electrolyte concentrations on both sides of the membrane, the I–V curves pass close to the origin and exhibit a nearly linear response, particularly near zero bias (Figure 5b). The current increases with KCl concentration as more mobile charge carriers become available. Accordingly, the ionic conductance can be determined from the slope of the I–V curves within their linear region. The concentration–dependent conductance provides further insight into transport through the membrane (Figure 5c). Compared with the membrane–free reference, the TPC–CNM exhibits substantially lower conductance, indicating additional resistance associated with ion passage through the membrane. This ions transport behavior attributed to the restricted ion accessibility and interactions within confined transport pathways. At higher electrolyte concentrations, the membrane conductance increases strongly with concentration, whereas a weakly concentration–dependent plateau emerges at approximately 10−5–10−3 M. This departure from bulk–like behavior is consistent with an increasing contribution from possible surface–charge–regulated transport [30]. This observation alone, however, does not establish surface–charge–governed transport. At 10−6 M, the measured conductance approaches the experimental background and cannot support a reliable mechanistic interpretation. Accordingly, quantitative analysis is restricted to the concentration range of 10−5–1 M. Similar conductance plateaus have been observed in charged nanofluidic channels [31]. Ionizable oxygen–containing groups in TPC–CNMs may impart negative surface charge to the membrane, thereby facilitating rapid K+ transport and promoting Cl– exclusion [32].
Figure 5.
Ion transport and osmotic energy conversion through TPC–derived CNMs. (a) Schematic of the two–reservoir device. (b) Current–voltage responses at different KCl concentrations. (c) Conductance as a function of KCl concentration for the CNM–covered aperture and the membrane–free reference support. (d) Current–voltage curves under different concentration gradient. (e) Measured voltage as a function of concentration gradient. (f) Estimated maximum power densities at concentration ratios of 10, 100, and 1000.
The response to salinity gradients was subsequently investigated by maintaining the concentrated reservoir at 1 M KCl while decreasing the concentration in the opposite reservoir (Figure 5d). Equal concentrations of 1 M/1 M give an I–V curve that passes close to the origin. Introducing a concentration difference shifts the curves, producing finite current and voltage intercepts. The slopes of the curves decrease as the effective resistance of the membrane–electrolyte system increases. Lower conductivity in the dilute reservoir and altered ion availability within the pathways are consistent with the increase in effective resistance. Preferential transport of cation species under a chemical potential gradient generates charge separation and an opposing electric field. At open circuit, the resulting migration current balances the diffusion current, yielding a finite diffusion potential. Due to the measured voltage also contains an electrode contribution, the membrane–generated osmotic voltage must be distinguished from the total cell voltage. As shown in Figure 5e, the osmotic voltage is obtained by subtracting the electrode redox potential contribution (Table S1) from the measured voltage. After correction, osmotic voltage rises approximately linearly with the logarithm of the concentration ratio. The voltage–concentration relation is consistent with a diffusion potential that grows with the difference in ionic chemical potential and supports selective ion transport under the conditions examined. At a concentration ratio of 1000, the Vm is approximately 265 mV and the corrected membrane–associated Vos is approximately 99.56 mV. The corrected Vos is approximately 39 mV at a concentration ratio of 10 and 72 mV at a ratio of 100. The estimated maximum power densities summarized in Figure 5f are 1.5, 2.9, and 4.3 W m−2 at concentration ratios of 10, 100, and 1000, respectively (Table S2). The increase in electrical output is assigned to the stronger chemical–potential driving force at larger gradients. The approximately 2.9–fold increase across this range reflects the stronger driving force available for energy conversion at larger salinity differences. Although dilution increases the effective resistance, the accompanying increase in osmotic voltage can compensate for this transport penalty and enhance the electrical output. The observed performance therefore reflects the combined effects of membrane selectivity, ionic resistance, and the imposed concentration gradient [33].
2.4. Stability of TPC CNM
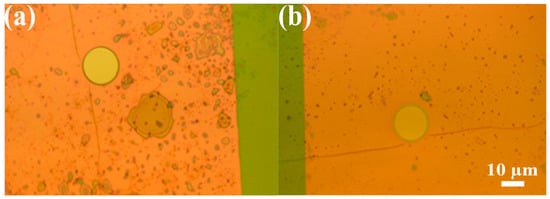
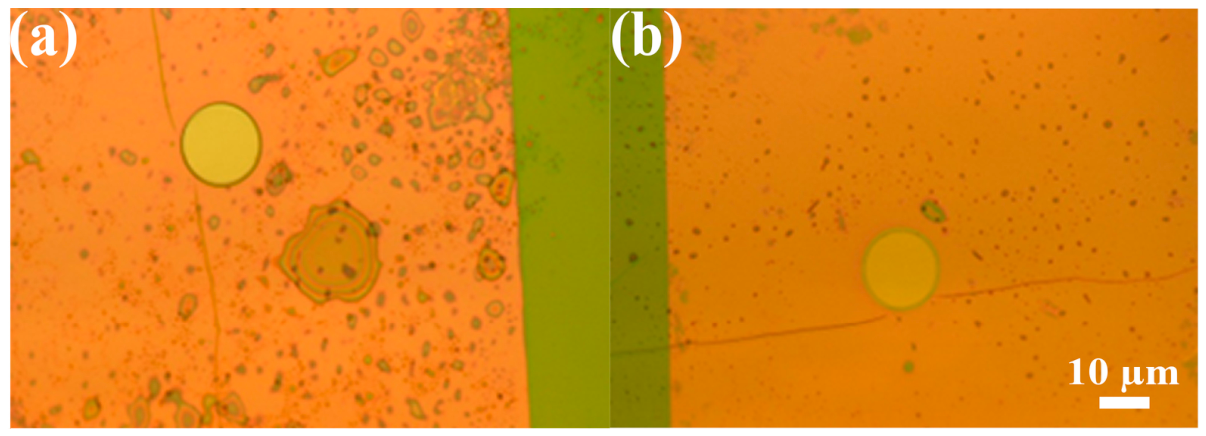
The optical micrographs in Figure 6 compares the appearance of the TPC–derived CNM before and after osmotic energy conversion measurements. Following conductance measurements at different KCl concentrations, cell rinsing between solution changes, and measurements under salt concentration gradients, the covered aperture retains a clearly defined circular outline and comparable optical contrast. No large–scale rupture or detachment is evident at the resolution of the optical images, and the retained coverage indicates that the membrane remains structurally intact under the experimental conditions. A cohesive carbon network produced by lateral electron–induced cross–linking is consistent with the retention of membrane coverage and would allow the membrane to remain suspended across the support aperture during electrolyte exposure and subsequent measurements. The micrographs thus offer qualitative evidence of sufficient mechanical integrity for the osmotic energy conversion experiments.
Figure 6.
Optical micrographs of the TPC–derived CNM–covered aperture before (a) and after (b) osmotic energy conversion measurements.
3. Materials and Methods
3.1. TPC Self–Assembly and Electron–Induced Cross–Linking
Au/mica (1 × 1 cm2; Georg Albert PVD, Silz, Germany) was immersed in 10 mM AgNO3 in 100 mM HNO3 (aq), and a potential of 10 mV (vs. Ag/Ag+) was applied to the substrate for 2 min. This yielded full coverage of a stable bilayer of silver atoms which follow the fcc stacking sequence of the underlying Au (111) substrate. Then, the substrates were immediately placed into the preheated TPC solution (5 μg TPC was dissolved at room temperature in 10 mL water/ethanol mixture (1:1, v/v)) and left overnight at 65 °C. The incubation time was around 20 h. The substrates were then rinsed with ethanol and blown dry with N2. The SAM–coated substrates were placed in a irradiation chamber and exposed to electrons with an energy of 100 eV and a total dose of 50 mC cm−2. The chamber pressure was maintained below 3 × 10⁻⁸ mbar. The cross–linked films were coated with poly(methyl methacrylate) (PMMA) for mechanical support during transfer. Following removal of the growth substrate, the CNM/PMMA films were transferred to electron microscopy grids or perforated chips for electrical measurements. CNMs with PMMA were thoroughly rinsed in pure water and transferred onto either TEM grids (Quantifoil Micro Tools GmbH, Großlöbichau, Germany) for helium ion microscopy or perforated Si3N4/Si windows (Silson Ltd., Southam, UK) for further measurements. For membrane transfer, the Au layer was etched using an aqueous I2/KI solution with an I2:KI:H2O mass ratio of 1:4:10. The PMMA–protected sample was floated on the etching solution for 1 min and subsequently transferred onto the surface of deionized water for rinsing. This etching–rinsing sequence was repeated several times until the characteristic gold coloration was no longer visible. Following transfer to the target support, PMMA was removed by immersing the sample in acetone for 15 min, followed by several ethanol rinses. Then, check under optical microscope to see if the protective polymer layer and substrate are fully removed. The size of the suspended CNMs samples around 5 μm.
3.2. Spectroscopic and Microscopic Characterization
PM–IR spectra were taken at a resolution of 4 cm−1 in a Fourier transform infrared (FTIR) spectrometer VERTEX 70 (Bruker Optik GmbH, Ettlingen, Germany) coupled with a polarization–modulation accessory PMA50 (Bruker). The samples were probed in a reflection mode from the native Au substrates at a grazing incidence angle of 85° to the surface normal. The spectrometer was constantly purged with dry nitrogen at the flow rate of 3 L min−1. The MCT detector was cooled down with liquid nitrogen. Vapor adsorption measurements were done in a reaction chamber RefractorTM from Harrick Scientific Products, Inc., Pleasantville, NY, USA.
XPS spectra were obtained with an Omicron Multiprobe system operated at a 10−11 mbar base pressure and equipped with a monochromatic X–ray source (Al Kα, 1486.7 eV, 250 W) and a hemispherical electron analyzer (Omicron NanoTechnology GmbH, Taunusstein, Germany). The binding energies were calibrated with respect to the Au 4f7/2 peak at 84.0 eV. The data were evaluated with CasaXPS program. The resulting spectra were fitted using a Shirley background and symmetric Voigt functions with variable Gauss and Lorentz contributions. The effective thickness of the TPC–derived CNMs was estimated to be approximately 1.2 nm by XPS using the Thickogram method, based on the sensitivity–corrected C 1s and Au 4f7/2 intensity ratio within the monolayer.
HIM investigation was carried out with a Carl Zeiss Orion Plus Helium microscope (Carl Zeiss Microscopy GmbH, Jena, Germany). The He+–ion beam energy was kept at 35 kV, and the beam current was 0.3–0.5 pA. The working distance was ∼19 mm. Images were acquired in line averaging mode with 128 averaged lines.
3.3. Electrochemical Measurements
Electrochemical measurements were performed using a pair of custom–made fluidic electrochemical cells. The sample was mounted between the reservoirs and sealed with PDMS sheets containing a 3 mm hole. To enhance surface wettability and prevent bubble formation, both compartments were rinsed with ethanol. The ethanol was then completely displaced with deionized water. Finally, KCl solutions of the required concentrations were added for ion–transport measurements. I–V characteristics were recorded using a Reference 600 Potentiostat/Galvanostat (Gamry Instruments, Inc., Warminster, PA, USA). A pair of homemade Ag/AgCl electrodes was used. The voltage bias was swept between –0.2 V and 0.2 V (0.4 V for energy–generation measurements) at a scan rate of 5 mV/s using KCl solutions ranging from 10−6–1 M. Quantitative analysis was restricted to 10−5–1 M because the measurements at 10−6 M approached the experimental background. Ionic conductance was obtained from the slope of the response close to zero applied voltage:
where I is the measured current and V is the applied voltage. A membrane–free support was used as the reference. For osmotic energy conversion measurements, the concentrated reservoir contained 1 M KCl and the dilute reservoir contained 0.1, 0.01, or 0.001 M KCl, yielding concentration ratios of 10, 100, and 1000. A 1 M/1 M condition served as the symmetric reference. The voltage sweep was extended to include the zero–current intercept under each gradient. The corrected osmotic voltage was defined as
where Vm is the measured zero–current voltage and Vredox is the electrode contribution under the same concentration pair and sign convention. For power evaluation, the applied–voltage axis is correspondingly expressed as Vos = Vm − Vredox. For an approximately linear current–voltage response, the maximum–power estimate is
4. Conclusions
TPC monolayers self–assembled on a silver–coated gold/mica substrate were converted into CNMs by electron–induced cross–linking and transferred for ion–transport measurements in aqueous solutions. PM–IRRAS and XPS showed substantial changes in the precursor anchoring environment and in carbon and oxygen bonding, while HIM confirmed membrane coverage over micrometer–scale openings. In dilute KCl, the weak concentration dependence of conductance may indicate an increased contribution from interfacial transport. The corrected osmotic voltage reached approximately 99.56 mV under salinity gradients. Raising the concentration ratio from 10 to 1000 increased the estimated maximum power density from 1.5 to 4.3 W m−2. The optical images show that the membrane retained overall coverage across the aperture after testing. The results establish aromatic carboxylate–derived CNMs as a platform for investigating the relationship between molecular precursor chemistry and osmotic energy conversion. The reported results were obtained using freestanding CNMs spanning micrometer–scale apertures, with power densities normalized to the geometric area of the suspended membrane. Future work will focus on fabricating membranes over larger areas and developing integrated devices to support practical applications. Assessing practical performance requires quantification of surface charge and validation of power output under external loads, together with further evaluation of reproducibility and long–term stability.
Supplementary Materials
The following supporting information can be downloaded at: https://www.mdpi.com/article/10.3390/molecules31224145/s1, Table S1. Inputs and adopted electrode corrections for KCl concentration pairs. Table S2. Representative maximum–power caculation. Table S3. Reported XPS component parameters and calculated relative areas. Table S4. Integrated areas and previously reported O/C ratios requiring verification. Figure S1. Current–voltage (I–V) curves measured through the uncovered aperture without a CNM in KCl solutions. Ref. [34] is cited in the Supplementary Materials.
Funding
This research was supported by Hebei Natural Science Foundation, China, grant number B2024411001; Key Talent Program of the Yanzhao Golden Platform Talent Initiative, Hebei Province (Platform for Returned Overseas Students, B2026008).
Institutional Review Board Statement
Not applicable.
Informed Consent Statement
Not applicable.
Data Availability Statement
The data that support the findings of this study are available upon reasonable request from the author.
Conflicts of Interest
The author declares no conflicts of interest.
Abbreviations
| CNMs | Carbon nanomembranes |
| TPC | Tterphenyl-4-carboxylic acid |
| MoS2 | Molybdenum disulfide |
| MOFs | Metal–organic frameworks |
| SAMs | Self-assembled monolayers |
| PM-IRRAS | Polarization-modulation infrared reflection-absorption spectroscopy |
| XPS | X-ray photoelectron spectroscopy |
| HIM | Helium ion microscopy |
| PMMA | Poly(methyl methacrylate) |
| FTIR | Fourier transform infrared |
References
- Wang, P.; Tao, W.; Zhou, T.; Wang, J.; Zhao, C.; Zhou, G.; Yamauchi, Y. Nanoarchitectonics in Advanced Membranes for Enhanced Osmotic Energy Harvesting. Adv. Mater. 2024, 36, 2404418. [Google Scholar] [CrossRef] [Scilit] [PubMed]
- Zhang, J.; Zhao, N.; Jiang, X.; Li, Z.; Chen, K.; Wang, X.; Jing, T.; Guo, Y.; Xie, L.; Wu, Z.; et al. Confined Assembly of Superwettable Nanomaterials for Bioinspired Nanofluidic Membranes/Applications. ACS Nano 2025, 19, 35193–35211. [Google Scholar] [CrossRef] [Scilit] [PubMed]
- Rastgar, M.; Moradi, K.; Burroughs, C.; Hemmati, A.; Hoek, E.; Sadrzadeh, M. Harvesting Blue Energy Based on Salinity and Temperature Gradient: Challenges, Solutions, and Opportunities. Chem. Rev. 2023, 123, 10156–10205. [Google Scholar] [CrossRef] [Scilit] [PubMed]
- Lei, X.; Zhang, J.; Hong, H.; Liu, Z.; Huang, Y.; Xia, F.; Mao, L.; Jiang, L. Ultrahigh-Performance Osmotic Power Generation in Gate-Controlled Nanopores. Adv. Funct. Mater. 2025, 35, 2500989. [Google Scholar] [CrossRef] [Scilit]
- Hou, Q.; Dai, Y.; Zhang, X.; Xia, F. Commercial Nafion Membranes for Harvesting Osmotic Energy from Proton Gradients that Exceed the Commercial Goal of 5.0 W/m2. ACS Nano 2024, 18, 12580–12587. [Google Scholar] [CrossRef] [Scilit] [PubMed]
- Ding, L.; Xiao, D.; Zhao, Z.; Wei, Y.; Xue, J.; Wang, H. Ultrathin and Ultrastrong Kevlar Aramid Nanofiber Membranes for Highly Stable Osmotic Energy Conversion. Adv. Sci. 2022, 9, 2202869. [Google Scholar] [CrossRef] [Scilit] [PubMed]
- Zhao, Y.; Wang, J.; Kong, X.-Y.; Xin, W.; Zhou, T.; Qian, Y.; Yang, L.; Pang, J.; Jiang, L.; Wen, L. Robust sulfonated poly (ether ether ketone) nanochannels for high-performance osmotic energy conversion. Natl. Sci. Rev. 2020, 7, 1349–1359, Correction in Natl. Sci. Rev. 2020, 7, 1793. [Google Scholar] [CrossRef] [Scilit] [PubMed]
- Xia, S.; Xin, W.; Wang, N.; Guo, J.; Zhang, J.; Tian, C.; Wen, L.; Jiang, L.; Fu, H. Localized Surface Plasmon Resonance Effect for Near Full-Spectrum Photo-Enhanced Osmotic Energy Harvesting. Angew. Chem. Int. Ed. 2026, 65, e22625. [Google Scholar] [CrossRef] [Scilit] [PubMed]
- Hossain, J.A.; Kim, B. Unveiling unique ion transport mechanisms in nanopores beyond the continuum framework. Desalination 2025, 614, 119162. [Google Scholar] [CrossRef] [Scilit]
- Chen, L.; Shen, P.; Luo, X.; Liu, Y.; Du, Q.; Ma, Q.; Xia, F. Space charge-enhanced ion permselectivity of nanofluidic membranes for ionic power harvesting. J. Mater. Chem. A 2025, 13, 32187–32196. [Google Scholar] [CrossRef] [Scilit]
- Teng, Y.; Chen, T.-H.; Cai, N.; Saud, P.; Li, P.; Naidu, A.S.; Boureau, V.; Radenovic, A. Charge and slip-length optimization in lipid-bilayer-coated nanofluidics for enhanced osmotic energy harvesting. Nat. Energy 2026, 11, 470–478. [Google Scholar] [CrossRef] [Scilit]
- Feng, J.; Graf, M.; Liu, K.; Ovchinnikov, D.; Dumcenco, D.; Heiranian, M.; Nandigana, V.; Aluru, N.R.; Kis, A.; Radenovic, A. Single-layer MoS2 nanopores as nanopower generators. Nature 2016, 536, 197–200. [Google Scholar] [CrossRef] [Scilit] [PubMed]
- Guo, J.; Liu, T.; Xin, W.; Wang, N.; Xia, S.; Shen, D.; Fan, Y.; Fang, Z.; Tian, C.; Wen, L.; et al. Biomimetic Dual Asymmetric MXene-Based Nanofluidics for Advancing Osmotic Power Generation. J. Am. Chem. Soc. 2025, 147, 36329–36338. [Google Scholar] [CrossRef] [Scilit] [PubMed]
- Fu, M.; Zhang, X.; Qu, Z.G. MXene-Fe2O3 composite membrane for light-boosted osmotic power generation. Chem. Eng. J. 2026, 530, 173498. [Google Scholar] [CrossRef] [Scilit]
- Tonnah, R.K.; Chai, M.; Abdollahzadeh, M.; Xiao, H.; Mohammad, M.; Hosseini, E.; Zakertabrizi, M.; Jarrahbashi, D.; Asadi, A.; Razmjou, A.; et al. Bioinspired Angstrom-Scale Heterogeneous MOF-on-MOF Membrane for Osmotic Energy Harvesting. ACS Nano 2023, 17, 12445–12457. [Google Scholar] [CrossRef] [Scilit] [PubMed]
- He, X.; Xin, W.; Song, P.; Wan, S.; Yang, C.; Deng, Y.; Shi, L.; Zhou, T.; Wen, L. Light-Induced Enhancement of Osmotic Energy Conversion in Molybdenum Disulfide/Cotton Nanofiber Composite Membrane. Small 2026, 22, e12659. [Google Scholar] [CrossRef] [Scilit]
- Turchanin, A.; Gölzhäuser, A. Carbon nanomembranes from self-assembled monolayers: Functional surfaces without bulk. Prog. Surf. Sci. 2012, 87, 108–162. [Google Scholar] [CrossRef] [Scilit]
- Turchanin, A.; Gölzhäuser, A. Carbon Nanomembranes. Adv. Mater. 2016, 28, 6075–6103. [Google Scholar] [CrossRef] [Scilit] [PubMed]
- Angelova, P.; Vieker, H.; Weber, N.-E.; Matei, D.; Reimer, O.; Meier, I.; Kurasch, S.; Biskupek, J.; Lorbach, D.; Wunderlich, K.; et al. A universal scheme to convert aromatic molecular monolayers into functional carbon nanomembranes. ACS Nano 2013, 7, 6489–6497. [Google Scholar] [CrossRef] [Scilit] [PubMed]
- Yang, Y.; Hillmann, R.; Qi, Y.; Korzetz, R.; Biere, N.; Emmrich, D.; Westphal, M.; Büker, B.; Hütten, A.; Beyer, A.; et al. Ultrahigh Ionic Exclusion through Carbon Nanomembranes. Adv. Mater. 2020, 32, 1907850. [Google Scholar] [CrossRef] [Scilit] [PubMed]
- Yang, Y.; Dementyev, P.; Biere, N.; Emmrich, D.; Stohmann, P.; Korzetz, R.; Zhang, X.; Beyer, A.; Koch, S.; Anselmetti, D.; et al. Rapid Water Permeation Through Carbon Nanomembranes with Sub-Nanometer Channels. ACS Nano 2018, 12, 4695–4701. [Google Scholar] [CrossRef] [Scilit] [PubMed]
- Qi, Y.; Yang, Y.; Westphal, M.; Ennen, I.; Cremer, J.; Anselmetti, D.; Hütten, A.; Gölzhäuser, A.; Dementyev, P. Pyrene-Derived Carbon Nanomembranes Selectively Pass Metal Ions in Water. Adv. Mater. Interfaces 2022, 9, 2201385. [Google Scholar] [CrossRef] [Scilit]
- Liu, X.; He, M.; Calvani, D.; Qi, H.; Gupta, K.B.S.S.; de Groot, H.J.M.; Sevink, G.J.A.; Buda, F.; Kaiser, U.; Schneider, G.F. Power generation by reverse electrodialysis in a single-layer nanoporous membrane made from core–rim polycyclic aromatic hydrocarbons. Nat. Nanotechnol. 2020, 15, 307–312. [Google Scholar] [CrossRef] [Scilit] [PubMed]
- Dementyev, P.; Naberezhnyi, D.; Westphal, M.; Buck, M.; Gölzhäuser, A. Carbon Nanomembranes from Aromatic Carboxylate Precursors. ChemPhysChem 2020, 21, 1006–1011. [Google Scholar] [CrossRef] [Scilit] [PubMed]
- Lee, S.; Song, Y.; Park, H.; Kim, S.; Park, W.-K.; Kim, H. Carboxylate-coordinated TiO2-x in TEMPO-oxidized nanocellulose aerogels for visible-light photocatalysis. Int. J. Biol. Macromol. 2026, 378, 153803. [Google Scholar] [CrossRef] [Scilit] [PubMed]
- Hsu, M.-H.; Hu, W.-S.; Lin, J.-J.; Hsu, Y.-J.; Wei, D.-H.; Yang, C.-W.; Chang, C.-S.; Tao, Y.-T. H2S-Induced Reorganization of Mixed Monolayer of Carboxylic Derivatives on Silver Surface. Langmuir 2004, 20, 3641–3647. [Google Scholar] [CrossRef] [Scilit] [PubMed]
- Terfort, A.; Zharnikov, M. Modification of Self-Assembled Monolayers by Electron Irradiation as a Tool for Surface Engineering, Lithography, and Nanofabrication. Adv. Mater. Interfaces 2026, 13, e00954. [Google Scholar] [CrossRef] [Scilit]
- Rojek, A.; Cegiełka, D.M.; Wróbel, M.; Stępień, M.; Shoji, Y.; Fukushima, T.; Zharnikov, M.; Cyganik, P. Formation of Ultrathin and Highly Stable Aromatic Monolayers on Silver Surface—Three Legs Are Better Than One. ACS Appl. Mater. Interfaces 2026, 18, 15665–15675. [Google Scholar] [CrossRef] [Scilit] [PubMed]
- Ishiwari, F.; Omine, T.; Saeki, A.; Munro, K.; Buck, M.; Zharnikov, M. Homochiral Carboxylate-Anchored Truxene Tripods: Design, Synthesis, and Monolayer Formation on Ag(111). Chem. Eur. J. 2025, 31, e202404750. [Google Scholar] [CrossRef] [Scilit] [PubMed]
- Guo, Y.; Sun, X.; Ding, S.; Lu, J.; Wang, H.; Zhu, Y.; Jiang, L. Charge-Gradient Sulfonated Poly(ether ether ketone) Membrane with Enhanced Ion Selectivity for Osmotic Energy Conversion. ACS Nano 2024, 18, 7161–7169. [Google Scholar] [CrossRef] [Scilit] [PubMed]
- Hao, J.; Wang, Y.; Ning, Y.; Fan, X.; Jiang, J.; Meng, S.; Chang, L.; Hu, S.; Chen, Y.; Sui, X. Improved ion transfer and osmotic energy conversion via nanofibers/polymer composite membrane with hierarchical 3D porous. J. Power Sources 2024, 604, 234498. [Google Scholar] [CrossRef] [Scilit]
- He, X.; Xin, W.; Wan, S.; Yang, C.; Deng, Y.; Shi, L.; Wen, L.; Zhou, T. Flow-induced surface charge enhancement in alumina nanochannels boosts osmotic energy conversion. J. Membr. Sci. 2026, 738, 124753. [Google Scholar] [CrossRef] [Scilit]
- Wang, W.; Hao, J.; Sun, Q.; Zhao, M.; Liu, H.; Li, C.; Sui, X. Carbon nanofibers membrane bridged with graphene nanosheet and hyperbranched polymer for high-performance osmotic energy harvesting. Nano Res. 2023, 16, 1205–1211. [Google Scholar] [CrossRef] [Scilit]
- Hamer, W.J.; Wu, Y.-C. Osmotic Coefficients and Mean Activity Coefficients of Uni-univalent Electrolytes in Water at 25 °C. J. Phys. Chem. Ref. Data 1972, 1, 1047–1100. [Google Scholar] [CrossRef] [Scilit]
Disclaimer/Publisher’s Note: The statements, opinions and data contained in all publications are solely those of the individual author(s) and contributor(s) and not of MDPI and/or the editor(s). MDPI and/or the editor(s) disclaim responsibility for any injury to people or property resulting from any ideas, methods, instructions or products referred to in the content. |
© 2026 by the author. Licensee MDPI, Basel, Switzerland. This article is an open access article distributed under the terms and conditions of the Creative Commons Attribution (CC BY) license.