


Abstract
The behavior of bee venom-loaded nanoliposomes (BV-LNs) during gastrointestinal digestion remains insufficiently characterized. This study evaluated their physicochemical properties, antioxidant responses, hemocompatibility, protection against AAPH-induced oxidative hemolysis, apparent in vitro transfer during dialysis, and responses to simulated gastrointestinal digestion. Antioxidant and erythrocyte responses were compared among free bee venom (BV), empty nanoliposomes, and BV-LNs; dialysis transfer was compared between free BV and BV-LNs, whereas simulated digestion was evaluated for BV-LNs. BV-LNs exhibited a hydrodynamic diameter of 132.00 ± 14.23 nm and a zeta potential of −33 ± 2 mV. DPPH and FRAP responses did not differ significantly between free BV and BV-LNs, whereas ABTS inhibition was significantly greater for BV-LNs (69.17 ± 1.06% vs. 55.72 ± 4.89%). BV-LNs showed greater antihemolytic activity than free BV at BV-equivalent concentrations of 10 and 40 µg/mL. However, direct hemocompatibility decreased with concentration and exposure time, with no consistent advantage for BV-LNs. BV-LNs also showed slower apparent transfer of BV-derived UV-absorbing material during dialysis. During simulated digestion, DPPH and ABTS inhibition were lowest in the gastric fraction and higher in the intestinal fractions. The dialyzed intestinal fraction showed measurable DPPH (42.84 ± 2.14%) and ABTS (25.39 ± 2.47%) inhibition and antihemolytic activity in A, B, and O RhD-positive erythrocytes. These findings demonstrate formulation-associated differences in antioxidant and antihemolytic responses, with activity remaining detectable after digestion and dialysis. They do not establish controlled release, preservation of intact venom peptides, improved digestive stability relative to free BV, intestinal absorption, or a general safety advantage.
1. Introduction
Lipid-based nanostructured systems, including nanoliposomes, are widely studied as carriers for bioactive compounds. Their phospholipid bilayers can accommodate hydrophilic and lipophilic constituents, while their composition, size, and surface properties influence payload retention, apparent release, and interactions with biological media [1,2,3,4]. These characteristics make nanoliposomes relevant for labile or membrane-active compounds whose direct use may be limited by instability or concentration-dependent toxicity.
Bee venom (BV) is a complex mixture of peptides, enzymes, and other low-molecular-weight constituents. Melittin, its principal peptide component, is a 26-amino acid amphipathic peptide that interacts strongly with phospholipid membranes [5,6,7,8]. This interaction contributes to the biological activity of BV but also to membrane disruption and hemolysis. Together with the allergenic potential of BV, these effects limit its direct application and make formulation-specific assessment of concentration, release behavior, and biological compatibility necessary [9,10]. The incorporation of BV into nanoliposomes may modify the immediate accessibility of its constituents and their interactions with biological membranes; however, reduced toxicity, hemolysis, immunoreactivity, or anaphylactic risk cannot be inferred from encapsulation alone and requires direct experimental evaluation.
The biological activity of BV reflects its complex composition rather than the action of melittin alone. Chemical profiling and targeted chromatographic analyses have characterized venom constituents, including melittin and apamin, highlighting the importance of distinguishing whole-venom preparations from isolated peptides [11,12]. Experimental studies have associated BV and melittin with changes in oxidative stress and inflammatory responses. Qin et al. [13] reported increased superoxide dismutase and glutathione peroxidase activities and reduced malondialdehyde levels in serum and liver following dietary melittin supplementation in heat-stressed quails. In cultured melanocytes, low-dose melittin was investigated for its capacity to limit oxidative stress while promoting melanogenesis [14]. BV administration has also been associated with attenuation of neuroinflammatory alterations in a pilocarpine-induced epilepsy model [15]. These findings provide a rationale for investigating the redox-related and biological responses of BV-containing formulations. However, changes in endogenous antioxidant defenses or inflammatory responses should not be equated with direct radical-scavenging activity, and findings obtained with isolated melittin cannot be assumed to apply to whole BV.
Complementary chemical and erythrocyte-based assays are therefore relevant for characterizing formulation-specific responses under defined experimental conditions. Bee venom peptides display distinct biological activities that require careful control of exposure. Gandolfo et al. [16] reported prevention of MCD-induced epilepsy by potassium channel openers, whereas Cheng and Xu [17] developed a redox-sensitive nanocomplex for targeted melittin delivery. These findings emphasize constituent-specific effects and the importance of delivery strategies in applications. However, these findings do not establish therapeutic efficacy for a BV formulation evaluated using chemical and erythrocyte-based assays. Moreover, venoms from different Apis spp. vary in antioxidant activity, melittin content, and irritation potential, indicating that their biological and toxicological responses depend on source and composition [18,19]. Whole-BV formulations should therefore be evaluated using complementary endpoints, including chemical antioxidant responses, erythrocyte compatibility, and protection against induced hemolysis. In this study, erythroprotective activity was operationally defined as the capacity of a treatment to preserve erythrocyte membrane integrity and reduce AAPH-induced oxidative hemolysis under the evaluated in vitro conditions. This term does not imply stimulation of erythrocyte production or erythropoiesis. These in vitro measurements characterize radical-scavenging, reducing-capacity, and erythrocyte membrane responses; however, they do not establish systemic safety, anti-inflammatory efficacy, neuroprotective effects, or clinical benefit.
The gastrointestinal environment presents an additional challenge for peptide-containing formulations. Gastric acidity, proteolytic enzymes, bile salts, and changes in ionic conditions can alter both peptides and lipid vesicles. Depending on their composition and physicochemical properties, nanoliposomes may influence payload retention and transfer during digestion [6,8,9]. Dialysis-based release and simulated gastrointestinal digestion can therefore be used to characterize the apparent transfer and residual activity of BV-derived material under defined in vitro conditions. Nevertheless, these measurements do not demonstrate compound-specific release, preservation of intact peptides, intestinal absorption, oral bioavailability, or improved gastrointestinal stability without appropriate molecular analyses and comparative controls.
Although nanoliposomes have been investigated as delivery systems for isolated peptides and other bioactive compounds, evidence regarding the incorporation of whole BV into nanoliposomes remains limited [17,19,20]. In particular, few studies have evaluated physicochemical characteristics, antioxidant responses, erythrocyte-related effects, apparent release, and behavior during simulated gastrointestinal digestion within the same formulation. Therefore, this study aimed to prepare and characterize bee venom-loaded nanoliposomes (BV-LNs) and to compare their antioxidant responses, hemocompatibility, and protection against induced hemolysis with those of free BV and ENLs, while also characterizing their apparent in vitro release and behavior during simulated gastrointestinal digestion. We hypothesized that the incorporation of BV into nanoliposomes would modify its physicochemical behavior and apparent transfer profile while maintaining measurable antioxidant and antihemolytic responses under the evaluated in vitro conditions. The study was designed as an in vitro assessment of formulation performance and did not evaluate oral bioavailability, systemic safety, or therapeutic efficacy.
2. Results
2.1. Antioxidant Properties of Bee Venom and Bee Venom-Loaded Nanoliposomes
Table 1 shows the antioxidant responses of free BV, empty nanoliposomes (ENLs), and bee venom-loaded nanoliposomes (BV-LNs) assessed using 2,2-diphenyl-1-picrylhydrazyl (DPPH), 2,2′-azino-bis(3-ethylbenzothiazoline-6-sulfonic acid) (ABTS), and ferric reducing antioxidant power (FRAP) assays. BV and BV-LNs showed similar DPPH radical inhibition (71.47 ± 1.15% and 69.67 ± 1.37%, respectively), with no significant difference between treatments (p > 0.05). Likewise, FRAP values were 338.80 ± 27.06 µmol TE/g for BV and 319.80 ± 32.21 µmol TE/g for BV-LNs, with no significant difference (p > 0.05).
Table 1.
Antioxidant activity of free bee venom, empty nanoliposomes and bee venom-loaded nanoliposomes.
In contrast, BV-LNs showed significantly greater ABTS radical inhabitation than free BV (69.17 ± 1.06% vs. 55.72 ± 4.89%, respectively; p < 0.05), which indicates a difference of 13.45 percentage points. ENLs showed minimal responses in all assays with values of 0.34 ± 0.02% for DPPH, 0.02 ± 0.00% for ABTS, and 2.73 ± 0.77 µmol TE/g for FRAP. These values were significantly lower than those for both BV-containing treatments. Overall, BV and BV-LNs showed comparable responses in the DPPH and FRAP assays, whereas BV-LNs exhibited a significantly higher ABTS radical inhibition. These results indicate an assay-dependent effect of nanoencapsulation on the measured antioxidant response.
2.2. Erythroprotective Potential of Bee Venom
2.2.1. Hemocompatibility of Free Bee Venom and Bee Venom-Loaded Nanoliposomes
Table 2 summarizes erythrocyte hemocompatibility across formulations, concentrations, and exposure times. Empty nanoliposomes (ENLs) maintained hemocompatibility above 91% under all tested conditions, whereas free bee venom (BV) and bee venom-loaded nanoliposomes (BV-LNs) generally showed progressively lower values with increasing concentration and exposure time. The omnibus formulation tests identified significant differences among formulations at all concentration–time combinations except 2 µg/mL after 1 and 2 h. These tests assess the simple effect of formulation within each combination and do not establish differences between exposure times or concentrations.
Table 2.
Hemocompatibility of human erythrocytes exposed to free bee venom, empty nanoliposomes, and bee venom-loaded nanoliposomes at different concentrations and exposure times.
At 2 µg/mL, initial hemocompatibility was 97.42 ± 2.05% for BV, 98.23 ± 0.52% for ENLs, and 99.23 ± 2.75% for BV-LNs. The omnibus formulation effect was not significant after either 1 h (p = 0.4314) or 2 h (p = 0.1316), but became significant at 3 h (p = 0.0081), 4 h (p = 0.0010), 5 h (p = 0.0006), and 6 h (p = 0.0001). Tukey-adjusted comparisons showed that BV-LNs did not differ significantly from either BV or ENLs at 3 h. At 4 h, BV-LNs exhibited significantly higher hemocompatibility than BV and did not differ significantly from ENLs. At 5 and 6 h, all three formulations differed significantly, with ENLs showing the highest values, followed by BV-LNs and BV. After 6 h, BV-LNs retained 86.26 ± 0.74% hemocompatibility compared with 78.24 ± 2.64% for BV, a difference of 8.02 percentage points, whereas ENLs retained 92.74 ± 1.36%. These findings support a hemocompatibility advantage of BV-LNs over free BV at this concentration after 4–6 h.
At 10 µg/mL, the omnibus formulation effect was significant at every exposure time, with p-values of 0.0043, 0.0086, 0.0003, 0.0010, 0.0001, and 0.0026 at 1–6 h, respectively. Initial hemocompatibility was 92.94 ± 2.54% for BV, 97.56 ± 2.75% for ENLs, and 94.23 ± 2.23% for BV-LNs. At 1 h, ENLs differed significantly from BV, whereas BV-LNs did not differ significantly from either formulation. At 2 h, ENLs showed significantly higher hemocompatibility than both venom-containing formulations, which did not differ significantly from each other. At 3–5 h, all formulations differed significantly, with ENLs showing the highest values and BV-LNs the lowest. After 6 h, hemocompatibility was 75.63 ± 3.63% for BV and 72.23 ± 1.36% for BV-LNs; these values did not differ significantly, although both were significantly lower than that of ENLs (92.76 ± 2.86%). Thus, the advantage observed for BV-LNs at 2 µg/mL was not reproduced at 10 µg/mL.
At 40 µg/mL, the omnibus formulation effect was also significant throughout the experiment, with p-values of 0.0013, 0.0006, 0.0003, 0.0023, 0.0052, and 0.0001 at 1–6 h, respectively. After 1 h, hemocompatibility was 86.68 ± 2.88% for BV and 85.74 ± 2.65% for BV-LNs, compared with 97.45 ± 0.52% for ENLs. Tukey-adjusted comparisons indicated that ENLs maintained significantly higher hemocompatibility than both venom-containing formulations at every exposure time. BV and BV-LNs did not differ significantly during the first 5 h. At 6 h, however, BV-LNs showed significantly lower hemocompatibility (48.74 ± 2.64%) than free BV (51.85 ± 3.74%), while ENLs retained 91.12 ± 1.34%. These results provide no evidence of improved hemocompatibility through nanoencapsulation at the highest concentration.
Overall, the descriptive profiles showed decreasing hemocompatibility with increasing concentration and exposure time for both free and encapsulated BV. The within-row statistical comparisons demonstrated that BV-LNs improved hemocompatibility relative to free BV at 2 µg/mL after 4–6 h, but showed lower hemocompatibility at 10 µg/mL after 3–5 h and at 40 µg/mL after 6 h. Consequently, these findings indicate that the effect of nanoencapsulation varied across the tested conditions and do not support a general hemocompatibility advantage of BV-LNs over free BV.
2.2.2. Protective Effect of Bee Venom Against AAPH-Induced Erythrocyte Hemolysis
Free BV showed a concentration-dependent decrease in antihemolytic activity (Figure 1), from 97.80 ± 1.56% at 2 µg/mL to 50.20 ± 2.54% at 10 µg/mL and 34.73 ± 3.83% at 40 µg/mL. In contrast, BV-LNs maintained higher activity across the tested concentration range, with values of 92.74 ± 2.73%, 84.75 ± 3.64%, and 75.23 ± 3.21% at 2, 10 and 40 µg/mL, respectively (Figure 2). At 2 µg/mL, BV and BV-LNs showed similarly high antihemolytic activity (p > 0.05). However, at 10 and 40 µg/mL, BV-LNs showed higher activity than free BV with differences of 34.55 and 40.50 percentage points, respectively; p < 0.001. ENLs exhibited minimal antihemolytic activity at all concentrations, with values ranging from 0.63 ± 0.16% to 1.23 ± 0.84%.
Figure 1.
Antihemolytic activity of free bee venom (BV), empty nanoliposomes (ENLs), and bee venom-loaded nanoliposomes (BV-LNs) in human O RhD-positive erythrocytes. Treatments were evaluated at BV-equivalent concentrations of 2, 10, and 40 µg/mL. Bars represent mean ± SD (n = 10 independent experiments). Different lowercase letters indicate statistically significant differences among treatments according to p < 0.05.
Figure 2.
Representative micrographs of human erythrocytes under oxidative stress. (A) Untreated erythrocytes (negative control). (B) Erythrocytes exposed to AAPH to induce oxidative stress. (C) Erythrocytes treated with bee venom-loaded nanoliposomes (BV-LNs) under AAPH-induced oxidative stress. Images are representative of the morphological changes observed under each experimental condition and were evaluated qualitatively.
At 10 and 40 µg/mL, BV-LNs exhibited significantly greater antihemolytic activity than free BV (p < 0.001), whereas no significant difference between these formulations was detected at 2 µg/mL (p > 0.05). ENLs showed low antihemolytic activity across the evaluated conditions.
2.2.3. Morphological Assessment of Erythrocyte Under Oxidative Stress
Representative micrographs were qualitatively examined to compare erythrocyte morphology under the experimental conditions (Figure 2). Untreated erythrocytes (Figure 2A) exhibited predominantly rounded profiles and smooth outlines, consistent with preserved erythrocyte morphology. In contrast, erythrocytes exposed to AAPH (Figure 2B) showed pale, ghost-like profiles and irregular contours, consistent with oxidative membrane damage and hemolysis.
Erythrocytes treated with BV-LNs under oxidative stress conditions (Figure 2C) showed predominantly rounded cells with more clearly preserved contours than those observed in the AAPH-treated group. However, because the analysis was bases on representative fields and no quantitative morphometric assessment was performed, these observations should be interpreted as qualitative evidence of morphological preservation.
2.3. Physicochemical Characterization and Stability of Nanoliposomal Systems
2.3.1. Scanning Electron Microscopy
Scanning electron microscopy (SEM) was used to qualitatively examine the morphology of lyophilized, gold-coated ENLs and BV-LNs (Figure 3). Both formulations exhibited predominantly rounded structures with relatively smooth visible surfaces, although some flattened and irregular contours were also observed. Several structures appeared in close contact or aggregated within the dried preparations.
Figure 3.
Representative scanning electron microscopy (SEM) images of dried empty nanoliposomes (ENLs) and bee venom-loaded nanoliposomes(BV-LNs). (A) ENLs and (B) BV-LNs after drying and sample preparation for SEM analysis. Both formulations showed predominantly rounded structures with areas of close particle contact aggregation. Images were acquired at 35,000× magnification. Annotated dimensions refer to selected structures in the lyophilized, gold-coated specimens and are provided for illustration rather than as a representative particle-size distribution. Scale bars = 500 nm.
In ENLs (Figure 3A), one representative structure showed annotated dimensions of approximately 291 and 263 nm along two measured axes. In BV-LNs (Figure 3B), a representative structure showed an annotated dimension of approximately 201 nm. These measurements correspond to individual structures observed in the lyophilized, gold-coated specimens within the selected micrographs. They are illustrative measurements and should not be interpreted as estimates of mean particle size, a representative size distribution, or vesicle dimensions in aqueous dispersion. Overall, ENLs and BV-LNs exhibited broadly similar morphological features under the SEM conditions used.
2.3.2. Colloidal Properties and Encapsulation Efficiency
Colloidal properties describe the size, size uniformity, and surface charge of dispersed particles, whereas encapsulation efficiency indicates the proportion of bee venom incorporated into the nanoliposomes relative to the total amount initially added. ENLs and BV-LNs were characterized in terms of hydrodynamic size and zeta potential, while encapsulation efficiency was determined for BV-LNs. Representative hydrodynamic diameter and zeta potential distributions of BV-LNs are presented in Figure 4. ENLs and BV-LNs exhibited mean hydrodynamic diameters of 105 ± 21.78 and 132.00 ± 14.23 nm, respectively. Although BV-LNs showed a numerically larger hydrodynamic diameter, no significant difference was detected between formulations (p > 0.05). The Polydispersity index (PDI) was 0.23 ± 0.02 for ENLs and 0.18 ± 0.03 for BV-LNs, with no significant difference between formulations (p > 0.05). Both formulations exhibited negative zeta potentials, with values of −27 ± 2.0 mV for ENLs and −33 ± 2.0 mV for BV-LNs. BV-LNs showed a significantly more negative zeta potential than ENLs (p = 0.0213).
Figure 4.
Hydrodynamic diameter and zeta potential distributions of bee venom-loaded nanoliposomes (BV-LNs). (A1) Intensity-weighted hydrodynamic diameter distribution determined by dynamic light scattering (DLS). (A2) Zeta potential distribution determined by electrophoretic light scattering (ELS). Measurements were performed in triplicate; representative distributions are shown.
The intensity-weighted size distribution of BV-LNs showed a single predominant peak within approximately 100–150 nm range (Figure 4A1), consistent with the mean hydrodynamic diameter obtained by dynamic light scattering (DLS). The zeta potential distribution showed a narrow zeta potential peak near −33 mV (Figure 4A2), consistent with the mean electrokinetic potential measured for BV-LNs. BV-LNs showed an Encapsulation efficiency (EE) of 84.43 ± 2.26%, whereas EE was not applicable to ENLs because they contained no BV.
2.3.3. Apparent Aqueous Dispersibility and Centrifugal Stability
Following dispersion in water and centrifugation, the BV-LNs supernatant showed an apparent concentration of bee venom-derived UV-absorbing material (BV-UV material) of 1.83 ± 0.12 µg/mL on a melittin-calibrated basis. Absorbance was measured at 280 nm using purified melittin as the calibration standard. This value represents UV-absorbing material recovered in the aqueous supernatant and should not be interpreted as the specific concentration of intact melittin.
In the centrifugal stability assay, BV-LNs exhibited a value of 94.13 ± 3.53%, indicating limited separation under the applied conditions.
2.3.4. In Vitro Release Profile of Bee Venom Formulations
The apparent in vitro transfer profiles of bee venom-derived UV-absorbing material (BV-UV material) from free BV and BV-LNs under dialysis conditions are shown in Figure 5. Free BV exhibited a rapid increase in the apparent concentration of BV-UV material in the receptor medium during the first 6 h, followed by relatively small changes through 24 h, when the apparent concentration reached 39.380 ± 0.061 µg/mL. In contrast, BV-LNs showed a more gradual increase throughout the experiment, reaching an apparent concentration of 10.659 ± 0.017 µg/mL at 24 h. The final apparent concentration measured for BV-LNs was approximately 73% lower than that measured for free BV.
Figure 5.
Apparent in vitro transfer profiles of bee venom-derived UV-absorbing material (BV-UV material) from free bee venom (BV) and bee venom-loaded nanoliposomes (BV-LNs) under dialysis conditions over 24 h. Apparent receptor-medium concentrations (µg/mL) were estimated from absorbance at 280 nm using purified melittin as the calibration standard. These values represent an operational estimate of BV-UV material and do not indicate compound-specific concentrations of intact melittin. Data represent mean ± SD from three independent dialysis experiments (n = 3).
These profiles indicate slower appearance of BV-UV material in the receptor medium for BV-LNs than for free BV under the evaluated conditions. Apparent concentrations were estimated from absorbance at 280 nm using purified melittin as the calibration standard. Accordingly, the reported values describe an operational estimate of BV-UV material and do not represent compound-specific concentrations of intact melittin.
2.4. Antioxidant and Colorimetric Responses of In Vitro Release Fractions
The release fractions collected over 24 h showed distinct temporal patterns in the DPPH and ABTS assays (Table 3). DPPH inhibition remained statistically similar during the first 2 h, ranging from 67.78 ± 2.19% to 71.76 ± 3.67% (p < 0.0001). It then decreased to 60.94 ± 1.41% at 4 h and reached its lowest value at 24 h (43.09 ± 3.82%). The final response was significantly lower than those at 0.5–4, 8, and 12 h, but did not differ significantly from the value at 6 h.
Table 3.
Radical-scavenging and colorimetric responses of receptor-medium samples collected during in vitro dialysis of bee venom-loaded nanoliposomes.
In contrast, ABTS inhibition remained statistically similar during the first 2 h, increased to 43.09 ± 4.82% at 4 h, and ranged from 50.51 ± 2.15% to 52.89 ± 1.99% between 6 and 12 h. Its highest value occurred at 24 h (60.94 ± 1.41%), which was significantly greater than all earlier sample times (p < 0.0001). Thus, the release fractions retained measurable radical-scavenging activity throughout the experiment, with declining DPPH and ABTS showing opposite temporal trends.
The Folin–Ciocalteu responses varied nonmonotonically over time. Values decreased from 146.67 ± 21.86 mg gallic acid equivalent (GAE)/g at 0.5 h to 35.56 ± 6.39 mg GAE/g at 2 h, reached its highest measured values at 8 and 12 h (318.89 ± 86.78 and 330.00 ± 82.96 mg GAE/g, respectively), and declined to 26.30 ± 2.13 at 24 h. The flavonoid-equivalent response was lowest at 4 h (14.86 ± 1.57 mg QE/g), increased to 38.53 ± 2.95 at 6 h, and reached its highest value 12 h (50.62 ± 3.39), which was significantly greater than all other sampling times (p < 0.0001). These results indicate time-dependent variation in colorimetric assay responses during release rather than progressive accumulation over time.
2.5. Radical-Scavenging and Colorimetric Responses During In Vitro Simulated Gastrointestinal Digestion
Radical-scavenging responses varied across digestion fractions and showed different patterns for free bee venom (BV) and bee venom-loaded nanoliposomes (BV-LNs) (Table 4). For free BV, DPPH inhibition increased numerically from 9.82 ± 3.25% in the oral fraction (FO) to 16.11 ± 3.76% in the gastric fraction (FG), 25.23 ± 2.62% in the intestinal fraction (FI), and 35.34 ± 4.74% in the dialyzed intestinal fraction (FID). In contrast, BV-LNs exhibited a pronounced gastric decrease: DPPH inhibition declined from 45.98 ± 2.53% in FO to 14.84 ± 2.62% in FG, increased to 51.31 ± 3.12% in FI, and remained detectable at 42.84 ± 2.14% in FID. BV-LNs therefore showed numerically higher DPPH inhibition than free BV in FO, FI, and FID, whereas the gastric responses were similar in magnitude.
Table 4.
Radical-scavenging and colorimetric responses of free bee venom (BV) and bee venom-loaded nanoliposomes (BV-LNs) during in vitro simulated gastrointestinal digestion and dialysis.
ABTS inhibition followed a different formulation-dependent pattern. For free BV, values increased from 6.29 ± 3.75% in FO to 11.65 ± 4.83% in FG and reached 33.71 ± 3.43% in FI and 32.76 ± 3.86% in FID. For BV-LNs, ABTS inhibition decreased from 26.33 ± 2.42% in FO to 7.63 ± 3.24% in FG, followed by responses of 25.44 ± 1.85% in FI and 25.39 ± 2.47% in FID. Thus, BV-LNs exhibited numerically higher ABTS inhibition in FO, whereas free BV showed higher values in FG, FI, and FID. In FID, the direction of the formulation difference was opposite to that observed for DPPH.
The Folin–Ciocalteu reducing-capacity response (FC-RC) was highest in FO for both formulations, reaching 533.11 ± 21.35 mg GAE/g for free BV and 591.11 ± 41.74 mg GAE/g for BV-LNs. Free-BV responses subsequently decreased to 165.33 ± 56.84 mg GAE/g in FG, followed by values of 184.78 ± 71.24 mg GAE/g in FI and 275.11 ± 88.52 mg GAE/g in FID. The corresponding BV-LNs responses were 363.33 ± 32.89, 257.78 ± 21.41, and 341.11 ± 52.74 mg GAE/g, respectively. BV-LNs showed numerically higher FC-RC values than free BV in every corresponding fraction, with the largest difference observed in FG.
Flavonoid-equivalent colorimetric responses (Flv-E) were numerically higher in the intestinal fractions than in the oral and gastric fractions for both formulations. Free BV yielded values of 0.000 ± 0.000 and 0.002 ± 0.001 mg QE/g in FO and FG, respectively, increasing to 0.017 ± 0.001 mg QE/g in FI and 0.026 ± 0.001 mg QE/g in FID. Corresponding BV-LNs values were 0.008 ± 0.003, 0.006 ± 0.002, 0.044 ± 0.001, and 0.046 ± 0.001 mg QE/g. BV-LNs therefore exhibited numerically higher Flv-E responses throughout the evaluated fractions. The reported zero value for free BV in FO represents the result at the displayed numerical precision and should not be interpreted as proof of the absence of reactive constituents.
Overall, inclusion of the free-BV comparator revealed that formulation-associated differences depended on both the digestion fraction and the analytical endpoint. In FID, BV-LNs exhibited numerically higher DPPH, FC-RC, and Flv-E responses, whereas free BV exhibited higher ABTS inhibition. These findings do not indicate a uniform antioxidant advantage of nanoencapsulation. They describe assay-specific responses after simulated digestion and dialysis and do not establish preservation of specific intact compounds or improved retention relative to predigestion values. Overall, the digestion fractions exhibited phase-dependent changes in radical-scavenging activity and colorimetric assay responses. Measurable DPPH and ABTS responses remained detectable in FI and FID after simulated gastrointestinal digestion. These results represent assay-specific functional and colorimetric responses and should not be interpreted as evidence of the preservation of specific intact compounds.
2.6. Antihemolytic Activity of Fractions Obtained During Simulated Gastrointestinal Digestion
For each formulation, blood group, and digestion fraction, responses from ten individually assessed donors were averaged within each independent digestion experiment. Figure 6 presents the mean ± SD of these digestion-level averages from three independent digestion experiments (n = 3). The SD therefore reflects variation among digestion-level averages rather than variability among individual donors.
Figure 6.
Antihemolytic activity of fractions obtained from free bee venom (BV) and bee venom-loaded nanoliposomes (BV-LNs) during simulated gastrointestinal digestion and dialysis. Activity was evaluated in A, B, and O RhD-positive erythrocytes using the oral (FO), gastric (FG), intestinal (FI), and dialyzed intestinal (FID) fractions. For each formulation, blood group, and fraction, responses from ten individually assessed donors were averaged within each independent digestion experiment. Bars represent the mean ± SD of these digestion-level averages from three independent experiments (n = 3). Data were analyzed using one-way ANOVA, with the 24 combinations of formulation, blood group, and digestion fraction treated as levels of a single treatment factor, followed by Tukey-adjusted pairwise comparisons. Across the entire figure, bars sharing no lowercase letter differ significantly (Tukey-adjusted p < 0.05). Full test statistics, including F-values, numerator and denominator degrees of freedom, and p-values, are provided in Supplementary Table S1.
Free BV and BV-LNs exhibited different fraction-dependent antihemolytic profiles. In A RhD-positive erythrocytes, the gastric fraction (FG) produced the highest response for free BV, whereas the dialyzed intestinal fraction (FID) produced the highest response for BV-LNs. For BV-LNs, activity reached 96.28 ± 4.64% in FID, followed by FG (60.63 ± 2.50%), the intestinal fraction (FI; 32.42 ± 3.52%), and the oral fraction (FO; 17.45 ± 5.58%). Compared with the corresponding free-BV fractions, BV-LNs showed numerically higher activity throughout digestion, with the most pronounced difference observed in FID.
In B RhD-positive erythrocytes, FID exhibited the highest activity for both formulations. However, the response was markedly higher for BV-LNs, reaching 99.59 ± 3.87%. The remaining BV-LNs responses were 75.44 ± 1.79% in FG, 47.56 ± 0.29% in FO, and 43.34 ± 3.48% in FI. Each BV-LNs fraction showed numerically higher activity than the corresponding free-BV fraction, indicating a consistent formulation-associated difference under these experimental conditions.
In O RhD-positive erythrocytes, FI produced the highest response for both free BV and BV-LNs. For BV-LNs, activity reached 94.21 ± 1.28% in FI, followed by FG (84.53 ± 3.24%), FID (62.20 ± 2.44%), and FO (54.42 ± 0.87%). BV-LNs again exhibited numerically higher activity than free BV in all corresponding fractions. Nevertheless, the highest response occurred in the intestinal compartment rather than in FID, demonstrating that the distribution of antihemolytic activity across fractions differed from that observed in A and B RhD-positive erythrocytes.
Overall, BV-LNs exhibited numerically greater antihemolytic activity than free BV in all corresponding digestion fractions and blood groups. The contrasting profiles were particularly evident in FID for A and B RhD-positive erythrocytes and in FI for O RhD-positive erythrocytes. These comparisons extend the characterization beyond the behavior of BV-LNs alone by providing a free-venom comparator. They describe formulation-associated differences in functional responses after digestion and dialysis, but do not establish preservation of intact venom peptides or identify the molecular mechanisms responsible for the observed activity.
2.7. Relative Analytical Responses After Simulated Digestion and Dialysis
The predigestion response was defined as 100% for each assay, and the response in the dialyzed intestinal fraction (FID) was expressed relative to this baseline (Figure 7). The relative DPPH response was 99.43 ± 1.45%, whereas the relative ABTS response was 41.67 ± 3.46%. The Folin–Ciocalteu response reached 78.12 ± 3.74%, while the flavonoid-equivalent response was 2.18 ± 0.40%. Thus, the magnitude of the postdigestion responded varied among analytical methods, with DPPH showing the highest relative response and the flavonoid-equivalent assay the lowest. Because the Folin–Ciocalteu and aluminum chloride assays are nonspecific colorimetric methods, these percentages represent relative assay responses and should not be interpreted as recovery of identified phenolic or flavonoid compounds.
Figure 7.
Relative analytical responses (%) after in vitro simulated gastrointestinal digestion and dialysis. DPPH and ABTS radical-scavenging responses, the Folin–Ciocalteu reducing-capacity response (FC-RC), and the flavonoid-equivalent colorimetric response (Flv-E) were determined in the dialyzed intestinal fraction (FID) obtained after digestion of bee venom-loaded nanoliposomes (BV-LNs). Different lowercase letters above the bars indicate statistically significant differences among the relative analytical responses. Results were expressed as percentages of the corresponding predigestion responses, each defined as 100%.
In the separate experiment using purified melittin, the FID showed a relative UV response of 80.55 ± 3.47% compared with predigestion baseline. Because quantification was based on UV absorbance using melittin as the analytical reference, this value represents melittin-equivalent UV-absorbing material and does not demonstrate that 80.55% of intact melittin remained after digestion. Overall, these results describe the proportion of each analytical response detected after simulated gastrointestinal digestion and dialysis relative to its respective predigestion value. No inferential comparisons were made among assays because they represent different analytical endpoints.
3. Discussion
The antioxidant assays revealed that incorporation of BV into nanoliposomes affected the measured responses differently. DPPH inhibition did not differ significantly between free BV and BV-LNs (71.47 ± 1.15% and 69.67 ± 1.37%, respectively), and the same pattern was observed for FRAP. In contrast, ABTS inhibition increased from 55.72 ± 4.89% for free BV to 69.17 ± 1.06% for BV-LNs, a difference of 13.45 percentage points.
The negligible responses of ENLs indicate that the lipid carrier alone contributed little to these measurements. The higher ABTS response was therefore associated with the BV-containing formulation rather than an independently strong antioxidant response of the empty carrier. This distinction among assays is consistent with their different reaction environments, reagent accessibility, and sensitivity to individual constituents [21,22,23]. Orrù et al. [24] demonstrated experimentally that the DPPH response of bee venom depended on solvent and pH. At 30 min, they reported IC50 values of 230.3 and 177.3 µg/mL in detergent-containing buffers at pH 5 and 6, respectively. Their results establish that the analytical environment can change the measured response of the same venom preparation. In the present study, the selective increase in ABTS, without corresponding increases in DPPH or FRAP, similarly indicates that formulation effects depended on the assay used. Altered accessibility of BV constituents to the reagents is a possible explanation for this pattern.
A formulation-dependent antioxidant response was also reported by Qanash et al. [25], who obtained DPPH IC50 values of 4.26 µg/mL for a BV/polyvinyl alcohol/zinc oxide nanofilm and 19.43 µg/mL for free BV. Their protocol used test-sample concentrations of 3.9–1000 µg/mL and ethanolic DPPH, with incubation for 30 min at room temperature and detection at 517 nm. Unlike that formulation, BV-LNs did not significantly increase DPPH inhibition relative to free BV in the present study. However, the nanofilm contained additional matrix components, and its reported concentrations should not be assumed to represent BV-equivalent doses. Furthermore, concentration–response IC50 values cannot be directly compared with percentage inhibition measured at a single sample concentration. This study therefore provides contextual evidence of formulation-associated changes in BV antioxidant responses rather than a basis for ranking the potency of the two delivery systems.
Liposomal encapsulation also does not necessarily increase the measured antioxidant activity of peptide preparations. Auwal et al. [26] reported DPPH inhibition of 48.94 ± 1.22% for unencapsulated stone fish-derived peptides before storage. After eight weeks at 4 °C, the corresponding values were 25.68 ± 0.33%, 36.16 ± 0.44%, and 34.07 ± 0.52% for non-cryoprotected, sucrose-cryoprotected, and trehalose-cryoprotected liposomal formulations, respectively. Their assay used a 10 mg/mL free-peptide solution, methanolic DPPH, and incubation for 30 min at 25 °C; liposomal samples were pretreated with Triton X-100. These conditions differ from the present ethanolic DPPH assay conducted for 30 min at 37 °C. The findings illustrate the importance of matrix composition, sample preparation, and storage history when interpreting liposomal antioxidant responses. They do not establish relative antioxidant potency between fish peptides and BV or demonstrate storage protection by the present BV-LNs formulation.
Accordingly, BV-LNs exhibited a higher ABTS response while retaining measurable DPPH and FRAP responses that did not differ significantly from free BV. The evidence supports an assay-specific formulation effect rather than a uniform enhancement of antioxidant capacity. Comparisons with published formulations provide useful context, but differences in payload composition, dose expression, reaction conditions, and analytical endpoints preclude direct claims of superior antioxidant performance.
Direct erythrocyte exposure revealed that the effect of nanoencapsulation depended on both concentration and duration. At 2 µg/mL, BV-LNs exhibited higher hemocompatibility than free BV after 4–6 h, reaching 86.26 ± 0.74% compared with 78.24 ± 2.64% at 6 h. This advantage was not maintained at higher concentrations. At 10 µg/mL, BV-LNs showed lower hemocompatibility after 3–5 h, whereas at 40 µg/mL it produced a lower value at 6 h. ENLs maintained hemocompatibility above 91% throughout the evaluated conditions, supporting a substantial contribution of the incorporated venom to membrane damage.
These findings are biologically consistent with the membrane activity of BV constituents. DeGrado et al. [21] characterized hemolysis induced by melittin, establishing its direct membrane-disruptive action. The present concentration- and time-dependent decrease in hemocompatibility is compatible with this behavior, although the material evaluated here was whole venom.
A relevant whole-venom precedent is the formulation developed by Silva et al. [27] for venom immunotherapy. They reported complete inhibition of hemolytic activity following chemical modification of BV with para-bromophenacyl bromide and N-bromosuccinimide, and subsequently formulated the modified venom in stabilized liposomes. This result cannot be attributed to physical encapsulation alone because the venom had undergone chemical detoxification. In contrast, the present study incorporated whole BV without these chemical modifications and found only a condition-dependent improvement in hemocompatibility. The comparison emphasizes that reduced erythrocyte damage depends on both payload treatment and carrier design, rather than being an intrinsic consequence of liposomal incorporation.
Cyboran-Mikolajczyk et al. [28] showed that phosphatidylcholine-based Photolon liposomes modified erythrocyte membrane potential, stiffness, and shape. Compared with that system, the present results emphasize the additional importance of payload composition: a phospholipid carrier can interact with erythrocytes, while incorporation of a membrane-active mixture introduces further concentration-dependent effects. Thus, the hemocompatibility benefit of BV-LNs was restricted to specific low-concentration exposure conditions.
Concentration-dependent erythrocyte damage has also been reported for melittin-functionalized liposomes. Dos Santos Rodrigues et al. [29] evaluated melittin-modified liposomes, with or without transferrin, using rat erythrocytes incubated for 1 h at 37 °C. These formulations produced 15.6% hemolysis at the highest reported phospholipid concentration of 1000 nM. Thus, liposomal presentation did not completely eliminate the membrane-disruptive activity associated with melittin. This qualitative concentration dependence is consistent with the residual erythrocyte damage observed for BV-LNs, although the numerical responses cannot be directly ranked: their exposure was expressed as phospholipid concentration and involved surface-conjugated melittin and rat erythrocytes, whereas the present experiments used BV-equivalent concentrations and human erythrocytes.
The antihemolytic assay revealed a different formulation response from direct hemocompatibility. At 2 µg/mL, free BV and BV-LNs showed high activity without a significant difference. At 10 and 40 µg/mL, however, BV-LNs exhibited greater protection than free BV, with differences of 34.55 and 40.50 percentage points, respectively. The low activity of ENLs indicates that the carrier alone did not reproduce the protective response of BV-LNs.
The AAPH model evaluates erythrocyte injury initiated by radical generation in an oxygenated environment. Previous studies have connected this injury to oxidation of membrane lipids, proteins, and sulfhydryl groups [30,31]. Radical interception is therefore a plausible contributor to the observed protection. The present chemical antioxidant measurements provide complementary evidence of reactivity, while the erythrocyte assay measures the net functional response during oxidative exposure.
The coexistence of greater antihemolytic activity and reduced direct hemocompatibility is informative. These endpoints were obtained under different assay conditions and describe distinct biological challenges. BV-LNs could produce a stronger protective response during AAPH exposure while still causing direct membrane damage as concentration or exposure duration increased. Consequently, the antihemolytic advantage should be interpreted specifically within the oxidative-challenge assay.
The comparison of digestion fractions further showed that BV-LNs generally produced greater protection against AAPH-induced hemolysis than free BV subjected to the same digestion protocol. The formulation-associated difference was particularly pronounced in FID for A and B RhD-positive erythrocytes, where BV-LNs reached antihemolytic activities of 96.28 ± 4.64% and 99.59 ± 3.87%, respectively. In O RhD-positive erythrocytes, the highest BV-LNs response occurred in FI (94.21 ± 1.28%), indicating that the distribution of functional activity across digestion fractions depended on the erythrocyte preparation evaluated. These findings support a formulation-associated advantage in postdigestion antihemolytic responses under the tested conditions. Possible contributors include differences in constituent accessibility, partitioning during dialysis, and the formation of bioactive digestion products; however, these mechanisms were not directly established. Greater postdigestion activity does not by itself demonstrate improved retention relative to the initial activity or preservation of intact melittin or other venom peptides.
Importantly, these published hemolysis measurements assess damage caused by the venom, peptide, or formulation itself; they do not establish protection against an independently imposed oxidative challenge. The present AAPH assay addresses this separate endpoint. Therefore, the greater protection afforded by BV-LNs at 10 and 40 µg/mL should be interpreted as a higher net antihemolytic response under oxidative-challenge conditions, rather than as evidence that the formulation is intrinsically nonhemolytic. Conversely, reduced direct hemolysis in other liposomal systems does not demonstrate antioxidant erythroprotection. Evaluating both endpoints is necessary to distinguish attenuation of formulation-induced membrane damage from protection against oxidant-induced injury.
On the other hand, representative micrographs complemented these measurements. AAPH-exposed erythrocytes showed irregular and ghost-like profiles, whereas BV-LNs-treated erythrocytes under oxidative stress displayed qualitatively better-preserved contours. This combination of functional and morphological observations follows the complementary approach used in studies of erythrocyte membrane protection, including that of Kaźmierczak et al. [32]. Together, the findings support a formulation-associated antihemolytic response under the evaluated conditions.
BV-LNs exhibited a hydrodynamic diameter of 132.00 ± 14.23 nm and a PDI of 0.18 ± 0.03. Neither parameter differed significantly from ENLs. In contrast, BV-LNs exhibited a more negative zeta potential, changing from −27 ± 2 mV for ENLs to −33 ± 2 mV after BV incorporation. This pattern indicates that incorporation affected electrokinetic behavior more clearly than the measured size distribution.
A useful comparison is provided by Hanachi et al. [33]. Their SHH3 salmon-peptide liposomes exhibited a diameter of 143.87 ± 3.99 nm, a PDI of 0.27 ± 0.02, and a zeta potential of −32.30 ± 0.36 mV. BV-LNs therefore occupied a similar size range and exhibited a similar negative electrokinetic potential, with a numerically lower PDI. However, peptide incorporation made their potential less negative relative to empty liposomes, whereas BV incorporation produced the opposite direction of change here. This contrast supports composition-dependent modification of the vesicle–medium interface.
The apparent encapsulation efficiency of BV-LNs was 84.43 ± 2.26%, compared with 17.27 ± 3.08% for the SHH3 formulation reported by Hanachi et al. [33]. This numerical difference concerns distinct payloads, lipid compositions, and analytical procedures; it should be interpreted as variation among formulation systems rather than evidence of superior encapsulation performance.
More directly relevant comparisons are available for whole-BV liposomes. Badivi et al. [34] reported a diameter of 193.72 ± 7.35 nm, a PDI of 0.185 ± 0.010, and an encapsulation efficiency of 93.90 ± 1.25% for their optimized non-PEGylated formulation. Following PEG modification, these values were 171.28 ± 5.25 nm, 0.173 ± 0.013, and 96.74 ± 1.49%, respectively. Compared with these formulations, the present BV-LNs exhibited a numerically smaller diameter (132.00 ± 14.23 nm), a similar PDI (0.18 ± 0.03), and a lower apparent encapsulation efficiency. These comparisons place the present formulation within the physicochemical range of published whole-venom liposomes, although differences in lipid composition, processing, and encapsulation assays preclude a direct ranking of formulation performance.
Abd El-Gawad et al. [35] reported whole-BV nanoliposomes with a diameter of 230.9 ± 5.21 nm, a PDI of 0.201 ± 0.01, and a positive zeta potential of +46.5 ± 1.25 mV. Their preparation included a chitosan-coating step, providing a relevant compositional difference when interpreting the opposite charge polarity relative to the present BV-LNs (−33.00 ± 2 mV). Thus, whole-venom incorporation does not produce a uniform electrokinetic signature across liposomal systems. The smaller diameter and negative potential observed here describe a different formulation profile rather than evidence of greater biological compatibility or stability.
For isolated melittin, Li et al. [36] reported optimized Mel-Lip with a diameter of 132.7 ± 1.55 nm, a PDI of 0.23 ± 0.01, a zeta potential of −11.5 ± 1.51 mV, and an encapsulation efficiency of 86.25 ± 1.28%. Their hyaluronic acid-modified formulation exhibited corresponding values of 124.3 ± 8.93 nm, 0.19 ± 0.02, −12.4 ± 1.08 mV, and 90.43 ± 0.41%. The present whole-BV formulation therefore had a numerically similar diameter to Mel-Lip, a lower PDI, and a more negative zeta potential. Its apparent encapsulation efficiency was numerically close to that of Mel-Lip; however, Li et al. [36] quantified melittin using HPLC after ultrafiltration, whereas the present indirect UV-based determination measures BV-derived UV-absorbing material. Accordingly, these efficiencies are operationally different and do not establish equivalent loading or retention of individual venom peptides.
SEM showed predominantly rounded structures in dried ENLs and BV-LNs, including regions of close contact or aggregation. These observations complement DLS measurements of particles in dispersion. Apparent aqueous recovery and resistance to centrifugal separation further describe separate aspects of formulation behavior. Collectively, the characterization supports the preparation of nanoscale BV-containing dispersions with measurable payload association and limited separation during the applied centrifugal challenge.
The annotated SEM dimensions of approximately 200 and 260–300 nm correspond to selected structures with clearly distinguishable boundaries in the lyophilized, gold-coated specimens. These measurements are larger than the mean hydrodynamic diameter determined by DLS in aqueous dispersion (132.00 ± 14.23 nm), but the two measurements are not directly equivalent. SEM provides projected dimensions of individual dried structures, whereas DLS estimates hydrodynamic size from particle diffusion in dispersion. Drying-associated changes and particle association may contribute to the observed discrepancy, although their individual contributions were not determined. The annotations were included to illustrate the dimensions of selected structures and should not be interpreted as a representative particle-size distribution.
Free BV showed a rapid increase in receptor-medium BV-derived UV-absorbing material during the first 6 h, followed by relatively small changes. BV-LNs displayed a more gradual increase over 24 h. At the final sampling point, the BV-LNs concentration was approximately 73% lower than that of free BV. The comparison therefore identifies a clear formulation-associated difference in the temporal appearance of the measured material.
Modi and Anderson [37] demonstrated that dynamic dialysis profiles depend on both availability from the carrier and subsequent membrane transport. Their analysis provides the appropriate framework for interpreting the present experiment: both preparations were evaluated using the same dialysis system, and the observed difference describes their apparent transfer under those conditions. Association with the liposomal dispersion offers a plausible explanation for the more gradual BV-LNs profile. The principal finding is therefore altered apparent transfer following formulation.
The release fractions exhibited opposing DPPH and ABTS trends. DPPH inhibition decreased from 71.76 ± 3.67% at 0.5 h to 43.09 ± 3.82% at 24 h, whereas ABTS inhibition increased from 27.56 ± 1.31% to 60.94 ± 1.41%. These patterns show that increasing receptor-medium UV signal did not correspond to a parallel increase in every functional endpoint. Xie and Schaich [38] demonstrated that DPPH responses depend on reaction conditions and accessibility, providing a basis for distinguishing chemical reactivity from transferred material. Here, the contrasting assay trends suggest that the collected fractions differed in their relative reactivity toward DPPH and ABTS.
Folin–Ciocalteu and flavonoid-equivalent responses were also nonmonotonic. Folin–Ciocalteu values were highest at 8–12 h, whereas the flavonoid-equivalent response peaked at 12 h. The differing temporal patterns indicate that no single analytical signal adequately represents the chemical behavior of all collected fractions.
Digestion produced a pronounced gastric decrease followed by higher intestinal radical-scavenging responses. DPPH inhibition decreased from 45.98 ± 2.53% in FO to 14.84 ± 2.62% in FG, increased to 51.31 ± 3.12% in FI, and remained measurable in FID at 42.84 ± 2.14%. ABTS inhibition showed a similar gastric decrease, but FO, FI, and FID were statistically comparable. Thus, the intestinal change differed in magnitude between assays.
Gong et al. [39] investigated casein-peptide liposomes during digestion, providing a related peptide-delivery context for considering changes in liposomal behavior across gastrointestinal conditions. In the present system, changes in pH, enzymatic exposure, constituent accessibility, and formation of digestion products are possible contributors to the phase-dependent response. These processes are hypotheses for interpreting the observed pattern, rather than individually established explanations.
The Folin–Ciocalteu response decreased from FO to FI even as DPPH inhibition increased. This divergence is consistent with the different chemical reactions measured by the assays. Everette et al. [40] demonstrated Folin–Ciocalteu reactivity with several nonphenolic compound classes, while Shraim et al. [41] showed the structure-dependent nature of aluminum chloride responses. Accordingly, the numerically higher intestinal flavonoid-equivalent signals characterize a change in colorimetric response. The digestion results collectively indicate a redistribution of assay-specific reactivity across fractions, with detectable activity in FID.
The postdigestion erythrocyte assays extended the chemical characterization to membrane protection during oxidative exposure. FID produced the highest antihemolytic response within A and B RhD-positive erythrocytes, reaching 96.28 ± 4.64% and 99.59 ± 3.87%, respectively. Within O RhD-positive erythrocytes, FI showed the highest response at 94.21 ± 1.28%, whereas FID reached 62.20 ± 2.44%.
Studies using the AAPH model show that erythrocyte protection integrates interactions with a biological membrane and oxidative injury processes [30,31,32]. This provides a basis for understanding why the functional ranking of digestion fractions need not match their DPPH or ABTS ranking. In the present study, FI had the greatest DPPH response, yet FID produced the greatest antihemolytic response within A and B preparations. Chemical radical inhibition and membrane protection therefore described complementary properties of the digestion fractions. These findings establish that antihemolytic activity remained detectable after digestion and dialysis, with fraction-dependent patterns within the erythrocyte groups evaluated.
Normalization to the corresponding predigestion measurement provided a separate reference for each analytical endpoint. The differing relative responses indicate that digestion and dialysis did not affect all measured reactions proportionally. In particular, chemical radical inhibition, reducing-capacity equivalents, and flavonoid-equivalent colorimetric responses characterized distinct aspects of the resulting material.
The value of this comparison lies in displaying the postdigestion response profile across complementary assays. Reporting each endpoint separately preserves that information and provides a more informative description of BV-LNs behavior than assigning a single percentage of antioxidant retention.
4. Materials and Methods
4.1. Chemical Reagents
All reagents and materials used in this study were of analytical grade and obtained from certified commercial sources. Soy phosphatidylcholine (SPC), cholesterol, and the reagents DPPH (1,1-diphenyl-2-picrylhydrazyl), ABTS [2,2′-azinobis(3-ethylbenzothiazoline)-6-sulfonic acid), dimethyl sulfoxide (DMSO), sodium acetate buffer, ferric chloride (FeCl3), TPTZ (2,4,6-tripyridyl-s-triazine), Triton X-100, AAPH [2,2′-azobis(2-methylpropionamidine) dihydrochloride], and phosphate-buffered saline (PBS) were purchased from Sigma-Aldrich (St. Louis, MO, USA).
The enzymatic reagents used for the in vitro simulation of gastrointestinal digestion, including α-amylase, pepsin from porcine gastric mucosa, pancreatin from porcine pancreas, and lipase, were also sourced from Sigma-Aldrich. Purifief Melittin was acquired from same supplier and used as an analytical standard in the corresponding biochemical and spectrophotometric assays.
4.2. Bee Venom Source, Collection, and Processing
Raw BV was collected during the summer of 2025 from three healthy Apis mellifera colonies located in the Valles Region of Jalisco, Mexico. Species identity and colony health were confirmed by an experienced beekeeper from the Centro Universitario de Ciencias Biológicas y Agropecuarias, Universidad de Guadalajara. Venom was collected using a non-lethal electrical stimulation system (Beestar FF-3 Microcomputer Bee Venom Collector; Chengdu Mayaland Trading Co., Ltd., Chengdu, China) equipped with a 450 × 350 mm glass collection surface.
Venom was collected independently from each colony, generating three colony-derived batches. Before experimental use, the three batches were combined in equal proportions to obtain a representative pooled BV sample. The inclusion of three colonies was intended to reduce dependence on a single-colony source and to incorporate biological variability among colonies from the same geographical region.
After collection, deposited venom was carefully removed from the glass surface using and lyophilized for 24 h using Free Zone 4.5 L freeze dryer (Labconco, Kansas City, MO, USA) under the specified experimental conditions. The lyophilized BV was transferred to airtight amber glass vials and stored at −20 °C, protected from light and moisture, until experimental use.
4.3. Ethical Handling of Human Erythrocyte Membrane-Based Assays
Human blood samples were obtained through the Clinical Analysis Laboratory of the Centro Universitario de los Valles, Universidad de Guadalajara. The laboratory operates under quality-management frameworks based on ISO/IEC 17025, ISO 15189, and ISO 9001 [42,43]. A total of 30 apparently healthy adult volunteers between 20 and 40 years old were included. Participants were distributed equally among three ABO blood groups, comprising 10 RhD-positive donors each from groups A, B, and O (n = 10 per group; N = 30). Eligible participants had erythrocyte counts between 4.7 and 6.1 × 10⁶ cells/µL and no self-reported recent blood loss or condition associated with reduced hemoglobin concentration. Individuals with diagnosed chronic degenerative diseases, active or recent infectious diseases, or other conditions potentially affect systemic oxidative status or erythrocyte characteristics were excluded. Venous blood was collected in sterile vacuum tubes containing EDTA, as anticoagulant. Erythrocytes were subsequently isolated and used as a biological model for assessment hemocompatibility and protection against experimentally induced hemolysis [44,45].
Before blood collection, all participants were informed regarding the study procedures, intended use of biological samples, confidentiality of personal information, and voluntary nature of their participation. Written informed consent was obtained from each participant. The procedures were conducted in accordance with the International ethical guidelines for health-related research involving humans (Council for International Organizations of Medical Sciences [CIOMS], 2016) [46] and applicable regulations governing the handling of human blood and blood components, including the Mexican Official Standard NOM-253-SSA1-2012 [47]. The study protocol was reviewed and approved on 18 May 2023 by the Research Committee of the Hospital General del Estado “Dr. Ernesto Ramos Bours”, Servicios de Salud de Sonora (approval No. CI 2023-47).
4.4. Antioxidant Properties of Bee Venom
The antioxidant responses of free BV and BV-LNs were evaluated using three complementary assays: DPPH [48], ABTS [49], and FRAP [50]. Absorbance was measured with a microplate spectrophotometer to assess free radical scavenging and electron-donating capacity. In the DPPH test, a solution of the radical in ethanol was adjusted to an initial absorbance of 0.7 ± 0.02 at 515 nm. To initiate the reaction, 20 µL of the test sample was added to 200 µL of the DPPH reagent, followed by a 30-min incubation (New Brunswick Scientific, Innova 44, Enfield, NJ, USA, 37 °C, 200 rpm) period in darkness before measuring absorbance. For the ABTS method, the radical cation (ABTS+•) was generated by reacting ABTS with potassium persulfate and allowing the solution to stand in the dark for 16 h. The radical solution was subsequently diluted with ethanol until reaching an absorbance of 0.7 ± 0.02 at 734 nm. Thereafter, 270 µL of the ABTS+• solution was mixed with 20 µL of the sample and incubated in the absence of light for 30 min prior to reading. In the FRAP assay, the working reagent was freshly prepared by combining sodium acetate buffer, TPTZ, and FeCl3 in a 10:1:1 volume ratio. Then, 20 µL of the test solution was added to 280 µL of the FRAP reagent and incubated for 30 min in the dark, after which the absorbance was recorded at 638 nm. All measurements were carried out in triplicate. Antioxidant results were reported as percentage inhibition for the DPPH and ABTS assays, and as micromoles of Trolox equivalents per gram of dry weight for the FRAP method.
4.5. Assessment of the Erythroprotective Activity of Bee Venom in Human Erythrocytes
4.5.1. Evaluation of Bee Venom Hemocompatibility
The hemocompatibility of free BV, ENLs and BV-LNs was evaluated assay using a direct hemolysis assay adapted from Ruiz-Cruz et al. [51]. Human erythrocytes were obtained from ten independent healthy O RhD-positive donors, as described in Section 4.3. Each donor was considered an independent biological replicate, whereas repeated measurements performed on the same erythrocyte preparation were considered technical replicates. Whole blood samples were collected by venipuncture into EDTA-coated tubes. Erythrocytes were isolated and washed three times with phosphate-buffered saline (PBS, 0.15 M, pH 7.4) by centrifugation at 2000× g for 10 min at 4 °C fixed-angle rotor FA-24×2 (Eppendorf SE, Centrifuge 5425 R, Hamburg, Germany). The resulting packed cells were resuspended in PBS to obtain a 10% (v/v) erythrocyte suspension.
For the hemocompatibility assay, 100 µL of the erythrocyte suspension was combined with 150 µL of the corresponding treatment and 100 µL of PBS. BV and BV-LNs were evaluated at BV-equivalent concentrations of 2, 10, and 40 µg/mL, whereas ENLs were tested at lipid concentrations corresponding to those present in the respective BV-LNs formulations. The mixtures were incubated at 37 °C for up 6 h, Hemolysis was assessed at 1-h intervals over the 6-h exposure period (1, 2, 3, 4, 5, and 6 h) to evaluate time-dependent changes in erythrocyte membrane integrity.
At each sample point, the erythrocyte suspensions were centrifuged to pellet intact cells and cellular debris, and the supernatant was collected. Aliquots of 300 µL were transferred to a 96-well microplate, and hemoglobin release was measured by spectrophotometry at 540 nm. PBS-treated erythrocytes served as the negative control (0% hemolysis), while 1% Triton X-100-treated erythrocytes were employed as the positive control (100% hemolysis). Technical measurements were performed in triplicate and averaged for each donor before statistical analysis.
Hemolysis was calculated using the following Equation (1):
where Asample is the absorbance of the tested formulation, APBS is the absorbance of the negative control, and ATriton is the absorbance of the 1% Triton X-100 positive control.
Hemocompatibility was subsequently expressed as (2):
The assay was used to characterize the concentration- and time-dependent effects of free BV, ENLs, and BV-LNs on erythrocyte membrane integrity under the experimental conditions.
4.5.2. Antihemolytic Activity Against AAPH-Induced Oxidative Hemolysis
The erythroprotective responses of free BV, empty nanoliposomes (ENLs), BV-LNs, and the corresponding experimental fractions were assessed by measuring protection against AAPH-induced oxidative hemolysis, following a procedure adapted from Ruiz-Cruz et al. [51]. For the comparison among free BV, ENLs, and BV-LNs, erythrocytes were obtained from 10 independent healthy O RhD-positive donors aged 20–40 years. Each donor was considered an independent biological replicate, whereas repeated measurements performed using the same erythrocyte preparation were considered technical replicates.
For the evaluation of fractions obtained during simulated gastrointestinal digestion, an additional exploratory experiment was conducted using erythrocytes from 30 independent RhD-positive donors, comprising 10 donors from each ABO blood group (A, B, and O). The same erythrocyte preparation from each donor was used to evaluate the oral (FO), gastric (FG), intestinal (FI), and dialyzed intestinal (FID) fractions, thereby accounting for repeated measurements within donors.
A 2% (v/v) erythrocyte suspension was prepared in PBS, and AAPH solution at final concentration of 40 mM (pH 7.4). For each assay, 100 μL of erythrocyte suspension was combined with 100 μL of the bee venom-containing sample and 100 μL of the AAPH solution. Erythrocytes incubated with AAPH in the absence of test sample served as the oxidative hemolysis control, whereas erythrocytes incubated with PBS without AAPH served as the non-oxidative control.
All samples were incubated at 37 °C for 3 h under continuous agitation at 45 rpm. Following incubation, 1 mL of PBS was added to each reaction mixture, and samples was centrifuged at 2000× g for 10 min. The supernatant was collected, and hemoglobin release was quantified by measuring absorbance at 540 nm using a microplate spectrophotometer. Technical measurements were performed in triplicate and averaged for each donor before statistical analysis.
4.5.3. Assessment of Erythrocyte Morphology Under Oxidative Stress
Erythrocyte morphology following AAPH-induced oxidative stress was evaluated by optical microscopy. Samples were obtained from the erythrocyte pellets remaining after completion of the hemolysis assay. Blood smears were prepared immediately, air-dried, and stained with Wright’s stain to facilitate visualization of erythrocyte morphology [51].
Micrographs were acquired using an Eclipse FN1 microscope (Nikon Corporation, Eclipse FN1, Tokyo, Japan) equipped with an Orca-Flash4.0 digital camara (Hamamatsu Photonics, Hamamatsu, Japan) and NIS-Elements AR software, version 5.30. Representative fields were imaged under 100× and an 8 µm scale bar was included in each image. Morphological assessment was qualitative and focused on changes in erythrocyte shape, membrane contour, and the presence of damaged or ghost-like cells under the evaluated experimental conditions.
4.6. Physicochemical Characterization and Stability of Nanoliposomal Systems
4.6.1. Preparation of Bee Venom-Loaded Nanoliposomes
BV-LNs were prepared by thin-film hydration followed by probe sonication [52,53]. Soy phosphatidylcholine (SPC) (70 mg) and cholesterol (14 mg) were dissolved in 20 mL of a chloroform–methanol mixture (2:1, v/v), corresponding to an SPC:cholesterol mass ratio of 5:1 w/w. The solution was transferred to round-bottom flask, and the organic solvents were removed under reduced pressure at 40–50 °C using a rotary evaporator (Laborota 4000, Heidolph Instruments, Schwabach, Germany; R-210, BÜCHI Labortechnik AG, Flawil, Switzerland) until a thin, homogeneous lipid film was formed on the inner wall of the flask.” The film was subsequently exposed to a nitrogen stream for 1 h to facilitate removal of residual organic solvent.
The dried lipid film was hydrated with 20 mL of a BV solution prepared in PBS (0.05 M, pH 7.4) under continuous stirring at 40–50 °C for 30 min, allowing the formation of multilamellar vesicles. The resulting dispersion was reduced in size by probe sonication using an ultrasonic processor (VCX-130, Sonics & Materials Inc., Newtown, CT, USA; maximum output power 130 W, frequency 20 kHz). Sonication was performed at 55% amplitude using alternating 60-s sonication and 60-s pause cycles for a cumulative sonication time of 15 min. Samples were maintained in an ice bath throughout sonication to minimize temperature increases and potential degradation of BV.
ENLs were prepared using the same procedure and lipid composition, except that the hydration medium contained no BV. ENLs were used as formulation controls in the subsequent physicochemical, antioxidant, and erythrocyte-based assays. The resulting BV-LN and ENL dispersions were subsequently characterized for hydrodynamic diameter, PDI, zeta potential, encapsulation efficiency (EE), apparent aqueous recovery, and resistance to centrifugal separation.
4.6.2. Morphological Characterization of Nanoliposomes by Scanning Electron Microscopy
Scanning electron microscopy (SEM) was employed to use to qualitatively characterize the morphology of ENLs and BV-LNs after lyophilization. Prior to analysis, nanoliposome suspensions were freeze-dried for 24 h using a Free Zone 4.5 L (Labconco, Kansas City, MO, USA) at −84 °C and 0.045 mbar.
The lyophilized samples were mounted on aluminum stubs using conductive copper tape and sputter-coated with a thin layer of gold to improve electrical conductivity. Samples were examined using a JSM-6610LV SEM (JEOL Ltd., Tokyo, Japan) under high-vacuum conditions at an appropriate accelerating voltage. Representative micrographs were acquired at 35,000×.
SEM micrographs were qualitatively evaluated for particle morphology, surface appearance, and the presence of particle aggregation. Because SEM analysis was performed on dried and metal-coated specimens, the observations were used to describe the morphology of the lyophilized formulations and were not interpreted as direct measurements of vesicle morphology in aqueous dispersion, lipid-bilayer integrity, or colloidal stability [51,54].
4.6.3. Hydrodynamic Diameter, Polydispersity Index, and Zeta Potential
Hydrodynamic diameter (Dz), PDI [55], and zeta potential (ζ) [56] were determined for ENLs and BV-LNs using a Nano-ZS90 (Malvern Instruments Ltd., Malvern, UK). Prior to analysis, 1.0 mL portion of each liposomal dispersion was diluted in 100 mL of PBS (0.05 M, pH 7.4) and transferred to a polystyrene cuvette for analysis to obtain an appropriate particle concentration for light-scattering measurements. Three independently prepared formulation batches were analyzed for each formulation (n = 3). Each batch was measured in triplicate, and technical replicates were averaged to obtain a single value for each independent batch. Results are reported as mean ± SD from the three independently prepared batches.
4.6.4. Apparent Encapsulation Efficiency
The apparent encapsulation efficiency (EE) of BV-LNs was determined indirectly by quantifying non-associated BV-derived protein/peptide material after separation from the nanoliposome-containing fraction by centrifugal ultrafiltration, following an adapted procedure [57]. Samples were processed using centrifugal ultrafiltration devices (Amicon® Ultra-0.5, Merck Millipore, Burlington, MA, USA) with a membrane molecular-weight cutoff of 100 kDa. Ultrafiltration was performed at 10,000× g for 20 min at 4 °C. The membrane retained the nanoliposome-containing fraction, whereas the ultrafiltrate was collected for determination of non-associated BV-derived material
The concentration of non-associated BV-derived material was estimated by measuring absorbance at 280 nm using a UV–Vis microplate spectrophotometer (Multiskan GO, Thermo Fisher Scientific, Waltham, MA, USA)). Purified melittin was used as the calibration standard, and concentrations were expressed as melittin equivalents (ME). ENLs processed under identical conditions were used to correct for background absorbance attributable to the lipid formulation and analytical matrix.
The total apparent amount of BV-derived UV-absorbing material was determined in an equivalent aliquot of BV-LNs after disruption of the nanoliposomes with a methanol–water mixture (80:20, v/v). Samples were vortexed for 2 min and centrifuged at 12,000× g for 10 min at 4 °C to remove insoluble material. The resulting supernatant was analyzed at 280 nm under the same analytical conditions. Apparent EE (%) was calculated using Equation (3):
where BVtotal represents the total amount of UV-absorbing BV-derived material measured after vesicle disruption and BVfree represents the corresponding non-associated material recovered in the ultrafiltrate. Both amounts were expressed as ME and calculated accounting for the respective sample volumes and dilution factors.
Three independently prepared BV-LNs batches were analyzed (n = 3). Each batch was measured in triplicate, and technical replicates were averaged before statistical analysis. Because crude BV contains multiple proteins and peptides that absorb at 280 nm, this procedure does not specifically quantify intact melittin. Accordingly, the resulting value was interpreted as an operational estimate of BV-derived UV-absorbing material (BV-UV material) associated with the nanoliposome-containing fraction, rather than as a compound-specific measurement of the encapsulation efficiency of intact melittin. This approach does not distinguish material enclosed within the vesicles from material associated with their external surface.
4.6.5. Apparent Aqueous Recovery of BV-Derived Material
Apparent aqueous recovery assesses the recovery of material in the aqueous phase following dispersion and separation of undispersed material [54]. An aliquot of lyophilized BV-LNs (1 mg) was dispersed in 1 mL of ultrapure water and sonicated for 5 min to promote dispersion. The suspension was then centrifuged at 3354× g for 10 min to sediment undispersed material. A 988 µL aliquot of the resulting supernatant was transferred to a clean tube and mixed with 5 mL of methanol–water (80:20, v/v) to disrupt residual nanoliposomal structures and extract bee venom-derived UV-absorbing material (BV-UV material). The mixture was vortexed for 1 min and centrifuged at 1207× g for 10 min at 25 °C. The supernatant was collected, and the pellet remaining after centrifugation was re-extracted with an additional 5 mL of methanol–water (80:20, v/v). The supernatants from both extraction steps were pooled for spectrophotometric analysis.
Absorbance was measured at 280 nm using a 96-well microplate UV–Vis spectrophotometer (Multiskan GO, Thermo Fisher Scientific Inc., New York, NY, USA). Methanol–water (80:20, v/v) was used as the analytical blank. Apparent concentrations of bee venom-derived UV-absorbing material (BV-UV material) were estimated using a calibration curve prepared with purified melittin standards ranging from 0 to 1000 µg/mL.
Three independently prepared BV-LNs batches were analyzed (n = 3), with technical measurements performed in triplicate and averaged for each batch. Results were expressed as apparent BV-UV material concentrations (µg/mL) recovered from the aqueous supernatant, calculated using purified melittin as the calibration standard.
Because absorbance at 280 nm is not specific for melittin, these values represent an operational estimate of BV-UV material rather than compound-specific concentrations of intact melittin. Furthermore, the recovered supernatant may contain both freely soluble BV constituents and BV-UV material associated with residual suspended nanoliposomes. Accordingly, this assay was interpreted as a measure of apparent aqueous recovery rather than a direct measurement of the molecular solubility of BV constituents or the aqueous dispersibility of BV-LNs.
4.6.6. Centrifugal Stability
The resistance of the BV-LNs to centrifugal separation was evaluated using a modified based on Ghorbanzade et al. [54]. Briefly, 5 mL of each BV-LNs dispersion were transferred to centrifuge tube and centrifuged at 3500× g for 15 min. Centrifugal stability (CS) was calculated according to Equation (4):
where Iev is the final volume of the lower nanoliposomal phase after centrifugation and Fev is the initial volume of the BV-LNs dispersion (5 mL).
4.7. In Vitro Release and Apparent Release Kinetics
The in vitro transfer behavior of bee venom-derived UV-absorbing material (BV-UV material) from BV-LNs was evaluated using a dialysis membrane diffusion system [57,58]. A 10 mL aliquot of BV-LNs dispersion containing a nominal BV load of 1 mg was transferred into a pre-soaked dialysis membrane with a molecular-weight cutoff of 12–14 kDa (Sigma-Aldrich Co. LLC) and securely sealed.
For comparison, free BV containing the same nominal amount of BV was evaluated in parallel under identical dialysis conditions. Each dialysis bag was immersed in 100 mL of PBS (0.05 mol/L, pH 7.4) and maintained at 37 °C under continuous agitation at 100 rpm. These conditions characterized apparent transfer under a controlled in vitro dialysis environment and were not intended to reproduce the physiological complexity of gastrointestinal or systemic conditions.
At predetermined sampling times (0.5, 1, 2, 4, 6, 8, 10, 12, and 24 h), 1 mL of receptor medium was withdrawn and immediately replaced with an equal volume of fresh PBS to maintain a constant receptor volume. Absorbance of the collected samples was measured at 280 nm using a UV–Vis microplate spectrophotometer (Multiskan GO, Thermo Fisher Scientific, USA).
Apparent BV-UV material concentrations were estimated using a calibration curve prepared with purified melittin standards over the linear concentration range of 0–1000 µg/mL. This range refers to the concentrations of the calibration standards. BV-UV material denotes the nonspecific UV-absorbing material detected at 280 nm and assigned an apparent mass concentration using purified melittin as the analytical calibration standard. Because crude BV contains multiple UV-absorbing constituents, these measurements do not represent compound-specific concentrations of intact melittin.
The cumulative apparent amount of BV-UV material transferred to the receptor medium was corrected for material removed during previous sampling steps according to Equation (5):
where Qn is the cumulative apparent amount of BV-UV material recovered in the receptor medium up to sampling time n, including material removed during previous sampling steps (µg); Cn is the apparent receptor-medium concentration at sampling time n (µg/mL); Vr is the receptor-medium volume (100 mL); Vs is the volume withdrawn and replaced at each sampling time (1 mL); and C1 through Cn−1 are the apparent concentrations in the previously withdrawn samples (µg/mL). For the first sampling time, the contribution from previous samples is zero.
The reference apparent amount of BV-UV material (Qref) was determined separately using a 10 mL aliquot of the same BV-LNs formulation, equivalent in volume to that introduced into the dialysis bag. The aliquot was combined with 10 mL of petroleum ether (1:1, v/v) for vesicle disruption and aqueous recovery of BV-derived material. The mixture was centrifuged at 10,000× g for 30 min, and the aqueous phase was collected. The recorded recovered aqueous-phase volume was 9.84 mL. Absorbance was measured at 280 nm in a 96-well microplate using 300 µL per well. Three independent reference determinations were performed (n = 3), each analyzed in technical triplicate. Technical replicate readings were averaged within each independent determination, and apparent concentrations were calculated using purified melittin as the calibration standard.
Qref was calculated from the apparent concentration and the recovered aqueous-phase volume, accounting for any dilution factors, according to Equation (6):
where Qref is the reference apparent amount of BV-UV material recovered from the equivalent formulation aliquot (µg); Caq is the apparent concentration in the recovered aqueous phase (µg/mL); Vaq is the recovered aqueous-phase volume (mL); and DF is any dilution factor not already incorporated into Caq. The 300 µL volume used per well was the analytical reading volume and was not used as the total recovery volume in this calculation. Qref was determined experimentally and was not assumed to equal the nominal BV load of 1 mg.
Apparent cumulative transfer from BV-LNs was normalized to the experimentally determined reference amount according to Equation (7):
Both Qn and Qref were determined on the same analytical basis: absorbance at 280 nm calibrated against purified melittin and expressed as apparent amounts of BV-UV material in µg. Qref represents material recovered in the aqueous phase following petroleum ether treatment and does not establish quantitative recovery of all BV constituents. The normalized percentage therefore describes apparent transfer relative to this operational reference, rather than compound-specific release or preservation of intact melittin.
Three independent dialysis experiments were performed (n = 3). The receptor-medium concentrations presented in Figure 5 are expressed in µg/mL and are distinct from the cumulative amounts and normalized percentages calculated using Equations (5) and (7), respectively.
4.8. In Vitro Simulated Gastrointestinal Digestion of Nanoliposomes
The behavior of BV-LNs during gastrointestinal digestion was evaluated using a three-stage in vitro model comprising oral, gastric, and intestinal phases, adapted from the protocols described by van Campen et al. [58] and Tarko et al. [59]. The procedure was designed to reproduce selected physicochemical and enzymatic conditions of human gastrointestinal digestion under controlled experimental conditions.
4.8.1. In Vitro Simulated Oral Phase Digestion of Nanoliposomes
Unstimulated human saliva was obtained from a healthy volunteer after 90 min of fasting and oral hygiene with fluoride toothpaste [47]. The saliva was clarified by centrifugation at 10,000× g for 10 min at 4 °C to remove mucins and cellular debris. A 5 mL aliquot of BV-LNs suspension was mixed with 5 mL of clarified human saliva (1:1 v/v), and the pH was adjusted to 7.0 ± 0.2. α-Amylase activity was adjusted to 150 U/mL. The mixture was incubated at 37 °C for 10 min in a shaking water bath (SW22, Julabo GmbH, Seelbach, Germany) at 100 rpm to simulate oral enzymatic exposure. An aliquot collected at the end of this stage was designated the FO.
4.8.2. In Vitro Simulated Gastric Phase Digestion of Nanoliposomes
Following oral digestion, the pH of the mixture was adjusted to 2.0 using 6 M HCl. Subsequently, 22.5 mL of porcine pepsin solution (315 U/mL, Sigma-Aldrich, P7012-5G) and 22.5 mL of distilled water were added. The sample was incubated at 37 °C for 2 h under agitation at 80 rpm. An aliquot obtained at the completion of gastric was designated FG [47].
4.8.3. In Vitro Simulated Intestinal Phase Digestion and Dialyzability of Nanoliposomes
After completion of the gastric phase, the pH of the gastric digest was adjusted to 7.0 using 1.25 M NaHCO3. Pancreatin solution (5.625 mL; 4 mg/mL; porcine pancreas pancreatin, P1750-100G; CAS No. 8049-47-6; MDL No. MFCD00131789; Sigma-Aldrich Co. LLC) was then added directly to the neutralized gastric digest. Pancreatin is a broad-spectrum pancreatic enzyme preparation containing protease, trypsin, amylase, lipase, and ribonuclease activities. The amount added was adjusted to obtain a final trypsin activity of 100 U/mL and a final lipase activity of 60 U/mL in the intestinal digestion mixture. Thus, both proteolytic and lipolytic activities were supplied by the pancreatin preparation; no separate commercial lipase preparation was added [47].
Because pancreatin is a heterogeneous multi-enzyme preparation, its relative enzymatic composition and activity may vary among commercial lots. Standardization based on final trypsin and lipase activities was used to reduce this variability but does not provide the same degree of compositional control as the use of individually standardized enzymes.
The resulting intestinal digestion mixture, including the sample and pancreatin, was transferred into a pre-soaked dialysis membrane with a molecular-weight cutoff of 12–14 kDa (Sigma-Aldrich Co. LLC). The membrane was securely sealed and immersed in 50 mL of simulated intestinal medium consisting of PBS (0.05 M, pH 7.0) containing 10 mM bile salts. The digestive sample and pancreatin remained inside the dialysis membrane, whereas the bile salt-containing simulated intestinal medium constituted the external compartment. The system was incubated at 37 °C for 2 h under continuous stirring at 100 rpm. At the end of incubation, the material retained inside the membrane and the dialyzable fraction recovered from the external medium were collected separately for subsequent analyses.
At the end of intestinal digestion, material remaining within the digestion compartment was designated the FI, whereas material recovered from the external dialysis was FID. Recovery in FID was interpreted as an operational measure of in vitro dialyzability and not as intestinal epithelial transport, intestinal absorption, or systemic bioavailability.
Aliquots from FO, FG, FI, and FID were evaluated using DPPH and ABTS radical-scavenging. Folin–Ciocalteu reducing-capacity was expressed as GAE, while the flavonoid-equivalent colorimetric responses were expressed as QE. Antihemolytic activity was evaluated using the AAPH-induced erythrocyte hemolysis assay described above. These endpoints were interpreted as digestion-phase-dependent chemical and biological responses and not as a compound-specific measurements of intact melittin, phenolic compounds, or flavonoids.
For comparisons of predigestion and postdigestion responses, the analytical response measured in FID was normalized to the corresponding predigestion value according to (8):
where RFID is the analytical response measured in the FID and Rpredigestion is the corresponding response measured before simulated digestion.
The resulting percentages describe the proportion of each measured analytical response remaining detectable after simulated digestion and dialysis. They should not be interpreted as compound-specific recovery, intestinal absorption, or bioavailability.
Three independent digestion experiments were performed (n = 3). Analytical measurement within each experiment were conducted in technical triplicated and average before statistical analysis. Results are reported as mean ± SD.
4.9. Statistical Analysis
Analyses were performed using JMP (version 16) for Mac OS (SAS Institute Inc., Cary, NC, USA). Technical replicates were averaged within each independent batch, experiment, or donor before analysis. Data are presented as mean ± SD, and statistical significance was set at p < 0.05. Normality and homogeneity of variances were assessed using the Shapiro–Wilk and Levene tests, respectively. Significant overall effects were followed by Tukey-adjusted pairwise comparisons.
Antioxidant responses of BV, ENLs, and BV-LNs were analyzed separately using one-way ANOVA, with formulation as the factor. Independent formulation batches were the experimental units for physicochemical measurements (n = 3). Release-fraction responses were analyzed using one-way ANOVA, with time as the factor. DPPH, ABTS, and FC-RC responses during simulated gastrointestinal digestion were analyzed separately using one-way ANOVA, with fraction as the factor; Flv-E responses were summarized descriptively. Hemocompatibility data were analyzed using linear mixed-effects models with formulation, concentration, time, and their interactions as fixed effects and donor as a random effect. Antihemolytic comparisons among formulations were analyzed using linear mixed-effects models with formulation and concentration as fixed effects and donor as a random effect.
Postdigestion antihemolytic responses from ten donors per blood group were averaged within each experiment and fraction. The same donors contributed across fractions and experiments. Digestion-level averages (n = 3) were analyzed separately by blood group using fraction and experiment as fixed effects, with experiment serving as a blocking factor. No inferential ABO comparisons were performed. Relative postdigestion responses were summarized descriptively from three independent experiments. No inferential comparisons were performed among DPPH, ABTS, FC-RC, and Flv-E responses during simulated gastrointestinal digestion were analyzed separately using one-way ANOVA, with digestion fraction as the factor.
5. Limitations
The findings should be interpreted within the scope of the experimental design and analytical methods employed. UV absorbance at 280 nm, calibrated against purified melittin, provided an operational estimate of BV-derived UV-absorbing material rather than compound-specific quantification. Accordingly, apparent encapsulation efficiency and dialysis transfer describe the behavior of this analytical signal and do not establish the encapsulation, release, or preservation of intact melittin. Similarly, Folin–Ciocalteu and aluminum chloride measurements represent reducing-capacity and flavonoid-equivalent colorimetric responses, respectively, rather than identification or quantification of individual phenolic or flavonoid constituents.
A further limitation is the absence of compound-specific characterization before and after simulated gastrointestinal digestion. The analytical strategy focused on formulation-level antioxidant and antihemolytic responses rather than the molecular fate of individual venom constituents. No LC–MS analysis was performed to identify or quantify intact melittin, apamin, or their digestion products. Consequently, the UV-based measurements and residual functional responses cannot distinguish intact peptides from degradation products or contributions from other venom constituents. Detectable postdigestion activity therefore does not demonstrate preservation of the original peptide structures. Future studies should combine validated targeted LC–MS/MS quantification with peptide profiling across digestion fractions to establish the recovery and transformation of individual venom components.
Simulated gastrointestinal digestion was evaluated for BV-LNs without a matched free-BV comparator throughout the complete protocol. Consequently, the detection of antioxidant and antihemolytic responses after digestion demonstrates measurable activity in the resulting fractions but does not establish improved digestive stability attributable to nanoencapsulation. The digestion procedure reproduced selected gastrointestinal conditions, while the enzymatic composition of the commercial pancreatin preparation was not individually controlled for all constituent activities. Furthermore, recovery in the external dialysis compartment represents in vitro dialyzability and does not reproduce intestinal epithelial transport or establish oral bioavailability.
The physicochemical, release, and digestion experiments were based on three independent preparations or experimental runs, limiting the precision of estimates of between-experiment variability. In addition, the venom was obtained from a pooled sample comprising three colonies from the same geographical region; the results therefore characterize this preparation and do not establish consistency across independent venom sources or collection periods. The centrifugation assay assessed resistance to separation under the applied conditions and did not determine long-term storage stability.
Erythrocyte assays provided a functional model of direct membrane damage and protection against AAPH-induced oxidative hemolysis. Postdigestion analyses evaluated differences among fractions within each ABO group and were not designed to establish mechanisms attributable to blood group. Microscopy was qualitative and did not quantify morphological preservation or specific pathways of membrane injury. Finally, these in vitro endpoints do not establish systemic safety, allergenic potential, or therapeutic efficacy. The conclusions are therefore restricted to the physicochemical behavior and assay-specific functional responses of the evaluated formulation under the experimental conditions.
6. Conclusions
BV-LNs exhibited a nanoscale hydrodynamic diameter, a relatively narrow size distribution, a negative zeta potential, and substantial apparent encapsulation efficiency for BV-derived UV-absorbing material. These findings support the feasibility of preparing whole-BV nanoliposomal formulations under the evaluated conditions. No significant differences between free BV and BV-LNs were detected in the DPPH and FRAP assays, whereas BV-LNs exhibited significantly greater ABTS radical inhibition. This increase indicates an assay-specific formulation effect rather than a generalized enhancement of antioxidant activity.
A principal functional finding was the greater antihemolytic activity of BV-LNs compared with free BV at BV-equivalent concentrations of 10 and 40 µg/mL under AAPH-induced oxidative stress. However, direct erythrocyte hemocompatibility decreased with increasing concentration and exposure time, and BV-LNs did not show a consistent hemocompatibility advantage over free BV. Thus, protection against experimentally induced oxidative hemolysis should be distinguished from direct membrane compatibility and does not establish a general safety advantage.
BV-LNs also showed slower apparent transfer of BV-derived UV-absorbing material into the dialysis receptor compartment than free BV. Because the measurements were nonspecific and reflected both availability from the formulation and transport across the dialysis membrane, these profiles do not establish controlled release, a specific transport mechanism, or the transfer of intact venom peptides.
Following simulated gastrointestinal digestion, measurable radical-scavenging and antihemolytic responses remained detectable, including in the dialyzed intestinal fraction (FID). These responses depended on the digestion fraction and analytical endpoint. Antihemolytic patterns also differed descriptively among the erythrocyte groups evaluated, although no inferential comparisons among ABO blood groups were performed. The findings demonstrate detectable activity after digestion and dialysis but do not establish preservation of intact BV constituents, improved gastrointestinal stability relative to free BV, intestinal absorption, or systemic bioavailability.
Overall, BV-LNs provides an experimental formulation for investigating how incorporation into nanoliposomes modifies the physicochemical behavior and functional responses of whole BV. Further studies should prioritize validated compound-specific peptide quantification, matched comparisons of free BV and BV-LNs throughout digestion, long-term formulation stability, quantitative assessment of erythrocyte membrane damage and protection, intestinal epithelial transport models, and subsequent in vivo evaluation of safety and biological activity.
Supplementary Materials
The following supporting information can be downloaded at: https://www.mdpi.com/article/10.3390/molecules31224138/s1. Table S1: Omnibus ANOVA statistics for radical-scavenging and colorimetric responses during dialysis and simulated gastrointestinal digestion, and for postdigestion antihemolytic activity.
Author Contributions
R.I.G.-V., conceptualization and supervision; F.V.V.-V. and S.J.L.-P., project administration and validation; P.d.J.B.-V. writing—original draft; P.V.M.-B., writing—review and editing; B.V.-R. methodology; A.I.P.G.-G., software; A.G.-A. formal analysis; and S.D.-P. and C.V.-M. data curation. All authors have read and agreed to the published version of the manuscript.
Funding
This research received no internal or external funding.
Institutional Review Board Statement
This research was conducted in accordance with the ethical principles established in the 1975 Declaration of Helsinki. The clinical laboratory participating in the study is accredited under ISO/IEC 17025 (NMX-EC-17025) and ISO 15189, following the standards set by the ISO/TC 212 Technical Committee for Clinical Laboratory Testing and In Vitro Diagnostic Systems, and operates under quality management frameworks based on ISO/IEC 17025 and ISO 9001. Ethical approval: The research project was reviewed and approved by the Research Committee of the Hospital General del Estado “Dr. Ernesto Ramos Bours”, Servicios de Salud de Sonora, Hermosillo, Sonora, México, under protocol approval No. CI 2023-47, approval date 18 May 2023. The committee’s COFEPRIS registration number is 17 CI 26 030 105. All procedures followed applicable institutional ethical requirements.
Informed Consent Statement
Every participant provided informed consent before taking part in the study, and written permission was also secured from each individual to authorize the dissemination of the results included in this manuscript.
Data Availability Statement
The data supporting the findings of this research are presented within the article itself. Additional details or clarifications can be obtained from the corresponding authors upon reasonable request.
Acknowledgments
The authors gratefully recognize the assistance of the Department of Research and Postgraduate Studies in Food at Universidad de Sonora and the Department of Medical and Life Sciences of the University Center of la Ciénega (CUCIÉNEGA), University of Guadalajara, for providing access to key facilities and technical resources. Special thanks are also extended to the University Center for Biological and Agricultural Sciences (CUCBA), University of Guadalajara, for their valuable support in strengthening the development of this work.
Conflicts of Interest
The authors declare no conflicts of interest.
Abbreviations
| Abbreviation | Definition |
| AAPH | 2,2′-azobis(2-methylpropionamidine) dihydrochloride |
| ABO | ABO blood group system |
| ABTS | 2,2′-azino-bis(3-ethylbenzothiazoline-6-sulfonic acid) |
| ANOVA | analysis of variance |
| BV | bee venom |
| BV-LNs | bee venom-loaded nanoliposomes |
| CIOMS | Council for International Organizations of Medical Sciences |
| CS | centrifugal stability |
| CUCBA | Centro Universitario de Ciencias Biológicas y Agropecuarias |
| CUCIÉNEGA | Centro Universitario de la Ciénega |
| CUValles | Centro Universitario de los Valles |
| DLS | dynamic light scattering |
| DMSO | dimethyl sulfoxide |
| DPPH | 2,2-diphenyl-1-picrylhydrazyl |
| EDTA | ethylenediaminetetraacetic acid |
| EE | encapsulation efficiency |
| ELS | electrophoretic light scattering |
| ENLs | empty nanoliposomes |
| FC-RC | Folin–Ciocalteu reducing-capacity response |
| FG | gastric fraction |
| FI | intestinal fraction |
| FID | dialyzed intestinal fraction |
| Flv-E | flavonoid-equivalent colorimetric response |
| FO | oral fraction |
| FRAP | ferric reducing antioxidant power |
| GAE | gallic acid equivalents |
| INFOGEST | International Network of Excellence on the Fate of Food in the Gastrointestinal Tract |
| NOM | Norma Oficial Mexicana (Mexican Official Standard) |
| PBS | phosphate-buffered saline |
| PDI | polydispersity index |
| QE | quercetin equivalents |
| RhD | Rhesus D antigen |
| SD | standard deviation |
| SEM | scanning electron microscopy |
| SPC | soy phosphatidylcholine |
| TE | trolox equivalents |
| TPTZ | 2,4,6-tripyridyl-s-triazine |
| UV | ultraviolet |
| UV–Vis | ultraviolet–visible |
References
- Gasa-Falcon, A.; Odriozola-Serrano, I.; Oms-Oliu, G.; Martín-Belloso, O. Nanostructured Lipid-Based Delivery Systems as a Strategy to Increase Functionality of Bioactive Compounds. Foods 2020, 9, 325. [Google Scholar] [CrossRef] [Scilit] [PubMed]
- Nguyen, C.D.; Lee, G. Neuroprotective Activity of Melittin—The Main Component of Bee Venom—Against Oxidative Stress Induced by Aβ25–35 in In Vitro and In Vivo Models. Antioxidants 2021, 10, 1654. [Google Scholar] [CrossRef] [Scilit] [PubMed]
- Mao, J.; Liu, S.; Ai, M.; Wang, Z.; Wang, D.; Li, X.; Hu, K.; Gao, X.; Yang, Y. A novel melittin nano-liposome exerted excellent anti-hepatocellular carcinoma efficacy with better biological safety. J. Hematol. Oncol. 2017, 10, 71. [Google Scholar] [CrossRef] [Scilit] [PubMed]
- Soares-Silva, B.; Beserra-Filho, J.I.A.; Morera, P.M.A.; Custódio-Silva, A.C.; Maria-Macêdo, A.; Silva-Martins, S.; Alexandre-Silva, V.; Silva, S.P.; Silva, R.H.; Ribeiro, A.M. The Bee Venom Active Compound Melittin Protects against Bicuculline-Induced Seizures and Hippocampal Astrocyte Activation in Rats. Neuropeptides 2022, 91, 102209. [Google Scholar] [CrossRef] [Scilit] [PubMed]
- Stela, M.; Cichon, N.; Spławska, A.; Szyposzynska, M.; Bijak, M. Therapeutic Potential and Mechanisms of Bee Venom Therapy: A Comprehensive Review of Apitoxin Applications and Safety Enhancement Strategies. Pharmaceuticals 2024, 17, 1211. [Google Scholar] [CrossRef] [Scilit] [PubMed]
- Porter, C.J.H.; Trevaskis, N.L.; Charman, W.N. Lipids and lipid-based formulations: Optimizing the oral delivery of lipophilic drugs. Nat. Rev. Drug Discov. 2007, 6, 231–248. [Google Scholar] [CrossRef] [Scilit] [PubMed]
- Lazăr, A.R.; Pușcaș, A.; Tanislav, A.E.; Mureșan, V. Bioactive Compounds Delivery and Bioavailability in Structured Edible Oils Systems. Compr. Rev. Food Sci. Food Saf. 2024, 23, e70020. [Google Scholar] [CrossRef] [Scilit] [PubMed]
- Salvia-Trujillo, L.; Martín-Belloso, O.; McClements, D.J. Excipient Nanoemulsions for Improving Oral Bioavailability of Bioactives. Nanomaterials 2016, 6, 17. [Google Scholar] [CrossRef] [Scilit] [PubMed]
- Xing, X.; Zhang, X.; Fan, J.; Zhang, C.; Zhang, L.; Duan, R.; Hao, H. Neuroprotective Effects of Melittin against Cerebral Ischemia and Inflammatory Injury via Upregulation of MCPIP1 to Suppress NF-κB Activation In Vivo and In Vitro. Neurochem. Res. 2024, 49, 348–362. [Google Scholar] [CrossRef] [Scilit] [PubMed]
- Jung, G.B.; Huh, J.-E.; Lee, H.-J.; Kim, D.; Lee, G.-J.; Park, H.-K.; Lee, J.-D. Anti-Cancer Effect of Bee Venom on Human MDA-MB-231 Breast Cancer Cells Using Raman Spectroscopy. Biomed. Opt. Express 2018, 9, 5703–5718. [Google Scholar] [CrossRef] [Scilit] [PubMed]
- Tanuwidjaja, I.; Svečnjak, L.; Gugić, D.; Levanić, M.; Jurić, S.; Vinceković, M.; Mrkonjić Fuka, M. Chemical Profiling and Antimicrobial Properties of Honey Bee (Apis mellifera L.) Venom. Molecules 2021, 26, 3049. [Google Scholar] [CrossRef] [Scilit] [PubMed]
- Zhou, J.; Zhao, J.; Zhang, S.; Shen, J.; Qi, Y.; Xue, X.; Li, Y.; Wu, L.; Zhang, J.; Chen, F.; et al. Quantification of Melittin and Apamin in Bee Venom Lyophilized Powder from Apis mellifera by Liquid Chromatography–Diode Array Detector–Tandem Mass Spectrometry. Anal. Biochem. 2010, 404, 171–178. [Google Scholar] [CrossRef] [Scilit] [PubMed]
- Qin, Q.; Li, Z.; Zhang, M.; Dai, Y.; Li, S.; Wu, H.; Zhang, Z.; Chen, P. Effects of melittin on production performance, antioxidant function, immune function, heat shock protein, intestinal morphology, and cecal microbiota in heat-stressed quails. Poult. Sci. 2023, 102, 102713. [Google Scholar] [CrossRef] [Scilit] [PubMed]
- Tembhre, M.K.; Shipra. Low-Dose Melittin Enhanced Pigment Production Through the Upregulation of Tyrosinase Activity and Dendricity in Melanocytes by Limiting Oxidative Stress: A Therapeutic Implication for Vitiligo. Antioxidants 2024, 13, 1424. [Google Scholar] [CrossRef] [Scilit] [PubMed]
- El-Hameed, A.M.A.; Abuelsaad, A.S.A.; Khalil, A. Bee venom acupuncture therapy ameliorates neuroinflammatory alterations in a pilocarpine-induced epilepticus model. Metab. Brain Dis. 2021, 36, 2047–2058. [Google Scholar] [CrossRef] [Scilit] [PubMed]
- Gandolfo, G.; Gottesmann, C.; Bidard, J.-N.; Lazdunski, M. K+ channels openers prevent epilepsy induced by the bee venom peptide MCD. Eur. J. Pharmacol. 1989, 159, 329–330. [Google Scholar] [CrossRef] [Scilit] [PubMed]
- Cheng, B.; Xu, P. Redox-Sensitive Nanocomplex for Targeted Delivery of Melittin. Toxins 2020, 12, 582. [Google Scholar] [CrossRef] [Scilit] [PubMed]
- Moon, D.-O.; Park, S.-Y.; Lee, K.-J.; Heo, M.-S.; Kim, K.-C.; Kim, M.-O.; Lee, J.-D.; Choi, Y.H.; Kim, G.-Y. Bee Venom and Melittin Reduce Proinflammatory Mediators in Lipopolysaccharide-Stimulated BV2 Microglia. Int. Immunopharmacol. 2007, 7, 1092–1101. [Google Scholar] [CrossRef] [Scilit] [PubMed]
- Zhang, J.; Liu, X.; Xia, Y.; Xu, S.; Liu, X.; Xiao, H.; Wang, X.; Liu, C.; Liu, G. Genetically Engineered Nano-Melittin Vesicles for Multimodal Synergetic Cancer Therapy. Bioeng. Transl. Med. 2023, 8, e10482. [Google Scholar] [CrossRef] [Scilit] [PubMed]
- Jia, F.; Chen, P.; Wang, D.; Sun, Y.; Ren, M.; Wang, Y.; Cao, X.; Zhang, L.; Fang, Y.; Tan, X.; et al. Bottlebrush Polymer-Conjugated Melittin Exhibits Enhanced Antitumor Activity and Better Safety Profile. ACS Appl. Mater. Interfaces 2021, 13, 42493–42507. [Google Scholar] [CrossRef] [Scilit] [PubMed]
- DeGrado, W.F.; Musso, G.F.; Lieber, M.; Kaiser, E.T.; Kézdy, F.J. Kinetics and mechanism of hemolysis induced by melittin and by a synthetic melittin analogue. Biophys. J. 1982, 37, 329–338. [Google Scholar] [CrossRef] [Scilit] [PubMed]
- Nwachukwu, I.D.; Sarteshnizi, R.A.; Udenigwe, C.C.; Aluko, R.E. A Concise Review of Current In Vitro Chemical and Cell-Based Antioxidant Assay Methods. Molecules 2021, 26, 4865. [Google Scholar] [CrossRef] [Scilit]
- Gîlcescu Florescu, C.A.; Stanciulescu, E.C.; Berbecaru-Iovan, A.; Balasoiu, R.M.; Pisoschi, C.G. In Vitro Assessment of Free Radical Scavenging Effect and Thermal Protein Denaturation Inhibition of Bee Venom for an Anti-Inflammatory Use. Curr. Health Sci. J. 2024, 50, 81–86. [Google Scholar] [CrossRef] [PubMed]
- Orrù, A.; Pittau, B.; Pettinau, F. Shedding Light on the Antioxidant Activity of Bee Venom Using a 2,2-Diphenyl-1-Picrylhydrazyl Assay in a Detergent-Based Buffer. Molecules 2025, 30, 640. [Google Scholar] [CrossRef] [Scilit] [PubMed]
- Qanash, H.; Bazaid, A.S.; Alharbi, S.F.; Binsaleh, N.K.; Barnawi, H.; Alharbi, B.; Alsolami, A.; Almashjary, M.N. Therapeutic Effects of Nanocoating of Apitoxin (Bee Venom) and Polyvinyl Alcohol Supplemented with Zinc Oxide Nanoparticles. Pharmaceutics 2025, 17, 172. [Google Scholar] [CrossRef] [Scilit] [PubMed]
- Auwal, S.M.; Yea, C.S.; Saari, N. Physicochemical stability, antioxidant and ACE-inhibitory activities of cryoprotected liposomes encapsulating stone fish-derived peptides. Appl. Food Res. 2025, 5, 100906. [Google Scholar] [CrossRef] [Scilit]
- Silva, T.C.; de Paula Moura, S.; Ramos, H.R.; de Araujo, P.S.; Bueno da Costa, M.H. Design of a modern liposome and bee venom formulation for the traditional VIT-venom immunotherapy. J. Liposome Res. 2008, 18, 353–368. [Google Scholar] [CrossRef] [Scilit] [PubMed]
- Cyboran-Mikołajczyk, S.; Sareło, P.; Pasławski, R.; Pasławska, U.; Przybyło, M.; Nowak, K.; Płóciennik, M.; Podbielska, H.; Kopaczyńska, M.; Wawrzyńska, M. Impact of Liposomal Drug Formulations on the RBCs Shape, Transmembrane Potential, and Mechanical Properties. Int. J. Mol. Sci. 2021, 22, 1710. [Google Scholar] [CrossRef] [Scilit] [PubMed]
- Dos Santos Rodrigues, B.; Lakkadwala, S.; Kanekiyo, T.; Singh, J. Dual-Modified Liposome for Targeted and Enhanced Gene Delivery into Mice Brain. J. Pharmacol. Exp. Ther. 2020, 374, 354–365. [Google Scholar] [CrossRef] [Scilit] [PubMed]
- Zou, C.G.; Agar, N.S.; Jones, G.L. Oxidative insult to human red blood cells induced by free radical initiator AAPH and its inhibition by a commercial antioxidant mixture. Life Sci. 2001, 69, 75–86. [Google Scholar] [CrossRef] [Scilit] [PubMed]
- Sandhu, I.S.; Ware, K.; Grisham, M.B. Peroxyl radical-mediated hemolysis: Role of lipid, protein and sulfhydryl oxidation. Free Radic. Res. Commun. 1992, 16, 111–122. [Google Scholar] [CrossRef] [Scilit] [PubMed]
- Kaźmierczak, T.; Bonarska-Kujawa, D.; Męczarska, K.; Cyboran-Mikołajczyk, S.; Oszmiański, J.; Kapusta, I. Analysis of the Polyphenolic Composition of Vaccinium L. Extracts and Their Protective Effect on Red Blood Cell Membranes. Membranes 2023, 13, 589. [Google Scholar] [CrossRef] [Scilit] [PubMed]
- Hanachi, A.; Bianchi, A.; Kahn, C.J.F.; Velot, E.; Arab-Tehrany, E.; Cakir-Kiefer, C.; Linder, M. Encapsulation of Salmon Peptides in Marine Liposomes: Physico-Chemical Properties, Antiradical Activities and Biocompatibility Assays. Mar. Drugs 2022, 20, 249. [Google Scholar] [CrossRef] [Scilit] [PubMed]
- Badivi, S.; Kazemi, S.; Eskandarisani, M.; Asghari Moghaddam, N.; Mesbahian, G.; Karimifard, S.; Afzali, E. Targeted delivery of bee venom to A549 lung cancer cells by PEGylate liposomal formulation: An apoptotic investigation. Sci. Rep. 2024, 14, 17302. [Google Scholar] [CrossRef] [Scilit] [PubMed]
- Abd El-Gawad, A.; Kenawy, M.A.; El-Messery, T.M.; Hassan, M.E.; El-Nekeety, A.A.; Abdel-Wahhab, M.A. Fabrication and characterization of bee venom-loaded nanoliposomes: Enhanced anticancer activity against different human cancer cell lines via the modulation of apoptosis-related genes. J. Drug Deliv. Sci. Technol. 2023, 84, 104545. [Google Scholar] [CrossRef] [Scilit]
- Li, Y.; Ruan, S.; Wang, Z.; Feng, N.; Zhang, Y. Hyaluronic Acid Coating Reduces the Leakage of Melittin Encapsulated in Liposomes and Increases Targeted Delivery to Melanoma Cells. Pharmaceutics 2021, 13, 1235. [Google Scholar] [CrossRef] [Scilit] [PubMed]
- Modi, S.; Anderson, B.D. Determination of drug release kinetics from nanoparticles: Overcoming pitfalls of the dynamic dialysis method. Mol. Pharm. 2013, 10, 3076–3089. [Google Scholar] [CrossRef] [Scilit] [PubMed]
- Xie, J.; Schaich, K.M. Re-evaluation of the 2,2-Diphenyl-1-picrylhydrazyl Free Radical (DPPH) Assay for Antioxidant Activity. J. Agric. Food Chem. 2014, 62, 4251–4260. [Google Scholar] [CrossRef] [Scilit] [PubMed]
- Gong, Y.; Yuan, D.; Zhan, Q.; Ma, Z.; Wang, Q.; Zhang, S.; Pang, X.; Wang, Y. Liposome Encapsulation for Casein-Derived Peptides: Release Behavior, In Vitro Digestibility, Nutrient Absorption, and Gut Microbiota. Food Chem. X 2025, 29, 102652. [Google Scholar] [CrossRef] [Scilit] [PubMed]
- Everette, J.D.; Bryant, Q.M.; Green, A.M.; Abbey, Y.A.; Wangila, G.W.; Walker, R.B. Thorough study of reactivity of various compound classes toward the Folin–Ciocalteu reagent. J. Agric. Food Chem. 2010, 58, 8139–8144. [Google Scholar] [CrossRef] [Scilit] [PubMed]
- Shraim, A.M.; Ahmed, T.A.; Rahman, M.M.; Hijji, Y.M. Determination of Total Flavonoid Content by Aluminum Chloride Assay: A Critical Evaluation. LWT 2021, 150, 111932. [Google Scholar] [CrossRef] [Scilit]
- Official Mexican Standard NOM-253-SSA1-2012; For the Disposal of Human Blood and Its Components for Therapeutic Purposes. Ministry of Health (Mexico), Official Gazette of the Federation: Mexico City, Mexico, 2012. Available online: https://www.hlc.com/en/publications/se-publica-en-el-diario-oficial-de-la-federacion-la-nueva-nom253ssa12025 (accessed on 1 February 2026).
- ISO 9001:2015; Quality Management Systems. ISO: Geneva, Switzerland, 2015. Available online: https://www.iso.org/obp/ui/#iso:std:iso:9001:ed-5:v1:en (accessed on 1 February 2026).
- Peña-Medina, R.L.; Fimbres-Olivarría, D.; Enríquez-Ocaña, L.F.; Martínez-Córdova, L.R.; Del-Toro-Sánchez, C.L.; López-Elías, J.A.; González-Vega, R.I. Erythroprotective Potential of Phycobiliproteins Extracted from Porphyridium cruentum. Metabolites 2023, 13, 366. [Google Scholar] [CrossRef] [Scilit] [PubMed]
- González-Vega, R.I.; Cárdenas-López, J.C.; López-Elías, J.A.; Ruiz-Cruz, S.; Reyes-Díaz, A.; Perez-Perez, L.M.; Cinco-Moroyoqui, F.J.; Robles-Zepeda, R.E.; Borboa-Flores, J.; Del-Toro-Sánchez, C.L. Optimization of Growing Conditions for Pigments Production from Microalga Navicula incerta Using Response Surface Methodology and Its Antioxidant Capacity. Saudi J. Biol. Sci. 2021, 28, 1401–1416. [Google Scholar] [CrossRef] [Scilit] [PubMed]
- Council for International Organizations of Medical Sciences (CIOMS). International Ethical Guidelines for Health-Related Research Involving Humans, 4th ed.; CIOMS: Geneva, Switzerland, 2016. [Google Scholar] [CrossRef] [Scilit] [PubMed]
- Brodkorb, A.; Egger, L.; Alminger, M.; Alvito, P.; Assunção, R.; Ballance, S.; Bohn, T.; Bourlieu-Lacanal, C.; Boutrou, R.; Carrière, F.; et al. INFOGEST static in vitro simulation of gastrointestinal food digestion. Nat. Protoc. 2019, 14, 991–1014. [Google Scholar] [CrossRef] [Scilit] [PubMed]
- Brand-Williams, W.; Cuvelier, M.E.; Berset, C. Use of a Free Radical Method to Evaluate Antioxidant Activity. LWT Food Sci. Technol. 1995, 28, 25–30. [Google Scholar] [CrossRef] [Scilit]
- Re, R.; Pellegrini, N.; Proteggente, A.; Pannala, A.; Yang, M.; Rice-Evans, C. Antioxidant Activity Applying an Improved ABTS Radical Cation Decolorization Assay. Free. Radic. Biol. Med. 1999, 26, 1231–1237. [Google Scholar] [CrossRef] [Scilit] [PubMed]
- Benzie, I.F.F.; Strain, J.J. The Ferric Reducing Ability of Plasma (FRAP) as a Measure of “Antioxidant Power”: The FRAP Assay. Anal. Biochem. 1996, 239, 70–76. [Google Scholar] [CrossRef] [Scilit] [PubMed]
- Ruiz-Cruz, S.; González-Vega, R.I.; Robles-Zepeda, R.E.; Reyes-Díaz, A.; López-Elías, J.A.; Alvarez-Ainza, M.L.; Cinco-Moroyoqui, F.J.; Moreno-Corral, R.A.; Wong-Corral, F.J.; Borboa-Flores, J.; et al. Association of Different ABO and Rh Blood Groups with the Erythroprotective Effect of Extracts from Navicula incerta and Their Anti-Inflammatory and Antiproliferative Properties. Metabolites 2022, 12, 1203. [Google Scholar] [CrossRef] [Scilit] [PubMed]
- Miramontes-Piedra, J.A.; Robles-García, M.Á.; Vázquez-Aguilar, A.; Vega-Ruiz, B.; Del-Toro-Sánchez, C.L.; Villalpando-Vargas, F.V.; Rodríguez-Preciado, S.Y.; Díaz-Zaragoza, M.; Barrera-de-León, J.C.; Ramírez-Briones, E.; et al. Dual-Loaded Quercetin–Resveratrol Niosomes: Sustained In Vitro Release and Retained Bioactivity in Hummus During Simulated Gastrointestinal Digestion. Int. J. Mol. Sci. 2026, 27, 8686. [Google Scholar] [CrossRef] [Scilit] [PubMed]
- Šturm, L.; Poklar Ulrih, N. Basic Methods for Preparation of Liposomes and Studying Their Interactions with Different Compounds, with the Emphasis on Polyphenols. Int. J. Mol. Sci. 2021, 22, 6547. [Google Scholar] [CrossRef] [Scilit] [PubMed]
- Ghorbanzade, T.; Jafari, S.M.; Akhavan, S.; Hadavi, R. Nano-Encapsulation of Fish Oil in Nano-Liposomes and Its Application in Fortification of Yogurt. Food Chem. 2017, 216, 146–152. [Google Scholar] [CrossRef] [Scilit] [PubMed]
- Stetefeld, J.; McKenna, S.A.; Patel, T.R. Dynamic light scattering: A practical guide and applications in biomedical sciences. Biophys. Rev. 2016, 8, 409–427. [Google Scholar] [CrossRef] [Scilit] [PubMed]
- Bhattacharjee, S. DLS and zeta potential—What they are and what they are not? J. Control. Release 2016, 235, 337–351. [Google Scholar] [CrossRef] [Scilit] [PubMed]
- Pan, L.; Wang, H.; Gu, K. Nanoliposomes as Vehicles for Astaxanthin: Characterization, In Vitro Release Evaluation and Structure. Molecules 2018, 23, 2822. [Google Scholar] [CrossRef] [Scilit] [PubMed]
- Van-Campen, D.R.; Glahn, R.P. Micronutrient bioavailability techniques: Accuracy, problems and limitations. Field Crops Res. 1999, 60, 93–113. [Google Scholar] [CrossRef] [Scilit]
- Tarko, T.; DudaChodak, A.; Sroka, P.; Satora, P.; Michalik, J. Tranformations of phenolic compounds in an in vitro model simulating the human alimentary tract. Food Technol. Biotechnol. 2009, 47, 456–463. Available online: https://www.researchgate.net/publication/228681963_Transformations_of_Phenolic_Compounds_in_an_in_vitro_Model_Simulating_the_Human_Alimentary_Tract (accessed on 23 June 2026).
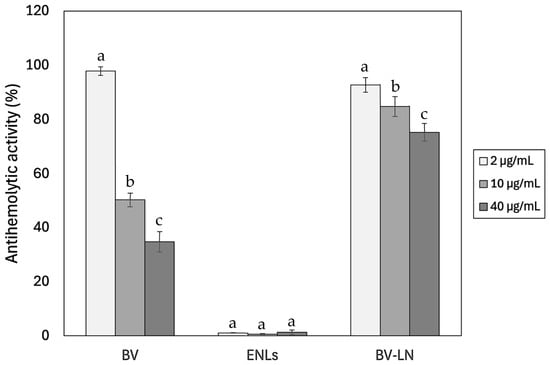
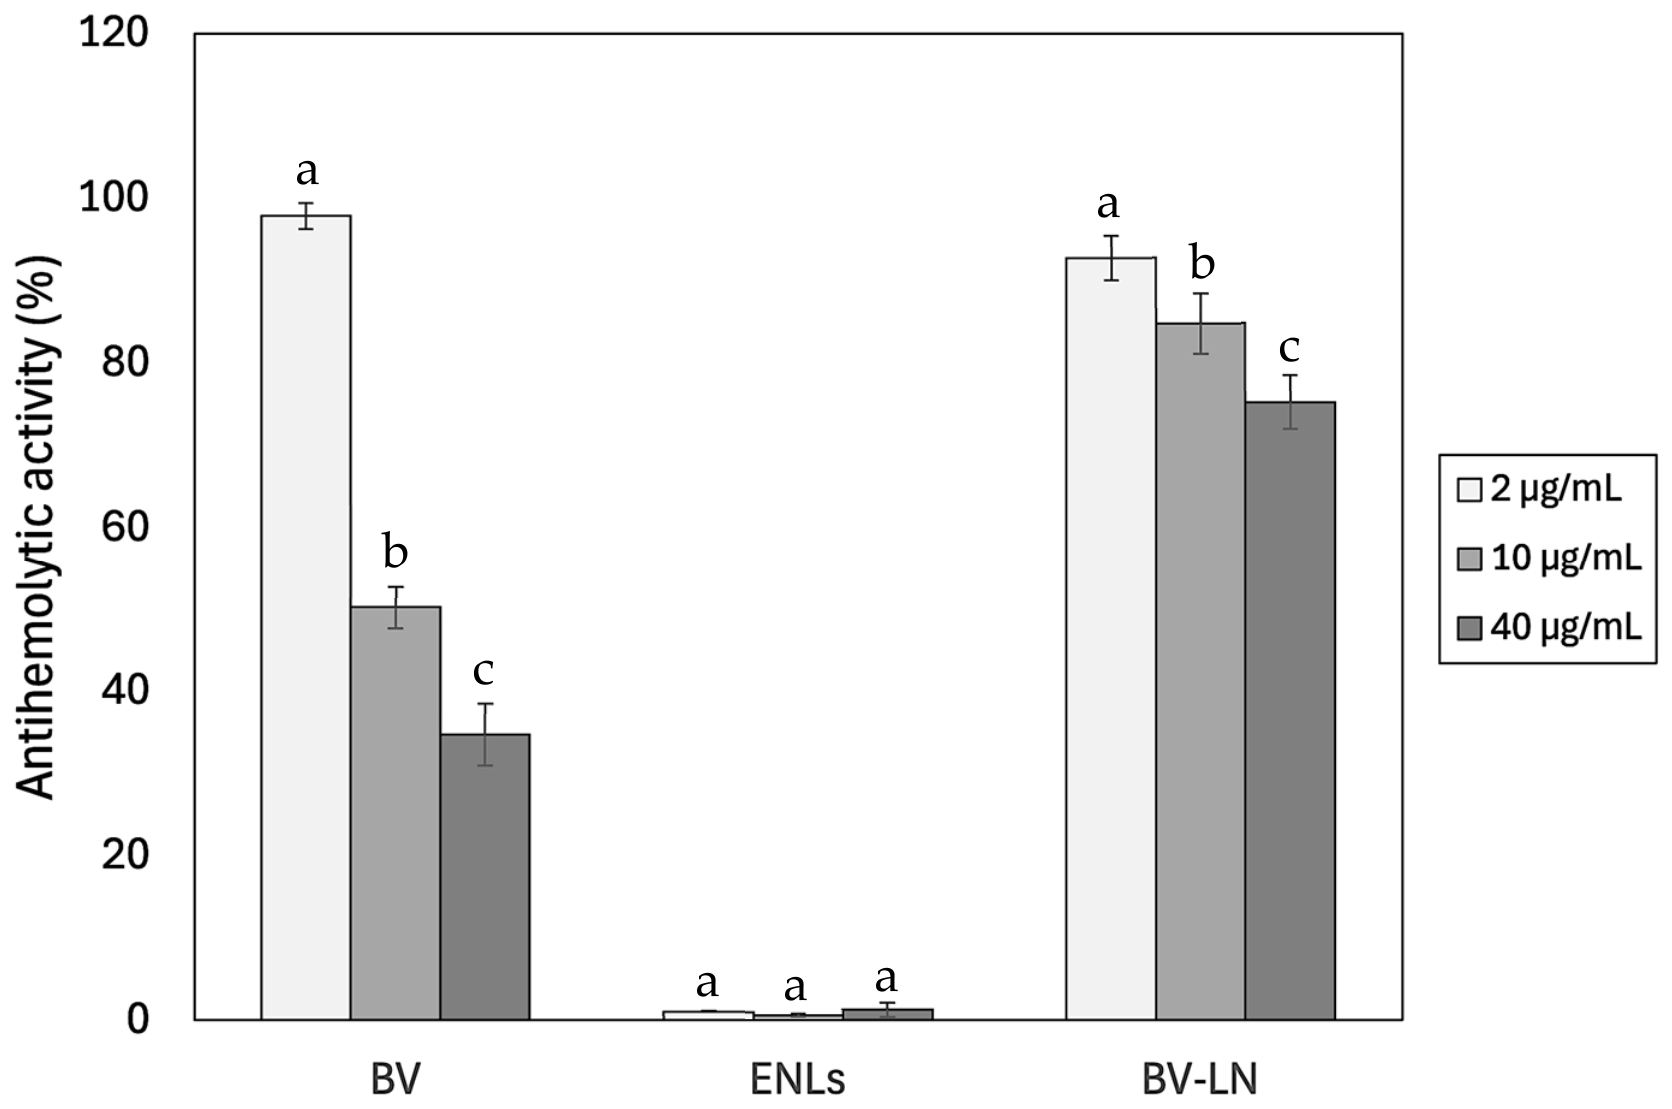
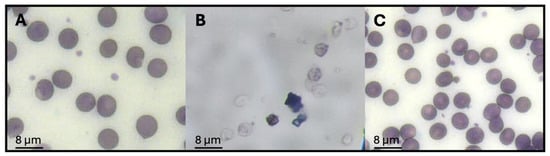
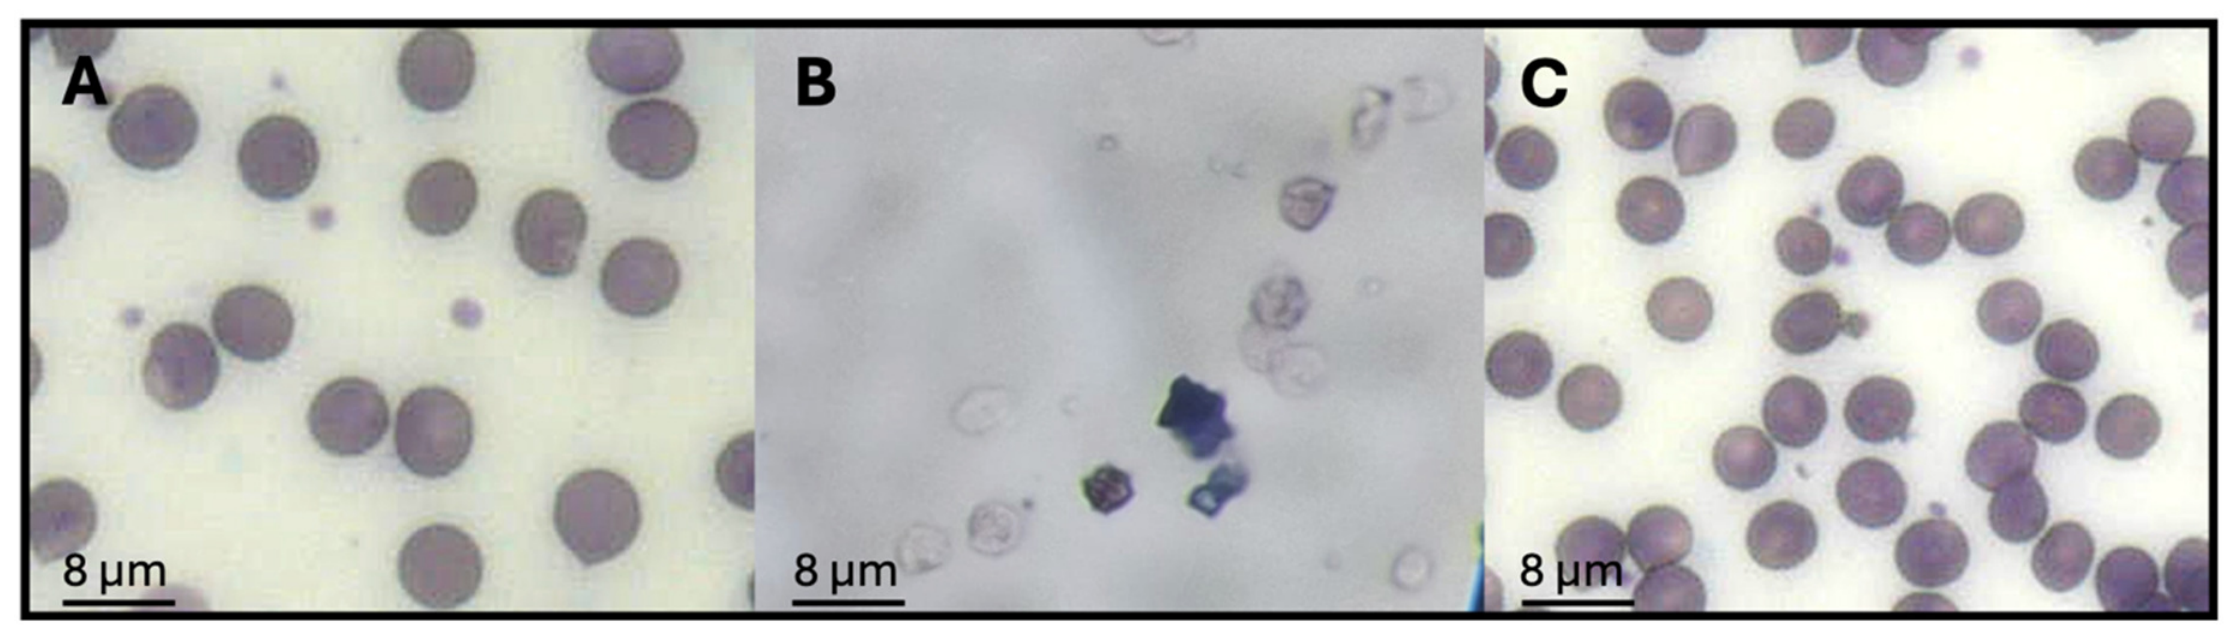
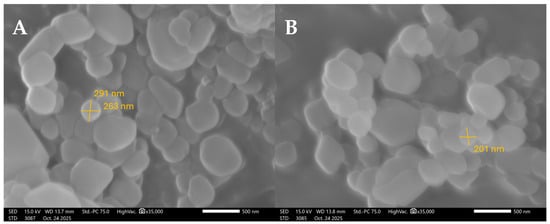
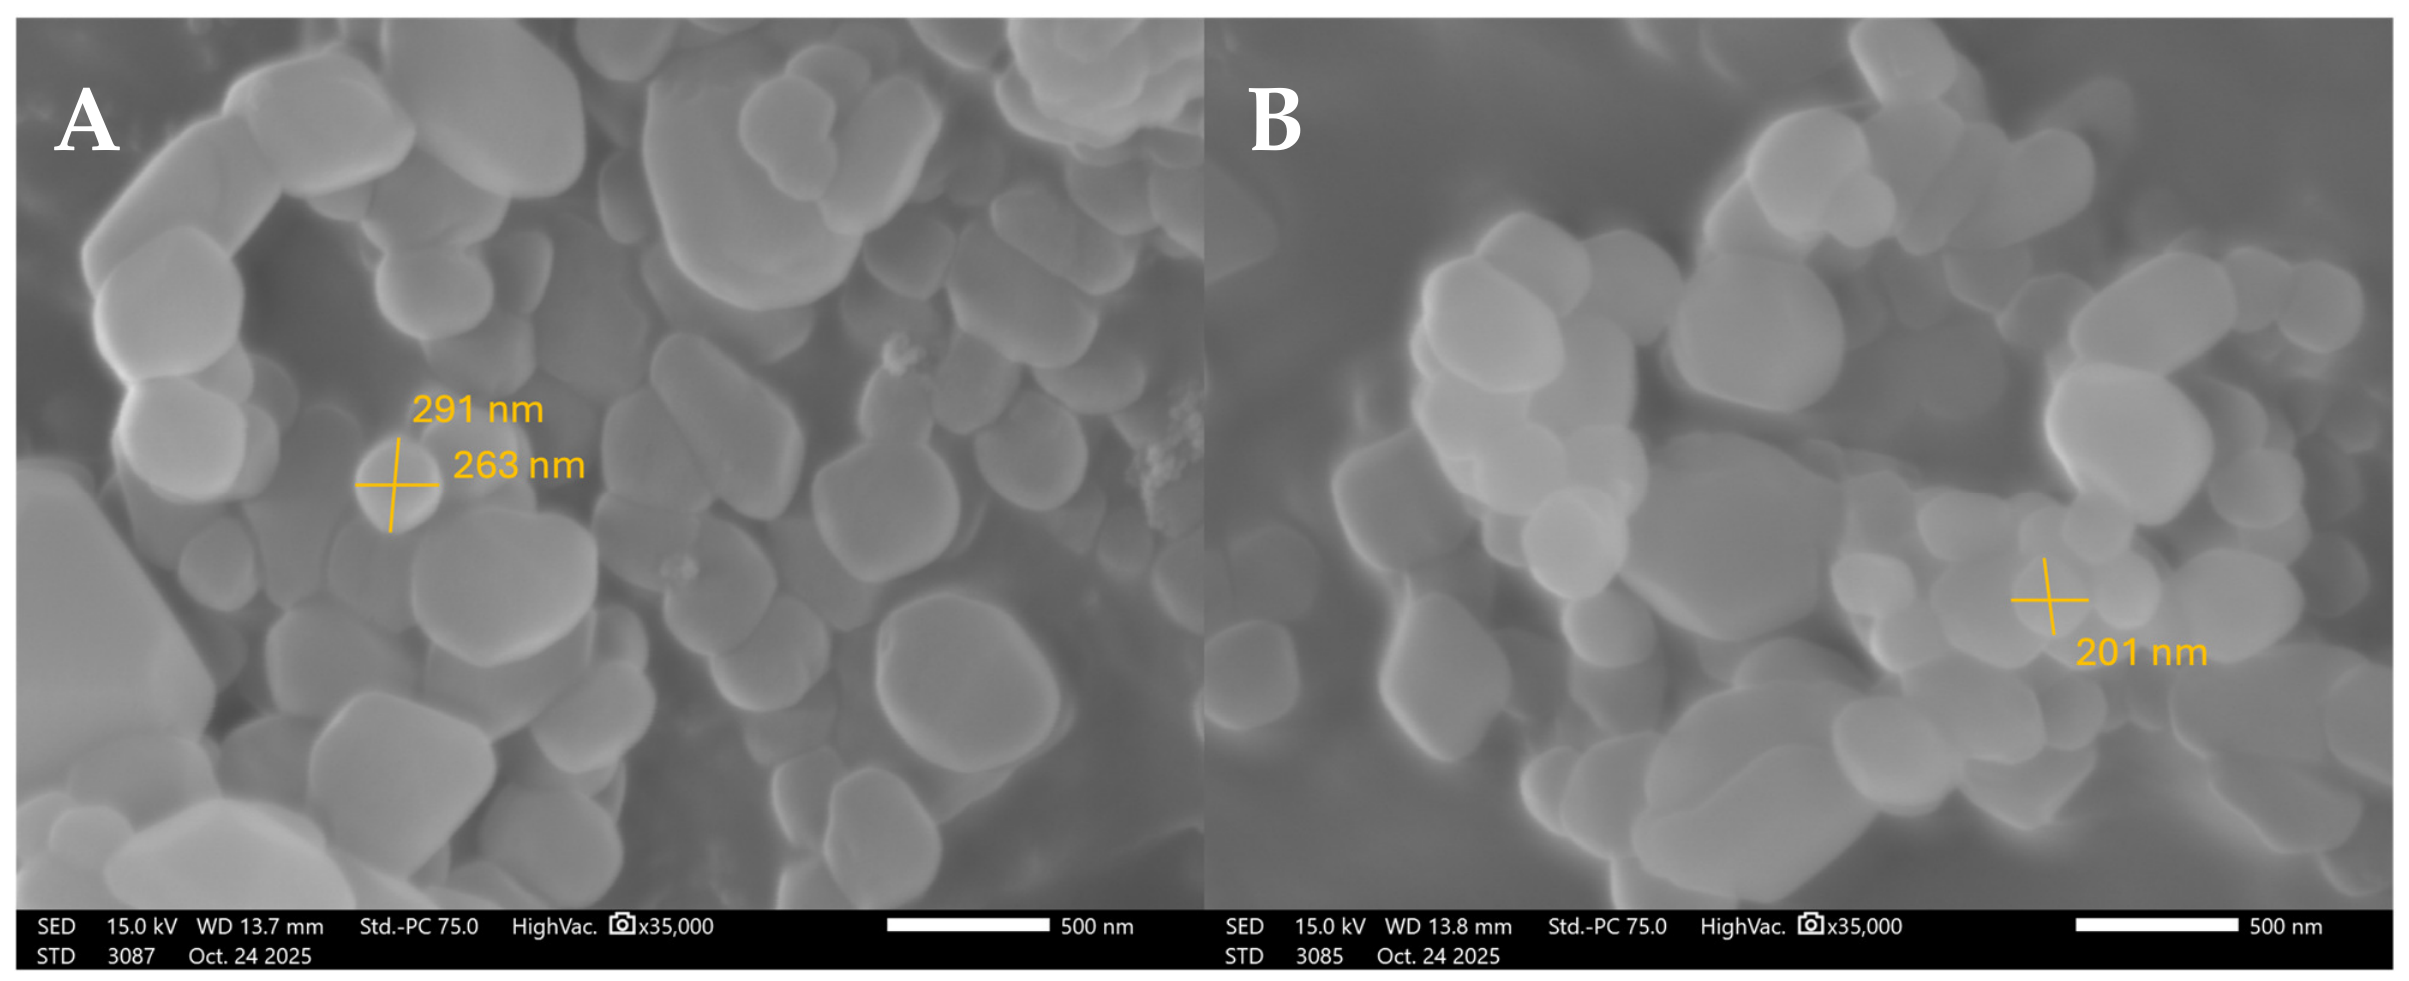
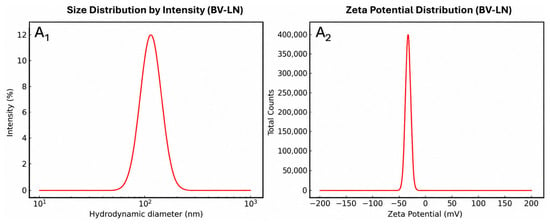
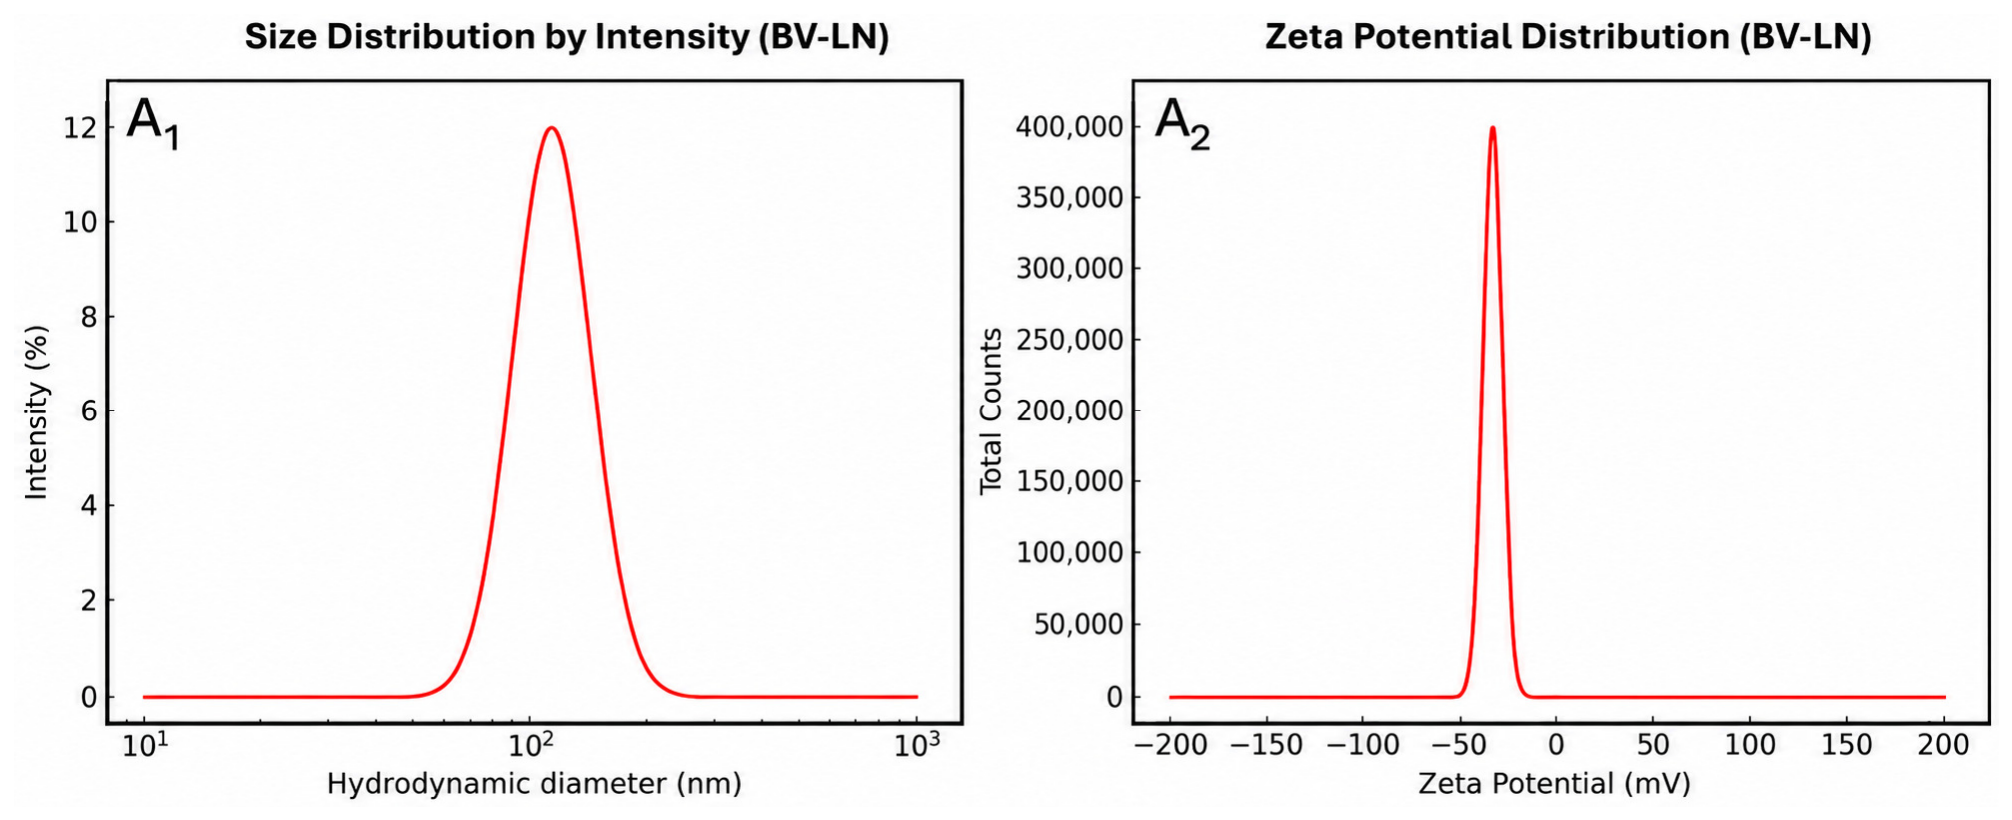
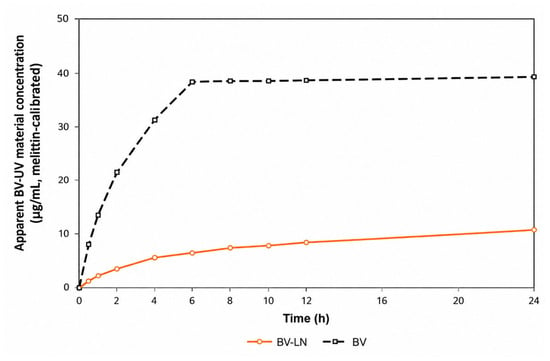
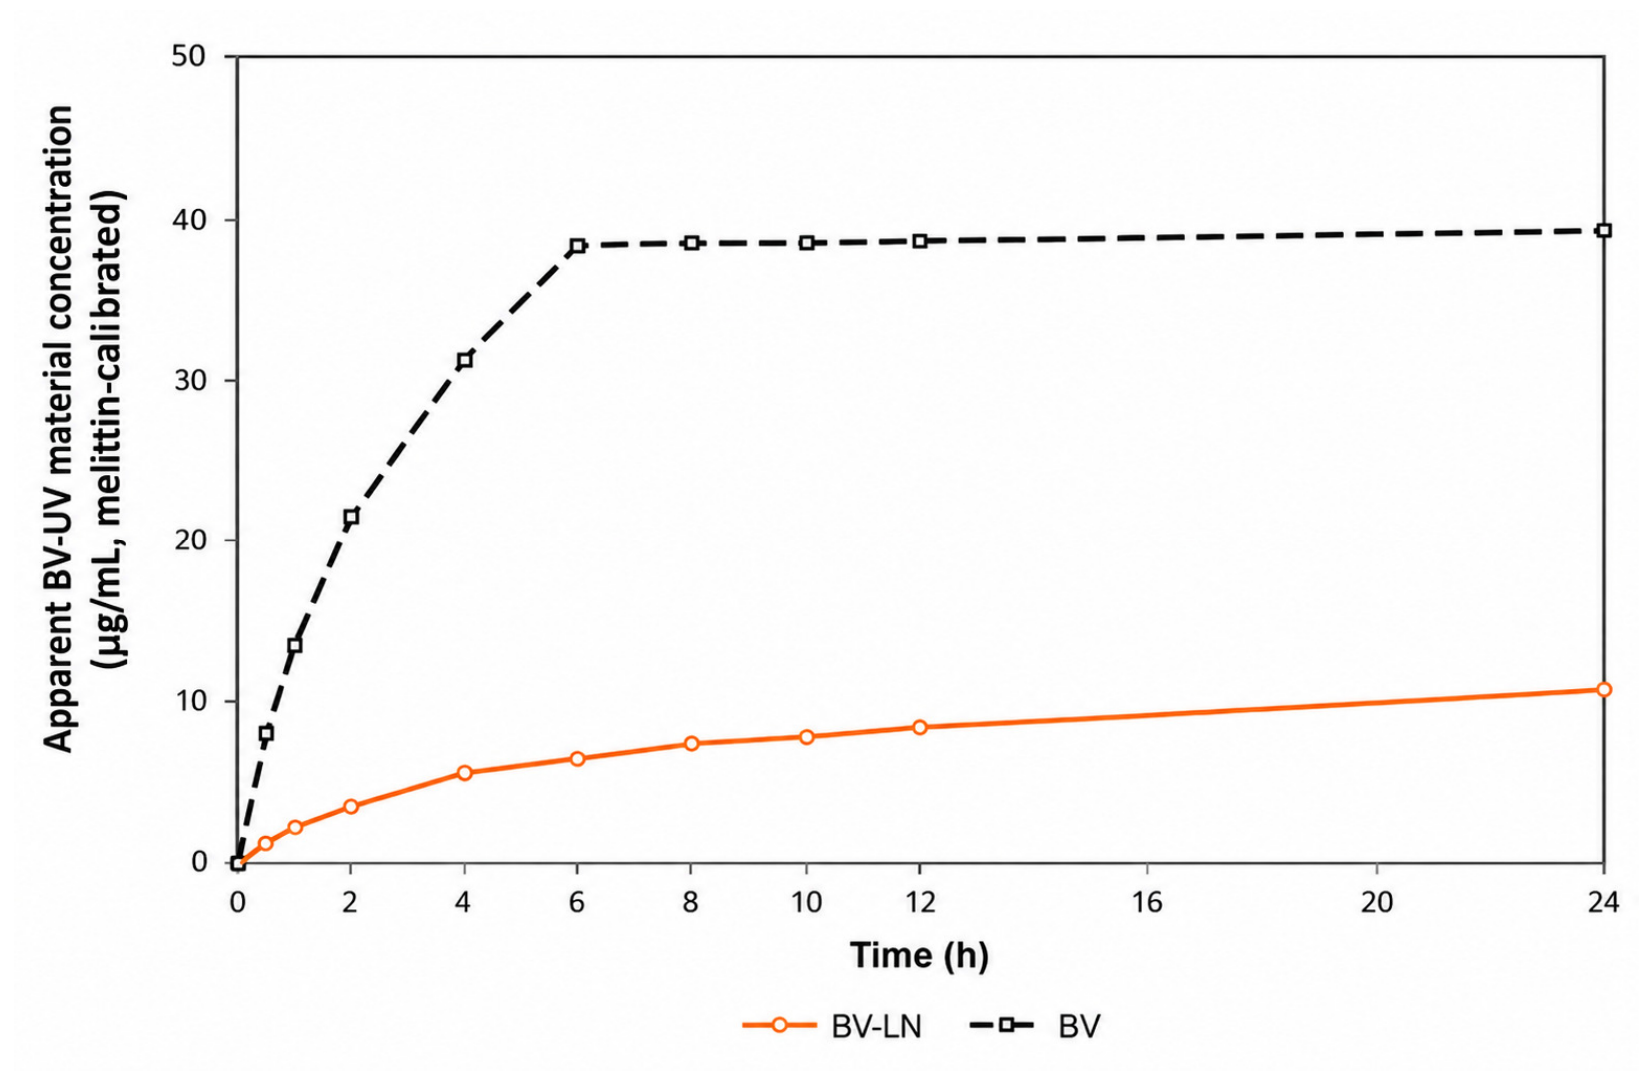
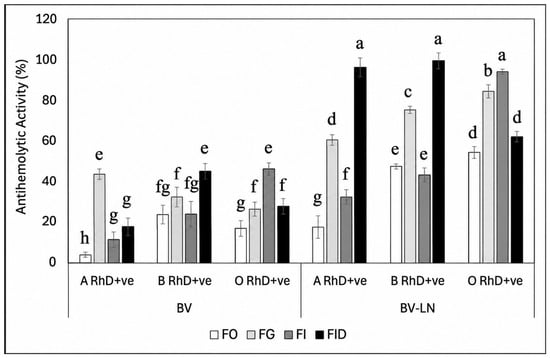
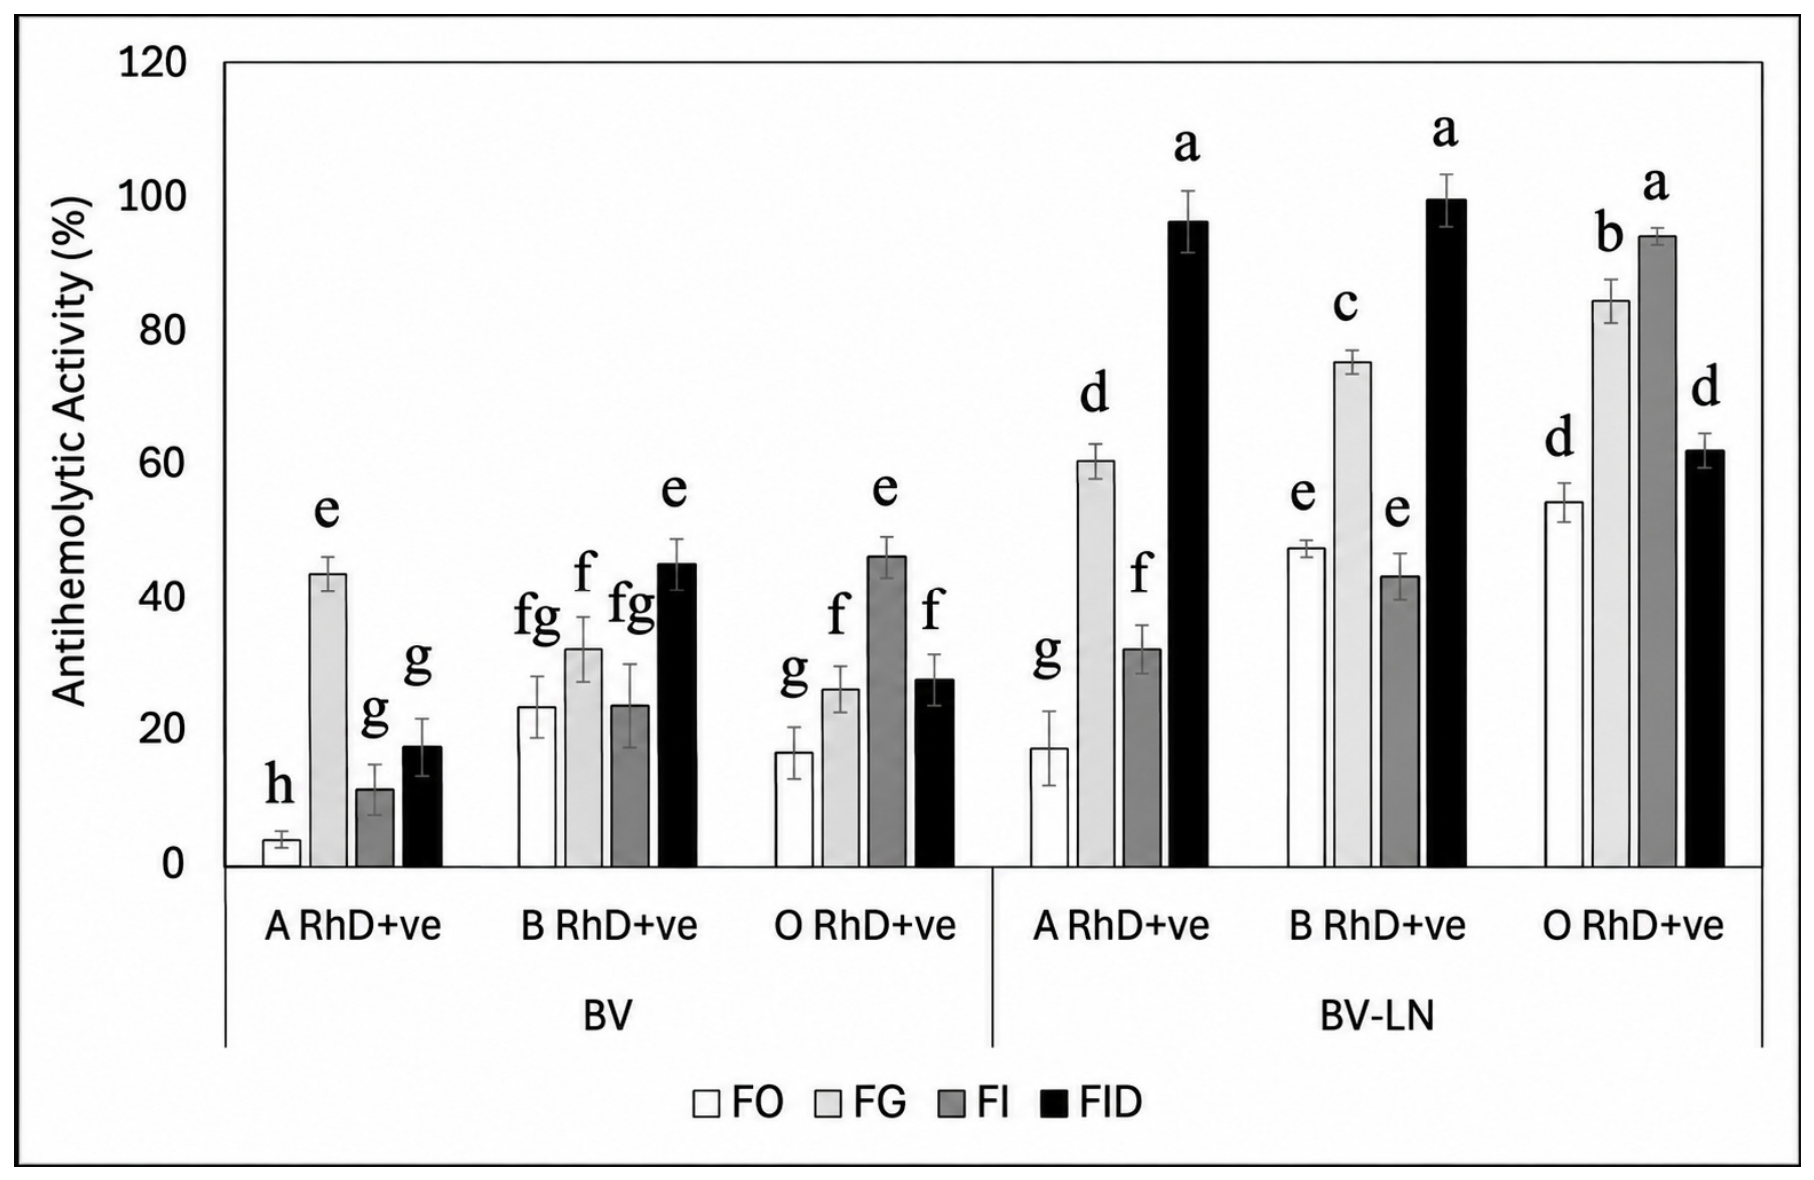
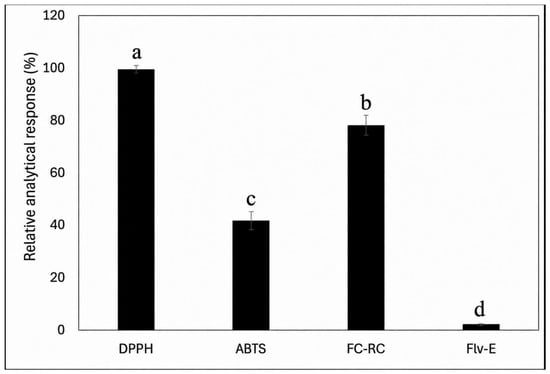
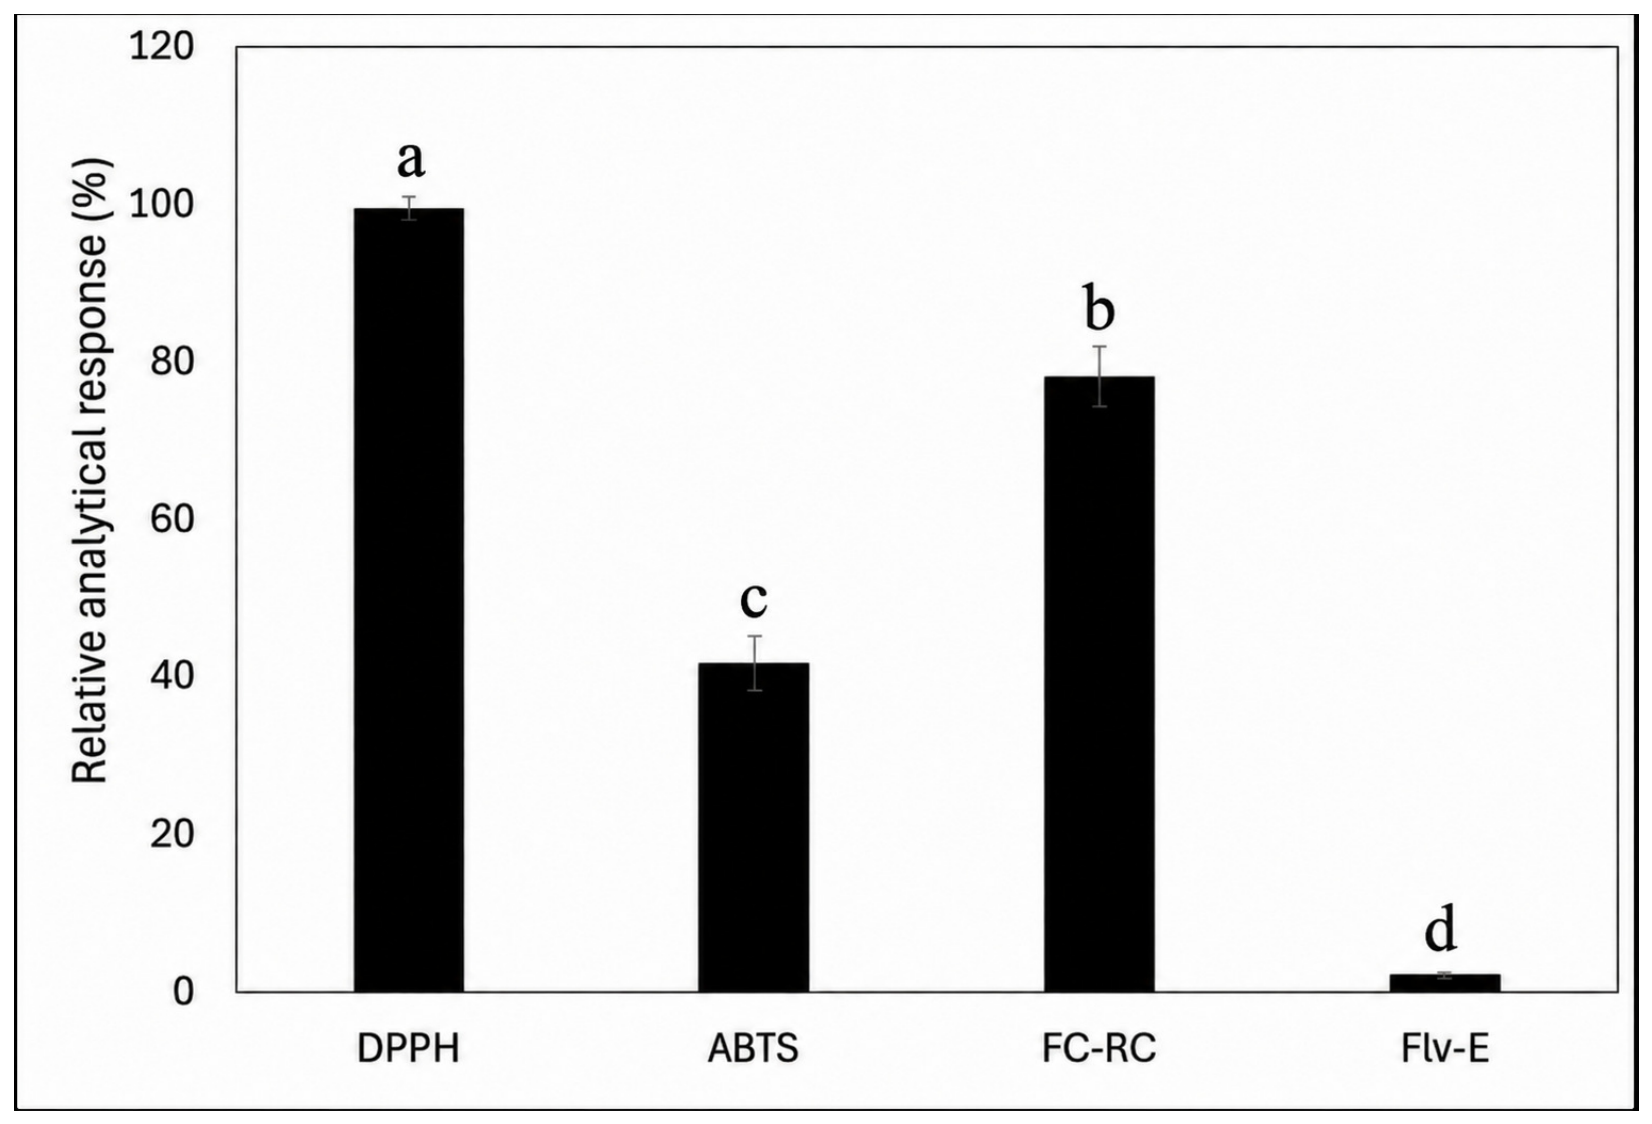

Disclaimer/Publisher’s Note: The statements, opinions and data contained in all publications are solely those of the individual author(s) and contributor(s) and not of MDPI and/or the editor(s). MDPI and/or the editor(s) disclaim responsibility for any injury to people or property resulting from any ideas, methods, instructions or products referred to in the content. |
© 2026 by the authors. Licensee MDPI, Basel, Switzerland. This article is an open access article distributed under the terms and conditions of the Creative Commons Attribution (CC BY) license.