


Abstract
Olive extracts are increasingly used as concentrated, formulation-ready sources of olive phenolics and secoiridoids, yet many published chromatographic methods only focus on one or two identified compounds, limiting broader compositional screening and product-to-product differentiation. To address this gap, a UHPLC–PDA method was developed for the simultaneous identification and quantitation of six key olive bioactives (hydroxytyrosol, tyrosol, oleuropein, oleuroside, oleacein, and oleocanthal) in powdered olive extract matrices. Samples were extracted in 80% acetonitrile using sonication and centrifugation, then separated on a C18 column with a 9-min gradient using 0.1% TFA (aq) and acetonitrile (MeCN). The extracts were analyzed at 240 and 280 nm, and quantified using external calibration with reference standards. The method met AOAC-based system suitability criteria (peak-area RSD ≤ 0.6%; retention time RSD ≤ 0.16%), including a resolution of 1.96, and delivered 11,364 ± 69 theoretical plates for the final peak. Calibration was linear across analyte-dependent ranges spanning 5.5–520 μg/mL (R2 = 0.9996–0.99997), with LODs of 1.8–6.8 μg/mL and LOQs of 5.5–20.6 μg/mL. Recovery of pre-extraction oleuropein spikes was 96.7–101.6%, and three-day repeatability yielded RSDr values of 2.0–2.3%, depending on analyte. Overall, the results indicate that this UHPLC–PDA assay provides a fast, selective, and practical option for routine, multi-analyte screening of powdered olive extract products.
1. Introduction
Olives (Olea europaea L.) and olive-derived foods represent a unique intersection of longstanding culinary tradition and contemporary chronic disease research, shaping how healthy aging is framed in both nutrition science and product development. In large-scale dietary controlled studies, Mediterranean diets enriched with extra virgin olive oil (EVOO) have been associated with lower rates of major cardiovascular risks, reinforcing the hypothesis that olive-derived constituents contribute to cardiometabolic health [1,2,3]. At the same time, mechanistic and clinical evidence increasingly indicates that EVOO’s value extends beyond its fatty-acid profile: its minor polar fraction—particularly phenolics and secoiridoids—has been linked to modulation of oxidative stress and inflammatory signaling, providing a biologically credible foundation for modern wellness positioning [4,5].
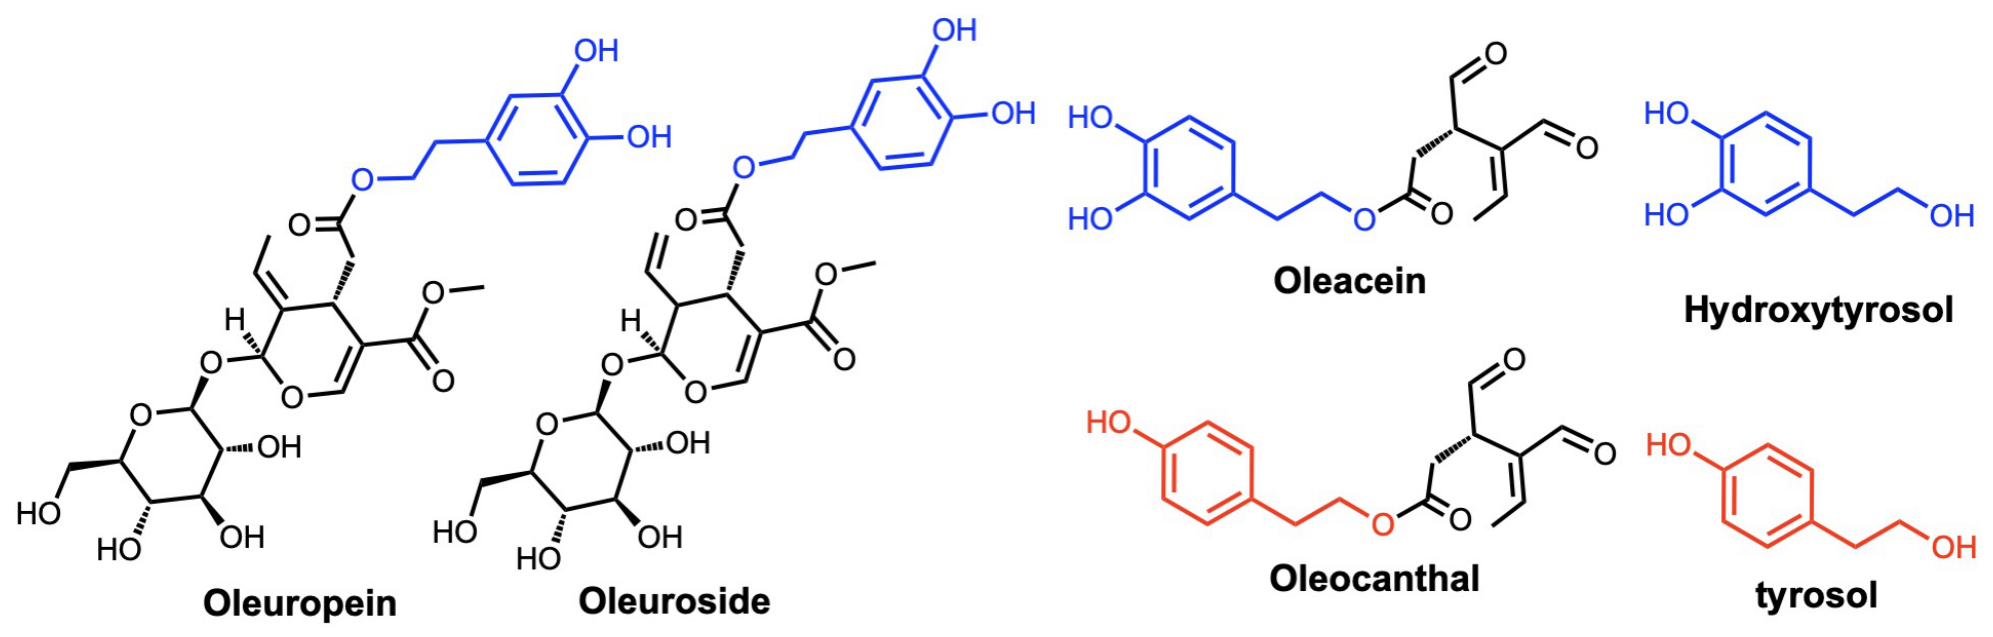
From an analytical perspective, olive matrices are chemically diverse. Simple phenylethanoids, such as hydroxytyrosol and tyrosol, coexist with larger secoiridoids such as oleuropein and oleuroside in olive leaves [6,7]. During the processing of olives and olive-derived materials, secoiridoid transformations can produce the reactive dialdehydic derivatives oleacein and oleocanthal [7]. These compound classes differ in polarity, stability, and isomerization behavior, and their relative abundance depends strongly on plant part, cultivar, harvest conditions, and processing. This variability complicates the compositional characterization and standardization of olive extracts. Therefore, rigorous compositional measurement becomes essential for quality control, cross-study comparability, standardization, and defensible product differentiation [7,8]. Published methods for determining total hydroxytyrosol and tyrosol often involve hydrolysis to account for their bound forms and are primarily designed for olive oil analysis [9,10,11,12]. In this work, the analysis focuses on six key olive constituents: hydroxytyrosol, tyrosol, oleuropein, oleuroside, oleacein, and oleocanthal (Figure 1). These compounds were selected based on their relevance to the compositional characterization and standardization of olive-derived ingredients. Hydroxytyrosol and tyrosol are relevant to the European Food Safety Authority (EFSA) health claim concerning the protection of low-density lipoproteins (LDLs) from oxidative damage [13]. Oleuropein often dominates the phenolic profile of olive leaves and extracts, and is frequently used as a marker of extract potency and identity [8]. Oleacein and oleocanthal gained attention when studies reported “ibuprofen-like” inhibition of cyclooxygenase, offering a biochemical link to inflammation-related hypotheses [4,14]. Together, these compounds provide a practical, high-value set of markers for screening olive extract ingredients used in wellness-focused products (Figure 1).
Figure 1.
Chemical structures of the six compounds analyzed in this work. Blue segments of molecules correspond to the hydroxytyrosol moiety, whereas red segments correspond to the tyrosol moiety.
Despite the growing interest in olive bioactives, the analytical literature is still inconsistent across compounds and sample types. Several published methods were developed specifically to determine total hydroxytyrosol and tyrosol, including their bound forms after hydrolysis [9,10,11,12]. In contrast, methods that quantify aldehydic secoiridoids such as oleocanthal and oleacein are more frequently developed for EVOO and often rely on mass spectrometry to manage selectivity in complex oil matrices [14,15]. This creates a practical need for an accessible, multi-analyte assay suitable for the routine screening of olive extracts. Accordingly, this study presents the development and validation of a UHPLC–PDA method for the simultaneous identification and quantitation of six high-interest olive actives (hydroxytyrosol, tyrosol, oleuropein, oleuroside, oleacein, and oleocanthal) in powdered olive extract matrices using external standards for retention time confirmation and quantitation.
2. Results & Discussion
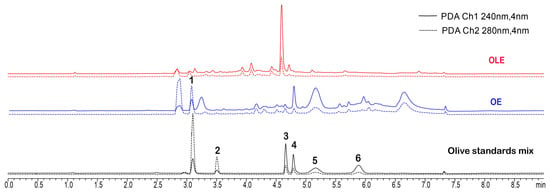
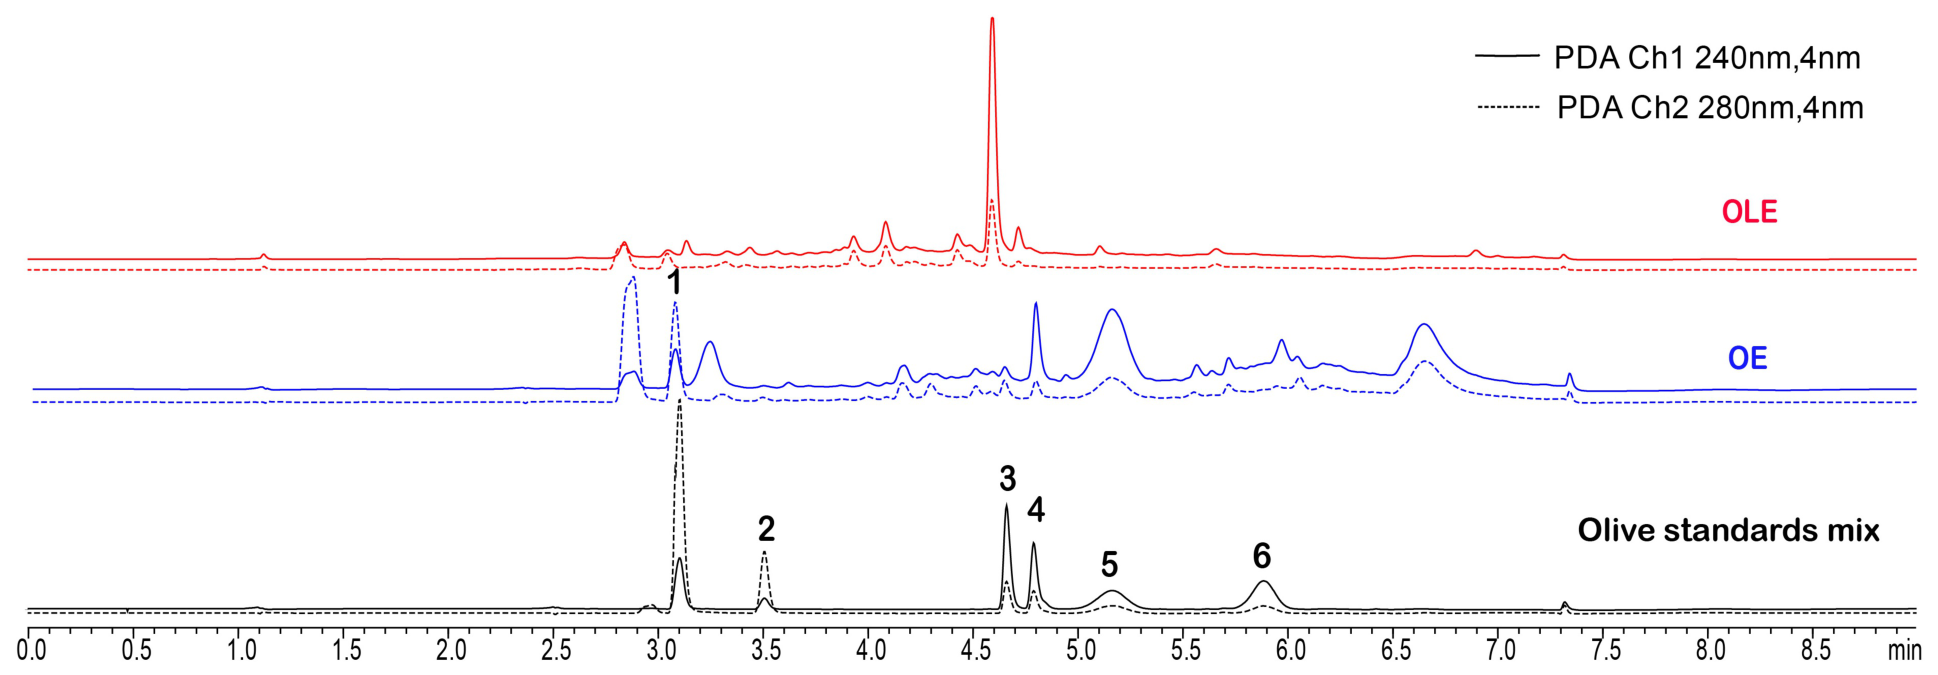
A commercially available olive leaf extract (OLE) and standardized secoiridoid olive extracts (OE), along with commercial reference standards, were examined for the target analytes using (U)HPLC-PDA. Chromatograms were recorded at 240 and 280 nm (Figure 2), wavelengths commonly used for identification and quantitation in olive oil analysis [9]. All six reference compounds were detected, and their retention times and UV spectra were compared with those observed in the extract samples. Samples and standards were prepared in 80:20 acetonitrile:water. Hereafter, olive extracts refers specifically to powdered olive extracts unless otherwise specified.
Figure 2.
Representative UHPLC-PDA chromatograms of olive extracts (blue and red) overlaid on a representative chromatogram of the mixed standard (black), recorded at 240 nm (solid lines) and 280 nm (dashed lines). 1. Hydroxytyrosol (HTy); 2. tyrosol (Ty); 3. oleuropein; 4. oleuroside; 5. oleacein; 6. oleocanthal. Elenolic acid can be observed near 3.2 min (blue lines, OE) but was not quantified for this work.
2.1. Identification of Target Compounds
Hydroxytyrosol and tyrosol exhibited characteristic ultraviolet (UV) absorption spectra with maxima near 280 nm. Hydroxytyrosol also showed greater absorbance in the lower UV region of 210–220 nm; in comparison, the absorption maximum of tyrosol near 280 nm was consistent with its phenolic chromophore [16]. Oleuropein, oleuroside, and oleacein, which contain hydroxytyrosol moieties, showed a pronounced absorption at 230 nm, with a secondary absorbance band at 280 nm. Oleuroside was identified in both raw olive leaf extracts (OLEs) and standardized secoiridoid olive extracts (OEs), and has previously been reported [6]. Oleocanthal, a direct chemical derivative of tyrosol, showed one absorbance at 230 nm and a small shoulder at 280 nm. Although most compounds show a strong absorbance near 230 nm, chromatograms were recorded at 240 nm to reduce baseline drift observed while monitoring the 230 nm detector channel. This baseline drift can be attributed to solvent absorption (acetonitrile), and to the D2 lamp used to illuminate the sample during the detection phase. Reference UV spectra for all six compounds are provided in the Supplementary Information (SI Figure S1).
2.2. Method Validation
The objective of this study was to develop and validate a single-laboratory (U)HPLC-PDA method, based on AOAC guidelines [17], for the simultaneous quantitation of six key olive bioactives: hydroxytyrosol, tyrosol, oleuropein, oleuroside, oleacein, and oleocanthal. Acceptance criteria were as follows for system suitability measurements: <2% RSD for peak areas of all compounds measured; <1% RSD for retention times; ≥1.5 for the resolution of the two closest eluting peaks; and # theoretical plates > 2000 for the last-eluting compound in the study sample. As shown in Table 1 and Table 3, all system suitability requirements were met, and calibration data show sufficient linearity across all six compounds studied in this work.
Table 1.
Tabulated system suitability and performance data for olive extract components. Values for peak area and retention time are reported as %RSD. Column A.C. denotes selected acceptance criteria for suitability measurements.
2.2.1. Chromatographic Conditions
The method development was started with UHPLC gradient conditions and column screening (SI Figure S5). Initial column screening produced good resolution between hydroxytyrosol and tyrosol, but not between oleuropein, oleuroside, and oleacein. The best chromatographic separation was achieved using a UHPLC column (Luna Omega® C18, 2.1 × 150 mm, 1.6 μm) with a 9-min gradient program, as shown in Table 2. For UHPLC data analysis, the injection volume was 5 μL. Chromatographic data were analyzed with LabSolutions version 5.87.
Table 2.
Elution gradient for the analysis of olive extract products. Mobile phase A: 0.1% TFA (aq). Mobile phase B: 100% MeCN. Flow rate: 0.37–0.5 mL/min. Temperature: 30 °C. Total elution time: 9 min.
2.2.2. Calibration Performance
Table 3 shows calibration data in more detail. Once acceptable system suitability criteria were met, more detailed analysis and calibration work was conducted to ensure each calibration suite appropriately bracketed high and low concentrations of analyte. Calibration curves all show excellent linearity (R2 ≥ 0.999) and have analysis ranges spanning relevant orders of magnitude. The limits of detection (LOD) and limits of quantitation (LOQ) of all six compounds were determined by the standard deviation of y-intercepts over the slope of the regression lines from three replicated calibration curves on three different days [18]. LOD is typically used to represent the lowest value an instrument can reliably distinguish from background signal. The LOQ, in turn, is the lowest value that can be reliably quantified on a repeat basis. The LODs and LOQs for all bioactive compounds studied in this work are listed in Table 3.
Table 3.
Calibration data for hydroxytyrosol, tyrosol, oleuropein, oleuroside, oleacein, and oleocanthal from three different calibration curves. LOD, LOQ, and Linear Range values are reported in μg/mL.
2.3. Recovery Analysis
A single user, single laboratory recovery validation process was used to assess the accuracy of the entire method. Blank/depleted/native, representative samples were spiked with 0.075–0.300 mg/mL hydroxytyrosol and 0.05–0.200 mg/mL oleuropein. Three replicates of each level were performed, and the average percent recovery was calculated for the analyte. Marginal recoveries indicated the amount of spike recovered, whereas total recovery indicate the recovery of spike plus any original analyte in the sample. Hydroxytyrosol and oleuropein were chosen for the recovery experiments to demonstrate the precision of the method at the beginning and middle of the chromatographic gradient, and chosen on the basis of cost. Standards for olive constituents are often extremely expensive, and as such, two of the cheaper standards were used to demonstrate the efficacy of the extraction and the overall robustness of the method.
Recovery results are summarized in Table 4 and shown in SI Figure S2A–D. Chromatograms for each additional spike level, including the blank (native), can also be found in SI Figure S2.
Table 4.
Recovery data for intra-lab, single user validation of hydroxytyrosol and oleuropein. Recoveries of 0.075, 0.150, and 0.300 mg/mL are shown for hydroxytyrosol, and recoveries of 0.05, 0.100, and 0.200 mg/mL are shown for oleuropein.
2.4. Precision & Sample Testing
Repeatability and intermediate precision were assessed using six independent sample preparations analyzed on each of three days, providing 18 measurements in total (Table 5). Calibration curves were made to bracket the expected concentration of analyte present in any given sample, and as such, %RSDr should be lower toward the middle of the calibration curve. Large %RSDr values and their associated errors, in turn, can be attributed to concentrations of the target analyte near the edges of their respective calibration curves (near the LOQ at the low end, or where the calibration curve no longer represents a linear correlation between concentration and signal response at the high end) [19]. As demonstrated in (Table 5), analytes near the middle of the linear range of the calibration curve have lower associated error with those measurements.
Table 5.
Tabulated inter- and intra-day repeatability for olive extract sample OE 1. All average concentrations (bold rows) are reported as a mass percentage (%) ± standard deviation of all six measurements for that day. BLQ: below the limit of quantitation. N/A: not applicable.
Although frequently below LOQ, tyrosol, oleuropein, and oleocanthal were detected in all OE samples run during the inter-day testing (Table 5). The low concentration of oleuropein can be attributed to chemical conversion of oleuropein to its constituent aglycone and/or oleacein, or full cleavage of the hydroxytyrosol moiety (Table 5 and Table 6). OE samples 1–3 are similar in physical appearance, but each sample contains different levels of studied analytes, with the largest differences seen between oleacein concentrations. Notably, the hydroxytyrosol concentration remains almost identical in each case. The commercially available, powdered olive leaf extract, OLE-N, only contained hydroxytyrosol, tyrosol, oleuropein, and oleuroside in quantifiable levels.
Table 6.
Tabulated intra-day chromatographic data for powdered olive extracts. Average concentrations (bold rows) are reported as a mass percentage (%) ± standard deviation of three measurements. Compounds denoted “BLQ” were identified in chromatograms but not quantified. Compounds denoted “ND” were not identified in the sample.
This proposed method complements existing olive phenolic assays by targeting a different combination of analytes and sample matrices. Published methods for determining total hydroxytyrosol and tyrosol often involve hydrolysis to account for their bound forms and are primarily designed for olive oil analysis [9,10,11,12]. However, the present UHPLC–PDA method allows the determination of six analytes within a 9-min chromatographic program without requiring mass spectrometry.
3. Materials and Methods
3.1. Materials
Grade A volumetric glassware was used throughout validation and quantitation to ensure reproducibility and minimize propagated errors. Trifluoroacetic acid (TFA, 0.1%, Thermo, HPLC grade, Waltham, MA, USA), acetonitrile (Birch, LC-MS grade, St. Johns, NL, Canada), ethanol (Decon Labs, 200 proof USP grade, King of Prussia, PA, USA) and water (Fisher, LC-MS grade, Waltham, MA, USA) were all used after degassing via sonication for at least 10 min. Oleacein (LGC Chemicals, ≥90%, Surrey, UK), oleocanthal (Adipogen, ≥97%, San Diego, CA, USA), oleuropein (Sigma, ≥98%, Waltham, MA, USA), oleuroside (Chengdu Biopurify, ≥98, Chengdu, China), and hydroxytyrosol (ChemScene, ≥98%, Monmouth Junction, NJ, USA) were stored at −20 °C until use. Tyrosol (TCI, ≥98%, Portland, OR, USA) was stored at room temperature and used as received. Olive extracts (OEs) were acquired from OleoLive® (Shreveport, LA, USA), and commercially available olive leaf extracts were sourced from Bloomingdale, IL, USA (OLE-N).
3.2. Instrumentation
Masses were recorded on a Sartorius® Entris 124-15 analytical 4 digit balance (Sartorius, Göttingen, Germany calibrated with 1 g, 500 mg, and 1 mg calibration weights. Liquid chromatography was conducted using a Shimadzu Nexera® LC-40B X3 (Shimadzu, Columbia, MD, USA) equipped with a SPD-M40 PDA detector, SIL-40C X3 autosampler, LC-40B X3 pump, CTO-40C column oven, and CBM-40 control module. The column used was a Luna® Omega C18 (2.1 × 150 mm) with a 1.6 μm particle size (Phenomenex, Torrance, CA, USA). Sonication was carried out in a Fisher Scientific Ultrasonic Bath 5.7 L (Fisher Scientific, Waltham, MA, USA), operating at 40 kHz. A Thermo Sorvall Legend XTR centrifuge Fisher Scientific, Waltham, MA, USA (3000 rpm) was used for samples > 2 mL, and a Fisher Sceintific accuSpin Micro 17 (Fisher Scientific, Waltham, MA, USA) (17,000 rpm) was used for sample volumes under 2 mL.
3.3. Standard Preparation
Calibration curves and standard spikes were made using stock solutions, which were prepared fresh immediately before first use. All individual standard stock solutions of 1–10 mg/mL of each standard compound were accurately prepared by weighing about 10–100 mg of each compound and dissolving them into a 5 or 10 mL volumetric flask using 80% acetonitrile. Volumetric flasks were sonicated for 10 min and wrapped with aluminum foil to protect them from light, and stock solutions were stored at −20 °C. Working standard solutions were prepared fresh daily by pipetting aliquots of stock solutions, followed by serial dilutions with 80% acetonitrile. Standards were made at concentrations ranging from 0.035–0.52 mg/mL for hydroxytyrosol; 0.014–0.231 mg/mL for tyrosol; 0.017–0.262 mg/mL for oleuropein; 0.0138–0.205 for oleuroside; 0.0253–0.404 mg/mL for oleacein; and 0.009–0.150 mg/mL for oleocanthal.
3.4. Sample Preparation
To a 50 mL centrifuge tube was added 500 mg OE powdered olive extract or OLE powdered olive extract, followed by 15 mL 80:20 MeCN:water. The solution was mixed and sonicated for 10 min at 37 °C. The light tan liquid was centrifuged at 3000 rpm for 10 min and the supernatant was decanted into a 50 mL volumetric flask. The extraction process was repeated three times for a total solution volume of 50 mL. Aliquots of the extracted solutions were centrifuged at 17,000 rpm for 10 min, transferred to an LC vial, and loaded into the instrument for analysis.
3.5. Method Validation Parameters
Method validation was conducted in accordance with AOAC guidance and ICH Q2 recommendations for single-laboratory validation [17,18].
3.5.1. Specificity/Resolution
The mixed reference standard was injected into the UHPLC-PDA to establish the selectivity of the method. The resolution for each reference standard was calculated, and an Rs > 1.5 between closely eluting components was considered acceptable for hydroxytyrosol, tyrosol, oleuropein, oleuroside, oleacein, and oleocanthal. All measured compounds maintained a resolution of at least 1.96 for all chromatography work conducted.
3.5.2. Linearity
Linearity for each reference standard was determined using a five-point standard calibration curve in the range of 0.035–0.52 mg/mL for hydroxytyrosol; 0.014–0.231 mg/mL for tyrosol; 0.017–0.262 mg/mL for oleuropein; 0.0138–0.205 mg/mL for oleuroside; 0.0253–0.404 mg/mL for oleacein; and 0.0094–0.150 mg/mL for oleocanthal. A simple linear regression was used to calculate R2, slope, and y-intercept for each analyte curve. An R2 ≥ 0.999 was considered acceptable. The calibration standards of hydroxytyrosol, tyrosol, oleuropein, oleuroside, oleacein and oleocanthal were triplicated at the five concentrations and analyzed over three days.
3.5.3. LOD and LOQ
The limit of detection (LOD) and the limit of quantification (LOQ) of the secoiridoid and polyphenol standard assays were determined from the calibration curve method, according to the recommendations of ICH Q2 (R2) [18] by analyzing at least three replicates of the calibration standards. The LOD and LOQ of the proposed method were calculated using the following equations:
3.5.4. Recovery
Spike recovery experiments were performed at three levels for hydroxytyrosol (0.075 mg/mL, 0.150 mg/mL, and 0.300 mg/mL) and oleuropein (0.05 mg/mL, 0.100 mg/mL, and 0.200 mg/mL). Powdered OE was depleted via the extraction procedure described in Sample Preparation, and was analyzed before the standards were spiked in as a sample blank (SI Figure S4). Separately, the appropriate amount of reference standard was used to spike the depleted or blank powdered olive extract material, which was then subjected to the aforementioned extraction process outlined in Sample Preparation. Three replicates were performed at each level, and the mean recovery was calculated.
3.5.5. Precision
Independent replicates of the same sample were prepared and analyzed on three separate days (6 × 3 = 18). Within-day, between-day, and overall precision for all target compounds were calculated for single laboratory validation.
4. Conclusions
The proposed UHPLC-PDA method demonstrates high precision for the quantified analytes, photodiode array detection of characteristic UV signatures, and reliable identification of six bioactive compounds found in powdered olive extracts within a 9-min chromatographic program. Calibration data and statistics support the analytical capability of the method within the validated working ranges. Resolution between close-eluting peaks is exemplary in all cases, while also minimizing dead volume between eluting peaks during separation. System suitability testing showed minimal error and excellent repeatability across the tested matrices. Together, these results support the method’s use for compositional screening and its potential application to routine quality control of the powdered olive extracts evaluated in this study, within the validated concentration ranges. Future studies should assess recovery for the remaining analytes, examine the effects of extraction conditions, and evaluate the method across additional sample matrices and laboratories.
Supplementary Materials
The following supporting information can be downloaded at: https://www.mdpi.com/article/10.3390/molecules31224111/s1, Figure S1: hydroxytyrosol, tyrosol, oleuropein, oleuroside, oleacein, and oleocanthal UV profiles; Figure S2: High, middle, low, and blank (native) recovery chromatograms; Figure S3: OE lots 1, 2, and 3 representative chromatograms; Figure S4: OLE representative chromatograms; Figure S5: early chromatographic separations of OE 2 and 3, demonstrating the progress of the method validation.
Author Contributions
Conceptualization, C.D.H., C.F. and Y.T.; methodology, C.D.H., C.F. and Y.T.; software, C.D.H. and Y.T.; validation, C.D.H. and Y.T.; formal analysis, C.D.H.; investigation, C.D.H., O.K. and C.F.; resources, C.D.H. and C.F.; data curation, C.D.H. and Y.T.; writing—original draft preparation, C.D.H.; writing—review and editing, C.D.H., Y.T. and O.K.; visualization, C.D.H.; supervision, C.F. and O.K.; project administration, C.D.H., C.F. and Y.T.; funding acquisition, C.F. All authors have read and agreed to the published version of the manuscript.
Funding
Applied Food Sciences, Inc. (Kerrville, TX) funded this study.
Data Availability Statement
The original contributions presented in this study are included in the article/Supplementary Materials. Further inquiries can be directed at the corresponding authors.
Conflicts of Interest
Authors Christian D. Haas, Yijin Tang, Ozan Kahraman, and Christine Fields were employed by Applied Food Sciences, Inc. The authors declare that the research was conducted in the absence of any commercial or financial relationships that could be construed as a potential conflict of interest.
Abbreviations
The following abbreviations are used in this manuscript:
| %RSD | Relative Standard Deviation |
| TFA | trifluoroacetic acid |
| HTy | hydroxytyrosol |
| Ty | tyrosol |
| MeCN | acetonitrile |
| PDA | photodiode array detector |
| UHPLC | ultra-high performance liquid chromatography |
| HPLC | high-performance liquid chromatography |
| LOD | limit of detection |
| LOQ | limit of quantification |
| tR | retention time |
| Rs | resolution |
| rpm | rotations per minute |
References
- Estruch, R.; Ros, E.; Salas-Salvadó, J.; Covas, M.I.; Corella, D.; Arós, F.; Gómez-Gracia, E.; Ruiz-Gutiérrez, V.; Fiol, M.; Lapetra, J.; et al. Primary Prevention of Cardiovascular Disease with a Mediterranean Diet Supplemented with Extra-Virgin Olive Oil or Nuts. N. Engl. J. Med. 2018, 378, e34. [Google Scholar] [CrossRef] [Scilit] [PubMed]
- Martínez-González, M.A.; Gea, A.; Ruiz-Canela, M. The Mediterranean Diet and Cardiovascular Health: A Critical Review. Circ. Res. 2019, 124, 779–798. [Google Scholar] [CrossRef] [Scilit] [PubMed]
- Podadera-Herreros, A.; Alcala-Diaz, J.F.; Gutierrez-Mariscal, F.M.; Jimenez-Torres, J.; De La Cruz-Ares, S.; Arenas-de Larriva, A.P.; Cardelo, M.P.; Torres-Peña, J.D.; Luque, R.M.; Ordovas, J.M.; et al. Long-term consumption of a mediterranean diet or a low-fat diet on kidney function in coronary heart disease patients: The CORDIOPREV randomized controlled trial. Clin. Nutr. 2022, 41, 552–559. [Google Scholar] [CrossRef] [Scilit] [PubMed]
- Beauchamp, G.K.; Keast, R.S.; Morel, D.; Lin, J.; Pika, J.; Han, Q.; Lee, C.H.; Smith, A.B.; Breslin, P.A. Ibuprofen-like activity in extra-virgin olive oil. Nature 2005, 437, 45–46. [Google Scholar] [CrossRef] [Scilit] [PubMed]
- Romani, A.; Ieri, F.; Urciuoli, S.; Noce, A.; Marrone, G.; Nediani, C.; Bernini, R. Health Effects of Phenolic Compounds Found in Extra-Virgin Olive Oil, By-Products, and Leaf of Olea europaea L. Nutrients 2019, 11, 1776. [Google Scholar] [CrossRef] [Scilit] [PubMed]
- Abbattista, R.; Losito, I.; Calvano, C.D.; Cataldi, T.R. Exploring the Isomeric Precursors of Olive Oil Major Secoiridoids: An Insight into Olive Leaves and Drupes by Liquid-Chromatography and Fourier-Transform Tandem Mass Spectrometry. Foods 2021, 10, 2050. [Google Scholar] [CrossRef] [Scilit] [PubMed]
- Olmo-García, L.; Bajoub, A.; Benlamaalam, S.; Hurtado-Fernández, E.; Bagur-González, M.G.; Chigr, M.; Mbarki, M.; Fernández-Gutiérrez, A.; Carrasco-Pancorbo, A. Establishing the Phenolic Composition of Olea europaea L. Leaves from Cultivars Grown in Morocco as a Crucial Step Towards Their Subsequent Exploitation. Molecules 2018, 23, 2524. [Google Scholar] [CrossRef] [Scilit] [PubMed]
- Clodoveo, M.L.; Crupi, P.; Annunziato, A.; Corbo, F. Innovative Extraction Technologies for Development of Functional Ingredients Based on Polyphenols from Olive Leaves. Foods 2022, 11, 103. [Google Scholar] [CrossRef] [Scilit] [PubMed]
- Romero, C.; Brenes, M. Analysis of Total Contents of Hydroxytyrosol and Tyrosol in Olive Oils. J. Agric. Food Chem. 2012, 60, 9017–9022. [Google Scholar] [CrossRef] [Scilit] [PubMed]
- Tsimidou, M.Z.; Nenadis, N.; Mastralexi, A.; Servili, M.; Butinar, B.; Vichi, S.; Winkelmann, O.; García-González, D.L.; Toschi, T.G. Toward a Harmonized and Standardized Protocol for the Determination of Total Hydroxytyrosol and Tyrosol Content in Virgin Olive Oil (VOO). The Pros of a Fit for the Purpose Ultra High Performance Liquid Chromatography (UHPLC) Procedure. Molecules 2019, 24, 2429. [Google Scholar] [CrossRef] [Scilit] [PubMed]
- Tsimidou, M.Z.; Sotiroglou, M.; Mastralexi, A.; Nenadis, N.; García-González, D.L.; Gallina Toschi, T. In House Validated UHPLC Protocol for the Determination of the Total Hydroxytyrosol and Tyrosol Content in Virgin Olive Oil Fit for the Purpose of the Health Claim Introduced by the EC Regulation 432/2012 for “Olive Oil Polyphenols”. Molecules 2019, 24, 1044. [Google Scholar] [CrossRef] [Scilit] [PubMed]
- Purcaro, G.; Codony, R.; Pizzale, L.; Mariani, C.; Conte, L. Evaluation of total hydroxytyrosol and tyrosol in extra virgin olive oils. Eur. J. Lipid Sci. Technol. 2014, 116, 805–811. [Google Scholar] [CrossRef] [Scilit]
- EFSA Panel on Dietetic Products, Nutrition and Allergies (NDA). Scientific Opinion on the substantiation of health claims related to polyphenols in olive and protection of LDL particles from oxidative damage (ID 1333, 1638, 1639, 1696, 2865), maintenance of normal blood HDL cholesterol concentrations (ID 1639), maintenance of normal blood pressure (ID 3781), “anti-inflammatory properties” (ID 1882), “contributes to the upper respiratory tract health” (ID 3468), “can help to maintain a normal function of gastrointestinal tract” (3779), and “contributes to body defences against external agents” (ID 3467) pursuant to Article 13(1) of Regulation (EC) No 1924/2006. EFSA J. 2011, 9, 2033. [Google Scholar] [CrossRef] [Scilit] [PubMed]
- Lozano-Castellón, J.; López-Yerena, A.; Olmo-Cunillera, A.; Jáuregui, O.; Pérez, M.; Lamuela-Raventós, R.M.; Vallverdú-Queralt, A. Total Analysis of the Major Secoiridoids in Extra Virgin Olive Oil: Validation of an UHPLC-ESI-MS/MS Method. Antioxidants 2021, 10, 540. [Google Scholar] [CrossRef] [Scilit] [PubMed]
- Sánchez de Medina, V.; Miho, H.; Melliou, E.; Magiatis, P.; Priego-Capote, F.; Luque de Castro, M.D. Quantitative method for determination of oleocanthal and oleacein in virgin olive oils by liquid chromatography–tandem mass spectrometry. Talanta 2017, 162, 24–31. [Google Scholar] [CrossRef] [Scilit] [PubMed]
- Martins, V.F.; Ribeiro, T.B.; Lopes, A.I.; Pintado, M.E.; Morais, R.M.; Morais, A.M. Comparison among Different Green Extraction Methods of Polyphenolic Compounds from Exhausted Olive Oil Pomace and the Bioactivity of the Extracts. Molecules 2024, 29, 1935. [Google Scholar] [CrossRef] [Scilit] [PubMed]
- Horwitz, W. AOAC Guidelines for Single Laboratory Validation of Chemical Methods for Dietary Supplements and Botanicals. 2023. Available online: https://s27415.pcdn.co/wp-content/uploads/2020/01/64ER20-7/Validation_Methods/d-AOAC_Guidelines_For_Single_Laboratory_Validation_Dietary_Supplements_and_Botanicals.pdf (accessed on 8 December 2025).
- Borman, P.; Elder, D. Q2 (R1) Validation of Analytical Procedures: Text and Methodology. In ICH Quality Guidelines; Wiley: Hoboken, NJ, USA, 2006. [Google Scholar]
- Skoog, D.A.; Holler, F.J.; Crouch, S.R. Principles of Instrumental Analysis, 7th ed.; Cengage Learning: Boston, MA, USA, 2018. [Google Scholar]

Disclaimer/Publisher’s Note: The statements, opinions and data contained in all publications are solely those of the individual author(s) and contributor(s) and not of MDPI and/or the editor(s). MDPI and/or the editor(s) disclaim responsibility for any injury to people or property resulting from any ideas, methods, instructions or products referred to in the content. |
© 2026 by the authors. Licensee MDPI, Basel, Switzerland. This article is an open access article distributed under the terms and conditions of the Creative Commons Attribution (CC BY) license.