


Abstract
Traditional herbal medicine has been an important source of therapeutic agents to treat various diseases since long ago and the genus Artemisia is drawing a lot of attention owing to its diversity of biologically active secondary metabolites. In the present study, our team focused on Artemisia albida Willd., which was collected in the Almaty region of Kazakhstan. Using various chromatographic techniques, 15 compounds were obtained. Their structures were elucidated by HRESIMS, NMR, and ECD, revealing a new-skeleton sesquiterpenoid, Albiterpene A (1), together with one known sesquiterpene, one lignan, one fatty acid ester, and 11 phenolic compounds. The absolute configuration of Albiterpene A was determined by the TDDFT ECD calculation. Meanwhile, the inhibitory and radical-scavenging activities of the isolated compounds were evaluated using α-glucosidase, PTP1B, BNA and DPPH assays. Among all tested compounds, arteanoflavone exhibited the most potent α-glucosidase (IC50 = 3.2 ± 0.07 μM) and PTP1B (IC50 = 6.8 ± 0.14 μM) inhibition and strong DPPH radical-scavenging activity (IC50 = 1.5 ± 0.03 μM), outperforming the positive controls DNJ and Trolox. Molecular docking was employed to elucidate the possible binding modes of arteanoflavone, chlorogenic acid, and caffeic acid ethyl ester against PTP1B (1NNY) and human α-glucosidase (2QMJ). The docking scores suggested a consistent binding affinity ranking across both targets: chlorogenic acid > arteanoflavone > caffeic acid ethyl ester.
1. Introduction
Artemisia L. is a genus of small herbs and shrubs found in northern temperate regions. It belongs to the important family Compositae (Asteraceae), one of the most numerous plant groupings, which comprises about 1000 genera and over 20,000 species. Within this family, Artemisia is included in the tribe Anthemideae and comprises over 500 species, which are mainly found in Asia, Europe and North America [1]. The Artemisia genus has a wide area of usage in different fields, including pharmaceutics, landscape architecture and agriculture [2,3].
Kazakhstan, located in the heart of Central Asia, boasts rich medicinal plant resources. These plants are a valuable source of a wide range of secondary metabolites, which serve as key ingredients for pharmaceuticals, agrochemicals, flavors, fragrances, colors, biopesticides, and food additives. Consequently, medicinal plants continue to receive significant research attention due to their proven pharmacological effects, including antioxidant, antidiabetic, antitumor, anti-inflammatory, and antibacterial properties. These therapeutic benefits are attributed to the diverse bioactive secondary metabolites present in the plants, such as flavonoids, triterpenoids, steroids, alkaloids, saponins, proteins, and amino acids.
Although Artemisia species from Kazakhstan are a promising source of bioactive substances, they have not been investigated thoroughly. In our previous work, we aimed to identify potential active candidates, which encouraged us to analyze the protein tyrosine phosphatase 1B (PTP1B), α-glucosidase, and bacterial neuraminidase (BNA) inhibitory potentials, as well as the antioxidant activities, of nine Artemisia plant extracts—most of which are endemic and have not yet had their secondary metabolites and bioactivities explored [4]. Among all tested species, A. albida, A. albicerata, A. transiliensis, A. nitrosa and A. scopaeformis showed high potential for α-glucosidase, PTP1B, and BNA inhibition.
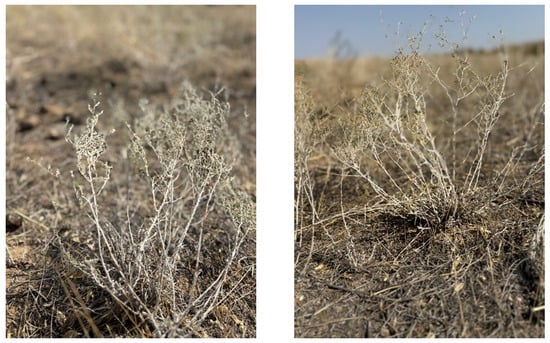
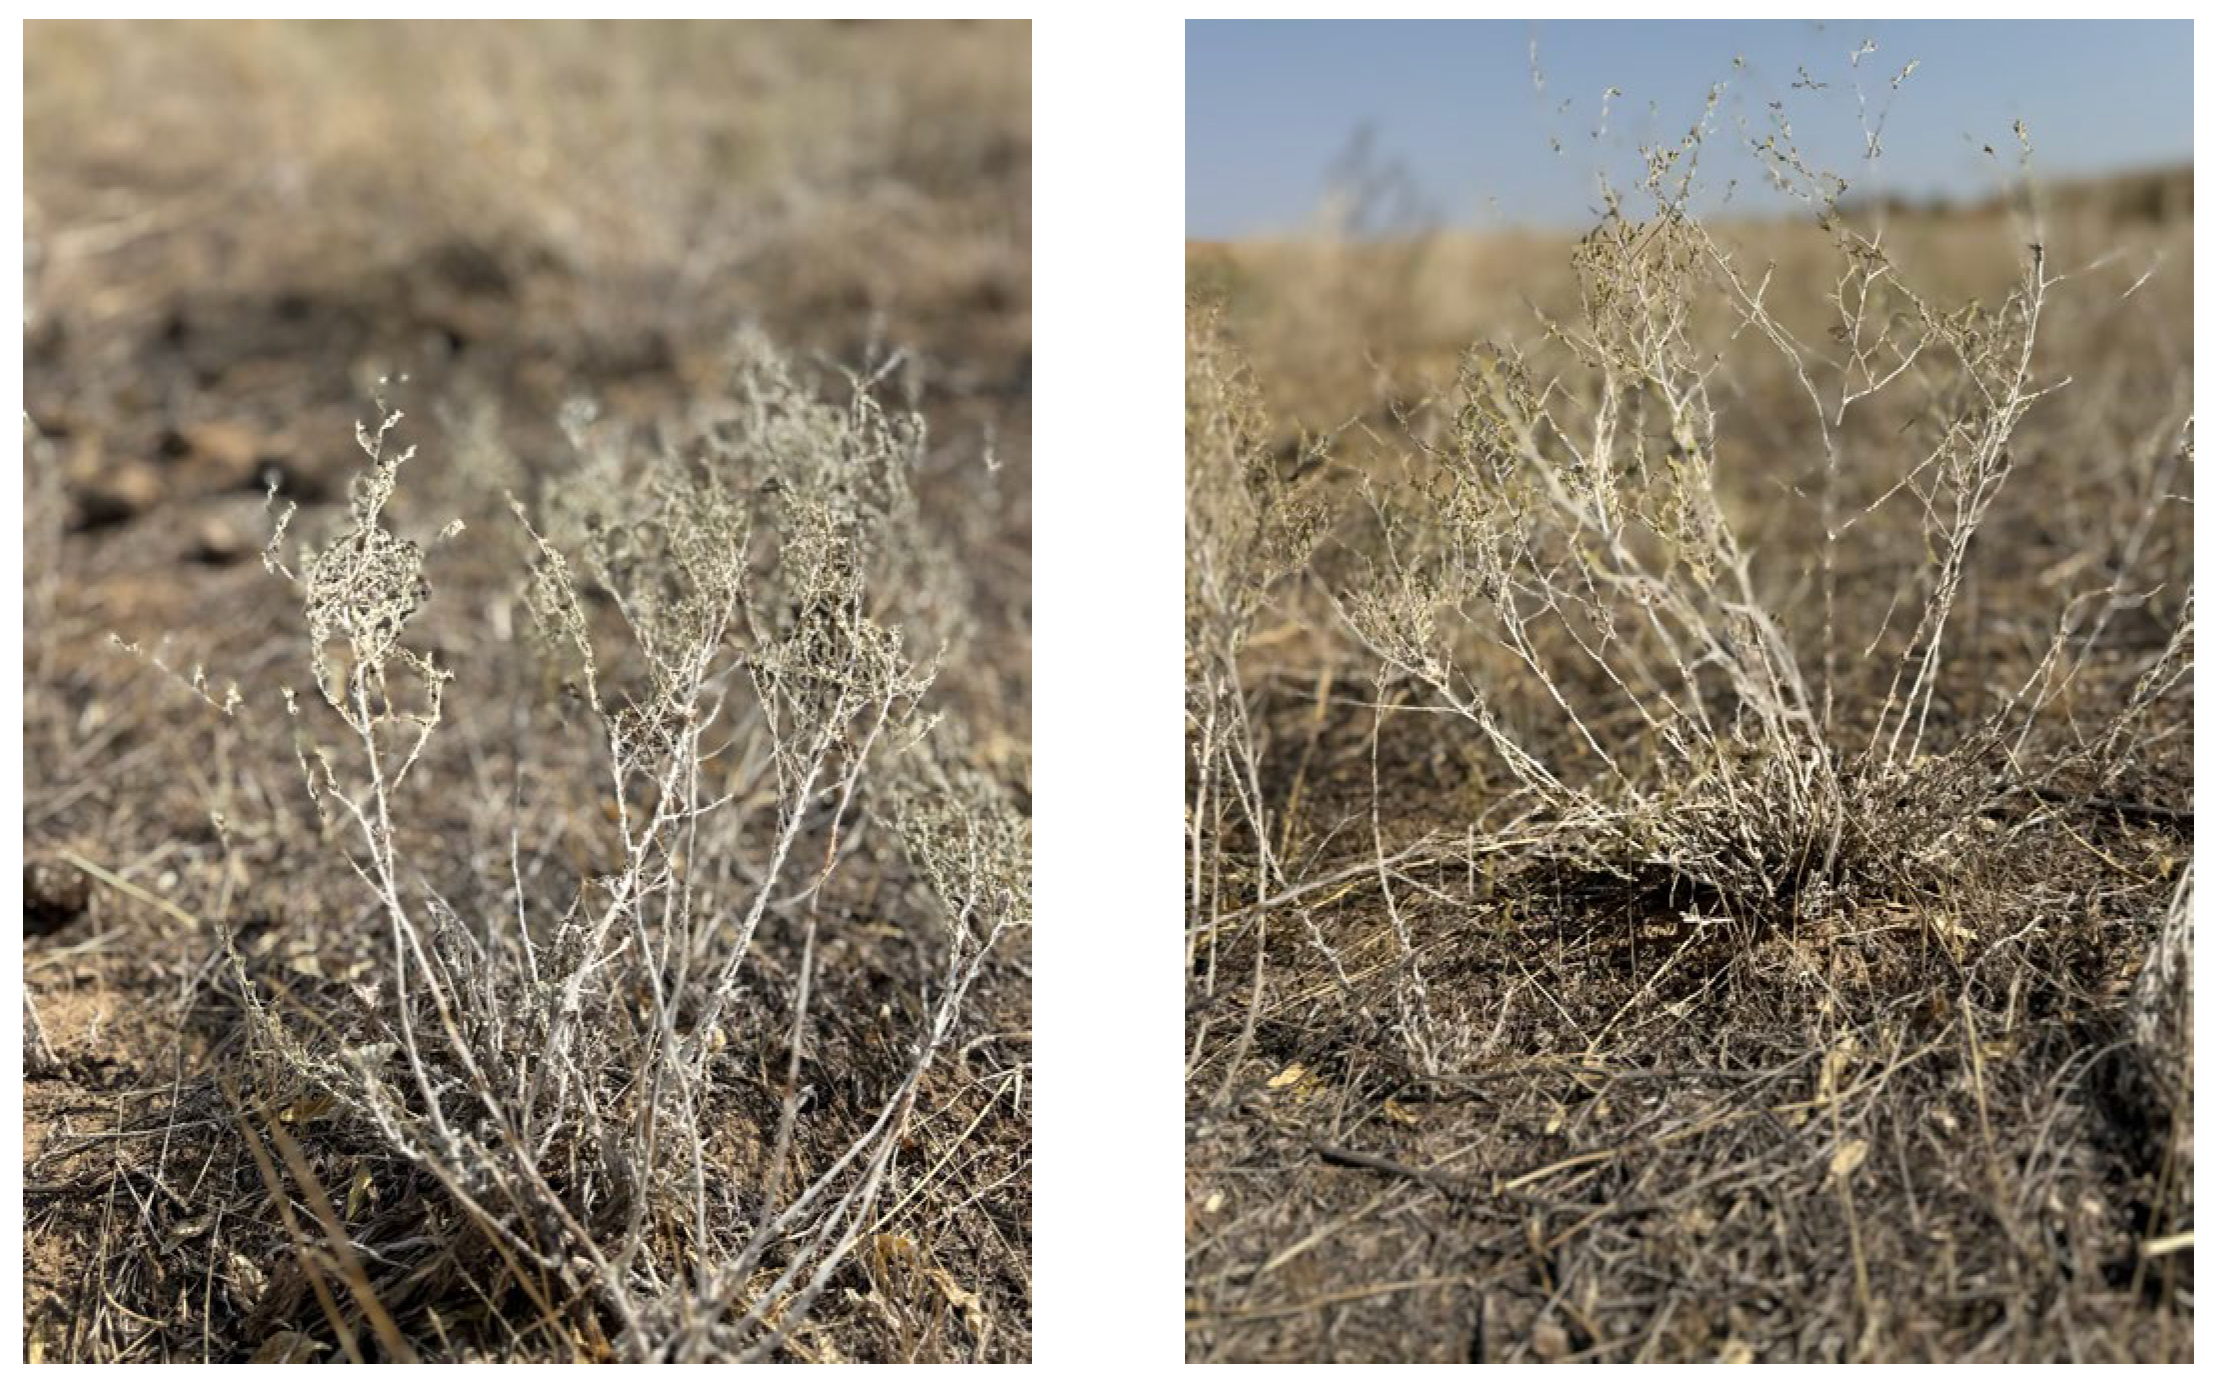
Artemisia albida Willd., a semi-white wormwood (Figure 1) native to several regions of Kazakhstan, including Almaty, Altai, Tarbagatai, Zaysan, and Akmola [4], is a perennial plant growing in the mountains. The species is chemically rich, containing lignans, triterpenes, sesquiterpenes, alkaloids, and steroids, and therefore has considerable research potential that warrants comprehensive study. From 2005 to 2008, A. albida Willd., collected from the Ivanovsky ridge (Altai) in East Kazakhstan, was first studied by S. M. Adekenov and E. M. Suleimenov, who isolated eupatilin and its 5′-methyl ether, the sesquiterpene lactones austricin, matricarin, canin, and argolide, anhydroaustricin, and two eupatilin-derived flavonoids, including its 7-O-methyl ether, from the aerial part of A. albida [5,6]. In addition, qualitative and quantitative analyses were carried out for the first time to determine moisture, total ash, organic acids, flavonoids, and coumarins in the whole plant, together with a quantitative assessment of the total content of biologically active components [4,7,8].
Figure 1.
Artemisia albida Willd. species in its natural habitat (Almaty region, Kazakhstan). Photograph taken by Janar Jenis in end of September 2023.
Pharmacologically, the plant extract contains substances reported to improve brain activity, contractile function of the heart and skeletal muscles, nerve conduction and the action of many hormones that play an important role in nutrition, protein structure, metabolism, signal transmission, and hemostasis, as well as to enhance immunity and protect against the development of pancreatic and prostate cancer [3,4]. The MeOH extract of A. albida Willd. showed a high potential to inhibit α-glucosidase (55.8%), PTP1B (85.5%) and BNA (95.5%), suggesting that the plant may contain bioactive candidates against diabetes, obesity, and bacterial infections [4]. However, despite this promising bioactivity profile, no systematic phytochemical investigation of A. albida in this context has been reported, and the constituents responsible for these effects remain unidentified.
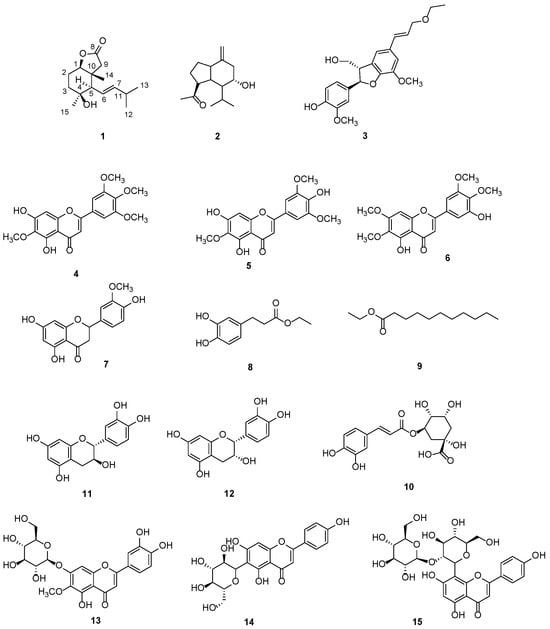
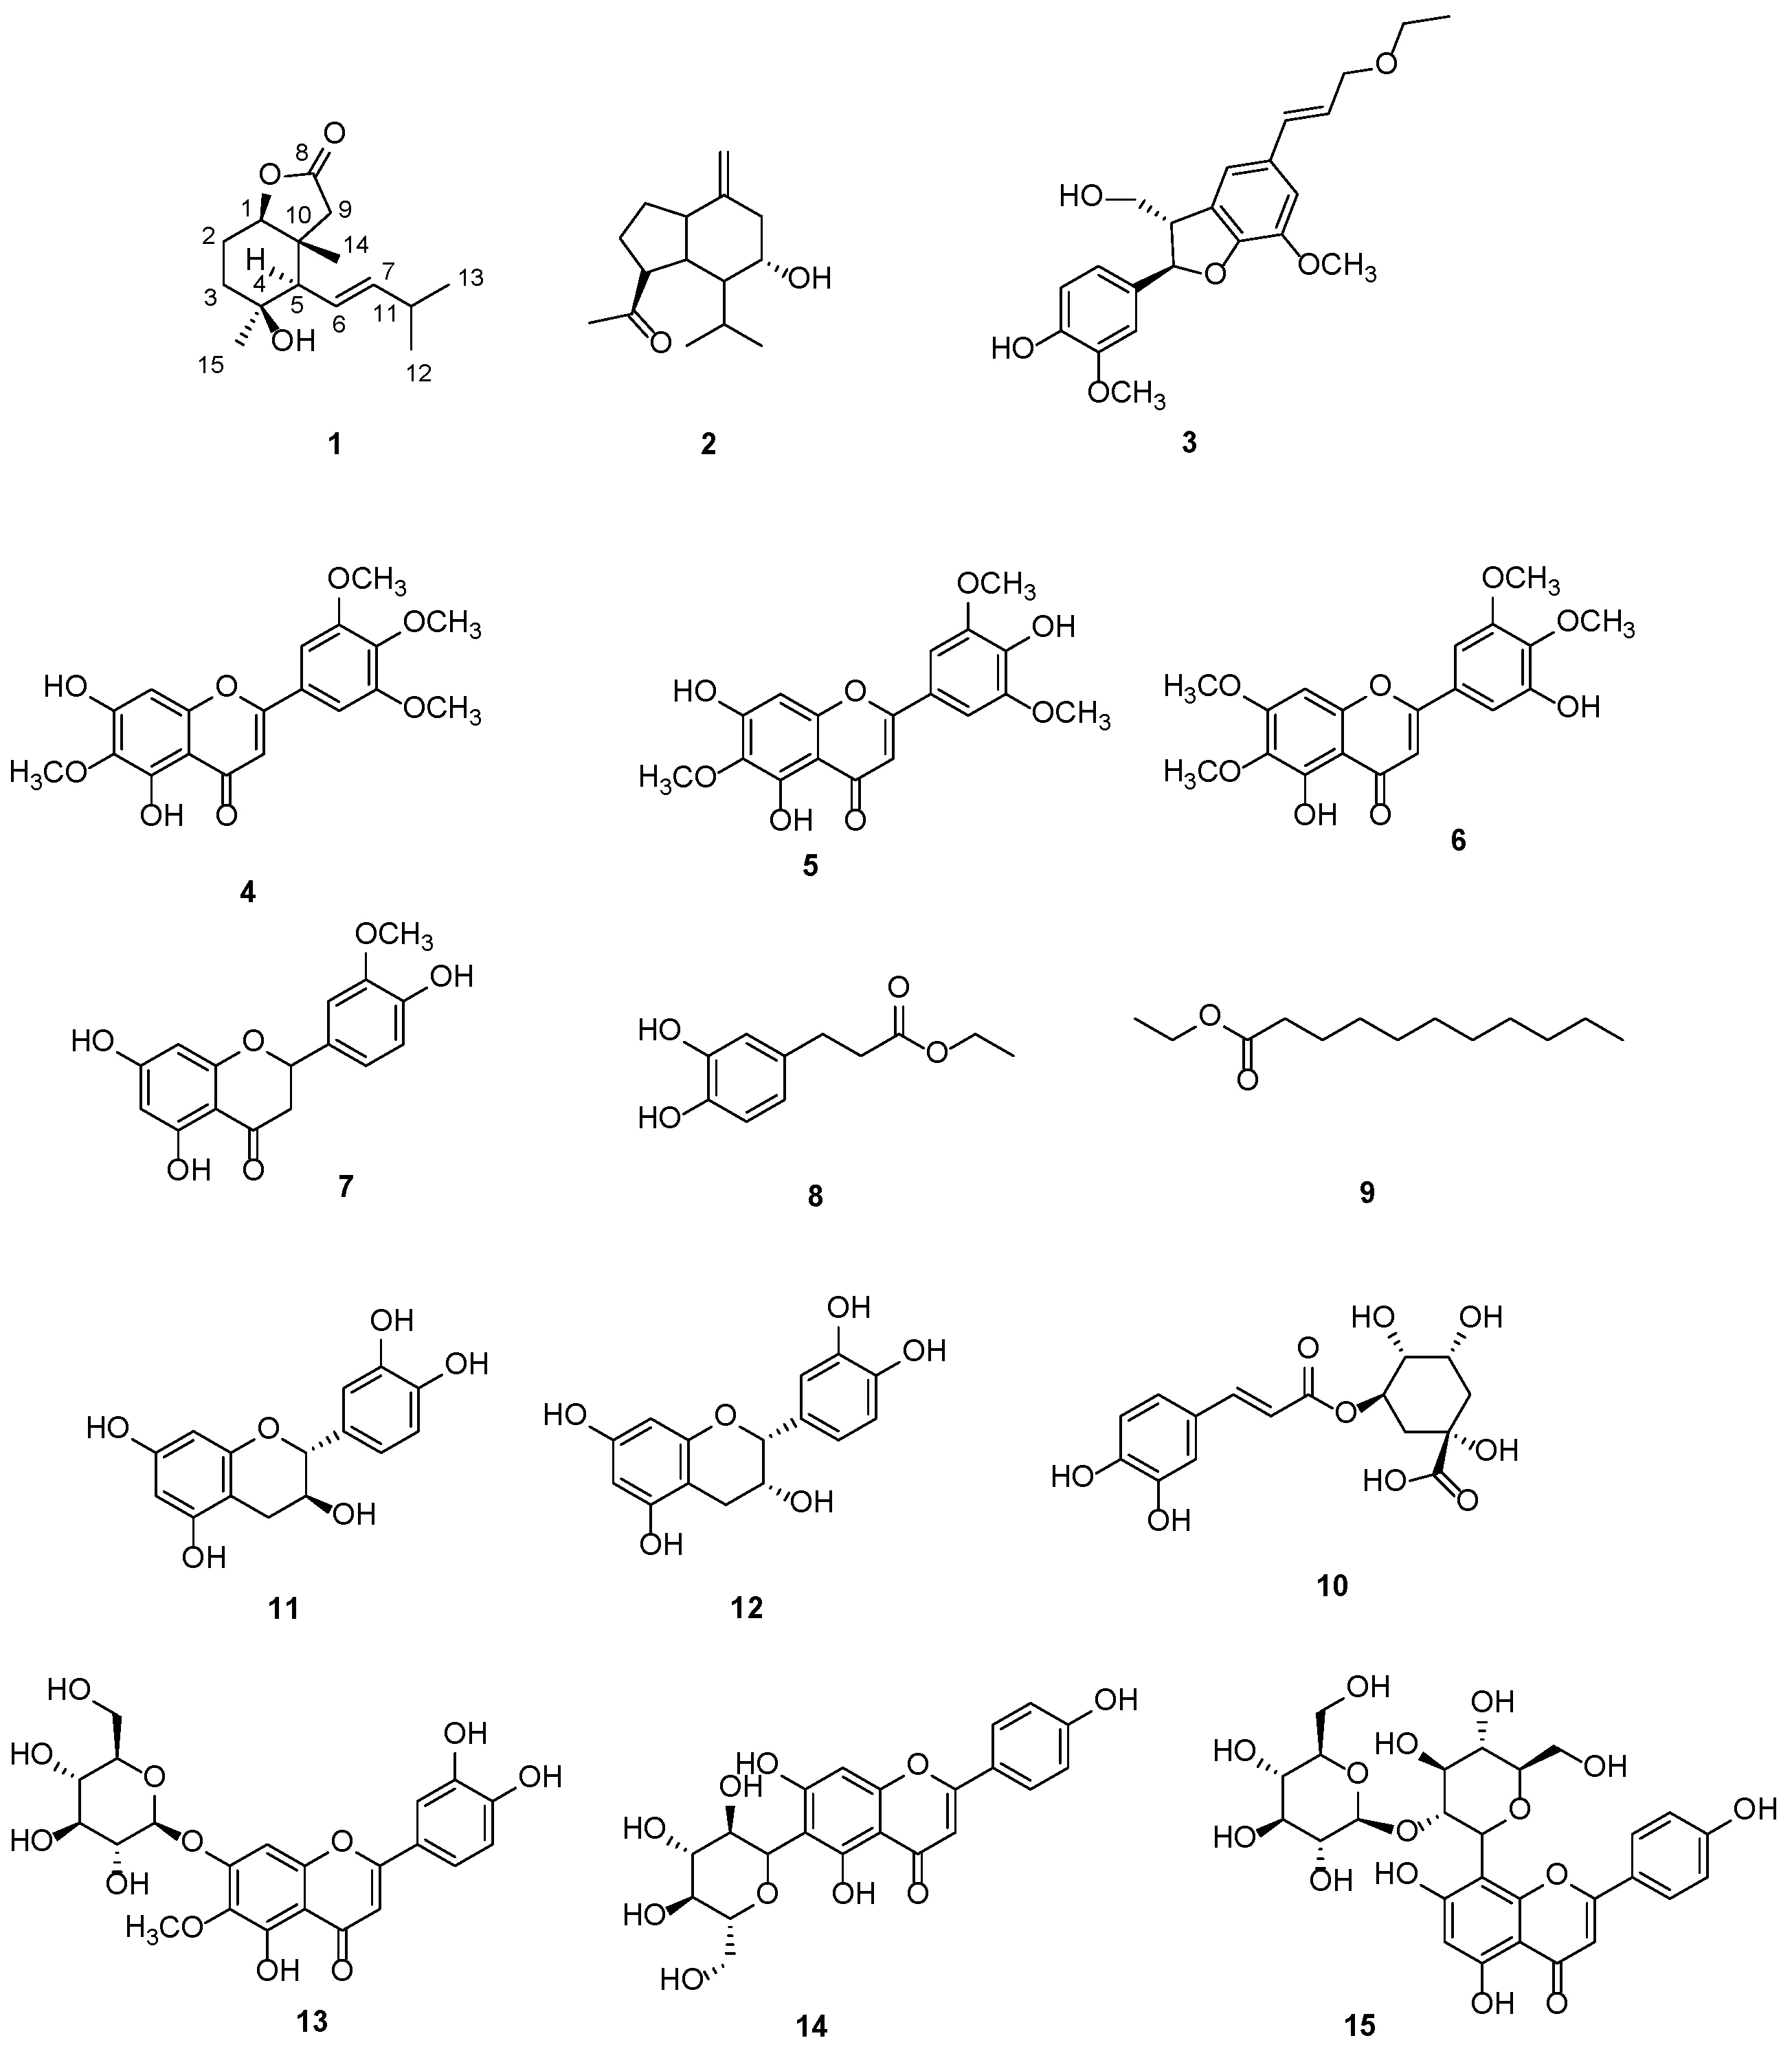
Therefore, our team focused on the chemical profiling of A. albida Willd., which was collected in the Almaty region of Kazakhstan, and on searching for its bioactivities. Using various chromatographic techniques—including AB-8 macroporous adsorption resin, D101 macroporous resin, Sephadex LH-20, Toyopearl HW-40F, silica gel column chromatography and semi-preparative HPLC—we isolated 15 compounds from the dichloromethane and butanol extracts. Their structures were elucidated by HRESIMS, NMR, ECD, and other methods, revealing two sesquiterpenes (1, 2) (including a new-skeleton sesquiterpenoid Albiterpene A (1)), one lignan (3), one fatty acid ester (8), and eleven phenolic compounds (4–7, 9–15) (Figure 2). All these isolates were identified from A. albida Willd. for the first time. Meanwhile, the bioactivity assays for the 15 compounds were carried out, followed by molecular docking analysis for selected compounds that showed significant activities against α-glucosidase, PTP1B, BNA and DPPH.
Figure 2.
Structures of compounds (1–15) from A. albida Willd.
2. Results and Discussion
2.1. Isolated Compounds from A. albida
Compound 1 was obtained as a colorless amorphous powder. The molecular formula was established as C15H24O3 by the HRESIMS data at 275.1618 [M+Na] (275.1623, calcd for C15H24O3Na), corresponding to four degrees of unsaturation. The 13C NMR spectrum displayed 15 carbon signals, in combination with its 24 protons in the 1H NMR data, suggesting a sesquiterpenoid framework (Table 1). The presence of one carbonyl carbon at δC 179.9 (C-8) and two olefinic carbons at δC 142.9 (C-7) and 124.2 (C-6), corresponding to a carbonyl group and one double bond, respectively, accounted for two degrees of unsaturation. The remaining two suggested the existence of a bicyclic system, which was further supported by its 2D NMR data.
Table 1.
1H and 13C NMR data for compound 1 in CD3OD (600 MHz for 1H NMR and 150 MHz for 13C NMR).
The 1H NMR spectrum of compound 1 displayed two downfield signals at δH 5.66 (1H, ddd, J = 15.4, 9.5, 1.2 Hz, H-6) and 5.52 (1H, dd, J = 15.4, 6.7 Hz, H-7). The large vicinal coupling constant (15.4 Hz) clearly defined an E-configured double bond. An oxymethine proton J at δH 4.01 (1H, dd, J = 12.5, 3.4 Hz, H-1) showed a direct HSQC correlation to an oxygen-bearing carbon at δC 88.6 (C-1). Another oxygenated carbon at δC 72.4 (C-4) displayed no direct correlation in the HSQC spectrum, indicating that it was a non-protonated tertiary carbon. Four methyl resonances were evident at δH 1.01 (3H, d, J = 6.8 Hz), 1.02 (3H, d, J = 6.8 Hz), 1.10 (3H, s), and 1.17 (3H, d, J = 1.2 Hz), which correlated in the HSQC spectrum with carbons at δC 23.2, 23.1, 30.7, and 14.9, respectively.
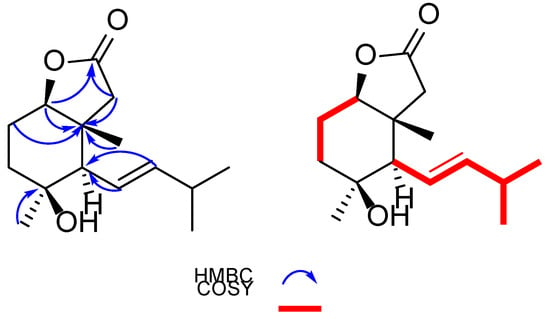
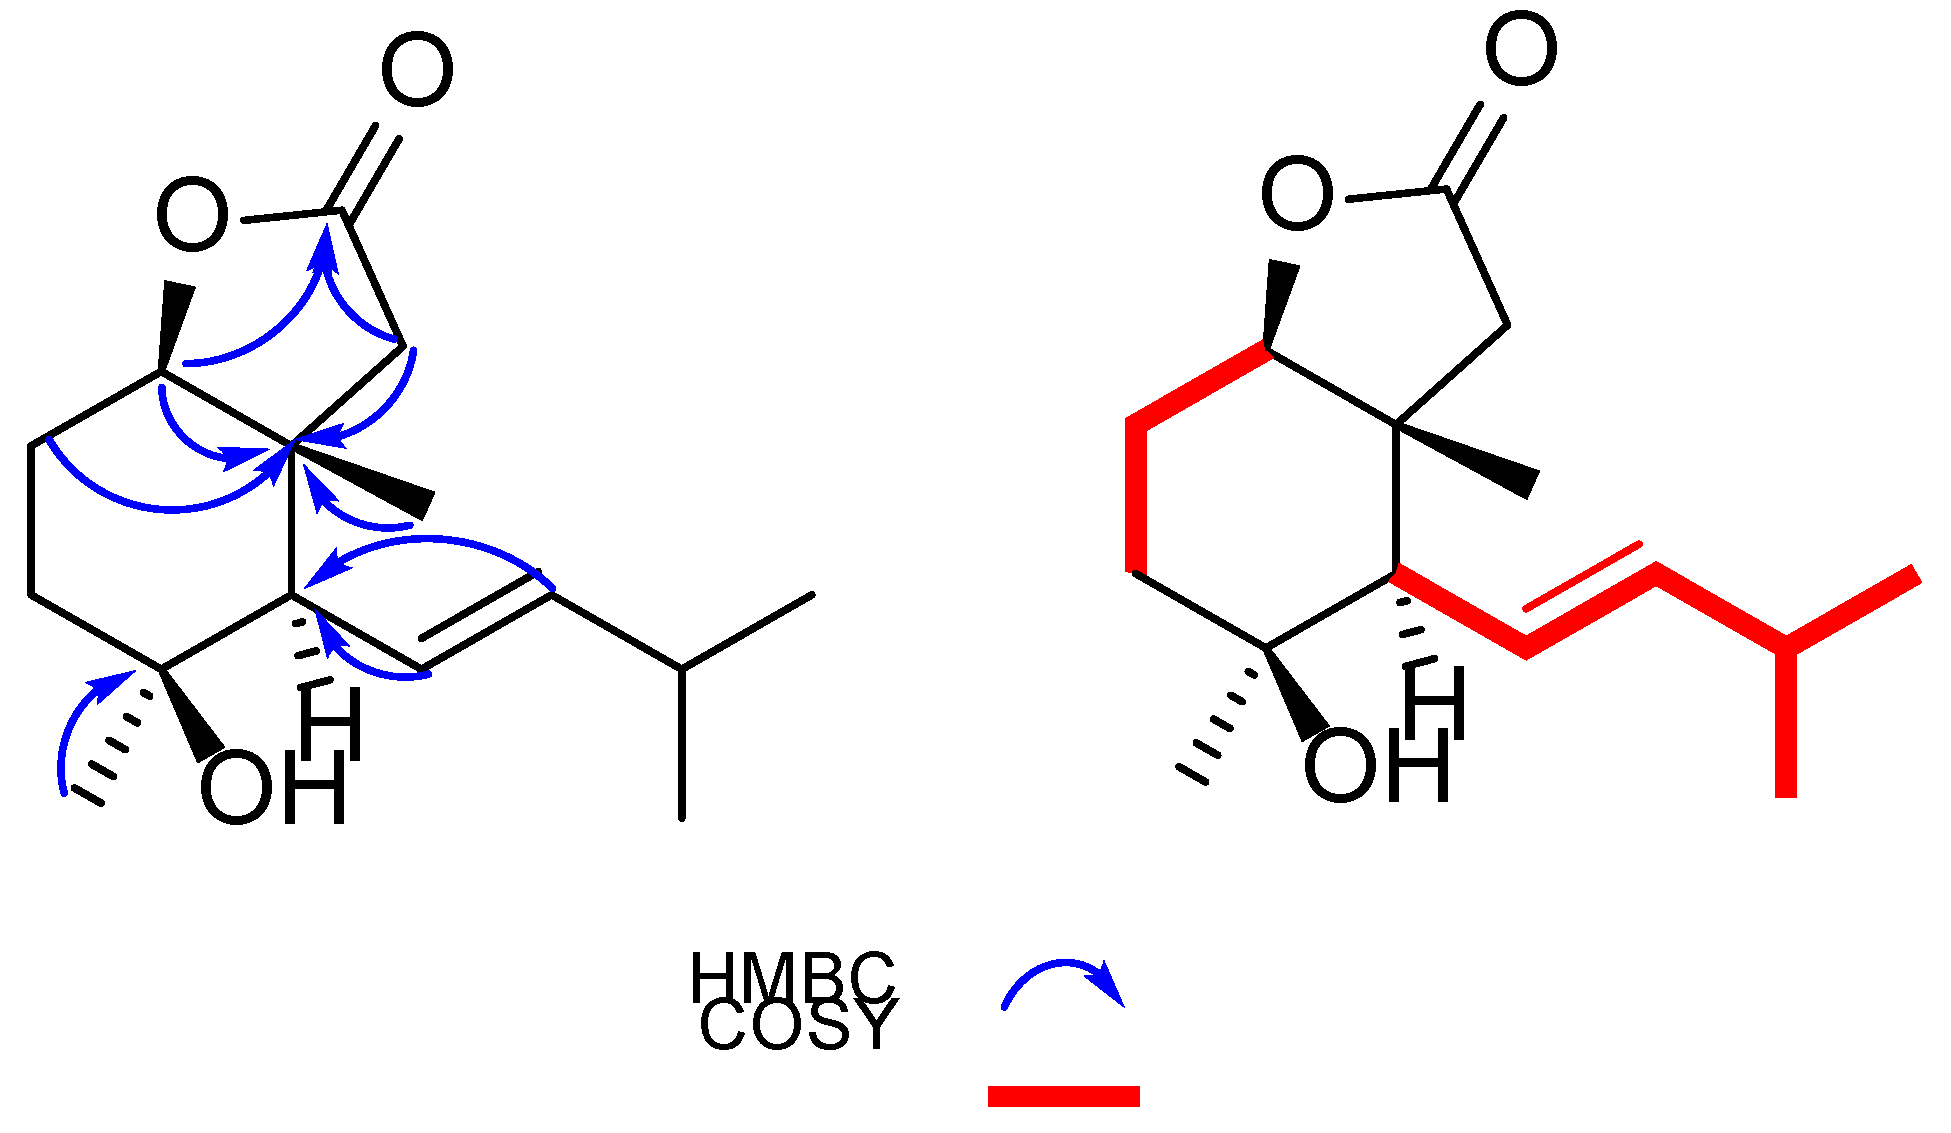
The γ-lactone ring and the fused cyclohexane skeleton were assembled from HMBC correlations in conjunction with the NMR features reported for the related dimethylcyclohexane-fused γ-lactones [9] and sesquiterpenoids from A. annua [10]. The oxymethine proton H-1 (δH 4.01) and the methylene protons H2-9 (δH 2.00 and 2.38) showed key HMBC correlations to the carbonyl carbon C-8 (δC 179.9), and both also correlated to the quaternary carbon C-10 (δC 46.5). These correlations indicated that C-1, C-8, C-9, and C-10, together with an oxygen atom, constituted a five-membered γ-lactone ring, in which C-1 and C-10 served as the bridgehead carbons fused to a cyclohexane ring. The cyclohexane ring was constructed from the HMBC correlations from H-1 to C-3 (δC 39.9), C-5 (δC 57.5), and C-14 (δC 14.9), from H2-2 (δH 1.86) to C-4, and from H-5 (δH 2.01) to C-3, C-14, and C-15 (δC 30.7), together with the 1H–1H COSY correlation of H2-2 and H2-3. The attachments of the two methyls were clearly assigned to C-10 and C-4 by HMBC correlations from Me-14 (δH 1.17; δC 14.9) to C-10, and from Me-15 (δH 1.10; δC 30.7) to C-4.
The alkenyl side chain was established by comprehensive 1H–1H COSY and HMBC analyses. In the 1H–1H COSY spectrum, H-7 showed a cross-peak with the methine proton at δH 2.32 (H-11), which in turn coupled with the two methyl doublets at δH 1.02 (Me-12) and 1.01 (Me-13), respectively. These continuous correlations, from H-6 to H-7, and then to H-11 and Me-12/Me-13, established a continuous spin system (H-6/H-7/H-11/H-12(13)), defining an aliphatic chain extending from the double bond to a terminal isopropyl group. HMBC correlations from the methine proton H-11 (δH 2.32) to C-12 and C-13 confirmed the attachment of the two methyl groups to C-11. Meanwhile, HMBC correlations from Me-12 and Me-13 to C-11 (δC 32.7) and to C-7 (δC 142.9) supported the isopropyl terminus located at C-7. Consequently, an E-3-methylbut-1-enyl side chain was defined in the molecule.
The attachment of this alkenyl side chain to the core ring was deduced from the critical HMBC correlations both from H-6 to C-4, C-10, and C-11, and from H-5 to C-7. These correlations unambiguously placed the side chain directly at the C-5 of the cyclohexane ring. The overall side-chain pattern is closely comparable to the side chain of seriphiloid [11], although it was established here independently from the 1H–1H COSY and HMBC data (Figure 3).
Figure 3.
1H-1H COSY ((right), red bold lines) and selected HMBC correlations ((left), blue arrows) for compound 1.
The relative configuration of compound 1 was deduced from its coupling constants and the NOESY experiment. The oxymethine proton H-1 (δH 4.01) appeared as a double doublet with a large coupling constant of 12.5 Hz and a smaller one of 3.4 Hz. According to the Karplus equation, the large vicinal coupling (12.5 Hz) corresponds to an axial–axial coupling constant, indicating that H-1 adopts an axial orientation on the cyclohexane ring. This arrangement implied that the lactone oxygen substituent on C-1 is equatorially oriented, which is entirely consistent with a trans-fused 9-oxabicyclo [4.3.0]nonane framework. At the same time, the NOESY experiment showed that cross-peaks of H-1/H-3a, H-3a/H3-15, H-1/H-5, and H-6/H3-14 were clearly observed, indicating that H-1/H-5/H3-15 were on the same face while H-6/H3-14 were on the other. Accordingly, the relative configuration of 1 was proposed as 1R*,4S*,5R*,10R*.
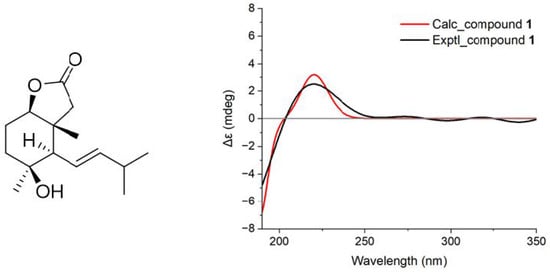
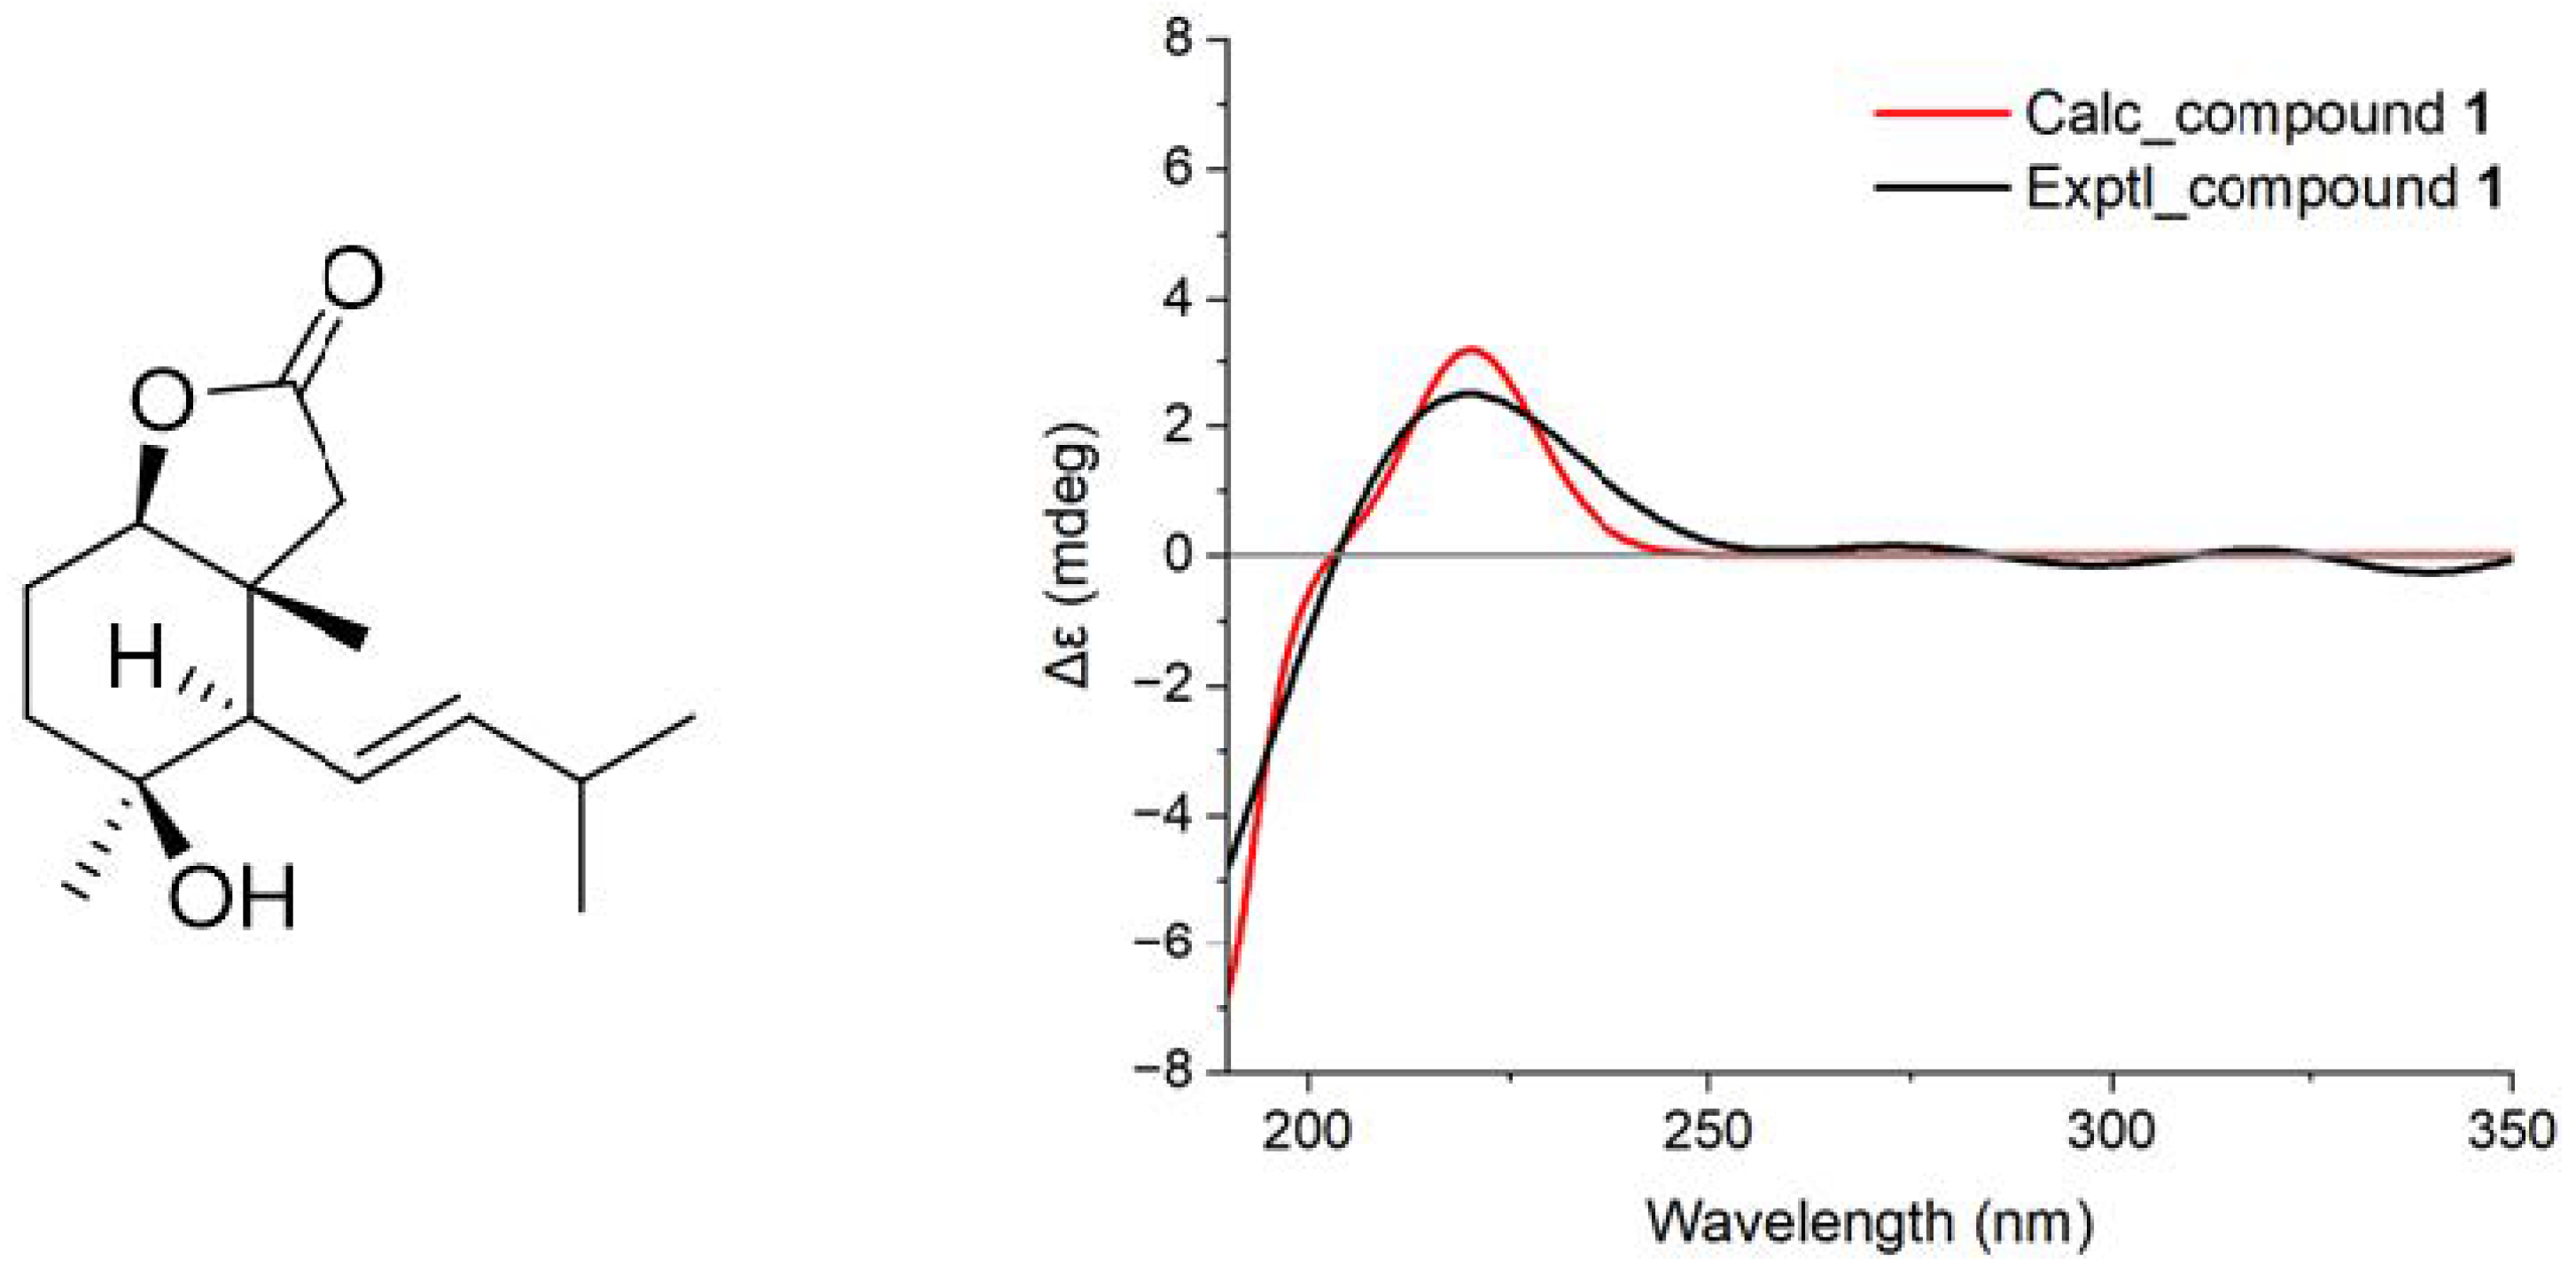
The absolute configuration of compound 1 was further determined by the TDDFT ECD calculation. The calculated ECD spectrum for the candidate conformation of compound 1 had a good agreement with that of the experimental curve, both showing a positive Cotton effect around 220 nm (Figure 4). Thus, the absolute configuration of 1 was determined as 1R,4S,5R,10R. Eventually, the whole structure of 1 was established, and the compound was named Albiterpene A.
Figure 4.
Comparison of the experimental (black) and calculated (red) ECD curves (right) and the candidate conformation (left) of compound 1.
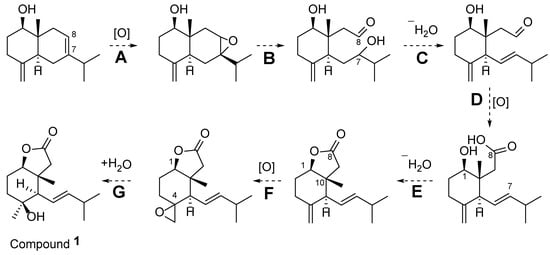
Albiterpene A (1) presumably arises from oxidative processing of an eudesmane-type sesquiterpene, without the need for skeletal rearrangement (Scheme 1). A plausible co-occurring eudesmane precursor is proposed to undergo epoxidation of the Δ7,8 double bond (step A), followed by oxidative cleavage of the C-7–C-8 bond to open ring B (step B), affording a 7,8-seco hydroxy aldehyde; subsequent dehydration (step C) and further oxidation of the aldehyde (step D) would generate the corresponding Δ6,7 carboxylic acid. Intramolecular esterification between the C-8 carboxyl group and the C-1 hydroxy group (step E) then constructs the γ-lactone ring fused across the C-1/C-10 junction, thereby establishing the unusual 6/5-fused bicyclic skeleton. Finally, epoxidation of the exocyclic Δ4(14) double bond (step F), followed by ring opening of the resulting spiro epoxide (a net hydration, step G), installs the tertiary C-4 hydroxy group to furnish Albiterpene A (1).
Scheme 1.
Proposed biosynthetic pathway of compound 1.
In addition, 14 known compounds were identified as 6α-hydroxyanhydrooplopanone (2) [12], (−)-(7R,8S,7′E)-4-Hydroxy-3,5′-dimethoxy-7,4′-epoxy-8,3′-neolign-7′-ene-9,9′-diol 9′-ethyl ether (3) [13], arteanoflavone (4) [14], 5,7,4′-tri-hydroxy-6,3′,5′-trimethoxyflavone (5) [15], 5,3′-dihydroxy-6,7,4′,5′-trimethoxyflavanone (6) [16], homoeriodictyol (7) [17], caffeic acid ethyl ester (8) [18], ethyl tridecanoate (9) [19], chlorogenic acid (10) [20], (+)-catechin (11) [21], epicatechin (12) [22], nepitrin (13) [23], isovitexin (14) [24], and vitexin-2′′-O-β-D-glucopyranoside (15) [25] by comparison of their NMR data with those in the literature (Figures S1–S42, Supplementary Materials).
2.2. The Inhibitory Potential of Isolated Constituents from A. albida Willd.
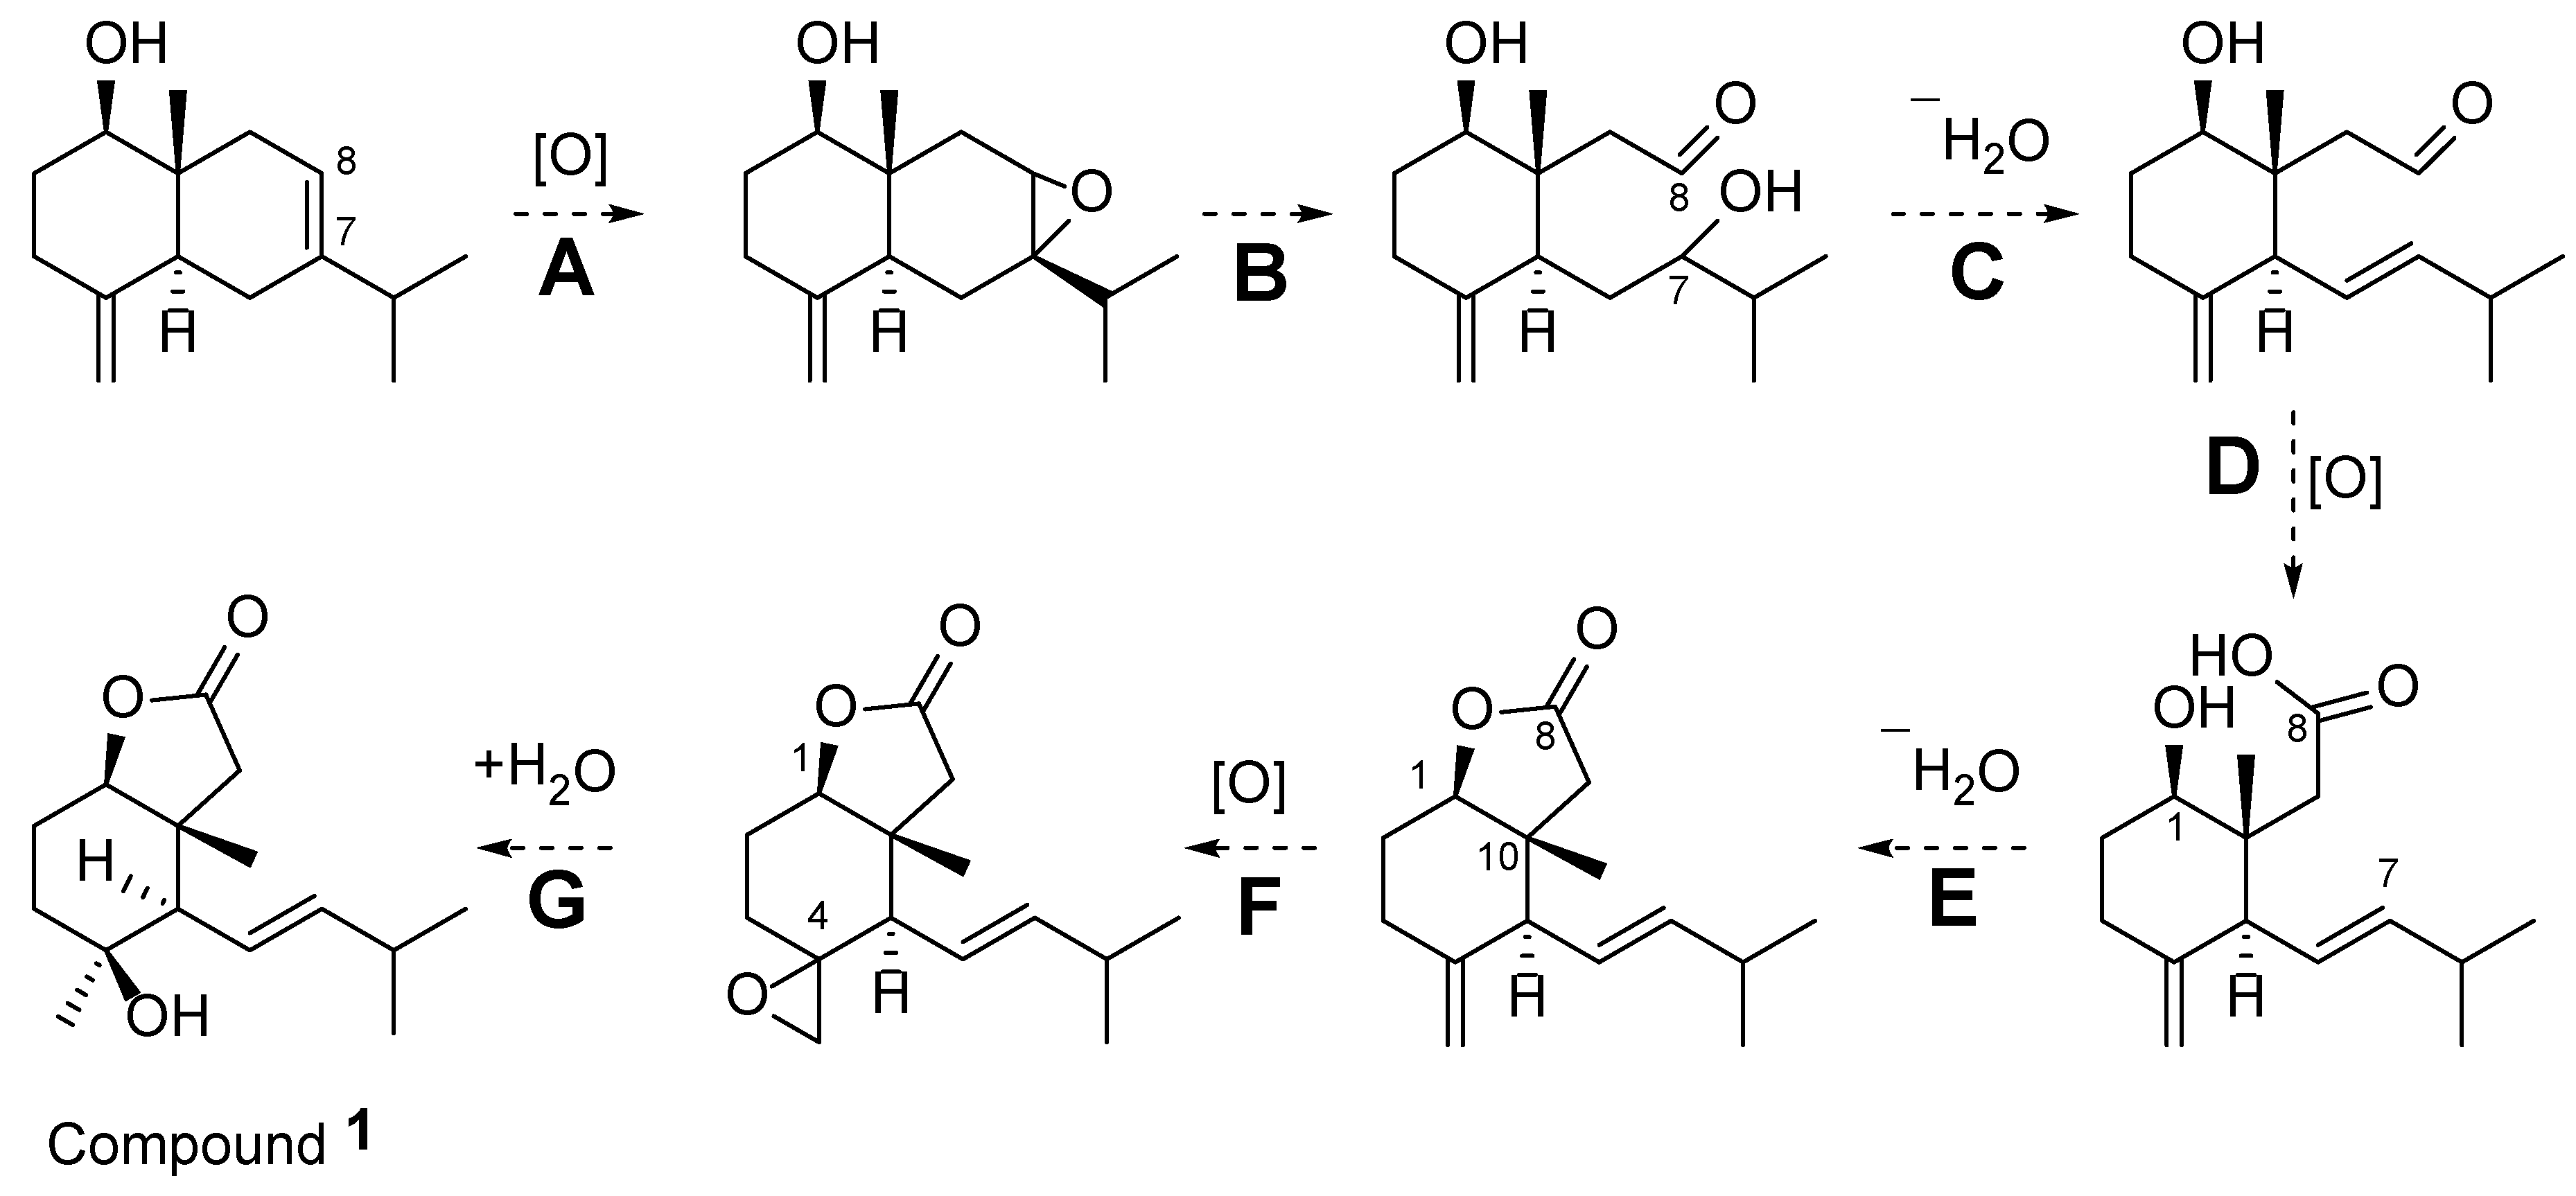
The inhibitory and radical-scavenging activities of the isolated and reference compounds were evaluated using α-glucosidase, PTP1B, BNA, and DPPH assays, and the IC50 values are summarized in Table 2.
Table 2.
Activity profile of isolated compounds from A. albida Willd.
Among all tested compounds, arteanoflavone exhibited the most potent α-glucosidase (IC50 = 3.2 ± 0.07 μM) and PTP1B (IC50 = 6.8 ± 0.14 μM) inhibition and strong DPPH radical-scavenging activity (IC50 = 1.5 ± 0.03 μM), outperforming the positive controls DNJ and Trolox (Figure 5). Notable dual inhibition of both α-glucosidase and PTP1B was also observed for caffeic acid ethyl ester and chlorogenic acid, consistent with the presence of catechol-type hydroxyl groups that enhance electron donation and enzyme binding through hydrogen bonding. Catechin and epicatechin demonstrated comparable multi-target activities, reflecting their well-known antioxidant and antidiabetic potential linked to the flavan-3-ol skeleton.
Figure 5.
Protein Tyrosine Phosphatase 1B, α-glucosidase, bacterial neuraminidase inhibition and antioxidant potentials for 15 compounds from A. albida Willd.
The newly identified sesquiterpenoid-type compound albiterpene A and 6-α hydroxy anhydrooplopanone showed moderate α-glucosidase (IC50 = 24.7 ± 0.5 and 35.6 ± 0.7 μM) and PTP1B (IC50 = 28.0 ± 0.6 and 54.3 ± 1.1 μM) inhibition, respectively, suggesting that the presence of hydroxyl and carbonyl moieties may contribute to enzyme interaction. However, their DPPH scavenging effects were relatively weak (IC50 = 12.4 ± 0.2 and 22.4 ± 0.5 μM), indicating limited electron-donating capacity compared with polyphenolic standards. Among the glycosides, vitexin-2″-O-β-D-glucopyranoside exhibited weak-to-moderate activities, possibly due to steric hindrance caused by bulky sugar moieties reducing enzyme accessibility.
Overall, flavonoid- and phenolic-type compounds demonstrated the strongest correlation between antioxidant and antidiabetic properties, emphasizing the pivotal role of hydroxylation and conjugation patterns in their bioactivity. The observed structure–activity trends indicate that polyhydroxylated and methoxylated flavonoids, as well as phenolic acids, contribute significantly to the dual inhibitory and antioxidant potential of Artemisia-derived metabolites.
Molecular docking was employed to elucidate the possible binding modes of arteanoflavone, chlorogenic acid, and caffeic acid ethyl ester against PTP1B (1NNY) and human α-glucosidase (2QMJ). The Vina docking scores (Table 3) revealed a consistent binding affinity ranking across both targets: chlorogenic acid > arteanoflavone > caffeic acid ethyl ester.
Table 3.
Vina docking scores of test compounds against PTP1B (1NNY) and human α-glucosidase (2QMJ).
It should be noted that this docking ranking does not parallel the experimental IC50 ranking (arteanoflavone > caffeic acid ethyl ester > chlorogenic acid). Moreover, the in vitro α-glucosidase assays were performed with the yeast enzyme, whereas 2QMJ is the N-terminal subunit of human maltase–glucoamylase. These discrepancies may arise from scoring-function limitations and species/construct differences, and the docking results should therefore be interpreted with caution.
Against PTP1B (1NNY), chlorogenic acid exhibited the strongest binding (−7.56 kcal/mol), forming eight hydrogen bonds with key residues including Arg221, Asp181, Asp48, Gln262, Gln266, Gly183, Pro180, and Trp179. Its carboxylate moiety established salt bridges with Arg221 (4.24 Å) and Lys116. Arteanoflavone (−6.46 kcal/mol) interacted with Arg221, Asp48, and Gln266 via hydrogen bonds and displayed a face-to-face π-π stacking interaction with Tyr46 (3.75 Å, dihedral angle 13.5°). Caffeic acid ethyl ester (−5.73 kcal/mol) formed hydrogen bonds with Ala217, Gln266, Gly183, Gly220, Ser216, and Trp179, while its catechol ring participated in a cation-π interaction with Arg221 (4.09 Å), stabilized by hydrophobic packing involving Ala217, Ile219, Arg221, and Gln262 (Figure S43A–C, Supplementary Materials).
Against human α-glucosidase (2QMJ), chlorogenic acid again demonstrated the highest affinity (−7.70 kcal/mol), forming hydrogen bonds with Arg526, Asp203, Asp443, and Asp542. It engaged in π-π stacking interactions with Phe575 and Tyr299. Arteanoflavone (−6.80 kcal/mol) formed hydrogen bonds with Arg526, Asp203, Asp327, Asp443, and Asp542, alongside T-shaped π-π stacking with Trp406 (4.92 Å) and Phe575 (5.07 Å), complemented by hydrophobic packing with Tyr299. Caffeic acid ethyl ester (−6.17 kcal/mol) established hydrogen bonds with Arg526, Asp443, and Asp542, with its binding predominantly driven by hydrophobic/π contacts involving Tyr299, Phe575 (×2), Trp406, and Gln603, and π-π stacking with Tyr299 (Figure S43D–F, Supplementary Materials).
Collectively, the docking results indicate that chlorogenic acid achieves superior predicted binding through a high density of polar contacts and salt-bridge formation, whereas arteanoflavone relies more on π-π stacking and hydrophobic interactions, and caffeic acid ethyl ester, possessing fewer polar functional groups, exhibits comparatively weaker predicted affinity. It should be emphasized that docking scores reflect calculated binding energetics only; the stronger experimental activities of arteanoflavone suggest that factors beyond simple phenolic hydroxyl density govern target engagement in vitro. Moreover, it should be noted that the molecular docking protocol applied in this work was not further validated via redocking of the corresponding crystallographic native ligand to report the RMSD reference value. Therefore, all docking poses, hydrogen bond interactions and binding mode analyses presented in this study should be inter-preted as reliable computational predictions under the current force field parameters, rather than experimentally verified atomic-level binding profiles.
3. Materials and Methods
3.1. Plant Material Collection
Artemisia albida Willd. was chosen for the present investigation based on the results of previous investigations and the extensive literature review. The aerial parts of the plant were gathered during the flowering phase at the end of September 2023, in the Almaty region, Kazakhstan. The confirmation of the species was done with a morphological analysis, by comparison with authenticated herbarium specimens. The voucher specimen of A. albida Willd. (KAZNU-230901) was deposited at the Research Center for Medicinal Plants at Al-Farabi Kazakh National University in Almaty, Kazakhstan. The collected plant material was air dried in shade, away from direct sunlight, and cut into small pieces and ground using a laboratory mill. The investigated species was thoroughly examined in respect of its phytochemical profile, isolation of secondary metabolites and its biological activity.
3.2. Instruments and Chemicals
All solvents and reagents used in the extraction, fractionation, isolation and purification processes were either of analytical or chemically pure grade and were used as such, unless stated otherwise. The solvents used for extractions and fractions were dichloromethane, n-Butanol, 96% ethanol, petroleum ether and acetone. For isolation of the compounds, silica gel and ODS (octadecylsilane) (Qingdao Haiyang Chemical Co., Ltd., Qingdao, China) were used as stationary phases for column chromatography and AB-8 macroporous adsorption resin (Shanghai Hualing Resin Co., Ltd., Shanghai, China), Sephadex LH-20 (Pharmacia Biotech AB, Uppsala, Sweden), Toyopearl HW-40F (Tosoh Corporation, Tokyo, Japan) were used for the adsorption and purification by size-exclusion chromatography. Materials and solvents (Sigma-Aldrich, Steinheim, Germany) were suitable for phytochemical isolation and further chemical and biological analysis.
The enzymatic activity and radical scavenging assays were carried out using a SpectraMax M3 Multi-Mode Microplate Reader (Molecular Devices, San Hoze, CA, USA). The reagents used for the assays were purchased from Sigma-Aldrich (St. Louis, MO, USA), including α-Glucosidase (EC 3.2.1.20), bacterial neuraminidase (BNA; EC 3.2.1.18), 2,2-diphenyl-1-picrylhydrazyl (DPPH), 6-hydroxy-2,5,7,8-tetramethylchroman-2-carboxylic acid (Trolox), dimethyl sulfoxide (DMSO), and others. The recombinant human protein tyrosine phosphatase 1B (PTP1B; EC 3.1.3.48) was obtained from Enzo Life Sciences. All the reagents used were of analytical grade and were suitable for biochemical and spectrophotometric analyses.
3.3. Extraction and Isolation
The air-dried aerial parts of Artemisia albida Willd (5 kg) were ground into small pieces and extracted with 70% ethanol (30 L × 3, each for 7 days) at room temperature using maceration method. The combined extracts were concentrated with a rotary evaporator at 45 °C to afford the crude extract (500 g). The crude extract was suspended in distilled water and successively partitioned 5 times each with petroleum ether, dichloromethane and butanol. The dichloromethane (DCM) fraction (51.28 g) and n-Butanol fraction (183.6 g) were selected for further phytochemical investigation.
The DCM fraction (50 g) was subjected to chromatography on an AB-8 macroporous adsorption resin column. Ethanol solutions ranging from 10% to 96% were used as a solvent system to yield ten fractions by polarity of substances, designated A1–A10.
Fraction A5 (5.7 g) was further purified by column chromatography over Sephadex LH-20 using methanol as the mobile phase, affording nine subfractions (A–I). Subfractions C, D, and E were combined together and renamed Z according to results of LC-MS and TLC (3252 mg) and conducted through column with the adsorbent Toyopearl HW-40F chromatography resin, eluted with methanol, yielding four fractions (Z1–Z4). Fraction Z2 (1594 mg) was further purified by silica gel column chromatography using a petroleum ether–acetone (PE:AT) gradient (50:1 → 1:1, v/v) and preparative HPLC purification, affording compounds 1 (29.1 mg) and 2 (11.4 mg). Subfraction A5-F (185 mg) was separated on a Toyopearl HW-40F column using methanol as the eluent to produce four fractions (F1–F4). Fraction F4 was purified by preparative chromatography to afford compound 3 (54 mg). Subfraction A5-H (325 mg) was further purified on column with Toyopearl HW-40F resin and methanol, followed by preparative chromatography of fractions H2–H5 to yield seven fractions (H1–H7). Final purification afforded compounds 4 (11 mg), 5 (3 mg) and 6 (10 mg), while the remaining fractions contained mixtures of minor constituents. Subfraction A5-I (219 mg) was passed through a column with the adsorbent HW-40F and methanol to afford five fractions (I1–I5). Fraction I4 was purified with prep-HPLC and yielded compound 7 (2 mg). Subfractions A6+A7 (18.3 g) were passed through a column with the adsorbent Sephadex-LH20, using methanol as solvent. A total of 14 subfractions (LH1–LH14) were obtained, further LH7 subfraction passed through column with silica gel, and eluent—PE:AT gradient (50:1 → 1:1, v/v) to afford compound 8 (42 mg). Compounds 9 (8 mg) was isolated from subfraction B via preparative HPLC purification.
The n-butanol fraction (58 g) was subjected to D101 macroporous resin column chromatography eluted with a gradient of ethanol:water (10:90, 30:70, 50:50, 70:30, 90:10, 100:0, v/v) to give 5 fractions (Fr.1–Fr.5). Fr.2 (1.6 g) was subjected to flash separation chromatography using ODS column LiChroprep RP-18 with gradient elution (C2H5OH:H2O, 10:90—100:0, v/v), to give 6 subfractions (Fr.2.1–Fr.2.6). The obtained subfractions Fr.2.2–Fr.2.4 were separated by Sephadex LH-20 column chromatography using ethanol:water (9:1, v/v) and ethanol as eluents, respectively. Subfraction Fr.2.1 yielded compound 10 (3 mg) through purification via semi-preparative HPLC (ACN:H2O, 19:81, v/v). From subfraction Fr.2.2, compounds 11 (12 mg) and 12 (9 mg) were obtained by semi-preparative HPLC (ACN:H2O, 17:73, v/v). Subfraction Fr.2.3 was purified by semi-preparative HPLC (ACN:H2O, 15:85, v/v) to afford compounds 13 (7 mg) and 14 (10 mg). Compound 15 (7 mg) was obtained by semi-preparative HPLC (ACN:H2O, 16:84, v/v) from subfraction Fr.2.4.
3.4. Compound Identification
The structures of the isolated monomeric compounds were determined by a combination of LC-MS spectrometry and nuclear magnetic resonance (NMR) spectroscopy. The obtained data of the spectrum were matched with those reported in the literature for known compounds to ensure the reliable identification and structural assignments of the isolated constituents.
3.5. Computational Section
The TDDFT ECD calculations were performed using the Gaussian 16 program [26]. The conformational searching was conducted by the Conflex 8.0 software using the MMFF force field within an energy window of 5.0 kcal/mol [27]. The conformers with the Boltzmann population above 0.1% were re-optimized at the M06-2X/6-31G(d) level with the SMD solvent model for methanol. TDDFT ECD calculations were run at the CAM-B3LYP/TZVP level with the SMD solvent model for methanol. ECD spectra were generated using the SpecDis Version 1.71 with 0.3 sigma/gamma (eV) [28,29].
3.6. Enzyme Activity Assays
3.6.1. α-Glucosidase Inhibitory Activity Assay
The α-glucosidase (EC 3.2.1.20) inhibitory activity was evaluated using a previously published method, with slight modifications [30]. The substrate used in the assay was p-nitrophenyl-α-D-glucopyranoside (p-NPG) which was dissolved in 50 mM phosphate buffer at pH 6.8, the optimum pH for enzyme activity. Test samples were dissolved in DMSO and diluted to the desired concentrations (300, 100, 30, 10, 3, 1, 0.3, and 0.1 μM) for analysis, as was the reference inhibitor, deoxynojirimycin (DNJ).
A volume of 10 μL of the sample or DNJ solution was added to each well of a 96-well microplate, followed by 40 μL of 1.0 mM p-NPG was added, and 130 μL of phosphate buffer was added. Then, 20 μL of α-glucosidase solution (0.1 U/mL) was added to start the reaction. Immediate monitoring of the release of p-nitrophenol was performed by taking absorbance measurements at 405 nm at 37 °C. To correct for background absorbance arising from the intrinsic absorbance of the tested compounds and non-enzymatic hydrolysis of p-NPG, a no-enzyme control was prepared for each compound by replacing the α-glucosidase solution with an equal volume of phosphate buffer while keeping all other reaction components identical. The absorbance of the no-enzyme control was subtracted from that of the corresponding enzyme-containing reaction before calculating the percentage inhibition. Each sample’s inhibitory activity was presented as the concentration needed to inhibit 50% of the enzyme activity (IC50). The percentage of enzyme inhibition was obtained from Equation (1).
3.6.2. Assay of PTP1B Inhibitory Activity
The inhibitory activity against protein tyrosine phosphatase 1B (PTP1B, EC 3.1.3.48) was evaluated according to a previously reported procedure but with minor modifications [31]. Recombinant human PTP1B was purchased from Enzo Life Sciences Inc. (Farmingdale, New York, NY, USA). Ursolic acid (Sigma-Aldrich, St. Louis, MO, USA), which is the standard PTP1B inhibitor, was also applied in the assay. Test samples and the reference inhibitor, ursolic acid, were first dissolved in DMSO and then diluted to the appropriate concentrations (300, 100, 30, 10, 3, 1, 0.3, and 0.1 μM).
The enzyme assay was carried out in Tris-HCl buffer (25 mM, pH 7.5) with 1 mM EDTA, 2 mM 2-mercaptoethanol, and 1 mM dithiothreitol (DTT). Hydrochloric acid was used to adjust the pH of the buffer. The reactions were performed in 96-well microplates by adding 130 μL of buffer, 10 μL of test sample, 40 μL of the substrate p-nitrophenyl phosphate (pNPP, 0.8 mM) and 20 μL of the PTP1B solution (1 μg/mL). The pNPP was spectrophotometrically measured at 405 nm during incubation at 37 °C for 30 min and peaks of absorbance were measured at 10 min intervals. Non-enzymatic hydrolysis of p-NPP and any background absorbance attributable to the tested compounds were corrected by measuring a no-enzyme control reaction for each compound, in which the PTP1B solution was replaced with an equal volume of Tris-HCl buffer while all other components (sample, substrate, and buffer) were retained. The absorbance of the no-enzyme control was subtracted from that of the corresponding complete reaction prior to data analysis.
Each compound was tested for inhibitory activity, which was expressed as the half-maximal inhibitory concentration (IC50), defined as the concentration needed to inhibit enzyme activity by 50%.
3.6.3. BNA Inhibition Assay
The anti-neuraminidase activity of the compounds was assessed using a modified version of the previously reported method [32], with adjustments to the assay conditions, including the substrate volume. The fluorogenic substrate 4-methylumbelliferyl-N-acetyl-α-D-neuraminic acid sodium salt hydrate was used and the reaction media used consisted of 50 mM sodium acetate buffer (pH 5.0).
The assay was carried out in black 96-well microplates (SPL Life Science, Pocheon, Republic of Korea). The sodium acetate buffer and the 1 mM substrate solution were each added at a volume of 160 μL per well. Later, 10 μL of the test inhibitor and 10 μL of the neuraminidase solution (0.2 U/mL) were added, thus starting the reaction. Fluorescence intensity was measured using the SpectraMax M3 Multi-Mode Microplate Reader at 37 °C with an excitation wavelength of 365 nm and an emission wavelength of 450 nm. To account for possible autofluorescence of the tested compounds and non-enzymatic hydrolysis of the fluorogenic substrate, a no-enzyme control was prepared for each compound by replacing the neuraminidase solution with an equal volume of sodium acetate buffer while maintaining all other reaction components unchanged. The fluorescence intensity of the no-enzyme control was subtracted from that of the corresponding complete reaction before calculating the percentage inhibition. Quercetin was used as the positive control and was assayed under the same conditions (300, 100, 30, 10, 3, 1, 0.3, and 0.1 μM). The inhibitory activity of tested compounds was represented by IC50 value, which is the concentration which causes 50% inhibition of the enzyme activity. The percentage inhibition was determined by using the Equation (1).
3.6.4. DPPH Radical Scavenging Activity
The DPPH Radical Scavenging Activity (RSA) method was performed as described below. DPPH free radical scavenging activity was measured as previously reported with some modifications for 96-well microplate analysis [33]. In short, 10 μL of each sample, dissolved in DMSO, was added to 190 μL of DPPH solution prepared in ethanol. All reactions were carried out at room temperature, in the dark, for 10 min. After the incubation, the absorbance was measured at 517 nm with a SpectraMax M3 Multi-Mode Microplate Reader (Molecular Devices, LLC, San Jose, CA, USA). The radical scavenging activity was expressed as the percentage inhibition as compared with the DMSO control (Equation (1)) and antioxidant capacity was further expressed as half-maximal inhibitory concentration (IC50) in μM. Sample-specific blanks, consisting of the extract and solvent without DPPH, were prepared to account for the intrinsic absorbance of the tested extracts at 517 nm. The absorbance of each sample blank was subtracted from that of the corresponding extract–DPPH mixture before calculating the percentage of DPPH radical inhibition. The reference antioxidant used was Trolox, which was tested at concentrations of 300, 100, 30, 10, 3, 1, 0.3, and 0.1 μM.
3.6.5. Statistical Analysis
All experiments were performed independently three times, each in triplicate. The percentage inhibition was calculated according to Equation (1), and the IC50 values were determined by nonlinear regression of the percentage inhibition against the logarithm of the compound concentration using a four-parameter logistic (sigmoidal dose–response with variable slope) model in GraphPad Prism (version 10, GraphPad Software, San Diego, CA, USA). The IC50 values are expressed as mean ± standard deviation (SD) of three independent experiments (n = 3). The goodness of fit (R2) was ≥0.98 for all fitted curves.
3.7. Molecular Docking Analysis
All ligands were prepared from PubChem, followed by energy minimization using the MMFF94 force field in Open Babel 3.1.1 to obtain their 3D structures for docking. The protein structures were retrieved from the RCSB Protein Data Bank (PDB). Missing atoms in the receptor were repaired using PDBFixer v2.5.0, hydrogen atoms were added at pH 7.4, and the native ligands were removed. Gasteiger charges were assigned using Open Babel 3.1.1 [34]. The grid boxes were centered on the possible native ligand binding site, with dimensions set to 60 Å × 60 Å × 60 Å and a spacing of 0.375 Å. Docking simulations were performed using AutoDock Vina 1.2.7 [35], with the exhaustiveness parameter set to 32 to ensure thorough sampling. For each ligand-protein complex, 10 conformations were generated. The conformation with the lowest binding free energy (Vina docking score) was selected for further analysis. 2D interaction diagrams and 3D visualizations were generated using LigPlot+ 2.3 and PyMOL 2.5.2 [36].
4. Conclusions
In this study, 15 compounds were isolated through the chromatographic separation of both dichloromethane and butanol extracts from A. albida Willd. Two sesquiterpenes, including the new-skeleton sesquiterpenoid Albiterpene A (1), together with one lignan, one fatty acid ester, and eleven phenolic compounds, were identified by spectroscopic and spectrometric analysis. Additionally, all 15 compounds were reported for the first time, expanding the knowledge of its phytochemical content and highlighting this species as a source of structurally diverse secondary metabolites. The PTP1B, α-glucosidase, and BNA inhibitory and antioxidant activities of all 15 isolates were evaluated for the first time. Absolute configuration of one new skeleton sesquiterpenoid Albiterpene A was determined by the TDDFT ECD calculation. Among all tested compounds, arteanoflavone exhibited the most potent α-glucosidase (IC50 = 3.2 ± 0.07 μM) and PTP1B (IC50 = 6.8 ± 0.14 μM) inhibition and strong DPPH radical-scavenging activity (IC50 = 1.5 ± 0.03 μM), outperforming the positive controls DNJ and Trolox. Notable dual inhibition of both α-glucosidase and PTP1B was also observed for caffeic acid ethyl ester and chlorogenic acid, consistent with the presence of catechol-type hydroxyl groups that enhance electron donation and enzyme binding through hydrogen bonding. Catechin and epicatechin demonstrated comparable multi-target activities, reflecting their well-known antioxidant and antidiabetic potential linked to the flavan-3-ol skeleton. The sesquiterpenoids albiterpene A and 6α-hydroxyanhydrooplopanone showed moderate α-glucosidase (IC50 = 24.7 ± 0.5 and 35.6 ± 0.7 μM) and PTP1B (IC50 = 28.0 ± 0.6 and 54.3 ± 1.1 μM) inhibition, respectively, suggesting that the presence of hydroxyl and carbonyl moieties may contribute to enzyme interaction. Collectively, the docking results indicate that chlorogenic acid achieves superior predicted binding through a high density of polar contacts and salt-bridge formation, whereas arteanoflavone relies more on π-π stacking and hydrophobic interactions, and caffeic acid ethyl ester, possessing fewer polar functional groups, exhibits comparatively weaker predicted affinity. It should be emphasized that docking scores reflect calculated binding energetics only; the stronger experimental activities of arteanoflavone suggest that factors beyond simple phenolic hydroxyl density govern target engagement in vitro. Overall, these findings highlight the phytochemical diversity and multitarget bioactivity of A. albida and warrant further in-depth exploration of this species.
Supplementary Materials
The following supporting information can be downloaded at: https://www.mdpi.com/article/10.3390/molecules31213975/s1. Figure S1. 1H NMR spectrum of compound 1 (600 MHz, CD3OD), Figure S2. 13C NMR spectrum of compound 1 (150 MHz, CD3OD), Figure S3. HSQC spectrum of compound 1 (600 MHz, CD3OD), Figure S4. HMBC spectrum of compound 1 (600 MHz, CD3OD), Figure S5. 1H-1H COSY spectrum of compound 1 (600 MHz, CD3OD), Figure S6. NOESY spectrum of compound 1 (600 MHz, CD3OD), Figure S7. Mass spectra of compound 1, Figure S8. HRMS EIC of compound 1, Figure S9. HRMS—[M+H-H2O] of compound 1, Figure S10. HRMS—[M+Na] of compound 1, Figure S11. 1H NMR spectrum of compound 2 (600 MHz, CD3OD), Figure S12. 13C NMR spectrum of compound 2 (150 MHz, CD3OD), Figure S13. HSQC spectrum of compound 2 (600 MHz, CD3OD), Figure S14. HMBC spectrum of compound 2 (600 MHz, CD3OD), Figure S15. 1H-1H COSY spectrum of compound 2 (600 MHz, CD3OD), Figure S16. NOESY spectrum of compound 2 (600 MHz, CD3OD), Figure S17. 1H NMR spectrum of compound 3 (600 MHz, CD3OD), Figure S18. 13C NMR spectrum of compound 3 (150 MHz, CD3OD), Figure S19. 1H NMR spectrum of compound 4 (600 MHz, CD3OD), Figure S20. 13C NMR spectrum of compound 4 (150 MHz, CD3OD), Figure S21. 1H NMR spectrum of compound 5 (600 MHz, CD3OD), Figure S22. 13C NMR spectrum of compound 5 (150 MHz, CD3OD), Figure S23. 1H NMR spectrum of compound 6 (600 MHz, CD3OD), Figure S24. 13C NMR spectrum of compound 6 (150 MHz, CD3OD), Figure S25. 1H NMR spectrum of compound 7 (600 MHz, CD3OD), Figure S26 13C NMR spectrum of compound 7 (150 MHz, CD3OD), Figure S27. 1H NMR spectrum of compound 8 (600 MHz, CD3OD), Figure S28. 13C NMR spectrum of compound 8 (150 MHz, CD3OD), Figure S29. 1H NMR spectrum of compound 9 (600 MHz, CD3OD), Figure S30. 13C NMR spectrum of compound 9 (150 MHz, CD3OD), Figure S31. 1H NMR spectrum of compound 10 (600 MHz, CD3OD), Figure S32. 13C NMR spectrum of compound 10 (150 MHz, CD3OD), Figure S33. 1H NMR spectrum of compound 11 (600 MHz, CD3OD), Figure S34. 13C NMR spectrum of compound 11 (150 MHz, CD3OD), Figure S35. 1H NMR spectrum of compound 12 (600 MHz, CD3OD), Figure S36. 13C NMR spectrum of compound 12 (150 MHz, CD3OD), Figure S37. 1H NMR spectrum of compound 13 (600 MHz, CD3OD), Figure S38. 13C NMR spectrum of compound 13 (150 MHz, CD3OD), Figure S39. 1H NMR spectrum of compound 14 (600 MHz, CD3OD), Figure S40. 13C NMR spectrum of compound 14 (150 MHz, CD3OD), Figure S41. 1H NMR spectrum of compound 15 (600 MHz, DMSO-d6), Figure S42. 13C NMR spectrum of compound 15 (150 MHz, DMSO-d6). Figure S43. Molecular docking poses of test compounds with (A–C) PTP1B (1NNY) and (D–F) human α glucosidase (2QMJ). (A,D) Arteanoflavone; (B,E) Chlorogenic acid; (C,F) Caffeic acid ethyl ester. Hydrogen bonds are depicted as dashed yellow lines; π-π stacking and cation-π interactions are indicated by green arrows. Key interacting residues are labeled. Table S1. Summary of conformers selected for re-optimization and their relative free energies and Boltzmann populations.
Author Contributions
Conceptualization, J.J., Y.Y. and H.A.A.; literature search, J.J. and A.M.; design and drawing of structures and figures, J.J. and X.S.; collecting plant materials, extraction and isolation compounds, J.J. and A.M.; structure elucidation of compounds, J.J. and C.K.; bioactivity testing and data analysis A.B.; molecular docking experiments, X.S.; NMR, ECD and HRMS experiments, C.K., C.T. and J.J.; writing—original draft preparation, J.J. and A.M.; writing—review and editing, J.J., C.T., H.A.A. and Y.Y. All authors have read and agreed to the published version of the manuscript.
Funding
This research was funded by Central Asia Center of Drug Discovery and Development of CAS, grant number CAM202404. We also thank the partial financial support from the National Key R&D Program of China, International Governmental S&T Innovation Cooperation Project (Grant No. 2024YFE0117200) released by the Ministry of Science and Technology of China.
Data Availability Statement
Data is contained within the article or Supplementary Materials.
Acknowledgments
The authors gratefully acknowledge the Lanzhou Institute of Husbandry and Pharmaceutical Sciences, Chinese Academy of Agricultural Sciences, Lanzhou, China, for providing scientific support and assistance during this study.
Conflicts of Interest
The authors declare no conflicts of interest.
Abbreviations
The following abbreviations are used in this manuscript:
| HRESIMS | High-Resolution Electrospray Ionization Mass Spectrometry |
| NMR | Nuclear Magnetic Resonance |
| ECD | Electronic Circular Dichroism |
| TDDFT | Time-Dependent Density Functional Theory |
| PTP1B | Protein tyrosine phosphatase 1B |
| BNA | Bacterial neuraminidase |
| DPPH | 2,2-Diphenyl-1-picrylhydrazyl |
| DNJ | 1-Deoxynojirimycin |
| MeOH | Methanol |
| HSQC | Heteronuclear Single Quantum Coherence |
| HMBC | Heteronuclear Multiple Bond Correlation |
| COESY | Correlated Spectroscopy |
| NOESY | Nuclear Overhauser Effect Spectroscopy |
| DMSO | Dimethyl Sulfoxide |
| DCM | Dichloromethane |
| LC-MS | Liquid Chromatography–Mass Spectrometry |
| TLC | Thin-Layer Chromatography |
| HPLC | High-Performance Liquid Chromatography |
| ODS | Octadecylsilane |
| ACN | Acetonitrile |
| EDTA | Ethylenediaminetetraacetic Acid |
| DTT | Dithiothreitol |
| RSA | Radical Scavenging Activity |
References
- Bora, K.S.; Sharma, A. The Genus Artemisia: A Comprehensive Review. Pharm. Biol. 2011, 49, 101–109. [Google Scholar] [CrossRef] [Scilit] [PubMed]
- Barney, J.N.; DiTommaso, A. The Biology of Canadian Weeds. 118. Artemisia vulgaris L. Can. J. Plant Sci. 2003, 83, 205–215. [Google Scholar] [CrossRef] [Scilit]
- Hayat, M.; Ashraf, M.; Khan, M.A.; Yasmin, G.; Shaheen, N.; Jabeen, S. Palynological Study of the Genus Artemisia (Asteraceae) and Its Systematic Implications. Pak. J. Bot. 2010, 42, 751–763. [Google Scholar]
- Nurlybekova, A.; Kudaibergen, A.; Kazymbetova, A.; Amangeldi, M.; Baiseitova, A.; Ospanov, M.; Aisa, H.A.; Ye, Y.; Ibrahim, M.A.; Jenis, J. Traditional Use, Phytochemical Profiles and Pharmacological Properties of Artemisia Genus from Central Asia. Molecules 2022, 27, 5128. [Google Scholar] [CrossRef] [Scilit] [PubMed]
- Suleimenov, E.M.; Smagulova, F.M.; Morozova, O.V.; Raldugin, V.A.; Bagryanskaya, I.Y.; Gatilov, Y.V.; Yamovoi, V.I.; Adekenov, S.M. Sesquiterpene Lactones and Flavonoids from Artemisia albida. Chem. Nat. Compd. 2005, 41, 689–691. [Google Scholar] [CrossRef] [Scilit]
- Suleimenov, E.M.; Raldugin, V.A.; Adekenov, S.M. Anhydroaustricin from Artemisia albida. Chem. Nat. Compd. 2008, 44, 541–542. [Google Scholar] [CrossRef] [Scilit]
- Jenis, J.; Minkayeva, A.; Yessimova, O.; Kumargaliyeva, S.; Shah, A.B.; Karunakaran, T.; Gulnur, K.; Aisa, H.A.; Baiseitova, A. Comparative Phytochemical, Colloidal, and Antioxidant Profiling of Artemisia albida, Artemisia leucodes, and Artemisia scopaeformis: Potentials for Cosmeceutical and Nutraceutical Applications. Molecules 2025, 30, 4165. [Google Scholar] [CrossRef] [Scilit] [PubMed]
- Suleimenov, E.M.; Tkachev, A.V.; Adekenov, S.M. Essential Oil from Kazakhstan Artemisia Species. Chem. Nat. Compd. 2010, 46, 135–139. [Google Scholar] [CrossRef] [Scilit]
- Gładkowski, W.; Grabarczyk, M.; Wińska, K.; Białońska, A.; Ciunik, Z.; Wawrzeńczyk, C. Lactones 27 [1]: Transformations of γ-Lactones Fused to a Dimethylcyclohexane Ring in Absidia cylindrospora Cultures. J. Mol. Catal. B Enzym. 2006, 39, 31–39. [Google Scholar] [CrossRef] [Scilit]
- Brown, G.D.; Liang, G.-Y.; Sy, L.-K. Terpenoids from the Seeds of Artemisia annua. Phytochemistry 2003, 64, 303–323. [Google Scholar] [CrossRef] [Scilit] [PubMed]
- Tousif, M.I.; Riaz, N.; Nazir, M.; Ahmad, S.; Saleem, M.; Jabbar, A.; Ashraf, M.; Tareen, R.B. Anti-Urease Secondary Metabolites from Seriphidium quettense. Rec. Nat. Prod. 2017, 11, 223–228. [Google Scholar]
- Marco, J.A.; Sanz-Cervera, J.F.; Sancenon, F.; Jakupovic, J.; Rustaiyant, A.; Mohamadit, F. Oplopanone Derivatives Monoterpene Glycosides from Artemisia Sieberi. Phytochemistry 1993, 34, 1061–1065. [Google Scholar] [CrossRef] [Scilit]
- Qiao, L.-R.; Yang, L.; Zou, J.-H.; Li, L.; Sun, H.; Si, Y.-K.; Zhang, D.; Chen, X.; Dai, J. Neolignans and Sesquiterpenes from Cell Cultures of Stellera chamaejasme. Planta Med. 2012, 78, 711–719. [Google Scholar] [CrossRef] [Scilit] [PubMed]
- Marco, J.A.; Barberá, O.; Rodríguez, S.; Domingo, C.; Adell, J. Flavonoids and Other Phenolics from Artemisia hispanica. Phytochemistry 1988, 27, 3155–3159. [Google Scholar] [CrossRef] [Scilit]
- Zhang, X.; Zhang, J.; Zhang, S.; Qian, Z.; Wu, S.; Liu, J.; Ye, Y.; Si, J. Chemical Fingerprint Analysis and Identification of Dendranthema lavandulifolium Buds. Ind. Crops Prod. 2018, 124, 707–718. [Google Scholar] [CrossRef] [Scilit]
- Abdallah, H.M.; Hassan, N.A.; El-Halawany, A.M.; Mohamed, G.A.; Safo, M.K.; El-Bassossy, H.M. Major Flavonoids from Psiadia punctulata Produce Vasodilation via Activation of Endothelial Dependent NO Signaling. J. Adv. Res. 2020, 24, 273–279. [Google Scholar] [CrossRef] [Scilit] [PubMed]
- Garo, E.; Maillard, M.; Antus, S.; Mavi, S.; Hostettmann, K. Five Flavans from Mariscus psilostachys. Phytochemistry 1996, 43, 1265–1269. [Google Scholar] [CrossRef] [Scilit]
- Dai, Z.; Wang, F.; Wang, G.-L.; Lin, R.-C. Studies on chemical constituents of Balanophora spicata. Zhongguo Zhong Yao Za Zhi 2006, 31, 1798–1800. [Google Scholar] [PubMed]
- Ma, Q.D.; Dong, Y.T.; Yi, S.R.; Zhang, H.J.; Chen, C.Y.; Wang, W.X.; Yi, D.Y. Isolation and Identification Chemical Components of the Petroleum Ether Extracted Part From the Rhizoma of Polygonatum kingianum var. Grandifolium. Guangdong Chem. Ind. 2024, 51, 177–180. [Google Scholar]
- Sano, K.; Sanada, S.; Ida, Y.; Shoji, J. Studies on the Constituents of the Bark of Kalopanax pictus NAKAI. Chem. Pharm. Bull. 1991, 39, 865–870. [Google Scholar] [CrossRef] [Scilit]
- Khalid, S.A.; Yagi, S.M.; Khristova, P.; Duddeck, H. (+)-Catechin-5-Galloyl Ester as a Novel Natural Polyphenol from the Bark of Acacia nilotica of Sudanese Origin1. Planta Med. 1989, 55, 556–558. [Google Scholar] [CrossRef] [Scilit] [PubMed]
- Hu, J.; Chen, J.; Zhao, Y.; Wang, R.; Zheng, Y.; Zhou, J. Chemical Constituents from Fruit Hulls of Garcinia mangostana (Cuttiferae). Acta Bot. Yunnanica 2006, 28, 319–322. [Google Scholar]
- Garayev, E.; Di Giorgio, C.; Herbette, G.; Mabrouki, F.; Chiffolleau, P.; Roux, D.; Sallanon, H.; Ollivier, E.; Elias, R.; Baghdikian, B. Bioassay-Guided Isolation and UHPLC-DAD-ESI-MS/MS Quantification of Potential Anti-Inflammatory Phenolic Compounds from Flowers of Inula montana L. J. Ethnopharmacol. 2018, 226, 176–184. [Google Scholar] [CrossRef] [Scilit] [PubMed]
- Fang, J.-J.; Ye, G. Flavonoids and Xanthones from Tripterospermum chinense. Chem. Nat. Compd. 2008, 44, 514–515. [Google Scholar] [CrossRef] [Scilit]
- Xu, F.-F.; Fan, C.-L.; Wang, L.; Wang, G.-C.; Zhang, X.-Q.; Ye, W.-C. Chemical Constituents from the Seeds of Hovenia acerba. J. Jinan Univ. Nat. Sci. Med. Ed. 2011, 32, 304. [Google Scholar]
- Frisch, M.J.; Trucks, G.W.; Schlegel, H.B.; Scuseria, G.E.; Robb, M.A.; Cheeseman, J.R.; Scalmani, G.; Barone, V.; Petersson, G.A.; Nakatsuji, H.; et al. Gaussian 16; Gaussian, Inc.: Wallingford, CT, USA, 2016. [Google Scholar]
- CONFLEX, version 8. [Computer Program]. CONFLEX Corporation: Tokyo, Japan, 2017.
- Pescitelli, G.; Bruhn, T. Good Computational Practice in the Assignment of Absolute Configurations by TDDFT Calculations of ECD Spectra. Chirality 2016, 28, 466–474. [Google Scholar] [CrossRef] [Scilit] [PubMed]
- Bruhn, T.; Schaumlöffel, A.; Hemberger, Y.; Bringmann, G. SpecDis: Quantifying the Comparison of Calculated and Experimental Electronic Circular Dichroism Spectra. Chirality 2013, 25, 243–249. [Google Scholar] [CrossRef] [Scilit] [PubMed]
- Jenis, J.; Baiseitova, A.; Yoon, S.H.; Park, C.; Kim, J.Y.; Li, Z.P.; Lee, K.W.; Park, K.H. Competitive α-Glucosidase Inhibitors, Dihydrobenzoxanthones, from the Barks of Artocarpus elasticus. J. Enzym. Inhib. Med. Chem. 2019, 34, 1623–1632. [Google Scholar] [CrossRef] [Scilit] [PubMed]
- Li, Z.P.; Song, Y.H.; Uddin, Z.; Wang, Y.; Park, K.H. Inhibition of Protein Tyrosine Phosphatase 1B (PTP1B) and α-Glucosidase by Xanthones from Cratoxylum cochinchinense, and Their Kinetic Characterization. Bioorg. Med. Chem. 2018, 26, 737–746. [Google Scholar] [CrossRef] [Scilit] [PubMed]
- Choi, H.M.; Kim, J.Y.; Li, Z.P.; Jenis, J.; Ban, Y.J.; Baiseitova, A.; Park, K.H. Effectiveness of Prenyl Group on Flavonoids from Epimedium koreanum Nakai on Bacterial Neuraminidase Inhibition. Molecules 2019, 24, 317. [Google Scholar] [CrossRef] [Scilit] [PubMed]
- Baiseitova, A.; Jenis, J.; Kim, J.Y.; Li, Z.P.; Park, K.H. Phytochemical Analysis of Aerial Part of Ikonnikovia kaufmanniana and Their Protection of DNA Damage. Nat. Prod. Res. 2021, 35, 880–883. [Google Scholar] [CrossRef] [Scilit] [PubMed]
- O’Boyle, N.M.; Banck, M.; James, C.A.; Morley, C.; Vandermeersch, T.; Hutchison, G.R. Open Babel: An Open Chemical Toolbox. J. Cheminform. 2011, 3, 33. [Google Scholar] [CrossRef] [Scilit] [PubMed]
- Trott, O.; Olson, A.J. AutoDock Vina: Improving the Speed and Accuracy of Docking with a New Scoring Function, Efficient Optimization, and Multithreading. J. Comput. Chem. 2010, 31, 455–461. [Google Scholar] [CrossRef] [Scilit] [PubMed]
- Wallace, A.C.; Laskowski, R.A.; Thornton, J.M. LIGPLOT: A Program to Generate Schematic Diagrams of Protein-Ligand Interactions. Protein Eng. 1995, 8, 127–134. [Google Scholar] [CrossRef] [Scilit] [PubMed]

Disclaimer/Publisher’s Note: The statements, opinions and data contained in all publications are solely those of the individual author(s) and contributor(s) and not of MDPI and/or the editor(s). MDPI and/or the editor(s) disclaim responsibility for any injury to people or property resulting from any ideas, methods, instructions or products referred to in the content. |
© 2026 by the authors. Licensee MDPI, Basel, Switzerland. This article is an open access article distributed under the terms and conditions of the Creative Commons Attribution (CC BY) license.