


Abstract
To establish the relationship between the composition of wine and its regional origin, the most stable chemical parameters are selected because their variation is easiest to trace. Together with “classical” micro- and macroelements, rare earth elements (REEs) can be used for such purposes. However, the relationship between REE content in wine and its regional origin has not been systematically studied. This study examines the migration of REEs in the “soil-grape-wine” system to identify the relationship along the entire chain and establish the geographical origin of grapes and wine. The research was carried out on grapes and wines from the Chardonnay and Cabernet Sauvignon varieties, as well as soil samples selected from different vineyards. The concentrations of La, Ce, Pr, Nd, Sm, Eu, Gd, Tb, Dy, Ho, Er, Tm, Yb and Lu in the studied samples were determined using ICP-MS. It was established that the studied soil samples are characterized by relatively low REE concentrations. Low transfer of REEs from soil to grapes was observed because the soils are rich in clay minerals that firmly retain these elements. Statistically significant differences in the REE content of grapes from different regions were detected (p < 0.05). Multidimensional analysis methods allowed us to group grape samples into clusters based on varietal and regional origin. Discriminant analysis showed the possibility of using the concentration of REEs as markers of the geographical origin of grapes. Of all the REEs, only La and Ce are reliably established in all wines. When determining the geographical origin of wine, the use of REE content is limited due to their very low concentrations in wine. In this regard, it has been proposed to use them in combination with macro- and microelements, which improves the classification performance of the model.
1. Introduction
Rare earth elements (REEs) are an important tool for identifying various objects and are widely used as geochemical markers [1,2,3]. Their presence in soils is primarily due to the processes of soil formation. Carbonatites are the main natural source of REEs in soils [4,5,6,7,8]. REEs are absorbed by plants from the soil through their root systems and is distributed to different parts of the plant in the following order: roots > leaves > stems > fruits [9,10]. The concentration of REEs in a plant correlates with their content in the soil, which makes it possible to establish traceability and use them as terroir markers [11].
The REE content in wine is quite low, ranging from 0.1 to 20 µg/L [12,13,14]. However, it is actively used as a marker to establish the geographical origin of the drink worldwide [13,15,16,17,18,19,20,21,22]. It should be noted that their use as independent markers is quite limited. As a rule, when identifying and differentiating wines, the REE content is of interest only in combination with other elements. For example, in the study of Chinese wine in [23], Y and Ce were the only significant markers among REEs. In other studies [24,25], the REE content was considered as a marker but were not significant. Moreover, there is direct evidence of their insufficient independence as markers by the authors of [13]. They were able to identify only seven out of 12 wine-growing regions based on REE concentrations, which required the use of data on other elements. Despite their informative value, it can be concluded that the possibilities and limitations of using REEs as markers of geographical origin in wine require clarification [26].
The main disadvantage of most studies is the methodological fragmentation. Researchers mainly analyze commercial wines, leaving the processes occurring in the “soil-grape-wine” chain unexplored. Only a few studies attempt to evaluate the entire system comprehensively. For example, in [27], it was shown that the transition of REEs from soil to wine can be traced, but the treatment of wine with bentonite significantly changes the REE profile, disrupting its connection with terroir. This study differs from previous ones in its comprehensive approach to assessing the distribution of REEs in the soil–grapes–wine system. However, it has some shortcomings in data processing related to the assessment of commonly accepted indices of element transfer.
The authors [28,29] showed that winemaking technology is the key limiting factor in reducing the reliability of REEs content as markers, as it can significantly change the initial elemental profile inherent in grapes. The fining stage has the strongest effect. In particular, treatment of wine with bentonite clay can lead to an increase in the concentration of rare earth elements due to their leaching from the clay structure. This was shown using Cabernet Sauvignon, Merlot, and Moldavian wine samples as examples [14,30]. Thus, the use of concentrations of REEs as markers of wine origin is complicated by their low concentrations and the strong influence of production technology. Currently, few studies have been published on the traceability of REEs through the entire “soil-grape-wine” system. Existing research focuses either on agrochemistry (the “soil-grape” transition) or on oenology (the effect of winemaking technology). To reliably use REE content as a marker of origin, an integrated approach is required to trace its migration throughout all stages of wine production.
The purpose of this work is to study the distribution of rare earth elements in the soil–grape–wine system and to assess the possibility of using them as markers of geographical origin of grapes and wine.
2. Results and Discussion
2.1. Elemental Composition of Vineyard Soils
The elemental composition of soils and the availability of elements depend on their mineralogical composition. To establish the mineralogical profile and determine the main phases present in soils, X-ray phase analysis was carried out [31,32]. It was found that the vineyard soils for Cabernet Sauvignon and Chardonnay grapes were almost identical (Figure S1). The main mineral in these soils is quartz (31–35%), with other phases represented by illite, nontronite, muscovite, and albite. Anapa soils are classified as silicate–carbonate in their mineralogical composition. Their quartz content is 25%, and they also contain illite, nontronite, albite, and dolomite. Furthermore, soils from Anapa’s Cabernet Sauvignon vineyards are characterized by high contents of zeolite and calcite (Figure S2). The greatest differences in mineralogical composition were observed in samples of carbonate soils from Gostagayevskaya. For this area, calcite dominated the entire soil profile in Cabernet Sauvignon vineyards and its content increased with depth. As for the soils of the Chardonnay vineyards, calcite was found only at a depth of 140–160 cm (Figure S3). As can be seen, despite the proximity of the territories, the differences in the composition of the soils of the vineyards where the two grape varieties are grown are noticeable. The other phases in these soils were illite, muscovite, nontronite, and albite. Mineralogical differences among the vineyard soils were the basis for considering these samples as independent study objects.
The REE content in soil samples, grapes, and wines of the Cabernet Sauvignon and Chardonnay varieties is shown in Table 1. As can be seen from the table, Ce is the most abundant REE in soils for all vineyards, followed by La and Nd. The distribution of REE concentrations in the soil samples largely corresponds to the order of their abundances in the Earth’s continental crust: Ce > La > Nd > Sm > Eu > Yb > Tb > Lu. In addition, the distribution of rare earth elements (REEs) in soils and grapes follows the Oddo–Harkins rule [33]. According to the rule, even-numbered nuclides are more common than their odd-numbered neighbors. Therefore, the distribution has a sawtooth profile with decreasing prevalence (Table 1).
Table 1.
REE content in soil, grape and wine samples (mean ± total uncertainty; p = 0.95).
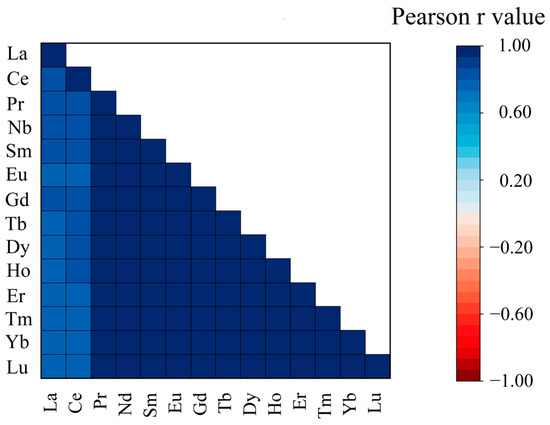
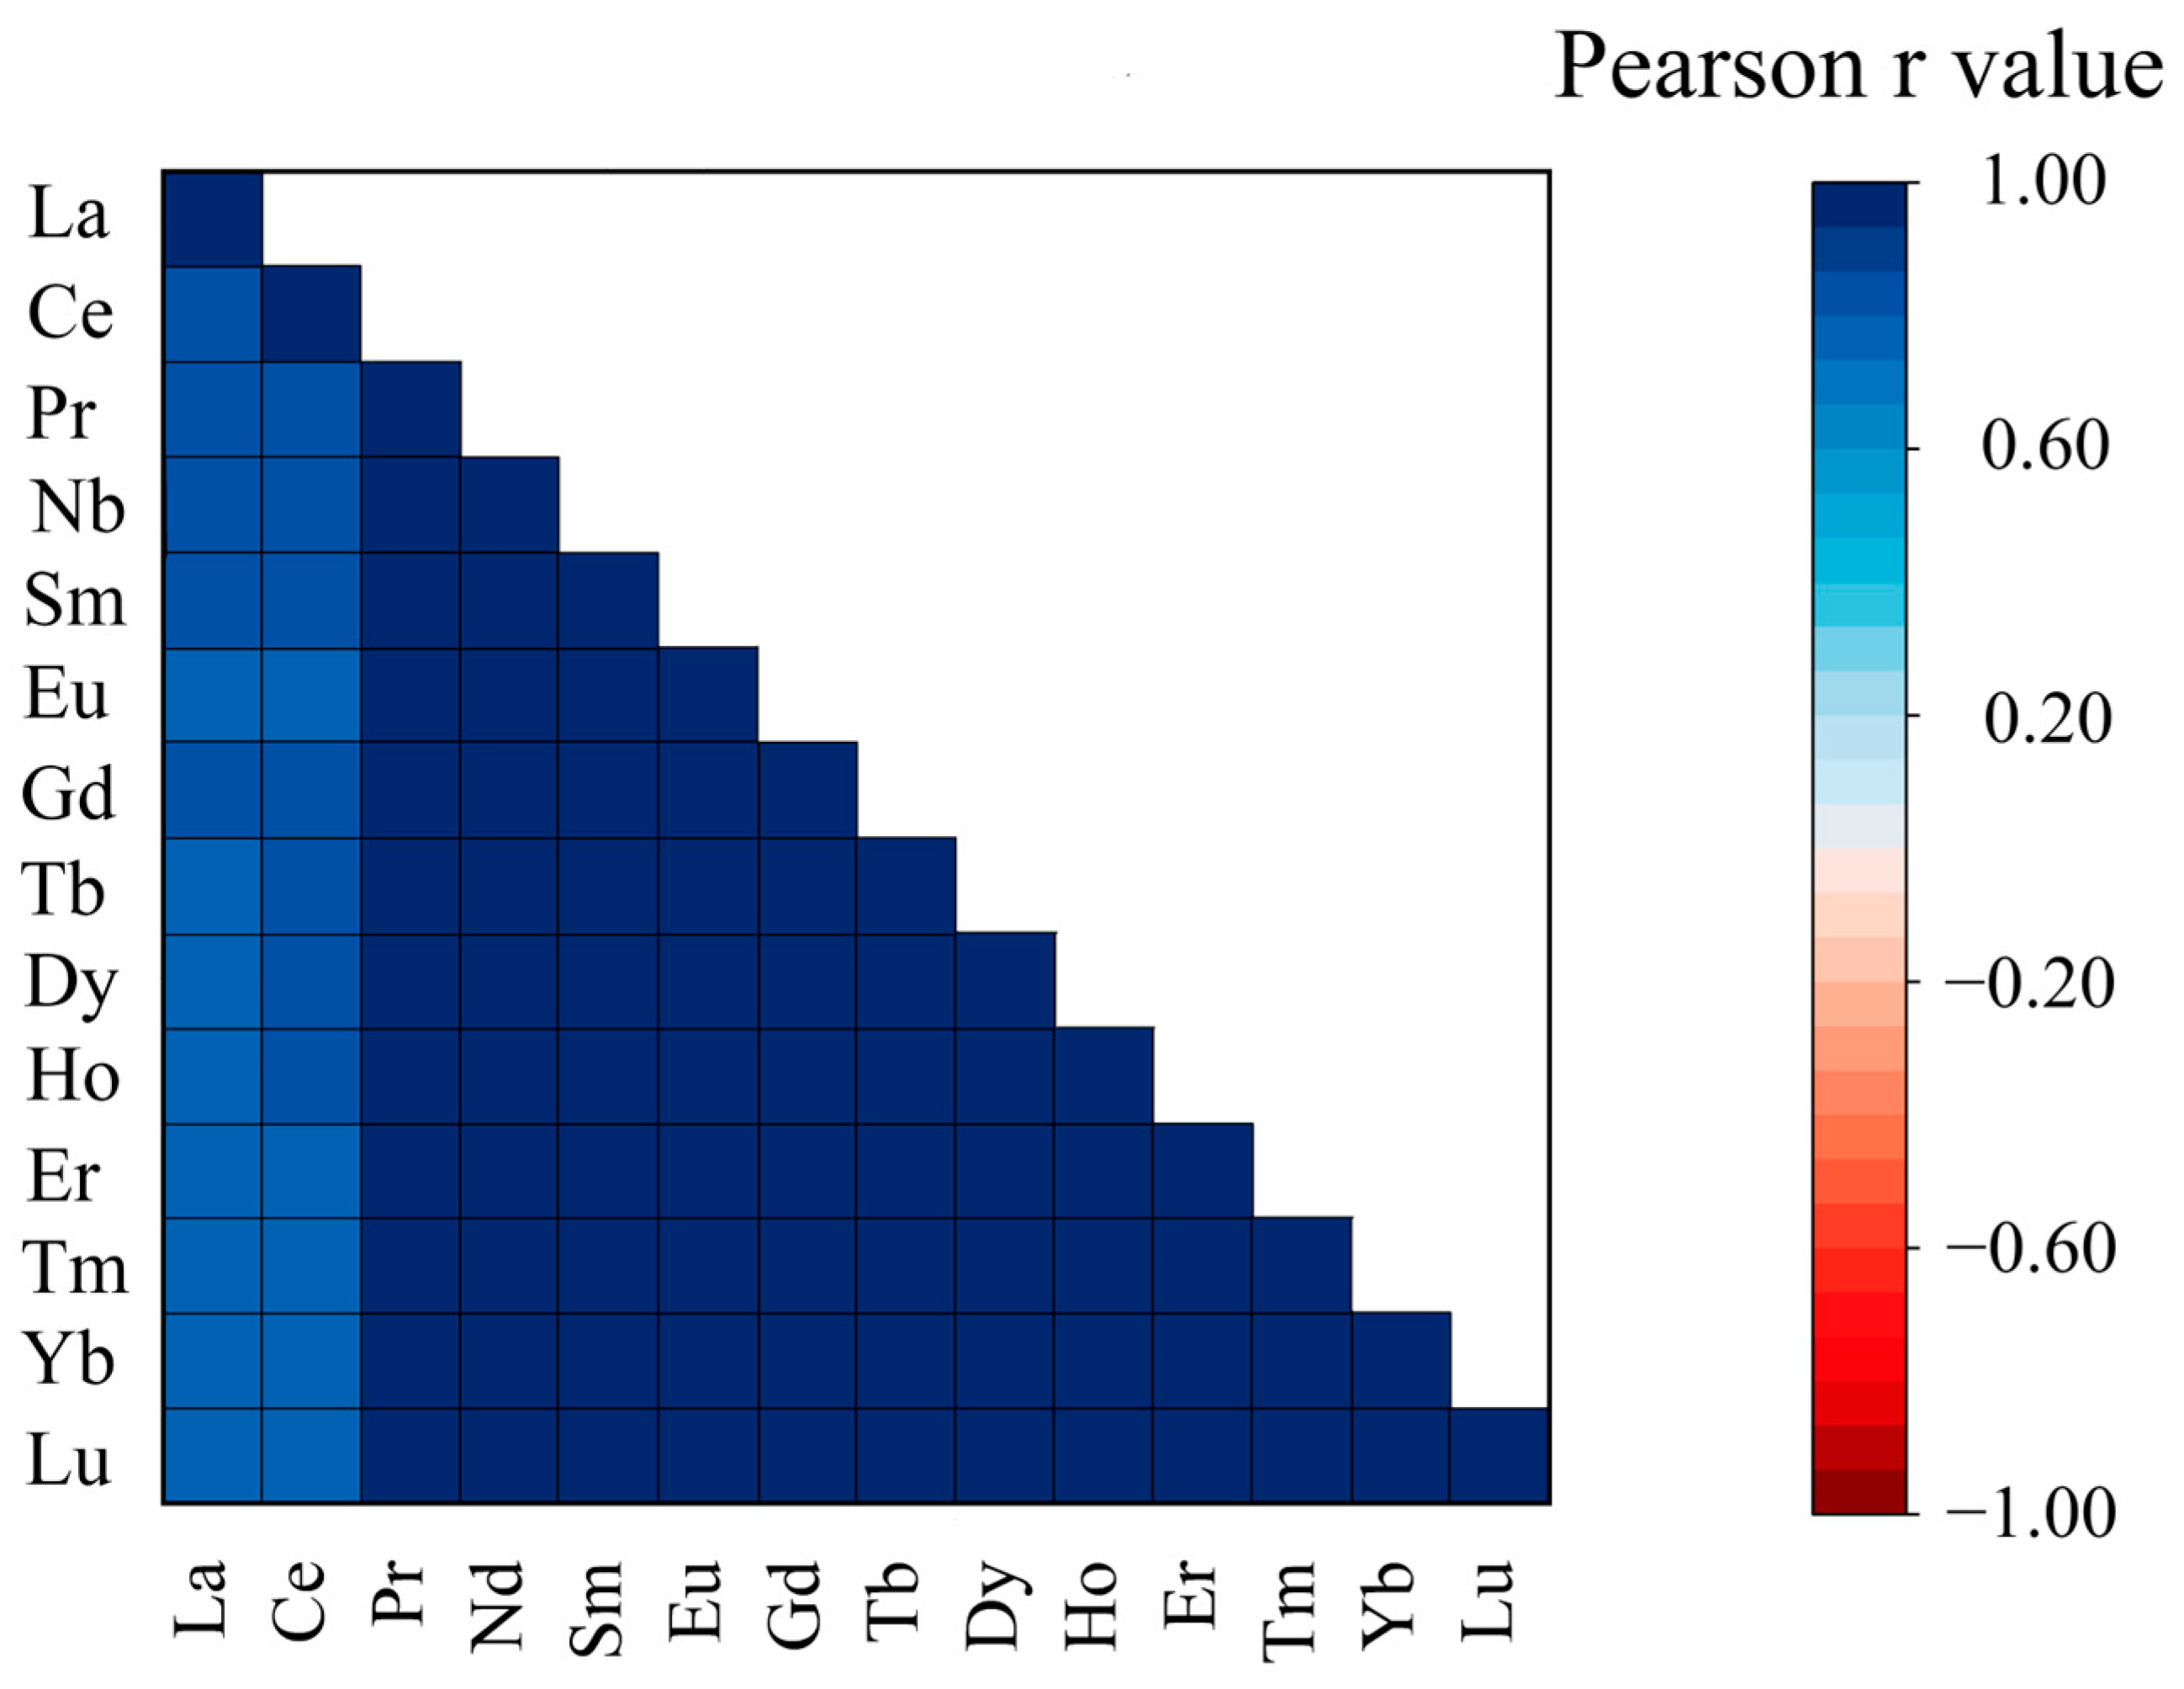
The concentrations of rare earth elements in soils show a strong correlation (Figure 1). The same patterns have been noted by other authors [34]. Some of them [35] successfully use concentrations of individual rare earth elements to predict their total concentration in soils.
Figure 1.
Correlation matrix of rare earth elements in soils.
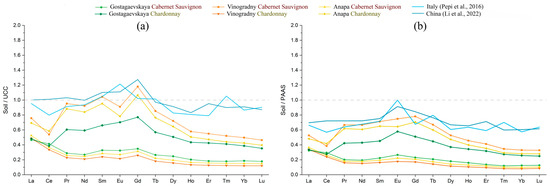
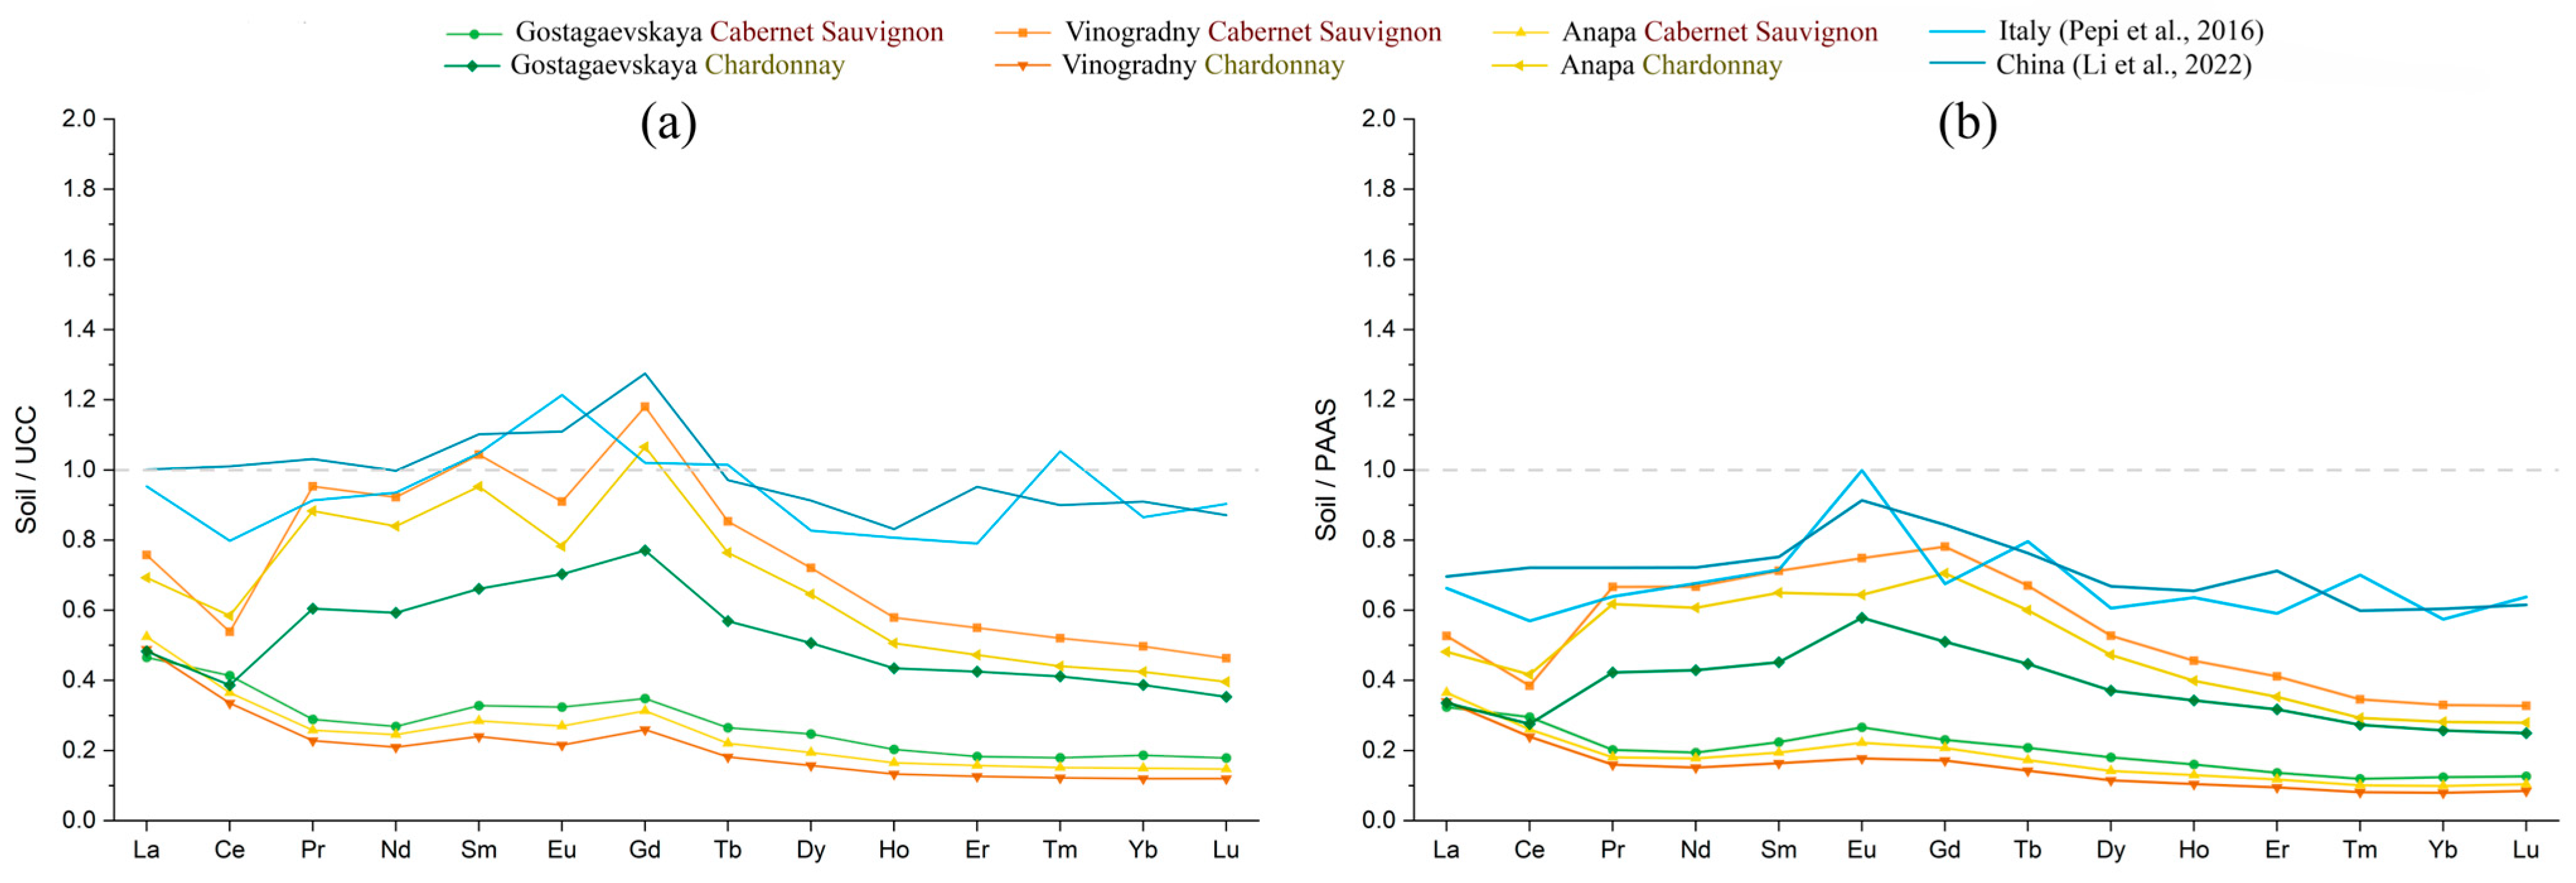
The highest total REE concentration was observed in the soils from Vinogradny (106 mg/kg). These soils are characterized by clay texture and formed from hard limestone [31,32,36]. The lowest total REE concentration was observed in the soils from Anapa (52 mg/kg). To assess the enrichment of REEs in soils, their concentrations were normalized to values in the upper continental crust (UCC) (Figure 2a) [37] and Post-Archean Australian Shale (PAAS) (Figure 2b) [38]. The REE distribution models show that REE concentrations are depleted in all studied soils.
Figure 2.
Concentrations of rare earth elements in soil samples, normalized relative to those in: (a) the upper continental crust; (b) Post-Archean Australian Shale [12,39].
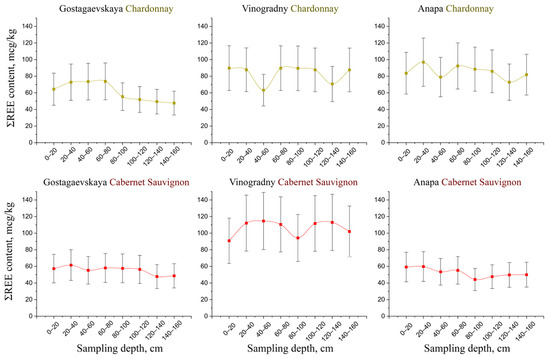
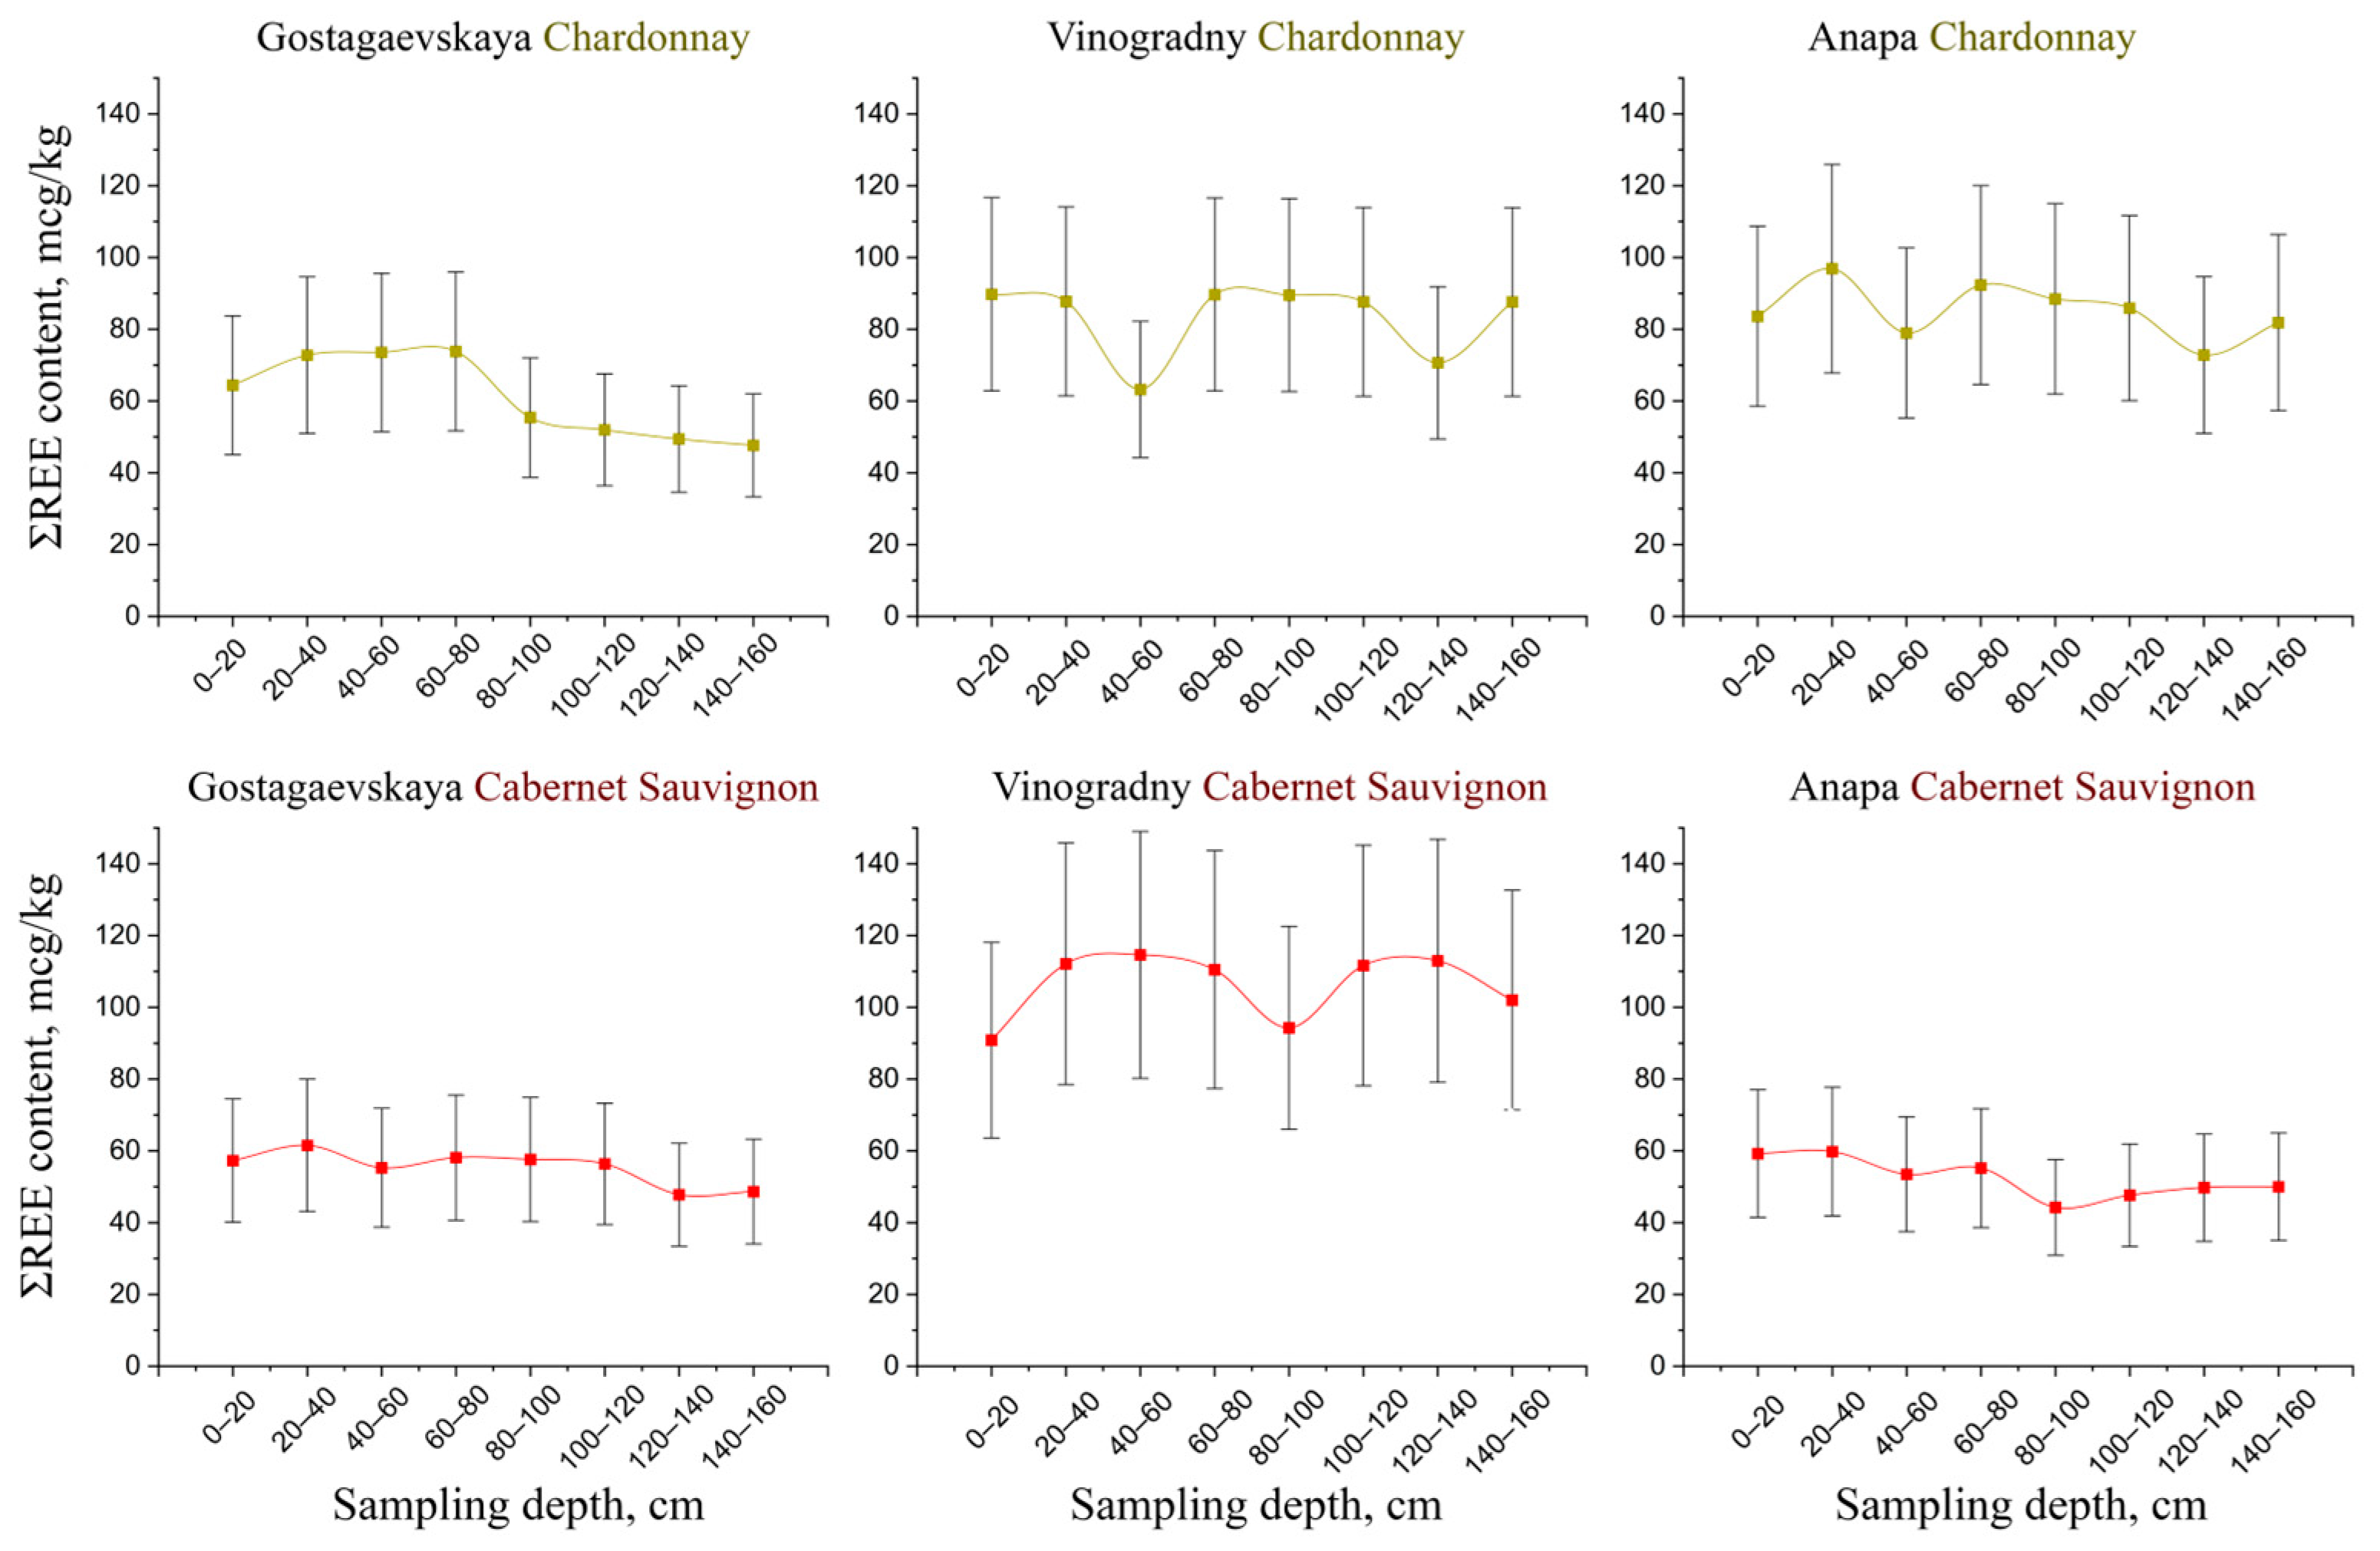
Analysis of the REE distribution in the soil profile shows that there are no significant changes in element concentrations as sampling depth increases (Figure 3). This confirms that soil formation processes have virtually no effect on the REE content in soils [33]. Despite the absence of significant changes, lower total REE concentrations were observed in the upper layer of the soil profile for all vineyards (0–20 cm). This is probably due to weathering processes, which significantly affect the behavior of REEs under natural conditions [39].
Figure 3.
The distribution of ΣREE in the soil profile of vineyards.
2.2. Elemental Composition of Grapes
Regardless of the region and variety, most of the REE content in grape samples is represented by light REEs, the concentrations of which decrease with the following order: Ce > La > Nd > Pr > Sm > Eu (Table 1). The content of heavy REEs also decreases in the following order: Gd > Dy > Er > Yb > Tb > Ho > Tm > Lu.
According to the results of the one-way ANOVA (p < 0.05), statistically significant differences were found among the study areas for each REE. Despite the relatively high total content of REEs in the soil, their content in grapes is much lower (Table 1). This is primarily due to the low mobility of REEs and their uneven distribution in the parts of the plant [9,10]. The mobility of REEs in soil is related to pH, chemical availability, organic matter, fertilizers, redox potential, and texture [40]. In addition, sorption onto clay minerals, phosphates, hydroxides of Fe, Mn and Al, and soil organic matter reduces the solubility and mobility of REEs in soils [41]. The authors of [42] also noted that REEs accumulate differently in different parts of the vine. Their highest concentrations were observed in the roots and leaves, and the lowest in grapes.
2.3. Correlations Between the Soil and Grape
To study the uptake of REEs by grapes, the biological absorption coefficient (BAC) was calculated as the ratio of the concentration of an element in grapes to its concentration in the soil (Table 2). BAC provides information on the relative availability of REEs in the soil for uptake by plants [40,43]. The calculated BAC values are shown in Table 2.
Table 2.
The calculated values of biological absorption coefficients.
The data in Table 2 confirms that there are differences in REE absorption based on both varietal and regional factors. The low BAC of REEs can be explained by the mineralogical composition of the soil. The studied soils of the Anapa region contain clay minerals, including illite and vermiculite [31]. Therefore, the retention of rare earth elements (REEs), especially light REEs, in soils may be associated with the adsorption of these elements by minerals [41]. For all samples, heavy REEs —Tm, Yb and Lu—have the highest BAC.
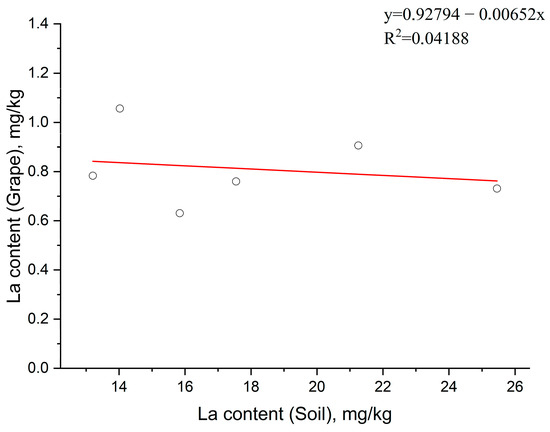
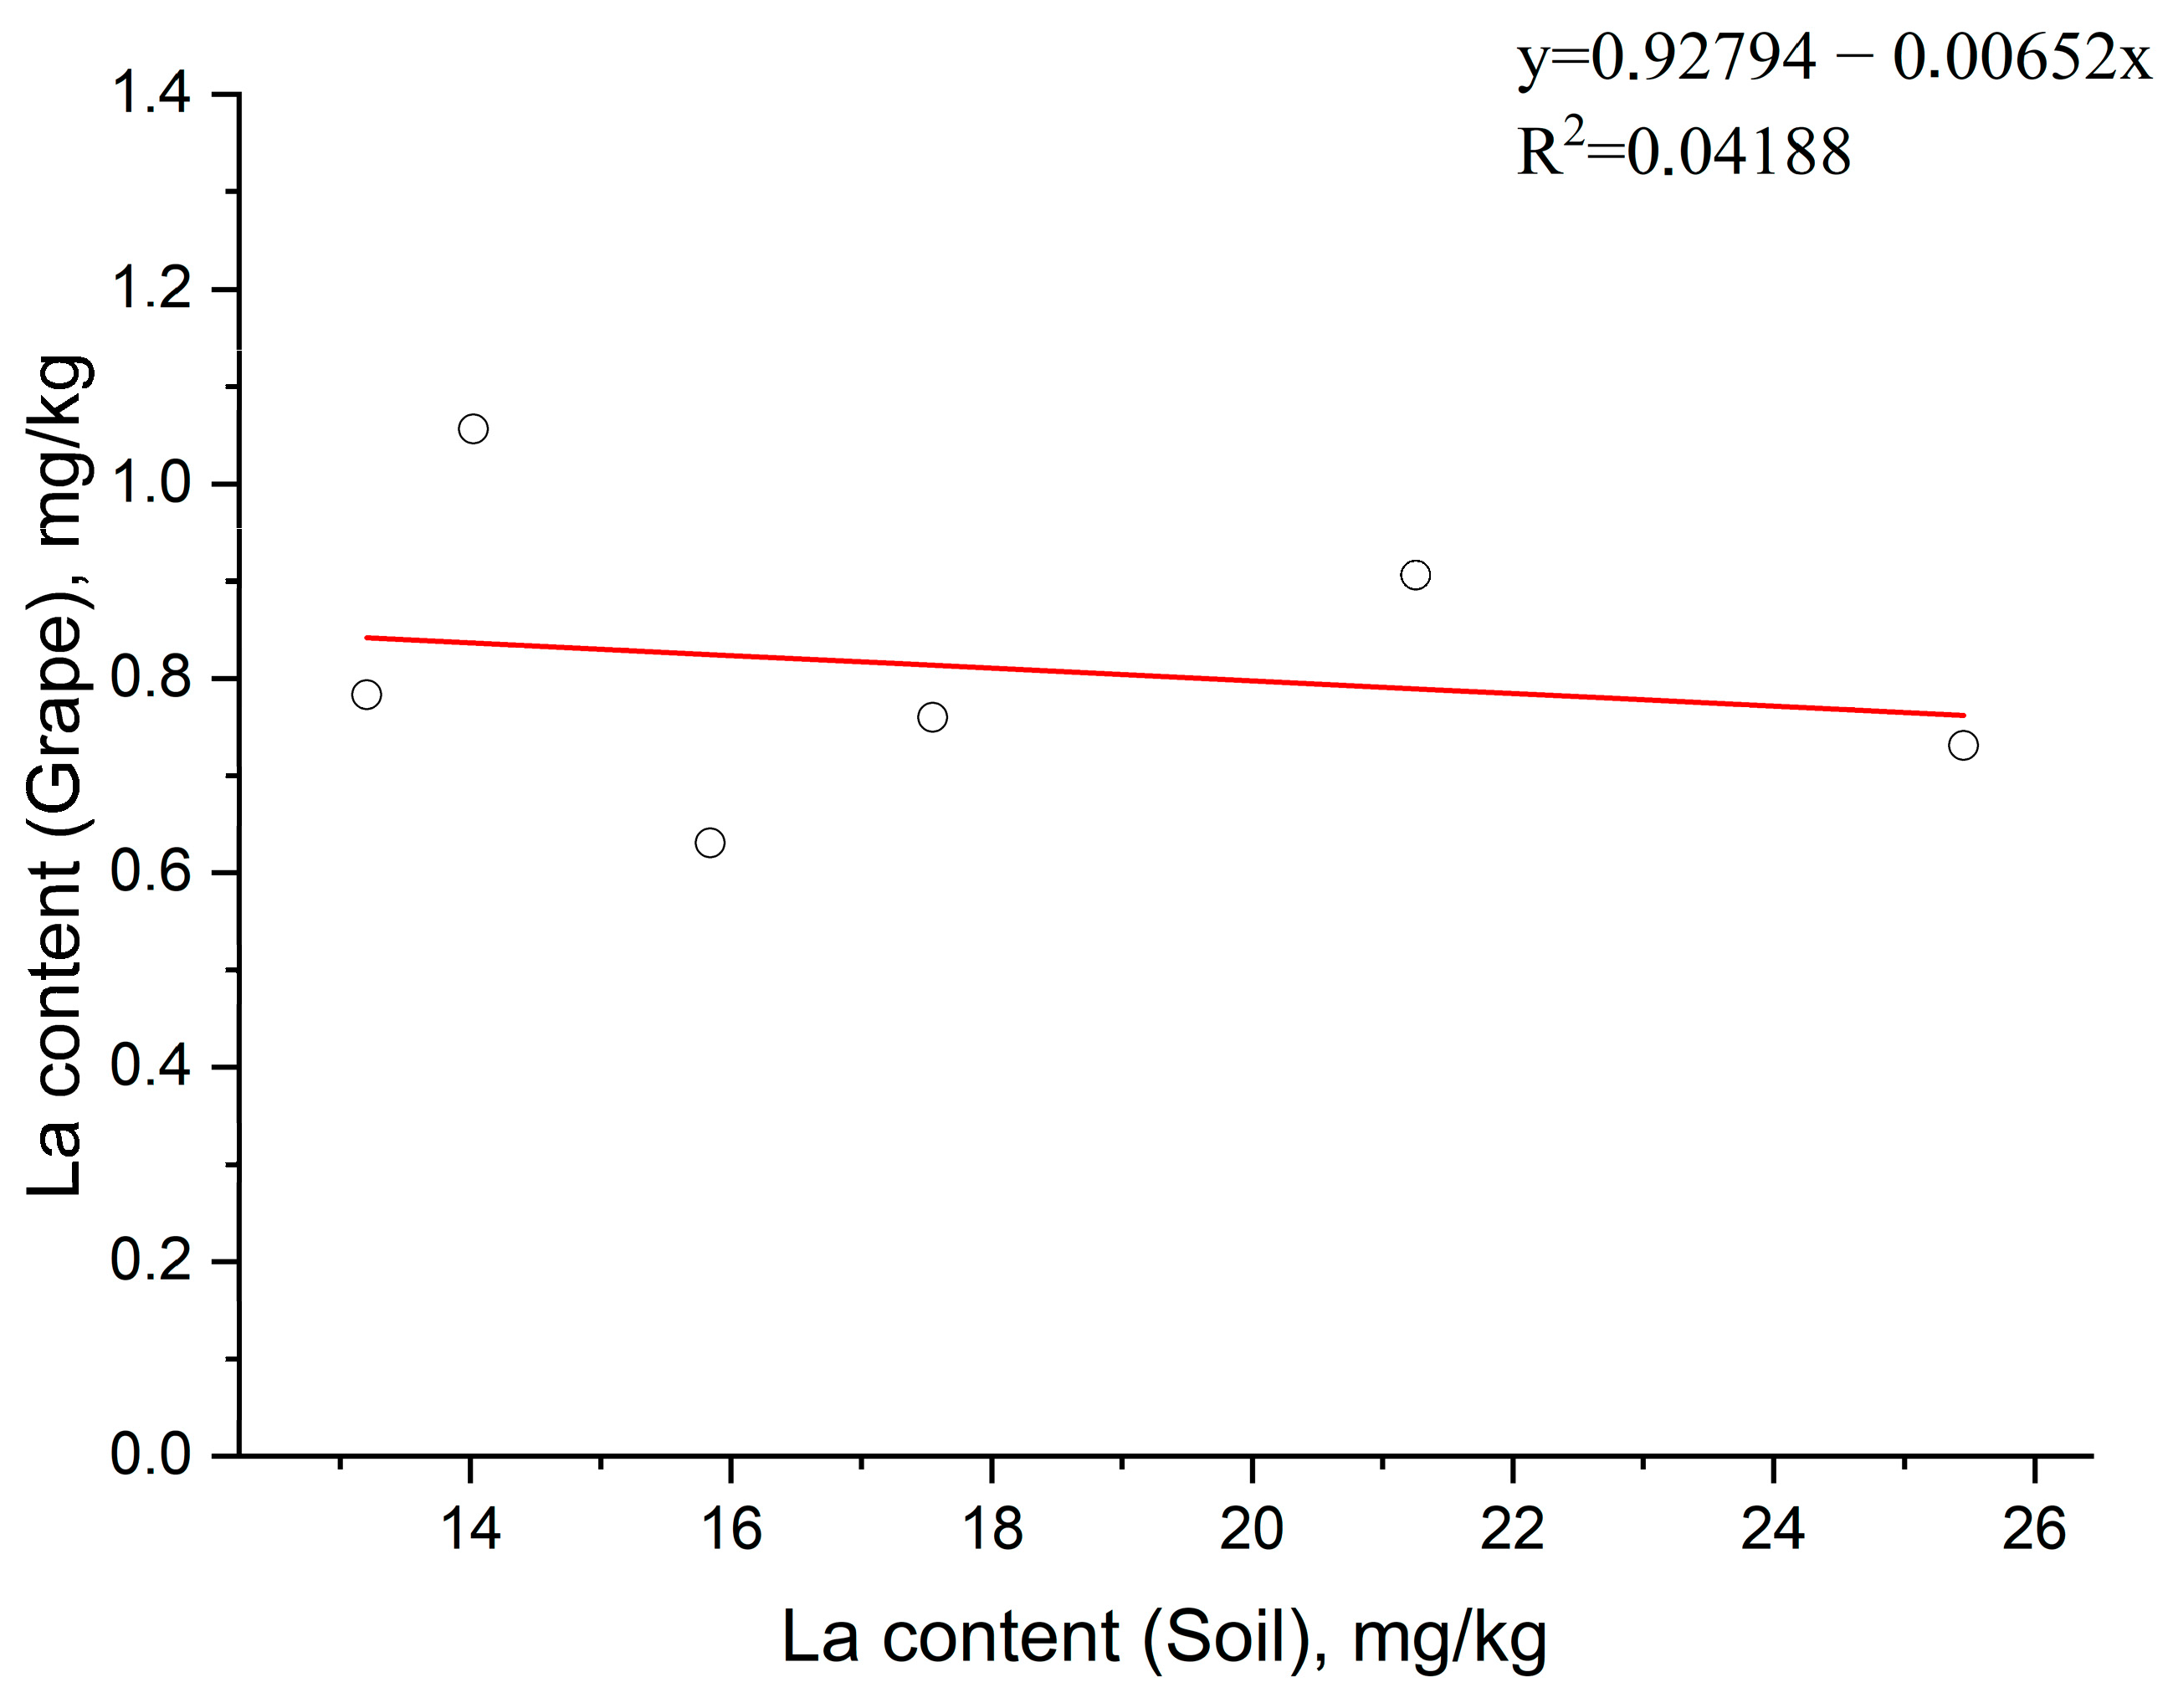
The different absorption and accumulation of elements in the vine make it difficult to trace elements in the “soil–grape” chain. To identify the correlations between the concentrations of elements in soil and grapes, a Pearson correlation analysis was performed. It has been established that there are no statistically significant correlations between the concentrations of elements in soil and grapes. Additionally, to analyze the correlation between the elemental composition of soil and grapes, a Mantel test was performed. This test allows the establishment of a correlation between two matrices. The test revealed the absence of a correlation between soil and grape composition (premutation N = 10,000; correlation R = −0.09105; p = 0.5643). A graphical representation of the lack of a relationship between the concentrations of elements in soil and grapes is provided by the scatterplot of La content (Figure 4).
Figure 4.
The scatterplot of La content in soil and grape samples.
In the context of the terroir concept, the central analytical task is to search for reliable geochemical markers that make it possible to link the elemental composition of wine to the place where the grapes were grown [44]. The ideal marker is considered to be an element whose content in a plant (and, further, in wine) predictably correlates with its concentration in soil. However, in practice, a direct correlation is often not observed. Most researchers [45,46,47] agree that the strongest and most stable positive correlation is characteristic of the “soil-leaf” system. In this case, the direct “soil-berry” relationship, which is of key importance in this case, often turns out to be weak or statistically insignificant [31].
This fact significantly complicates the justification of markers of origin based directly on the composition of the final product. The reason for this discrepancy is that the vine is a complex, dynamically regulated system. During the growing season, the plant’s mineral needs and ways of redistributing them change. It is the physiological control of plant nutrition that explains why the concentration of many elements in grapes is strictly regulated by the needs of the plant, and not only by the total content of the element in the soil [48]. This leads to a weakening of the direct “soil-grape” relationship [49,50].
2.4. Establishing the Geographical Origin of Grape
The authors of [13,14,15,16,17,18,19,20,21,22] demonstrated the possibility of using concentrations of REEs as marker elements for varietal and regional classification. Based on this, the data on the REE content in the grape samples was analyzed by discriminant analysis and then graphically illustrated to assess their similarity and difference. The territory of grape growth and its variety was used as a grouping variable (6 groups). The concentrations of REEs in the grape samples were selected as predictors (independent variables). A step-by-step exclusion method was used to select the most informative predictors, which allows for the gradual elimination of redundant predictors from the model based on F-remove statistics. Table 3 shows that discrimination was successfully carried out. This is confirmed by the Wilks’ lambda value, which tends towards zero. Over four steps, Dy, Sm, Ho and Gd were excluded from the model. All remaining predictors in the model are statistically significant at p < 0.00000. Cross-validation was performed to assess the quality of the grape discrimination model. The dataset was randomly split into a train (80%) and a test (20%) set, maintaining the same proportions between the groups. The classification accuracy for both sets was 100%.
Table 3.
The results of discriminant analysis of grape samples.
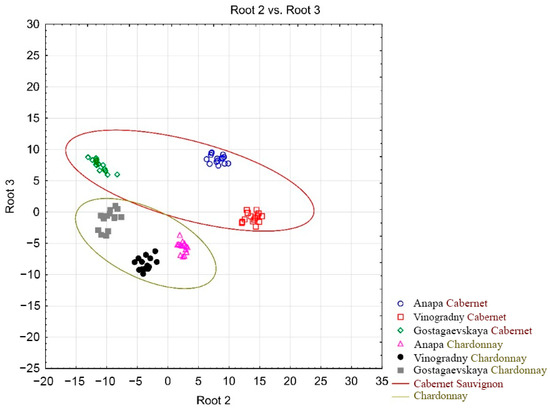
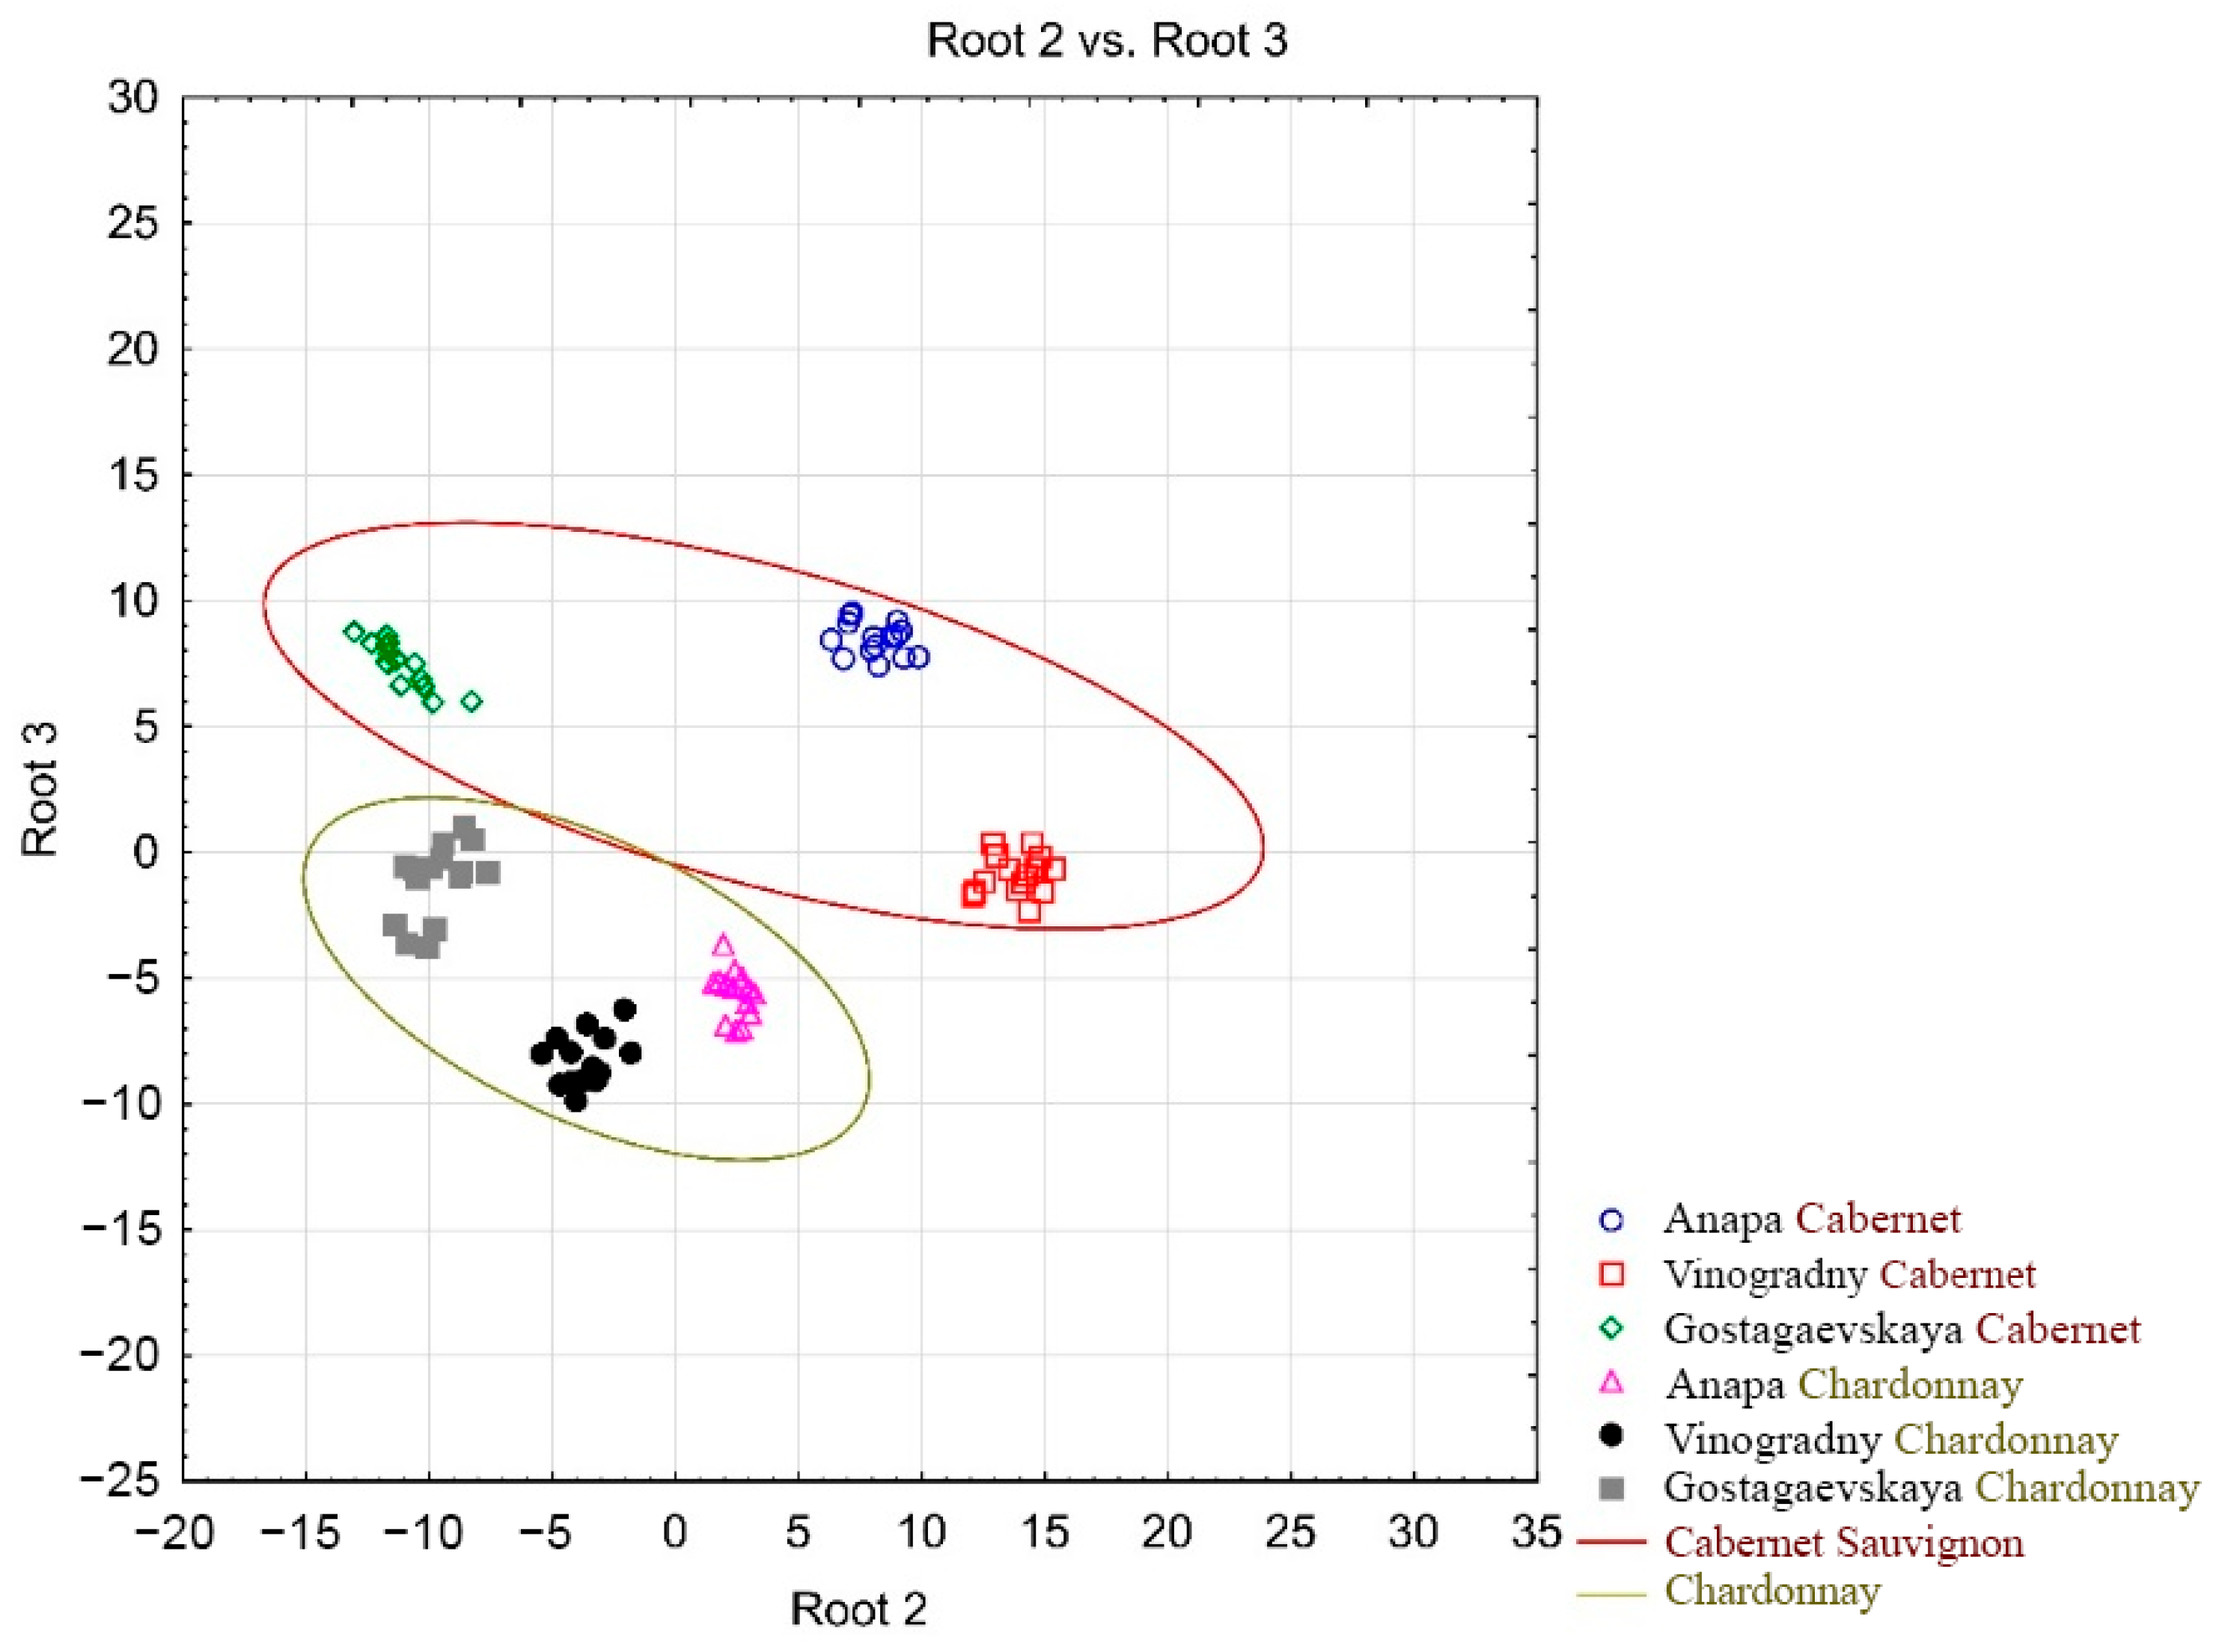
The scatterplot of canonical values allows you to transfer objects from multidimensional space into a space with a smaller dimension—a plane, while preserving the relative distances between objects. The resulting scatterplots of the canonical values of grape samples constructed using REEs as predictors will allow us to judge the uniformity of objects and the degree of similarity or difference between groups by comparing distances. The smaller the distance, the greater the similarity. It can be seen from Figure 5 that grape samples form groups of homogeneous objects—clusters. It should be noted that samples of Cabernet Sauvignon grape samples are located mainly in the upper part of the plane and Chardonnay—in the lower part (highlighted by ellipses). This may indicate the possibility of using REEs as additional predictors for establishing varietal affiliation.
Figure 5.
A scatterplot of the canonical values of grape samples constructed using REEs as predictors.
The absence of a statistically significant correlation between the concentrations of REEs in soil and grapes does not exclude the possibility of using them as markers of geographical origin. At the same time, the geographical marker element does not always imply a quantitative transfer of the element from the soil to the plant. Above all, a marker needs reproducibility and regional distinctness of its content in the final product. Despite the fact that the availability of REEs is primarily determined by their sorption by clay minerals and biological barriers of plants, the nature of their transition from soil to plants remains regionally specific. The results obtained suggest that a model based on REE concentrations can be used to determine the regional origin of grapes, even if they are grown in soils that are not enriched with REEs (Figure 5).
2.5. Elemental Composition of Wine
Most of the REEs in the wine samples, despite the high sensitivity of the spectrometer detection, were not detected (Table 1). Of all the REEs, only La and Ce were detected in all wines. The transfer of elements from grapes to wine was estimated using the transfer factor (TF), calculated according to the equation proposed by [51]:
Cwine and Cgrape—concentrations of elements in wine and grapes, respectively.
Analysis of the data obtained (Table 4) showed that only the red wine samples from Vinogradny and Anapa had La and Ce transfer factors higher than 0.0005. In other wine samples, the REE content was more than 3.5000-fold lower compared to its initial content in grapes. We also noted that the TF value was higher in red Cabernet Sauvignon wine compared to white Chardonnay wine from the same region. Apparently, this is due to differences in the distribution of REEs in different parts of the grape berry and/or differences in production processes for red and white wines [52].
Table 4.
The calculated values of transfer factors.
2.6. Establishing the Geographical Origin of Wine
The obtained data on the elemental composition of wines shows that due to the low REE content, it is almost impossible to accurately assess the regional origin of the wine. Using only REEs as markers for wines produced from grapes grown in soils with low levels of REEs can lead to incorrect identification. Therefore, it would be advisable to select more specific marker elements from macro- and microelements, or to combine them with REEs [13,14,15]. To establish the geographical origin of the wine samples, 21 micro- (Al, As, Ba, Be, Cd, Co, Cs, Cu, Fe, Li, Mn, Mo, Ni, Pb, Rb, Sr, Ti, V, W, Zn, Zr) and 4 macroelements (Na, Mg, Ca, K) with REEs were used as predictors (Table S1). The results of discriminant analysis of wine samples showed that Ce is one of the significant predictors (Table 5). At the same time, Table 5 shows that Ce makes the smallest contribution (the highest partial lambda) and Fe makes the largest contribution (the lowest partial lambda) to the discriminant model.
Table 5.
Results of discriminant analysis of the wine samples.
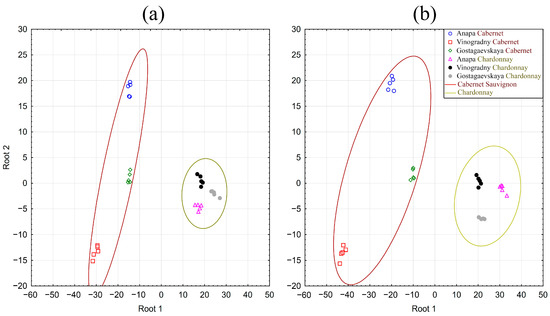
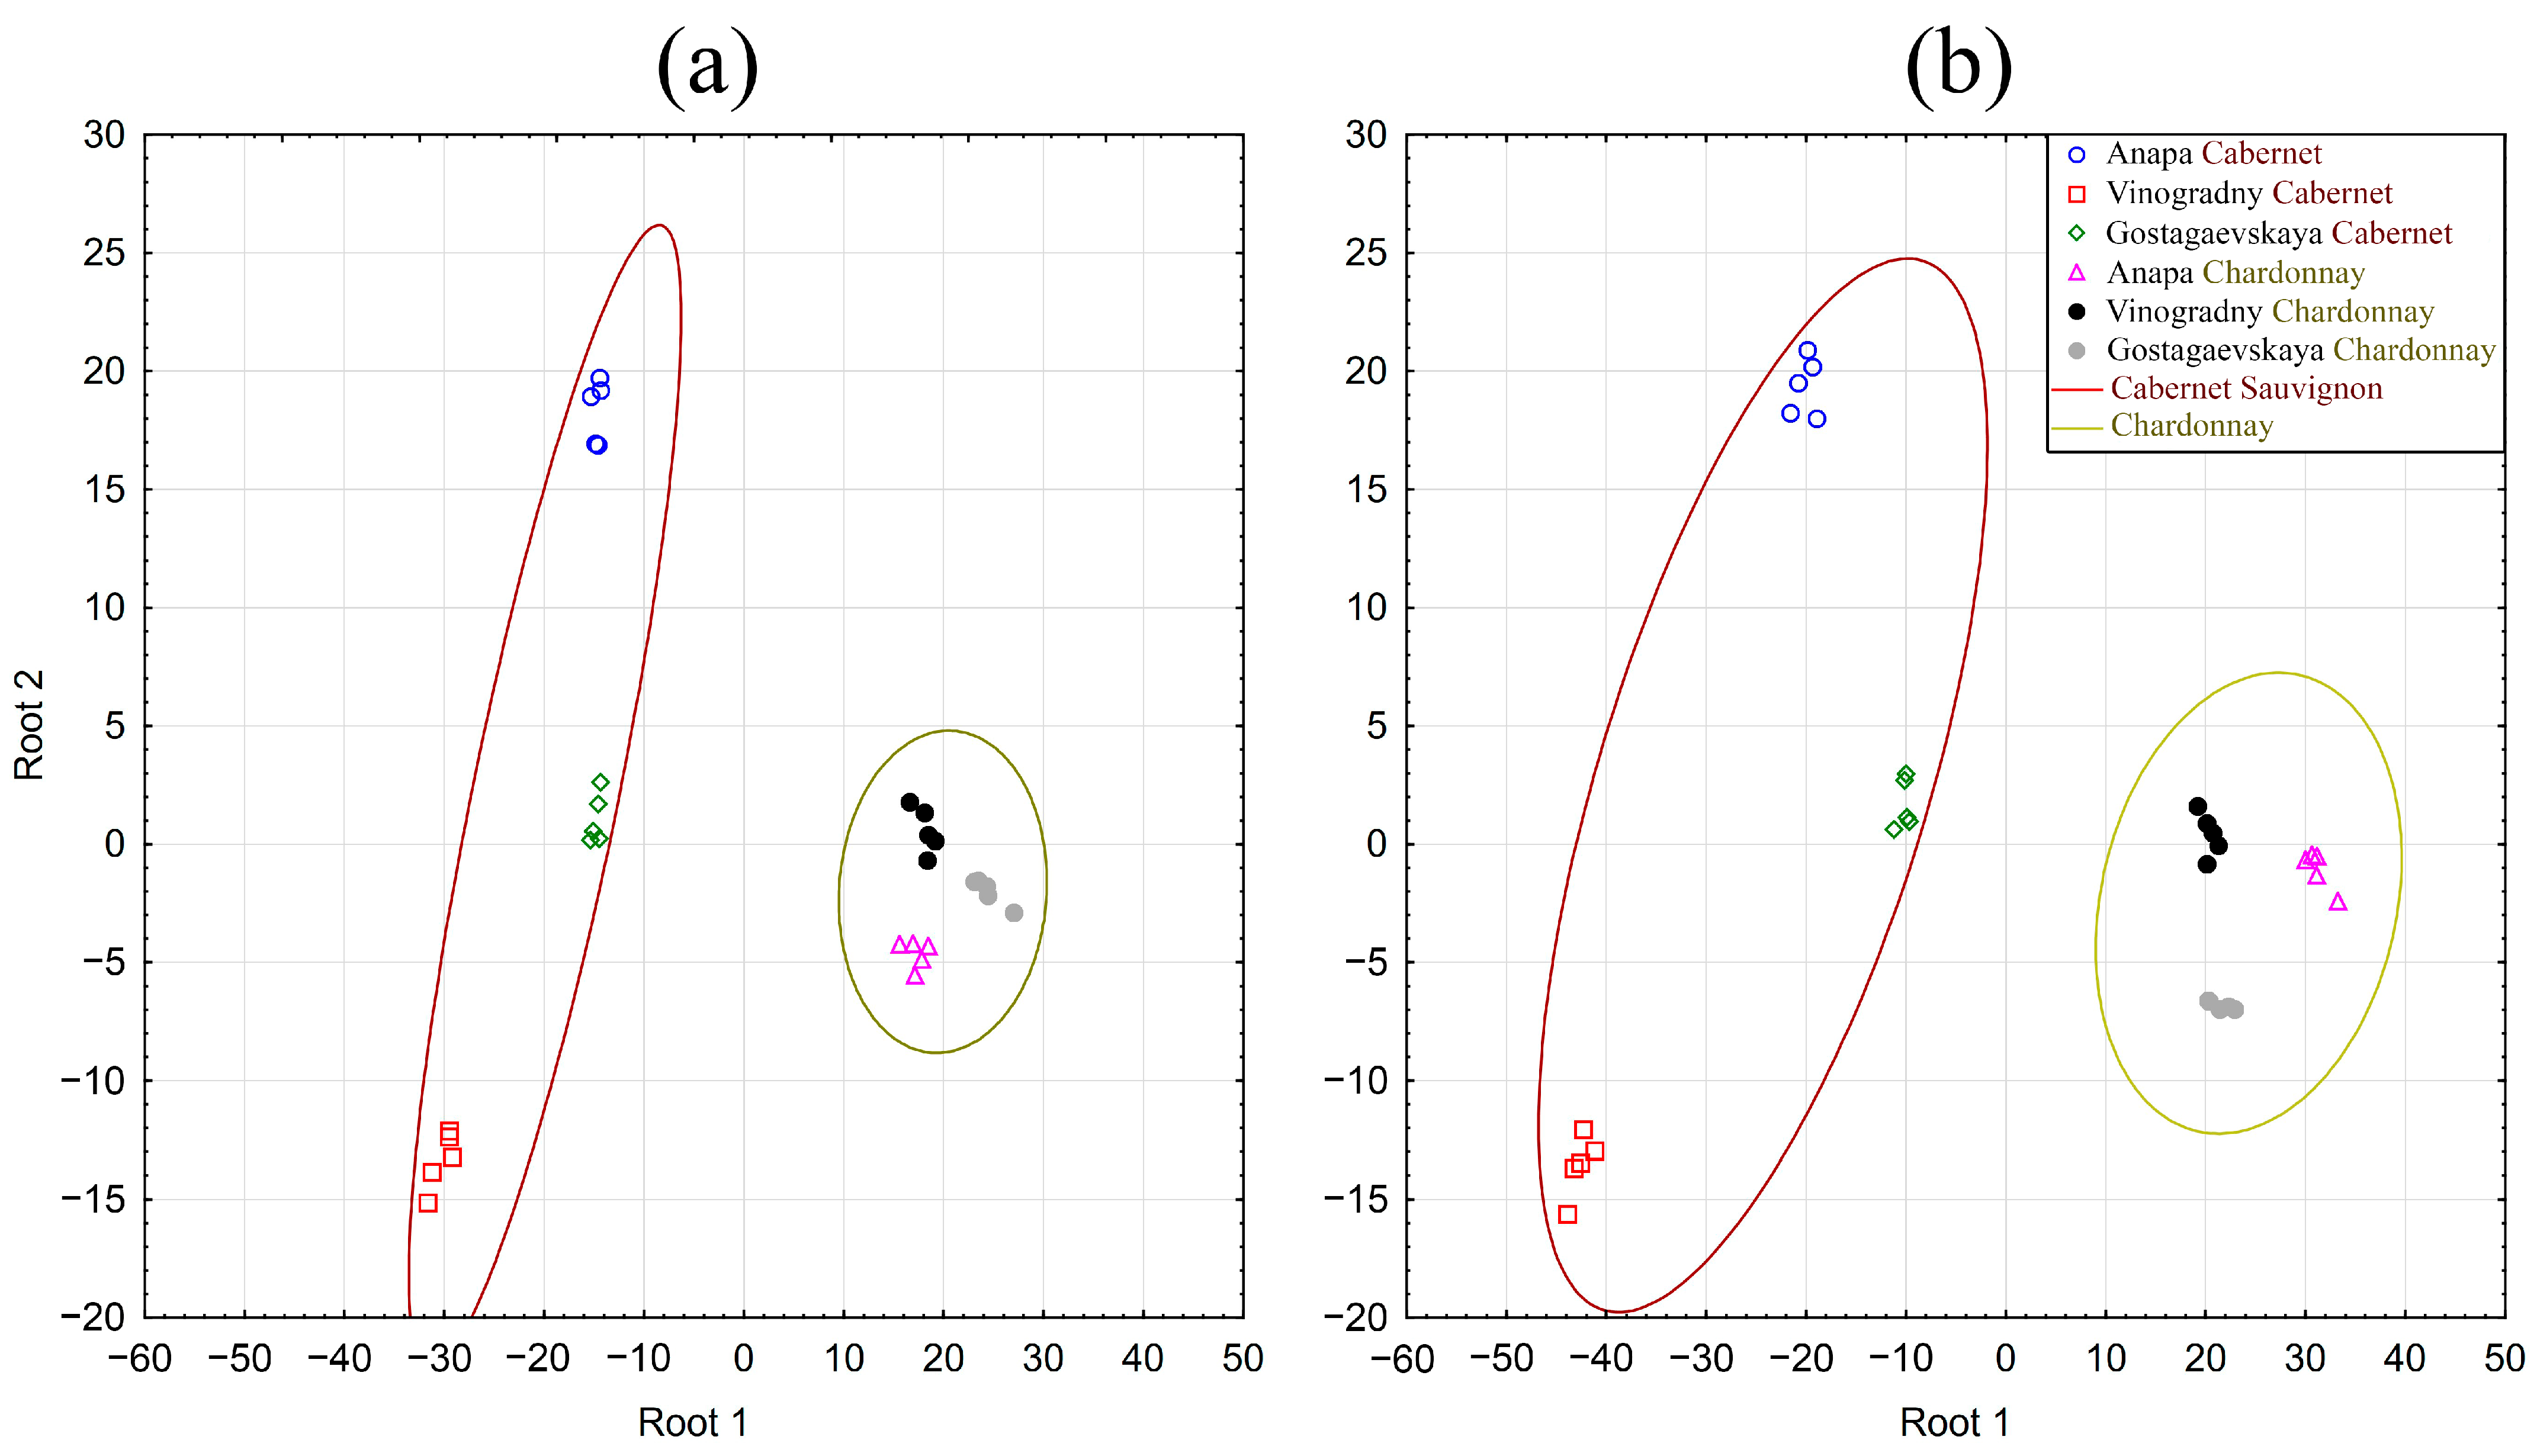
Wine samples form highly distinct clusters, as shown in the scatterplot of canonical values (Figure 6b). At the same time, it should be noted that samples of different varieties are located in different parts of the plane, which indicates a tendency to form varietal clusters. To compare, a non-REE discrimination model was created, in which the initial predictors were only the macro- and microelements (Figure 6a). In the absence of La and Ce in the dataset, Na contributes the most to discrimination, and Zn—the least (Table 5). Despite some differences in the predictors, the resulting scatterplots are quite similar. It is worth noting that, with the addition of La and Ce predictors (Figure 6b), the distances between clusters increase, which indicates an improvement in the discriminatory performance of the model. To assess the quality of wine discrimination models, cross-validation is not practical due to the small number of observations in each group (N = 5). Thus, the entire dataset was used to build models and the classification accuracy of both models was 100%. Mahalanobis distances were used to estimate the potential for identification properties of the models. Squared Mahalanobis distances serve as a measures of the distances between points and cluster centroids. It was found that in the REE model, Mahalanobis distances were greater between different groups (Table S2) compared to the non-REE model (Table S3). Thus, an increase in intergroup distances indicates discriminatory performance of the model.
Figure 6.
Scatterplots of the canonical values of wine samples, constructed using concentrations of macro- and microelements (a), and the additional inclusion of Ce as a predictor (b).
3. Materials and Methods
3.1. Objects of Research
The study objects were samples of Cabernet Sauvignon and Chardonnay grapes taken from the vineyards in the Anapa region, as well as the soil in which the grapes were grown. Soil samples were collected using the “envelope” method during the berry ripening period. In our previous studies [31,32], we determined the mineralogical composition of the studied soils. Despite their proximity (the distance between the vineyards in one area was at least 100 m), differences in the mineralogical composition of the soils from the Cabernet Sauvignon and Chardonnay vineyards were noticeable. Thus, mineralogical differences served as the basis for considering these samples independent study objects. The information about the studied vineyards is presented in Table S4. Grapes were harvested when they reached their technical maturity. The processing of grapes and the production of young wines was carried out in accordance with general rules and technological instructions for wine production. The wines were produced from grapes harvested in 2022.
The young Cabernet Sauvignon wine was prepared by fermenting the must with active dry yeast (Lallemand Lalvin EC 1118, 0.3 g/hL). The fermenting must was mixed 3–4 times per day while maintaining the temperature at 28–32 °C for 7 days. During fermentation, “Ultrasulph C” was added at a concentration of 160 g/t (equivalent to 100 mg/L of SO2). After fermentation, the must was pressed using a “Busher Vaslin” (Rivesaltes, France), followed by separation of the wine. Upon completion of sugar fermentation and separation of the yeast sediment, young wine was treated again with “Ultrasulf C” at a dosage of 50 mg/L of SO2.
For the production of young Chardonnay wine, drained and pressed juice was used in an amount of no more than 7 hL per 1 ton of grapes. The juice was sulfitized using “Ultrasulf C” at a rate of 80–150 mg of SO2 per kg of processed grapes, and clarified by sedimentation. The clarified juice was separated from the sediment and fed into fermentation tanks where active dry yeast was introduced in the dosages recommended by the manufacturers (Lallemand Lalvin EC 1118, 0.3 g/hL). The fermentation temperature did not exceed 18 °C. After sugar fermentation was complete and yeast had settled, young wine was treated with “Ultrasulf C” again at a rate of 50 mg/L SO2. The main physicochemical properties of the Cabernet Sauvignon and Chardonnay wines obtained are presented in Table S5.
3.2. Materials and Reagents
Concentrated H2O2, HF, HCl and HNO3 were used in experimental studies (all of high purity, PanReac AppliChem, Darmstadt, Germany). To determine the elemental composition of the samples, multi-element calibration solutions were prepared from single-element standard solutions of Ce, Dy, Er, Eu, Gd, Ho, La, Lu, Nd, Pr, Sm, Tb, Tm and Yb with a concentration of 1000 mg/L (Inorganic Ventures, Christiansburg, VA, USA). The analyzed solutions were prepared using deionized water with a resistivity of 18.2 MΩ·cm−1, which was obtained from a DuoPUR (Milestone, Milan, Italy) sub-distillation system.
3.3. Elemental Analysis
The elemental analysis was performed using inductively coupled plasma mass spectrometry (ICP-MS) on an iCAP RQ quadrupole mass spectrometer (Thermo Scientific, Waltham, MA, USA) [53]. The determined isotopes of the elements and their limits of detection are summarized in Table 6.
Table 6.
m/z of the measured elements and their limits of quantification.
3.4. Preparation of Soil Samples for Analysis
To determine the total content (TC) of elements, soil samples were digested using an Ethos 1 microwave digestion system (Milestone, Milan, Italy) using the method described in [49]. For this purpose, 0.50 g of soil and an oxidizing mixture containing 5.0 mL of concentrated HF, 3.0 mL of concentrated HNO3, and 1.0 mL of concentrated HCl were placed in an autoclave. To digest the samples, the analyzed mixture was gradually heated to 200 °C for 25 min, and then kept at 200 °C for 5 min in the reaction chamber. To avoid losses of volatile elements, the autoclaves were opened at temperatures below 40 °C; then, the contents of the autoclave were transferred to a 50 mL polypropylene volumetric flask and brought up to the mark with deionized water. ICP-MS analysis of soil samples was carried out using an HF-resistant sample injection system, including a PFA-ST nebulizer (Thermo Scientific, Waltham, MA, USA), a cyclone-type PFA spray chamber (Glass Expansion, Melbourne, Australia), and a 2.0 mm corundum injector (Glass Expansion, Melbourne, Australia).
3.5. Preparation of Grape Samples for Analysis
The elements in grapes were quantified according to [54]. The digestion of grapes before analysis was carried out using an Ethos 1 microwave system (Milestone, Italy). The berries were washed with distilled water and dried; then, 2.0 g of grapes was placed in an autoclave. Digestion of the sample was carried out at elevated pressure using an oxidizing mixture consisting of 5.0 mL of concentrated HNO3, 1.0 mL of H2O2, and 4.0 mL of deionized water. The sample digestion program included gradual heating to 200 °C for 10 min (stage 1) and maintaining the reaction chamber at 200 °C for 10 min (stage 2). Autoclaves were opened at temperatures below 40 °C to avoid losses of volatile elements. Then, the content of the autoclave was transferred to a 25 mL flask and brought to the mark with deionized water.
3.6. Preparation of Wine Samples for Analysis
The preparation of wines to establish elemental composition consisted of a 15-fold dilution of the samples with 2% HNO3 according to [20,55].
3.7. Validation of Methods Used
The accuracy of the soil sample preparation procedure was established by analyzing standard soil samples. The sample preparation of grapes and wine samples were evaluated using recovery tests. The assessment of the correctness of the applied methods is presented in Tables S6–S8.
3.8. Statistical Analysis
The analysis of the relationships between the elemental composition of soils, grapes and wine was carried out using the STATISTICA (v. 14.0.0.15) and OriginPro (v. 10.2.5.212) software [56]. Correlations between metal concentrations were assessed using the Pearson’s correlation coefficient. When |r| ≤ 0.25, the correlation was considered weak; when 0.25 < |r| ≤ 0.75, it was considered moderate; and when |r| > 0.75, it was considered strong. The correlation between the elemental profiles of soil and grapes was assessed using the Mantel test in Past 5 (v. 5.3) software [57]. To perform the Mantel test, mean elemental concentrations were used and the number of permutations was 10,000. To assess statistically significant differences among the samples, a one-way ANOVA (p < 0.05), followed by Tukey’s HSD post hoc test (p < 0.05), was used. The possibility of using REEs as markers of geographical origin was assessed using discriminant analysis (“step-by-step” exclusion method).
4. Conclusions
The opportunities and limitations of using REE concentrations as markers for the geographical origin of grapes and wine are explored using the example of the established relationship between soil, grapes, and wine. The distribution of REE concentrations in the studied soils corresponds to the natural order (Ce > La > Nd, etc.). At the same time, their absolute concentrations were significantly lower than the average values for continental crust.
Statistically significant (one-way ANOVA, p < 0.05) differences in REE content were observed in samples of grape varieties from different regions with different mineralogical compositions of soils. Multivariate analysis methods confirm these differences, allowing samples to be grouped into clusters based on their origin. The possibility of using REE concentrations as markers of grape origin is demonstrated.
The use of REE concentrations as markers for wines from the Anapa region is difficult due to the low content of REEs (REE/UCC < 1) in the soils of the studied vineyards. The low coefficient of biological absorption, due to sorption by clay minerals and their weak accumulation in grapes, results in concentrations of REEs in grapes being much lower than those in soils. The consequence of this is that most REEs were not detected in young wines, which fundamentally limits the independent use of REE profiles to determine the origin of wine, and only La and Ce are present in all samples of young wines studied.
It has been shown that REE concentrations (La and Ce) can only be used as markers for the origin of wines in combination with micro- and macroelements. This significantly improves the identification performance of the discriminant model compared to non-REE models. We note that the patterns obtained were based on a dataset with limited geographical coverage from a single region (Anapa region, Russia). Further research will be required to establish these patterns in vineyards in other wine-growing regions.
Supplementary Materials
The following supporting information can be downloaded at: https://www.mdpi.com/1420-3049/31/14/2437/s1. Figure S1: Diffractograms of soil samples from Cabernet Sauvignon and Chardonnay vineyards located in Vinogradny; Figure S2: Diffractograms of soil samples from Cabernet Sauvignon and Chardonnay vineyards located in Anapa; Figure S3: Diffractograms of soil samples from Cabernet Sauvignon and Chardonnay vineyards located in Gostagaevskaya; Table S1: The concentrations of elements in wines; Table S2: Squared Mahalanobis Distances from Group Centroids in the REE model; Table S3: Squared Mahalanobis Distances from Group Centroids in the non-REE model; Table S4: Information about the studied vineyards; Table S5: Physicochemical properties of Cabernet Sauvignon and Chardonnay wines; Table S6: Determination of REEs concentrations in CRM Soil (NCS DC 77302); Table S7: Determination of REE concentrations in grapes; Table S8: Determination of REEs concentrations in wines.
Author Contributions
Conceptualization, A.A. and Z.T.; methodology, Z.T.; software, E.G.; validation, E.G. and O.S.; formal analysis, E.G.; investigation, A.A. and E.G.; resources, O.S.; writing—original draft preparation, E.G. and O.S.; writing—review and editing, A.A. and Z.T.; visualization, E.G.; project administration, Z.T. All authors have read and agreed to the published version of the manuscript.
Funding
This research was funded by the Russian Science Foundation, grant number 23-13-00056-П.
Informed Consent Statement
Not applicable.
Data Availability Statement
All data are included in the article.
Acknowledgments
The experiments were carried out using scientific equipment of the Environmental Analytical Center of Collective Use at the Kuban State University.
Conflicts of Interest
The authors declare no conflicts of interest. The funders had no role in the design of this study; in the collection, analyses, or interpretation of data; in the writing of the manuscript; or in the decision to publish the results.
References
- Hower, J.; Granite, E.; Mayfield, D.; Lewis, A.; Finkelman, R. Notes on Contributions to the Science of Rare Earth Element Enrichment in Coal and Coal Combustion Byproducts. Minerals 2016, 6, 32. [Google Scholar] [CrossRef] [Scilit]
- Duchna, M.; Cieślik, I. Rare Earth Elements in New Advanced Engineering Applications. In Rare Earth Elements—Emerging Advances, Technology Utilization, and Resource Procurement; Aide, M.T., Ed.; IntechOpen: London, UK, 2023; ISBN 978-1-83768-074-0. [Google Scholar]
- D’Antone, C.; Punturo, R.; Vaccaro, C. Rare Earth Elements Distribution in Grapevine Varieties Grown on Volcanic Soils: An Example from Mount Etna (Sicily, Italy). Environ. Monit. Assess. 2017, 189, 160. [Google Scholar] [CrossRef] [Scilit]
- Sobri, N.A.; Yunus, M.Y.B.M.; Harun, N. A Review of Ion Adsorption Clay as a High Potential Source of Rare Earth Minerals in Malaysia. Mater. Today Proc. 2023, S2214785323015602. [Google Scholar] [CrossRef] [Scilit]
- Creason, C.G.; Justman, D.; Rose, K.; Montross, S.; Bean, A.; Mark-Moser, M.; Wingo, P.; Sabbatino, M.; Thomas, R.B. A Geo-Data Science Method for Assessing Unconventional Rare-Earth Element Resources in Sedimentary Systems. Nat. Resour. Res. 2023, 32, 855–878. [Google Scholar] [CrossRef] [Scilit]
- Christy, A.G.; Pekov, I.V.; Krivovichev, S.V. The Distinctive Mineralogy of Carbonatites. Elements 2021, 17, 333–338. [Google Scholar] [CrossRef] [Scilit]
- Campeny, M.; Menéndez, I.; Quevedo, L.; Yepes, J.; Casillas, R.; Ahijado, A.; Méndez-Ramos, J.; Mangas, J. Rare Earth Element Distribution on the Fuerteventura Basal Complex (Canary Islands, Spain): A Geochemical and Mineralogical Approach. Solid Earth 2024, 15, 639–656. [Google Scholar] [CrossRef] [Scilit]
- Niu, B.; Zhong, F.; Zhang, Z.; Wang, L.; Yang, S.; Zhao, Q.; Chen, L.; Chen, Y.; Xia, F.; Pan, J. Rare Earth Mineralization in the Lala IOCG Deposit, Southwest China: Insight from the Mineralogy, Geochemistry, and Geochronology. Ore Geol. Rev. 2024, 171, 106169. [Google Scholar] [CrossRef] [Scilit]
- Rezaee, A.; Hale, B.; Santos, R.M.; Chiang, Y.W. Accumulation and Toxicity of Lanthanum and Neodymium in Horticultural Plants (Brassica chinensis L. and Helianthus annuus L.). Can. J. Chem. Eng. 2018, 96, 2263–2272. [Google Scholar] [CrossRef] [Scilit]
- Kotelnikova, A.D.; Rogova, O.B.; Stolbova, V.V. Lanthanides in the Soil: Routes of Entry, Content, Effect on Plants, and Genotoxicity (a Review). Eurasian Soil Sci. 2021, 54, 117–134. [Google Scholar] [CrossRef] [Scilit]
- Zhang, C.; Geng, N.; Dai, Y.; Ahmad, Z.; Li, Y.; Han, S.; Zhang, H.; Chen, J.; Yang, J. Accumulation and Distribution Characteristics of Rare Earth Elements (REEs) in the Naturally Grown Marigold (Tagetes erecta L.) from the Soil. Environ. Sci. Pollut. Res. 2023, 30, 46355–46367. [Google Scholar] [CrossRef] [Scilit] [PubMed]
- Pepi, S.; Sansone, L.; Chicca, M.; Marrocchino, E.; Vaccaro, C. Distribution of Rare Earth Elements in Soil and Grape Berries of Vitis vinifera Cv. “Glera”. Environ. Monit. Assess. 2016, 188, 477. [Google Scholar] [CrossRef] [Scilit] [PubMed]
- Cerutti, C.; Sánchez, R.; Sánchez, C.; Ardini, F.; Grotti, M.; Todolí, J.-L. Prospect on Rare Earth Elements and Metals Fingerprint for the Geographical Discrimination of Commercial Spanish Wines. Molecules 2020, 25, 5602. [Google Scholar] [CrossRef] [Scilit] [PubMed]
- Temerdashev, Z.; Bolshov, M.; Abakumov, A.; Khalafyan, A.; Kaunova, A.; Vasilyev, A.; Sheludko, O.; Ramazanov, A. Can Rare Earth Elements Be Considered as Markers of the Varietal and Geographical Origin of Wines? Molecules 2023, 28, 4319. [Google Scholar] [CrossRef] [Scilit] [PubMed]
- Bronzi, B.; Brilli, C.; Beone, G.M.; Fontanella, M.C.; Ballabio, D.; Todeschini, R.; Consonni, V.; Grisoni, F.; Parri, F.; Buscema, M. Geographical Identification of Chianti Red Wine Based on ICP-MS Element Composition. Food Chem. 2020, 315, 126248. [Google Scholar] [CrossRef] [Scilit] [PubMed]
- Punturo, R.; D’Antone, C.; Pepi, S.; Vaccaro, C. Rare Earth Elements Absorption Patterns in Grapevine “Vitis vinifera L.” Cultivated in Carbonate Terrains (South-Eastern Sicily, Italy). Environ. Earth Sci. 2018, 77, 801. [Google Scholar] [CrossRef] [Scilit]
- Pepi, S.; Grisenti, P.; Sansone, L.; Chicca, M.; Vaccaro, C. Chemical Elements as Fingerprints of Geographical Origin in Cultivars of Vitis vinifera L. Raised on the Same SO4 Rootstock. Environ. Sci. Pollut. Res. 2018, 25, 490–506. [Google Scholar] [CrossRef] [Scilit] [PubMed]
- Augagneur, S.; Médina, B.; Szpunar, J.; Lobiński, R. Determination of Rare Earth Elements in Wine by Inductively Coupled Plasma Mass Spectrometry Using a Microconcentric Nebulizer. J. Anal. At. Spectrom. 1996, 11, 713–721. [Google Scholar] [CrossRef] [Scilit]
- Jakubowski, N.; Brandt, R.; Stuewer, D.; Eschnauer, H.R.; Görtges, S. Analysis of Wines by ICP-MS: Is the Pattern of the Rare Earth Elements a Reliable Fingerprint for the Provenance? Fresenius J. Anal. Chem. 1999, 364, 424–428. [Google Scholar] [CrossRef] [Scilit]
- Hopfer, H.; Nelson, J.; Collins, T.S.; Heymann, H.; Ebeler, S.E. The Combined Impact of Vineyard Origin and Processing Winery on the Elemental Profile of Red Wines. Food Chem. 2015, 172, 486–496. [Google Scholar] [CrossRef] [Scilit] [PubMed]
- Martin, A.E.; Watling, R.J.; Lee, G.S. The Multi-Element Determination and Regional Discrimination of Australian Wines. Food Chem. 2012, 133, 1081–1089. [Google Scholar] [CrossRef] [Scilit]
- Bentlin, F.R.S.; Dos Santos, C.M.M.; Flores, É.M.M.; Pozebon, D. Lanthanides Determination in Red Wine Using Ultrasound Assisted Extraction, Flow Injection, Aerosol Desolvation and ICP-MS. Anal. Chim. Acta 2012, 710, 33–39. [Google Scholar] [CrossRef] [Scilit] [PubMed]
- Tian, L.; Zheng, S.; Zhou, H.; Yang, Y.; Lu, H. Mapping the Origins of Chinese Grape Wine: Unlocking Geographical Regions Through Chemometrics, Stable Isotopes, and Multielement Analysis. J. Food Qual. 2025, 2025, 5556138. [Google Scholar] [CrossRef] [Scilit]
- Coetzee, P.P.; Steffens, F.E.; Eiselen, R.J.; Augustyn, O.P.; Balcaen, L.; Vanhaecke, F. Multi-Element Analysis of South African Wines by ICP-MS and Their Classification According to Geographical Origin. J. Agric. Food Chem. 2005, 53, 5060–5066. [Google Scholar] [CrossRef] [Scilit] [PubMed]
- Orellana, S.; Johansen, A.M.; Gazis, C. Geographic Classification of U.S. Washington State Wines Using Elemental and Water Isotope Composition. Food Chem. X 2019, 1, 100007. [Google Scholar] [CrossRef] [Scilit] [PubMed]
- Mei, H.; Nie, J.; Pan, M.; Rogers, K.M.; Guo, Z.; Li, C.; Shao, S.; Zhang, Y.; Yuan, Y. Geographical Origin Identification of Pujiang Kyoho Grapes in China Using Stable Isotope and Elemental Profiles. Food Control 2024, 162, 110454. [Google Scholar] [CrossRef] [Scilit]
- Aceto, M.; Robotti, E.; Oddone, M.; Baldizzone, M.; Bonifacino, G.; Bezzo, G.; Di Stefano, R.; Gosetti, F.; Mazzucco, E.; Manfredi, M.; et al. A Traceability Study on the Moscato Wine Chain. Food Chem. 2013, 138, 1914–1922. [Google Scholar] [CrossRef] [Scilit] [PubMed]
- Dos Santos, C.E.; Debastiani, R.; Souza, V.S.; Peretti, D.E.; Jobim, P.F.; Yoneama, M.L.; Amaral, L.; Dias, J.F. The Influence of the Winemaking Process on the Elemental Composition of the Marselan Red Wine. J. Sci. Food Agric. 2019, 99, 4642–4650. [Google Scholar] [CrossRef] [Scilit] [PubMed]
- Magdas, D.A.; Marincas, O.; Cristea, G.; Feher, I.; Vedeanu, N. REEs—A Possible Tool for Geographical Origin Assessment? Environ. Chem. 2020, 17, 148–157. [Google Scholar] [CrossRef] [Scilit]
- Tatár, E.; Mihucz, V.G.; Virág, I.; Rácz, L.; Záray, G. Effect of Four Bentonite Samples on the Rare Earth Element Concentrations of Selected Hungarian Wine Samples. Microchem. J. 2007, 85, 132–135. [Google Scholar] [CrossRef] [Scilit]
- Temerdashev, Z.; Abakumov, A.; Khalafyan, A.; Bolshov, M.; Lukyanov, A.; Vasilyev, A.; Gipich, E. The Influence of the Soil Profile on the Formation of the Elemental Image of Grapes and Wine of the Cabernet Sauvignon Variety. Molecules 2024, 29, 2251. [Google Scholar] [CrossRef] [Scilit] [PubMed]
- Temerdashev, Z.; Abakumov, A.; Bolshov, M.; Khalafyan, A.; Gipich, E.; Lukyanov, A.; Vasilev, A. Impact of Soil Profile Mineralogy on the Elemental Composition of Chardonnay Grapes and Wines in the Anapa Region. Beverages 2025, 12, 1. [Google Scholar] [CrossRef] [Scilit]
- Özen, Y. Distribution and Origin of Rare Earth Elements (REEs) in Topsoils and Soil Profiles of Southern Konya (Turkey): Implication for Controls on the Dynamics of REEs in Soils and Bedrocks. CATENA 2024, 246, 108352. [Google Scholar] [CrossRef] [Scilit]
- Wang, L.; Christakos, G.; Wu, C.; Wu, J. Spatial Variability Assessment of La and Nd Concentrations in Coastal China Soils Following 1000 Years of Land Reclamation. J. Soils Sediments 2020, 20, 1651–1661. [Google Scholar] [CrossRef] [Scilit]
- Zhang, Y.; Su, B.; Shao, S.; Li, N.; Jiao, H.; Dan, Y.; Zhang, H.; Gao, C. Geochemical Behavior and Source Analysis of Rare Earth Elements in Intensive Agriculture Soils through High-Resolution Sampling. Sci. Total Environ. 2023, 905, 167777. [Google Scholar] [CrossRef] [Scilit] [PubMed]
- ÇiMen, O.; Koç, Ş.; Sari, A. Rare Earth Element (REE) Geochemistry and Genesis of Oil Shales Around Dağhacilar Village, Göynük-Bolu, Turkey. Oil Shale 2013, 30, 419–440. [Google Scholar] [CrossRef] [Scilit]
- Rudnick, R.L.; Gao, S. Composition of the Continental Crust. In Treatise on Geochemistry; Elsevier: Oxford, UK, 2003; pp. 1–64. ISBN 978-0-08-043751-4. [Google Scholar]
- Pourmand, A.; Dauphas, N.; Ireland, T.J. A Novel Extraction Chromatography and MC-ICP-MS Technique for Rapid Analysis of REE, Sc and Y: Revising CI-Chondrite and Post-Archean Australian Shale (PAAS) Abundances. Chem. Geol. 2012, 291, 38–54. [Google Scholar] [CrossRef] [Scilit]
- Li, L.; Wu, J.; Lu, J.; Zhang, X.; Xu, J. Geochemical Signatures and Human Health Risk Evaluation of Rare Earth Elements in Soils and Plants of the Northeastern Qinghai-Tibet Plateau, China. J. Arid Land 2022, 14, 1258–1273. [Google Scholar] [CrossRef] [Scilit]
- Kabata-Pendias, A. Trace Elements in Soils and Plants, 4th ed.; CRC Press: Boca Raton, FL, USA, 2011; ISBN 978-1-4200-9368-1. [Google Scholar]
- Sager, M.; Wiche, O. Rare Earth Elements (REE): Origins, Dispersion, and Environmental Implications—A Comprehensive Review. Environments 2024, 11, 24. [Google Scholar] [CrossRef] [Scilit]
- Bertoldi, D.; Larcher, R.; Bertamini, M.; Otto, S.; Concheri, G.; Nicolini, G. Accumulation and Distribution Pattern of Macro- and Microelements and Trace Elements in Vitis vinifera L. Cv. Chardonnay Berries. J. Agric. Food Chem. 2011, 59, 7224–7236. [Google Scholar] [CrossRef] [Scilit] [PubMed]
- Amorós, J.A.; Pérez-de-los Reyes, C.; García Navarro, F.J.; Bravo, S.; Chacón, J.L.; Martínez, J.; Jiménez Ballesta, R. Bioaccumulation of Mineral Elements in Grapevine Varieties Cultivated in “La Mancha”. J. Plant Nutr. Soil Sci. 2013, 176, 843–850. [Google Scholar] [CrossRef] [Scilit]
- Vaudour, E. The Quality of Grapes and Wine in Relation to Geography: Notions of Terroir at Various Scales. J. Wine Res. 2002, 13, 117–141. [Google Scholar] [CrossRef] [Scilit]
- Mladenova, E.; Voyslavov, T.; Bakardzhiyski, I.; Karadjova, I. From the Soil to the Wine—Elements’ Migration in Monovarietal Bulgarian Wines. Molecules 2025, 30, 475. [Google Scholar] [CrossRef] [Scilit] [PubMed]
- Pepi, S.; Chicca, M.; Piroddi, G.; Tassinari, R.; Vaccaro, C. Geographical Origin of Vitis vinifera Cv. Cannonau Established by the Index of Bioaccumulation and Translocation Coefficients. Environ. Monit. Assess. 2019, 191, 436. [Google Scholar] [CrossRef] [Scilit] [PubMed]
- Nardin, R.; Tamasi, G.; Baglioni, M.; Bisozzi, F.; Consumi, M.; Costa, J.; Fattori, G.; Tozzi, C.; Riccaboni, A.; Rossi, C. Determination of Elemental Content in Vineyard Soil, Leaves, and Grapes of Sangiovese Grapes from the Chianti Region Using ICP-MS for Geographical Identification. ACS Food Sci. Technol. 2024, 4, 2585–2599. [Google Scholar] [CrossRef] [Scilit] [PubMed]
- Protano, G.; Rossi, S. Relationship between Soil Geochemistry and Grape Composition in Tuscany (Italy). J. Plant Nutr. Soil Sci. 2014, 177, 500–508. [Google Scholar] [CrossRef] [Scilit]
- Blotevogel, S.; Schreck, E.; Audry, S.; Saldi, G.D.; Viers, J.; Courjault-Radé, P.; Darrozes, J.; Orgogozo, L.; Oliva, P. Contribution of Soil Elemental Contents and Cu and Sr Isotope Ratios to the Understanding of Pedogenetic Processes and Mechanisms Involved in the Soil-to-Grape Transfer (Soave Vineyard, Italy). Geoderma 2019, 343, 72–85. [Google Scholar] [CrossRef] [Scilit]
- Bora, F.-D.; Bunea, C.-I.; Rusu, T.; Pop, N. Vertical Distribution and Analysis of Micro-, Macroelements and Heavy Metals in the System Soil-Grapevine-Wine in Vineyard from North-West Romania. Chem. Cent. J. 2015, 9, 19. [Google Scholar] [CrossRef] [Scilit] [PubMed]
- Hao, X.; Gao, F.; Wu, H.; Song, Y.; Zhang, L.; Li, H.; Wang, H. From Soil to Grape and Wine: Geographical Variations in Elemental Profiles in Different Chinese Regions. Foods 2021, 10, 3108. [Google Scholar] [CrossRef] [Scilit] [PubMed]
- Censi, P.; Saiano, F.; Pisciotta, A.; Tuzzolino, N. Geochemical Behaviour of Rare Earths in Vitis Vinifera Grafted onto Different Rootstocks and Growing on Several Soils. Sci. Total Environ. 2014, 473–474, 597–608. [Google Scholar] [CrossRef] [Scilit] [PubMed]
- Tomoko, V. Thermo Scientific iCAP RQ ICP-MS: Typical Limits of Detection. Available online: https://tools.thermofisher.com/content/sfs/brochures/TN-43427-ICP-MS-Detection-Limits-iCAP-RQ-TN43427-EN.pdf (accessed on 4 March 2023).
- Abakumov, A.; Titarenko, V.; Khalafyan, A.; Temerdashe, Z.; Kaunova, A. Grapes Cultivar Assignments Using the Identified Elements-Markers of Grape Berry and Its Different Constituent Parts. Amalitika Kontrol 2019, 23, 61–70. [Google Scholar] [CrossRef] [Scilit]
- Temerdashev, Z.A.; Abakumov, A.G.; Bolshov, M.A.; Brezhneva, Y.V.; Gipich, E.Y. The Effect of Organic Fining Agents on the Elemental Composition of Young Cabernet Sauvignon Wine. J. Food Compos. Anal. 2025, 147, 108055. [Google Scholar] [CrossRef] [Scilit]
- Hill, T.; Lewicki, P. Statistics Methods and Applications, 1st ed.; StatSoft: Tulsa, OK, USA, 2007. [Google Scholar]
- Hammer, Ø.; Harper, D.A.T.; Ryan, P.D. PAST: Paleontological statistics software package for education and data analysis. Palaeontol. Electron. 2001, 4, 9. [Google Scholar]

Disclaimer/Publisher’s Note: The statements, opinions and data contained in all publications are solely those of the individual author(s) and contributor(s) and not of MDPI and/or the editor(s). MDPI and/or the editor(s) disclaim responsibility for any injury to people or property resulting from any ideas, methods, instructions or products referred to in the content. |
© 2026 by the authors. Licensee MDPI, Basel, Switzerland. This article is an open access article distributed under the terms and conditions of the Creative Commons Attribution (CC BY) license.