


Abstract
Supportive therapy with haemoadsorption is gaining popularity in critically ill patients, with the aim of reducing overinflammation triggered by the cytokine storm. The haemoadsorbers used are not specific for cytokines and also bind antibiotics. The aim of this study was to develop and validate a simple analytical method for the simultaneous determination of selected antibiotics and to develop an in vitro model for the quantification of their binding to the CytoSorb® haemoadsorber under conditions simulating sepsis. Imipenem (IMI), amoxicillin (AMO), cefepime (CEF), meropenem (MERO), vancomycin (VAN) and piperacillin (PIP) were measured in bovine plasma via precipitation with acetonitrile and liquid–liquid extraction with dichloromethane. The aqueous phase was collected and analysed using a C18 HPLC system under gradient conditions, with modulation of organic solvent content and mobile phase pH, and detection performed using a UV/Vis detector. The method was linear (r2 > 0.982) across investigated analytical ranges (1.0–100.0 µg/mL for AMO and VAN, 1.0–75.0 µg/mL for CEF, MERO and PIP and 2.5–100.0 µg/mL for IMI). Intra- and inter-day precision did not exceed 14% and accuracy ranged from 85.8% to 108.5%. Using the in vitro model, we showed that CytoSorb® significantly removed VAN and PIP, but not MERO. Further clinical studies are needed to establish the clinical significance of these findings and their impact on antibiotic exposure.
1. Introduction
Antibiotics are widely used drugs, and their use in intensive care units (ICUs) can be up to ten times higher than in other departments [1]. Up to 64% of patients treated in the ICU receive antibiotics [2]. The pharmacokinetic and pharmacodynamic issues are altered in critically ill patients, making therapy optimisation very difficult [1]. At the pharmacokinetic level, the greatest changes occur in the volume of distribution and drug clearance. The main reasons for the altered volume of distribution are (i) altered capillary permeability, which increases the interstitial space; (ii) large quantities of intravenous fluids, which increase the volume of distribution of hydrophilic drugs; (iii) hypoalbuminemia, which mainly affects drugs that are highly bound to plasma proteins. Most antibiotics are excreted through the kidneys, and critically ill patients may experience either increased or decreased excretion of antibiotics [1,3]. Antibiotics have different pharmacokinetic/pharmacodynamic (PK/PD) targets, but because of all these changes, it is difficult to achieve them in critically ill patients [1]. Moreover, critically ill patients may also be treated with dialysis, extracorporeal membrane oxygenation (ECMO), or even haemoadsorption, which can make drug dosing even more difficult.
Rapid reduction in inflammatory mediators in patients with sepsis is essential for achieving improved circulatory stability and, consequently, better survival. Recently, the CytoSorb® haemoadsorber has been used for the purpose of extracorporeal elimination. It is a porous, biocompatible polymer with properties that enable it to bind many hydrophobic molecules with a molecular weight of up to 55 kDa, which includes most cytokines. It removes these molecules based on size and hydrophobic interactions, and the removal is concentration-dependent. The haemoadsorber can be used alone or in combination with renal replacement therapy, cardiopulmonary bypass, or ECMO. Treatment duration ranges from 6 h to 7 days, with the manufacturer recommending that the haemoadsorber be changed every 24 h [4]. CytoSorb® binds cytokines released during sepsis, as well as free haemoglobin, myoglobin, bilirubin, bile acids, bioactive lipids, light chains of immunoglobulins, some toxins, bacterial endotoxins, and other toxic metabolites from the blood. In addition, the haemoadsorber can also affect the removal of drugs from the blood [5]. In vitro studies have shown that vancomycin, teicoplanin, and aminoglycosides are partially or completely removed [6]. There is limited information on optimising antibiotic dosing in patients with sepsis, treated with haemoadsorption [7]. It should be noted that CytoSorb® is also used to treat poisoning with drugs such as ticagrelor and venlafaksine [8,9,10].
Current analytical methods for the determination of antibiotics in biological samples primarily rely on LC-UV/Vis and LC-MS/MS techniques; however, LC-MS/MS remains limited to specialised laboratories and is not yet routinely available in all clinical settings. Most chromatographical analytical methods developed to date have analysed only two or three antibiotics simultaneously, which was insufficient for our purposes [11,12,13,14,15]. Some methods have been developed to determine six or even twelve antibiotics simultaneously, but none included all the antibiotics required for our study [11,15]. The aim of this study was to develop and validate a simple analytical method for the simultaneous determination of the most commonly used antibiotics in ICU therapy, namely imipenem (IMI), amoxicillin (AMO), cefepime (CEF), meropenem (MERO), vancomycin (VAN), and piperacillin (PIP). The method was specifically developed and validated for application in an in vitro study investigating antibiotic binding to the CytoSorb® haemoadsorber using bovine blood. Furthermore, an in vitro model was developed to evaluate drug binding to the CytoSorb® haemoadsorber and was applied to selected antibiotics.
2. Results and Discussion
2.1. Development of Sample Preparation Method
We tested three different methods of sample preparation: (i) protein precipitation with acetonitrile (ACN) (plasma and working solutions: ACN, 1:3 v/v), drying and reconstitution, (ii) protein precipitation with HClO4 followed by extraction in ethyl acetate, and (iii) protein precipitation with ACN (plasma and working solutions: ACN, 1:1 v/v) and extraction in dichloromethane. The baseline method was protein precipitation with ACN, a drying and reconstitution method, which resulted in poor accuracy at low concentrations and nonlinearity across the concentration range. We found that analyte losses occurred during the drying process, which were particularly pronounced at low concentrations. To overcome reduced analyte response and interfering peaks, we decided to combine protein precipitation with an additional clean-up step using organic solvents [16]. We used a method involving protein precipitation with HClO4 and extraction in ethyl acetate followed by direct analyses of aqueous phase. However, this method was also ineffective, as it caused a loss of peak shape and reduced analyte responses in the chromatogram. The final method, with protein precipitation with ACN, extraction in dichloromethane and direct analysis of aqueous phase, enabled good separation of analytes and appropriate sensitivity to a rich target concentration range. In previously published studies analysing six and twelve antibiotics, respectively, sample preparation was performed using protein precipitation and dilution [11,15], which represents simpler approaches compared to our method. The addition clean-up step included in our method most likely influenced the analytical range, as lower concentrations of most studied antibiotics could be determined compared with the literature methods [11,15]. Furthermore, although the sample preparation is more complex, the analytical run time of our method is shorter by 5–7 min compared to reported methods [11,15], thereby increasing sample throughput. We therefore conclude that developed sample preparation improves analytical selectivity, enabling reliable analyte quantification, and represents a comparable alternative for multi-analyte determination.
2.2. Development of Chromatographic Method
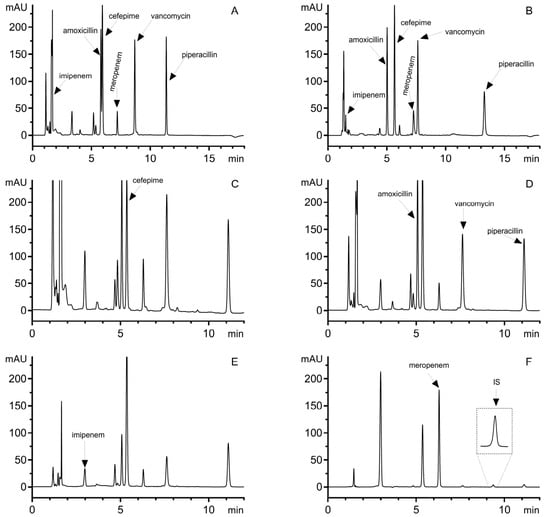
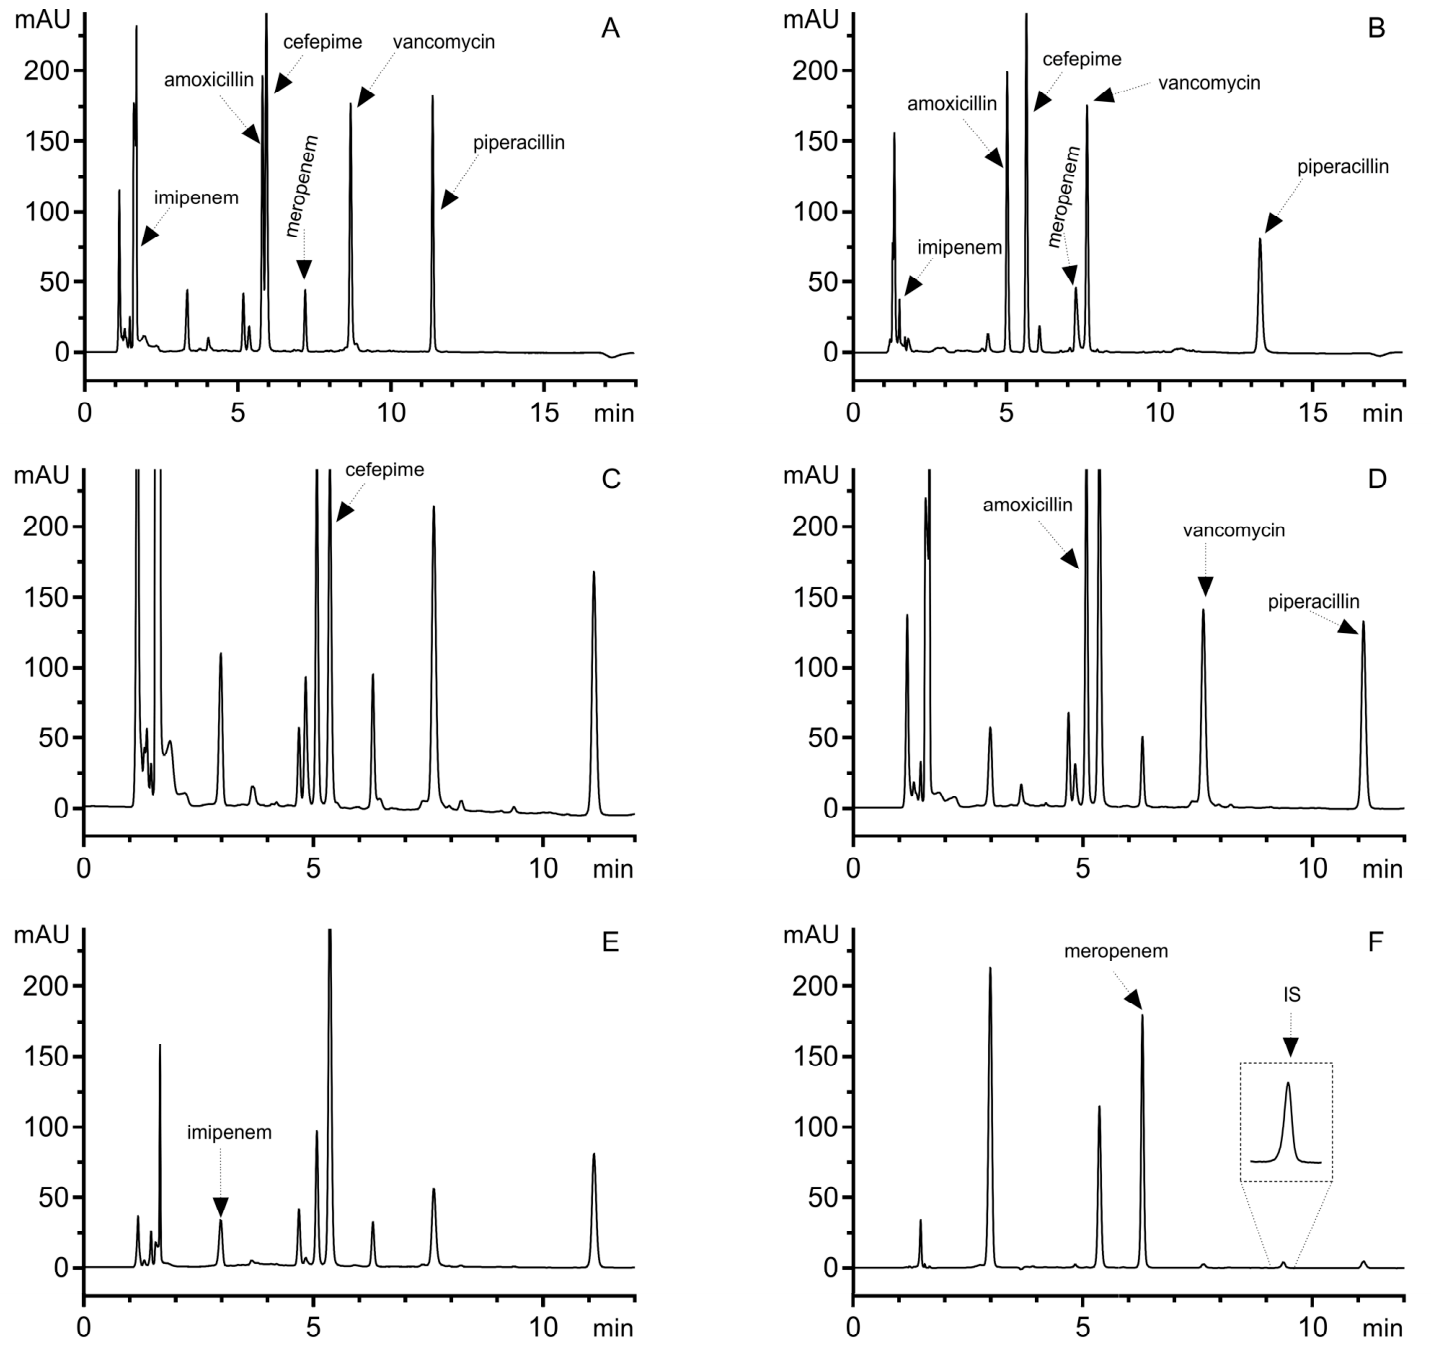
Several reversed-phase analytical columns (Eclipse XDB C18 (4.6 × 150 mm, 5 μm), Eclipse XDB C8 (4.6 × 150 mm, 5 μm), Waters XTerra RP18 (4.6 × 150 mm, 5 μm), Phenomenex Luna C18 (4.6 × 150 mm, 3 μm) and mobile phases (0.5% H3PO4 at pH 7.0 with ACN (MP1), 0.5% H3PO4 at pH 3.0 with ACN (MP2), A: 0.5% H3PO4 at pH 7.0, B: ACN + 0.5% H3PO4 at pH 3.0 (1:3, v/v) (MP3)), were tested to optimise the retention time, chromatographic peak shape, width and separation of IMI, AMO, CEF, MERO, VAN and PIP from endogenous peaks and internal standard (IS). Optimal separation was achieved on the Eclipse XDB C18 using MP3 under pH gradient mobile phase (Figure 1). With other stationary phases there was no separation of analytes, a poor baseline, asymmetrical chromatographic peaks, and low analyte responses.
Figure 1.
Chromatographic method development and optimisation for the determination of selected antibiotics in plasma. (A) Gradient elution at mobile phase pH 7.0; (B) gradient elution at pH 3.0; (C–F) final method based on a combined organic solvent and pH gradient. Detection was performed at 220 nm for cefepime (C), 230 nm for amoxicillin, piperacillin, and vancomycin (D), 245 nm for imipenem (E), and 300 nm for meropenem and the internal standard (F). Plasma samples were spiked at 100 µg/mL.
No separation between AMO and CEF was observed with gradient mobile phase with pH 7.0 (Figure 1A), and no adequate separation between MERO and VAN was observed with gradient mobile phase with pH 3.0 (Figure 1B). Furthermore, with pH 3.0, the responses were only half as large as with pH 7.0. Also, the time taken to separate peaks became longer. After reviewing the results obtained with pH 7.0 and pH 3.0 and the literature [17], we realised that we could influence the separation of the chromatographic peaks by changing the pH of the mobile phases. We decided to use a pH gradient as well as gradient of organic solvent (MP3). The final method was obtained by optimising both gradients—organic solvent composition and mobile phase pH—as well as the detection wavelengths, resulting in adequate analyte separation without co-elution, short run time, and appropriate sensitivity. Figure 1C–F present the final separation method at different wavelengths, where we achieved the best responses, optimal peak separation, and appropriate accuracy and repeatability. Figure 1C shows the chromatographic peak for CEF at a wavelength of 220 nm; Figure 1D shows the separation of AMO, VAN and PIP at 230 nm; Figure 1E shows the separation of IMI at 245 nm; and Figure 1F shows the separation of MERO and IS (with magnification). Chromatograms at the lower limit of quantification are provided in the Supplementary Material (Figure S1). The use of a pH gradient represents a key methodological advantage, enabling a substantial reduction in run time compared with isocratic conditions at pH 3.0 (~14 min).
2.3. Method Validation
2.3.1. Linearity, Lower Limit of Quantification and Concentration Range
The developed method was aimed to cover the analytes reference ranges. The reference range for VAN is 10 to 20 µg/mL, but to determine the effectiveness of the treatment, it is necessary to consider the area under the curve (AUC), which should be between 400 and 600 mg·h/L [18]. IMI, AMO, CEF, MERO and PIP are beta-lactam antibiotics with time-dependent PK/PD targets. The effectiveness of time-dependent antibiotics is defined as the time in which free concentration is above the minimal inhibitory concentration (MIC). Therapeutic monitoring of plasma concentrations of beta-lactam antibiotics is rare, limited to research purposes and individual institutions. As a result, and due to the wide spectrum of pathogens they treat, accurate reference values are poorly established and usually very broad [19]. The developed method is linear from 1.0 to 75.0 µg/mL for CEF, MERO and PIP, from 1.0 to 100.0 µg/mL for AMO and VAN, and from 2.5 to 100.0 µg/mL for IMI. The coefficient of determination ranged from 0.982 to 1.000. The lower limit of quantification (LLOQ) was 1.0 µg/mL for AMO, CEF, MERO, VAN and PIP, and 2.5 µg/mL for IMI (Table 1). Similar results were obtained in human plasma as in bovine plasma (Supplementary Material, Table S1), indicating promising initial performance; however, additional validation studies are required before the method can be applied to human samples.
Table 1.
Bioanalytical method validation parameters (accuracy, precision, linearity, range, and LLOQ) for the determination of selected antibiotics in bovine plasma.
The obtained method ranges and sensitivity are comparable with the literature where the simultaneous determination of at least six or more antibiotics was used [11,15].
2.3.2. Precision and Accuracy
The obtained intra- and inter-day precision of selected antibiotics was within the target limits, with values not exceeding 14.0% for intra-day and 14.3% for inter-day precision, respectively. The accuracy ranged between 85.8 and 109% for all of the analytes (Table 1).
2.3.3. Selectivity and Carry-Over
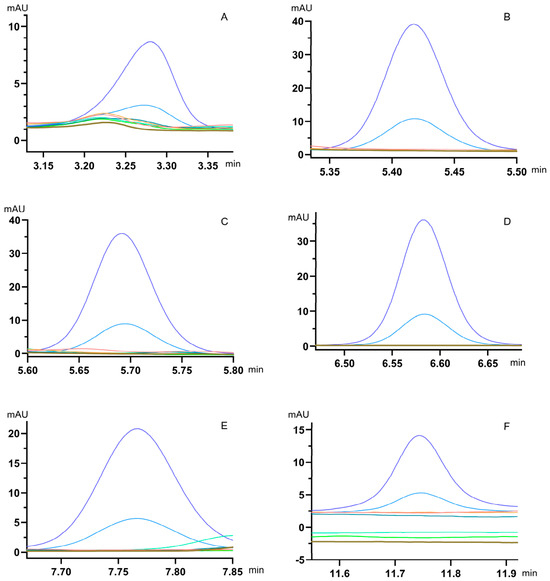
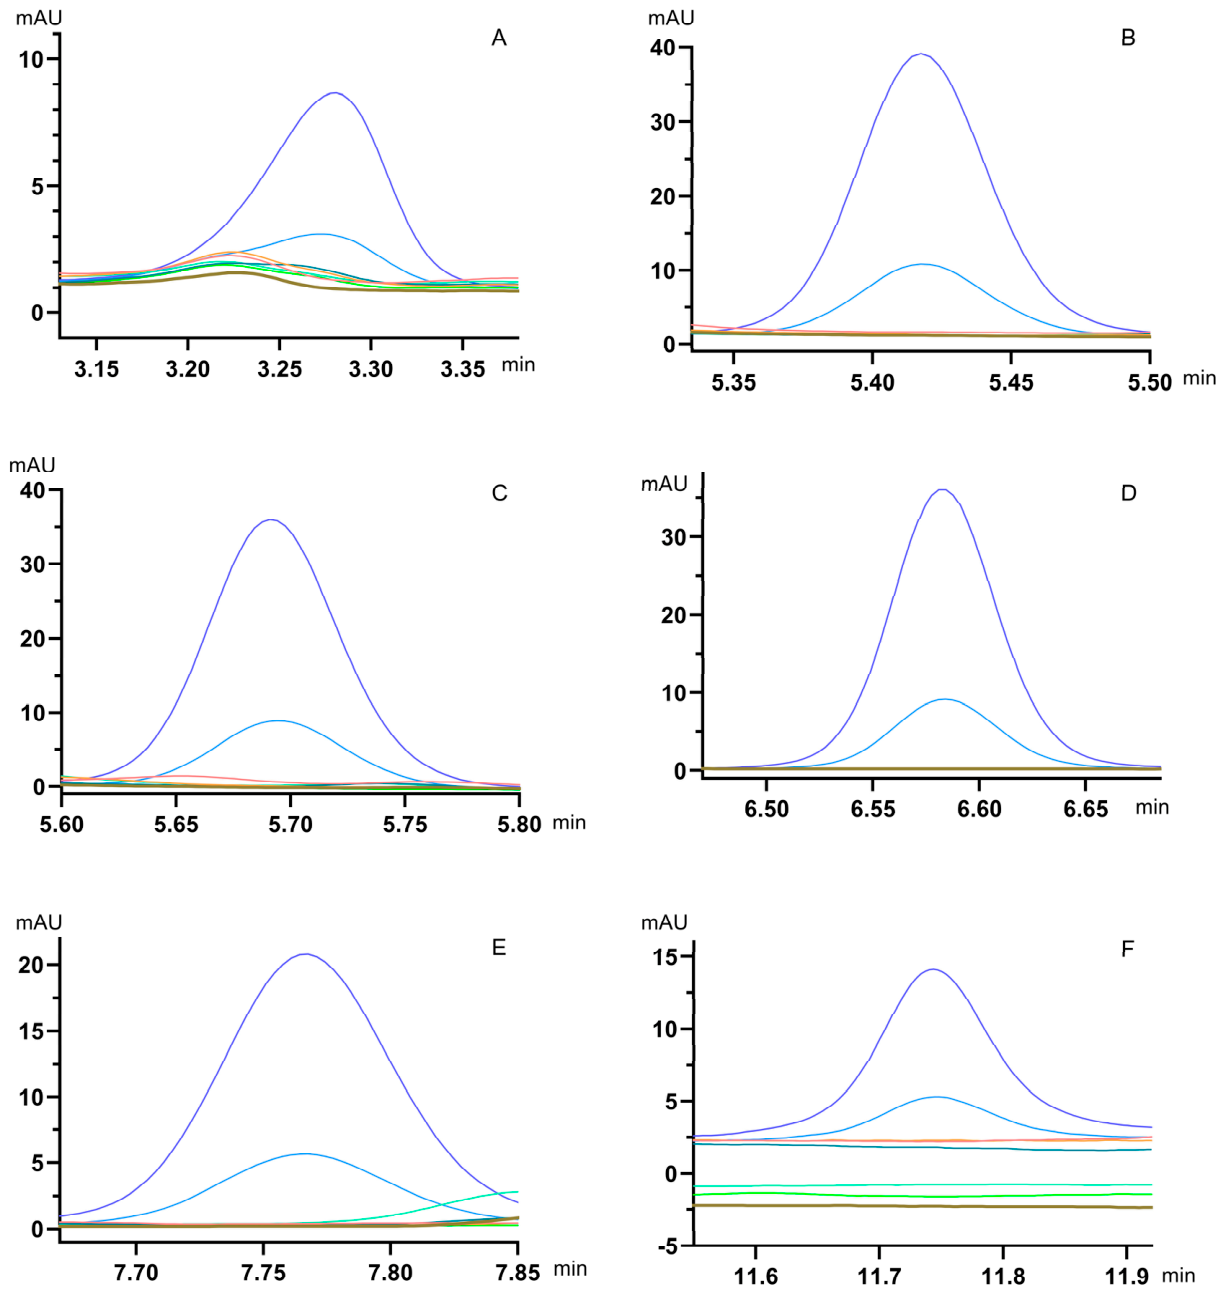
The selectivity study demonstrated the absence of interfering peaks in blank plasma samples at the retention times of analytes and IS (Figure 2). Additionally, no carry-over was observed.
Figure 2.
Selectivity assessment of the developed HPLC–UV method. Chromatograms of six individual blank plasma samples and plasma samples spiked with antibiotics at 2.5 µg/mL and 10 µg/mL are presented for (A) imipenem (245 nm), (B) amoxicillin (230 nm), (C) cefepime (220 nm), (D) meropenem (300 nm), (E) vancomycin (230 nm), and (F) piperacillin (230 nm).
2.3.4. Freeze–Thaw, Long-Term and Postpreparative Stability
The freeze–thaw stability study showed that the measured concentrations for IMI, AMO, CEF, MER, VAN, and PIP ranged from 94.0 to 109.6%, 89.6–99.9%, 94.5–99.9%, 92.9–102.6%, 86.3–96.3%, and 93.0–99.2% of nominal values, respectively, indicating that freeze–thaw cycles did not significantly affect analyte concentrations.
Long-term stability, evaluated over one week at −70 °C, confirmed that the antibiotics remained stable under the applied storage conditions. The measured concentrations for IMI, AMO, CEF, MER, VAN, and PIP ranged from 92.4 to 97.5%, 87.2–103.2%, 104.8–106.2%, 84.1–91.6%, 93.1–103.9%, and 108.4–110.1% of nominal values, respectively.
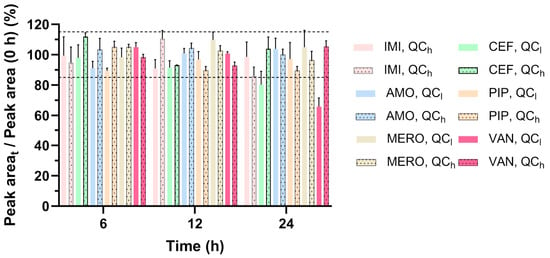
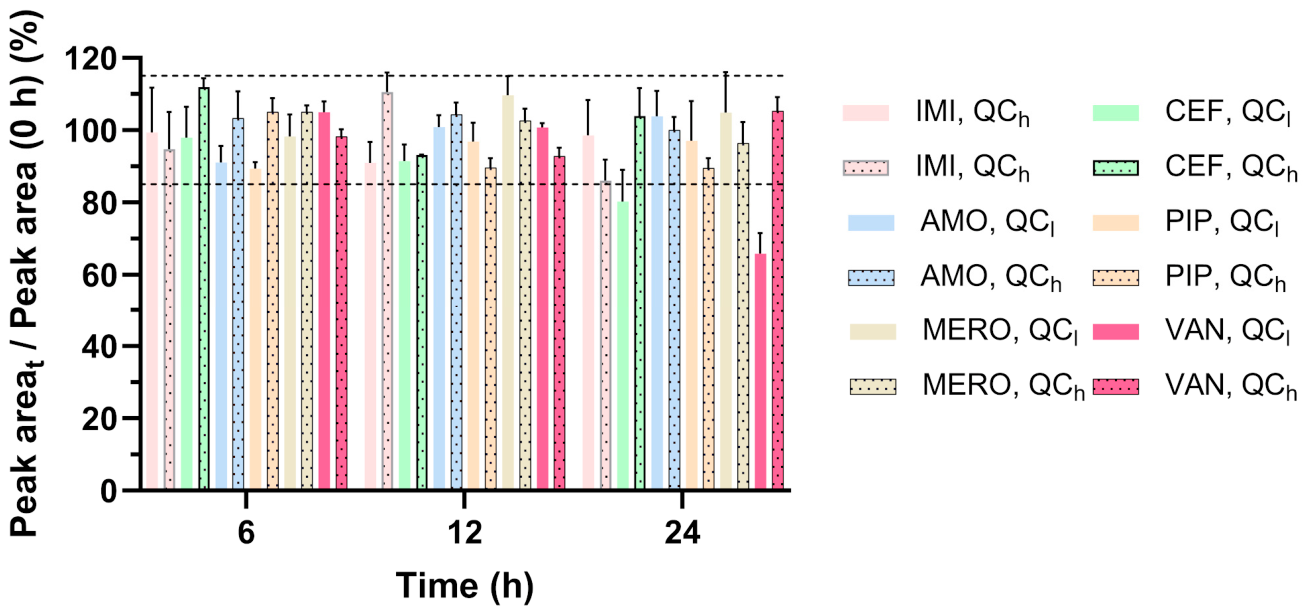
The postpreparative stability was examined by keeping replicates of QC samples at 5 °C in autosampler. Changes in the mean peak area after 6 h, 12 h and 24 h did not exceed 13.9%, regardless of the concentration of CEF and VAN. QCl samples of CEF and VAN were stable for only 12 h. The results of the stability study are shown in Figure 3.
Figure 3.
Postpreparative stability of antibiotics in autosampler at 5 °C and two concentrations (QCl and QCh). Dashed lines represent 15% deviation.
2.4. Method Application
By conducting an in vitro study, we aimed to mimic in vivo conditions as closely as possible by simulating those found in septic patients (Hct 30% and Alb 20 g/L). In a similar study by C. König and colleagues [20], antimicrobial agents were dissolved in saline, albumin solution, and reconstituted blood. The prepared solutions were pumped through the CytoSorb® cartridge. Unlike the aforementioned study, which did not account for the conditions of septic patients, our in vitro study is much simpler and therefore more practical for determining the binding of antimicrobial and other agents in vitro. Additionally, our experiment requires only small amounts of CytoSorb® adsorber beads and blood. The chosen in vitro conditions allowed measurement of binding over 6 h, corresponding to those used in clinical practice. In the blank experiment (i.e., in the absence of antibiotics and Cytosorb®), haemolysis was 0.3% at baseline and 0.6% after 6 h. In the experiment with antibiotics, and in the experiment with antibiotics and CytoSorb®, haemolysis after 6 h increased to 0.8%. From these results, we concluded that haemolysis did not affect the course of the experiment. Albumin levels decreased by 19% after a 2 h experiment following the addition of CytoSorb®. The concentrations of antibiotics added to the blood were selected according to therapeutic concentrations.
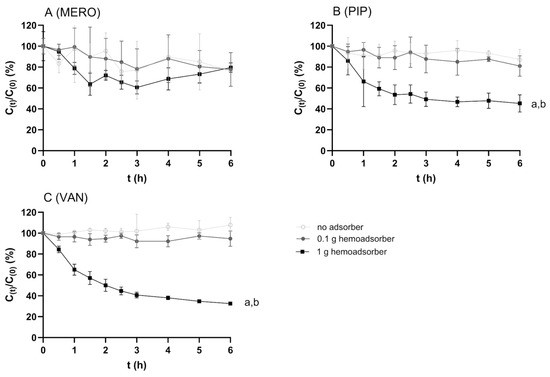
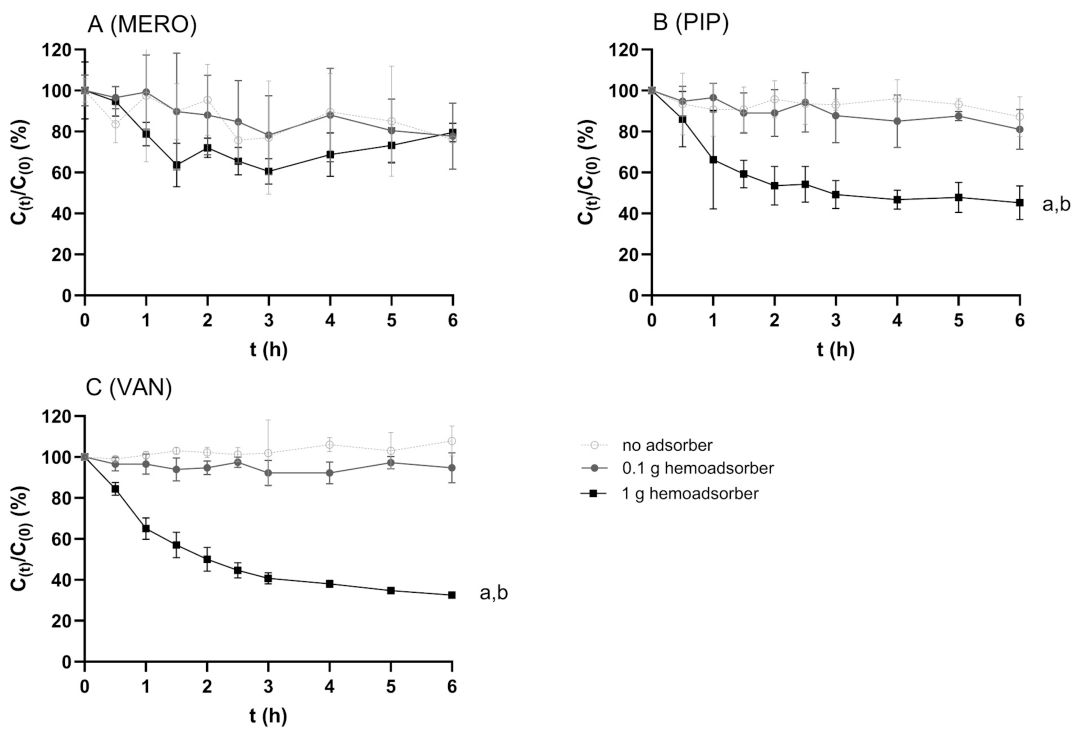
Figure 4 shows the binding of MERO, PIP, and VAN to CytoSorb® at two different haemoadsorber masses. Significant differences in binding were observed for PIP and VAN between 0.1 g and 1 g, as well as between 1 g and 0 g of CytoSorb®, whereas MERO showed no measurable binding.
Figure 4.
Binding of selected antimicrobial agents following the addition of different amounts of CytoSorb® adsorber beads. a, b denote statistically significant differences (p < 0.05) between concentration ratios at 6 h under the following conditions: no CytoSorb® (a) and 0.1 g CytoSorb® (b).
There are scarce data available on in vitro antibiotic binding to haemoadsorbers. Published clinical [21,22,23] and in vitro [20] data on MERO are consistent with the results of our study, demonstrating negligible binding of MERO to CytoSorb®. Our findings are also in agreement with clinical data on VAN, indicating significant adsorption to CytoSorb®, which may require dose adjustment or replacement [6,7]. In contrast, clinical studies suggest that PIP does not significantly bind to CytoSorb® [22,23], whereas our in vitro results indicate measurable binding. Despite this discrepancy, in vitro models provide a rapid and useful approach for estimating drug adsorption and can support the design of subsequent clinical studies. To ensure appropriate management of patients receiving concomitant therapy with CytoSorb® and antibiotics, further clinical studies are warranted.
2.5. Limitations
This study has several limitations that should be considered when interpreting the results. First, the sample preparation procedure is relatively labour-intensive and involves the use of organic solvents, which may limit its suitability for routine laboratory applications and require appropriate safety precautions. On the other hand, the chromatographic method itself is rapid and selective, enabling reliable quantification of the investigated antibiotics in complex biological matrices.
Second, the in vitro adsorption model was performed using bovine rather than human blood due to ethical and practical approaches. Differences in plasma protein composition and other blood constituents between bovine and human blood may influence drug binding and adsorption characteristics, potentially affecting the extrapolation of the results to clinical settings.
Furthermore, the adsorption experiments were conducted in a static beaker-based system rather than in a dynamic extracorporeal circulation loop that more closely resembles clinical haemoadsorption therapy. Consequently, the entire blood volume was exposed to the CytoSorb® adsorbent immediately, whereas in clinical practice, blood is continuously circulated through the cartridge. Nevertheless, we attempted to mimic septic conditions by adjusting albumin concentrations to 20 g/L and haematocrit to 30%, values commonly observed in critically ill septic patients. In addition, typical blood flow rates through the CytoSorb® cartridge are approximately 200 mL/min, resulting in rapid and repeated exposure of the circulating blood volume to the adsorbent. Therefore, despite the simplified experimental setup, we believe that our model provides a reasonable approximation of antibiotic adsorption under clinically relevant conditions and allows comparative assessment of drug binding to the CytoSorb® haemoadsorber.
3. Materials and Methods
3.1. Chemicals and Reagents
IMI, AMO, CEF, MERO, VAN, PIP, acetonitrile, 2-(N-morpholino)ethansulfonic acid (MES), bovine serum albumin, and bromocresol green were supplied by Sigma-Aldrich (Steinheim, Germany). IS, tetracycline chloride, was supplied by Biosynth Carbosynth (Berkshire, UK). In the in vitro experiment, bovine blood was spiked with antibiotic powder for concentrate for solution for infusion. We used Piperacillin/tazobactam Mylan 4 g/0.5 g (Viatris Sante, Canonsburg, PA, USA), Vancomycin Apta 500 mg (Apta Medica, Ljubljana, Slovenia), and Meropenem AptaPharma 500 mg (Apta Medica, Ljubljana, Slovenia). The haemoadsorbent was CytoSorb® 300 (CytoSorbents Europe, Berlin, Germany). In addition, 5 M NaOH, 1 M NaOH, ethyl acetate, 70% perchloric acid, 25% ammonia water solution, and buffer solutions were purchased from Merck (Darmstadt, Germany). Phosphoric acid (85%) and dichloromethane were from Supelco (Bellefonte, PA, USA). Acetonitrile (ACN) was HPLC grade and all other chemicals were at least analytical grade. Water was purified using a Milli-Q Advantage A10 (Millipore Corp., Billerica, MA, USA). Bovine blood was obtained from the local slaughterhouse.
3.2. Instrumentation
Chromatographic analyses were performed on an Agilent 1100 series HPLC system (Agilent, Waldbronn, Germany), comprising a quaternary pump solvent delivery system, an autosampler, and a diode array detector. Separation was carried out on a ZORBAX (Agilent Technologies, Palo Alto, CA, USA) Eclipse XDB C18 column (5 μm, 150 mm × 4.6 mm) coupled to a Phenomenex C18 guard precolumn (5 μm, 4 mm × 3 mm), using gradient elution. The mobile phase consisted of 0.5% phosphoric acid at pH 7 (mobile phase A) and acetonitrile with 0.5% phosphoric acid at pH 3 (1:3, v/v) (mobile phase B), with the following gradient steps (time [min], % B): (0.0, 0), (6.0, 50), (8.0, 83), (9.0, 83), (11.0, 100), (12.0, 100), (12.1, 0). The mobile phase flow rate was 1.3 mL/min. The column temperature was set to 40 °C. A 20 μL sample was injected, and analytes were detected with the diode array detector set at wavelengths of 220 nm (CEF), 230 nm (AMO, VAN, PIP), 245 nm (IMI) and 300 nm (MERO and IS).
3.3. Standard Solution, Calibration Standards and Quality Control Samples
A stock solution with a concentration of 1 mg/mL, as well as working solutions, calibration, and quality control (QC) samples of IMI, AMO, CEF, MERO, VAN, PIP, and IS (tetracycline), were prepared in 250 mM MES at pH 7. All solutions were freshly prepared each day and kept on ice until analysis. Calibrators for AMO and VAN were prepared at concentrations of 1, 2.5, 5, 10, 25, 50, 75, and 100 µg/mL; for IMI at 2.5, 5, 10, 25, 50, 75, and 100 µg/mL; and for CEF, MERO, and PIP at 1, 2.5, 5, 10, 25, 50, and 75 µg/mL. Similarly, QC samples of IMI, AMO, CEF, MERO, VAN, and PIP at low, medium, and high concentrations were prepared at 3, 20, and 70 µg/mL, respectively. The concentration of IS was 75 µg/mL.
3.4. Sample Preparation
For the calibration curve, 20 μL of the working solution of each analyte, making a total mixture of 120 μL, 20 μL of the IS solution, and 140 μL of drug-free plasma were combined. For in vitro binding analysis, 120 μL of 250 mM MES at pH 7.0, 20 μL of IS solution, and 140 μL of plasma were mixed. In the next step, 280 μL of chilled ACN was added, mixed, and centrifuged at 21,300× g at 4 °C for 20 min. Then, 400 μL of the supernatant was mixed with 800 μL of dichloromethane and centrifuged under the same conditions as in the previous step. After centrifugation, 90 μL of the aqueous phase was pipetted into inserts and used for analysis.
3.5. Method Validation
The method validation was conducted in accordance with the FDA Bioanalytical Method Validation Guidance for Industry [24]. The validated parameters—selectivity, linearity, LLOQ, accuracy and precision, carry-over, freeze–thaw stability, postpreparative and long-term stability—were determined using bovine plasma.
Selectivity was investigated by analysing six independent blank plasma samples, each assessed for any chromatographic interference at the retention times of the antibiotics and the IS.
The linearity of the method was evaluated using calibration plots constructed with calibrators over three validation days. A non-weighted linear regression analysis was applied to calculate the slopes, intercepts, and coefficients of determination by plotting the analyte–IS peak area ratios. LLOQ was defined as the lowest concentration that produced a coefficient of variation (CV) ≤ 20% and accuracy within 80–120% of the nominal, with an analyte signal response at least fivefold higher than the response in the blank sample.
Intra-day accuracy and precision were evaluated within a single day (n = 5), while inter-day accuracy and precision were assessed over three consecutive days (n = 3). Accuracy was expressed as the ratio of the determined concentration to the nominal concentration (%), and precision as the coefficient of variation (CV, %). Acceptance criteria were defined as accuracy within 85–115% of the nominal value and precision (CV) ≤ 15% for all quality control concentrations.
Carry-over was evaluated by injecting blank samples immediately after the highest calibration standard and was considered acceptable if the response in the blank sample did not exceed 20% of the analyte response at the LLOQ.
Freeze–thaw stability was assessed by subjecting QC samples to two freeze–thaw cycles, consisting of freezing at −70 °C and thawing at room temperature. After the final cycle, samples were analysed and compared with freshly prepared QC samples. Stability was confirmed if the measured concentrations were within ±15% of nominal values.
Long-term stability was evaluated by storing QC samples at −70 °C for one week, corresponding to the maximum storage duration prior to analysis. After storage, QC samples were analysed and compared with freshly prepared QC samples. Analytes were considered stable if the measured concentrations remained within ±15% of nominal values.
Postpreparative stability of QC samples in the autosampler (5 °C) was investigated by injecting the processed samples in three replicates over a period of 24 h (0 h, 6 h, 12 h and 24 h) at a temperature of 5 °C. The effect of storage conditions on the QC samples was determined with an absolute mean peak response percentage deviation ≤15% as the minimum acceptance criteria.
Partial validation, including accuracy, intra- and inter-day precision, method range, and LLOQ, was conducted in human plasma in accordance with the described criteria above.
3.6. In Vitro Binding of Selected Antibiotics to the CytoSorb® Haemoadsorber
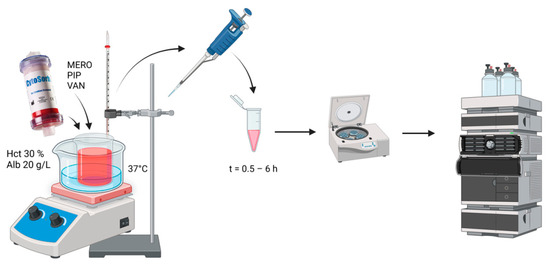
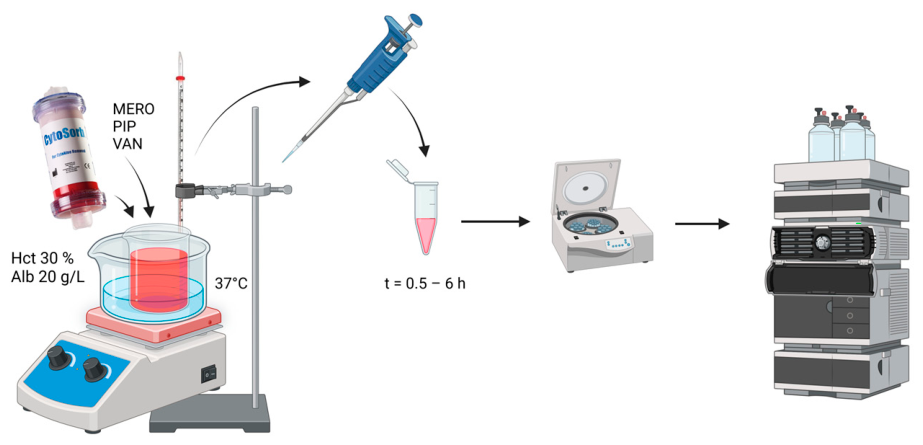
The in vitro study was conducted using bovine blood obtained from a local slaughterhouse (Figure 5). The study was approved by the Administration for Food Safety, Veterinary Sector and Plant Protection of the Republic of Slovenia (permit number U34453-63/2023/3). To mimic septic conditions, the blood albumin concentration and haematocrit were adjusted to 20 g/L and 30%, respectively. The albumin concentration in the blood was determined according to the method developed by Leonard et al. [25], which is based on spectrophotometric analysis of the bromocresol green complex with albumin. The haematocrit was determined by visually measuring the heights of plasma and blood cells in blood centrifuged in microcapillary tubes, the so-called “micro-HCT” [26]. In the experiment, we tested the binding of three different antibiotics—MERO, PIP with tazobactam, and VAN—to the CytoSorb® haemoadsorbent. The antibiotic stock solutions were prepared from drug infusion powders according to the instructions in the Summary of Product Characteristics. To 100 mL of blood with adjusted albumin concentration and haematocrit, antibiotic was added to reach its maximum therapeutic concentrations (MERO = 16.0 mg/L, PIP = 80.0 mg/L, and VAN = 20.0 mg/L), followed by the addition of 0, 0.1, or 1 g of CytoSorb®.
Figure 5.
Schematic presentation of the in vitro study.
Four parallel samples were prepared, each containing 100 mL of adjusted blood: three samples each containing a single antibiotic (MER, PIP or VAN), and one control sample containing all three antibiotics but without CytoSorb®. Samples were thermostated at 37 °C and mixed at 190 rpm for 10–15 min, followed by the addition of antibiotics. Then, 15 min after antibiotic addition, 1.5 mL aliquot of blood was collected from each beaker to determine the initial antibiotic concentrations. After 5 min, 0.1 g or 1 g of CytoSorb® was added to the beakers. Next, 5 min after CytoSorb® addition, serial 1.5 mL blood samples were collected at predefined time points (0, 0.5, 1, 1.5, 2, 2.5, 3, 4, 5, and 6 h) to construct the antibiotic concentration–time profiles. Samples were centrifuged for 10 min at 1800× g and 4 °C. The separated plasma was divided into two aliquots: one for haemolysis assessment and the other for antibiotic concentration determination. Plasma samples for antibiotic quantification were stored at −70 °C for up to one week, whereas samples intended for haemolysis and haemoglobin determination were processed on the day of the experiment. Haemolysis was evaluated at time 0 and 6 h. Haemoglobin concentrations in plasma and blood cells were measured and used to assess haemolysis. Haemoglobin concentration was determined using a method based on that reported by Frenchik et al. [27], involving the conversion of haemoglobin into a coloured product measurable spectrophotometrically at 575 nm. Antibiotic concentrations in plasma samples were determined using the validated method developed in this study.
3.7. Data Analysis
All data analyses were performed using Microsoft Excel 2019 MSO, GraphPad Prism 10, and IBM SPSS Statistics for Windows version 29. Multiple comparisons of drug binding across different CytoSorb® masses were performed using one-way ANOVA with Bonferroni post hoc correction. Statistical significance was set at p < 0.05.
4. Conclusions
In this study, we developed and validated an analytical method that meets the required validation criteria and, additionally, established an in vitro model to assess antibiotic binding to the CytoSorb® haemoadsorber using bovine blood under conditions mimicking sepsis, including haematocrit and albumin levels representative of septic patients. Using this model, we demonstrated that PIP and VAN bind to the haemoadsorbent, whereas MERO does not. Further clinical studies are needed to determine the influence of CytoSorb® on antibiotic concentrations and, consequently, on dosing regimens. To appropriately manage the patients receiving concomitant therapy with CytoSorb® and either VAN or PIP, we recommend the use of therapeutic drug monitoring and further investigation in critically ill patients.
Supplementary Materials
The following supporting information can be downloaded at: https://www.mdpi.com/article/10.3390/molecules31132337/s1. Figure S1: Chromatograms of selected antibiotic at lower limit of quantification in bovine plasma. Table S1. Bioanalytical method validation parameters (accuracy, precision, linearity, range, and LLOQ) for the determination of selected antibiotics in human plasma.
Author Contributions
Conceptualization, S.K., J.G. and T.V.; methodology, S.K. and T.V.; software, T.V.; validation, S.K. and T.V.; formal analysis, S.K. and T.V.; resources, J.G. and T.V.; data curation, S.K. and T.V.; writing—original draft preparation, S.K. and T.V.; writing—review and editing, S.K., J.G. and T.V.; visualisation, S.K. and T.V.; supervision, J.G. and T.V.; project administration, J.G. and T.V.; funding acquisition, J.G. and T.V. All authors have read and agreed to the published version of the manuscript.
Funding
This work was financially supported by the Slovenian Research and Innovation Agency (ARIS Grant P1-0189 and P3-0323). Two CytoSorb® cartridges, used for the experiment, were donated by Medis, d.o.o., Ljubljana, Slovenia, a local distributor for CytoSorbents Europe GmbH, Berlin, Germany.
Institutional Review Board Statement
The animal study protocol was approved by the Administration for Food Safety, Veterinary Sector and Plant Protection of the Republic of Slovenia (permit number U34453-63/2023/3).
Informed Consent Statement
Not applicable.
Data Availability Statement
The original contributions presented in this study are included in the article. Further inquiries can be directed to the corresponding author.
Acknowledgments
This work was supported by the Slovenian Research and Innovation Agency (ARRS Grants P1-0189 and J3-4499). Figure 5 and the graphical abstract were created with BioRender.com.
Conflicts of Interest
The authors declare that this study received funding from Medis, d.o.o., Ljubljana, Slovenia, a local distributor for CytoSorbents Europe GmbH, Berlin, German. The funder was not involved in the study design, collection, analysis, interpretation of data, the writing of this article or the decision to submit it for publication.
Abbreviations
| ACN | acetonitrile |
| AMO | amoxicillin |
| AUC | area under the curve |
| CEF | cefepime |
| CV | coefficient of variation |
| ECMO | extracorporeal membrane oxygenation |
| FDA | Food and Drug Administration |
| HClO4 | perchloric acid |
| HPLC | high-performance liquid chromatography |
| H3PO4 | phosphoric acid |
| ICU | intensive care unit |
| IMI | imipenem |
| IS | internal standard |
| LC-MS/MS | liquid chromatography tandem mass spectrometry |
| LC-UV/Vis | liquid chromatography with ultraviolet-visible detection |
| LLOQ | lower limit of quantification |
| MERO | meropenem |
| MES | 2-(N-morpholino)ethansulfonic acid |
| MIC | minimal inhibitory concentration |
| MP1 | mobile phase 1 |
| MP2 | mobile phase 2 |
| MP3 | mobile phase 3 |
| NaOH | sodium hydroxide |
| PIP | piperacillin |
| PK/PD | pharmacokinetics/pharmacodynamics |
| QCh | quality control sample at high concentration |
| QCl | quality control sample at low concentration |
| QCm | quality control sample at medium concentration |
| UV/Vis | ultraviolet-visible |
| VAN | vancomycin |
References
- Abdul-Aziz, M.-H.; Alffenaar, J.-W.C.; Bassetti, M.; Bracht, H.; Dimopoulos, G.; Marriott, D.; Neely, M.N.; Paiva, J.-A.; Pea, F.; Sjovall, F.; et al. Antimicrobial Therapeutic Drug Monitoring in Critically Ill Adult Patients: A Position Paper#. Intensive Care Med. 2020, 46, 1127–1153. [Google Scholar] [CrossRef] [Scilit] [PubMed]
- Guilhaumou, R.; Benaboud, S.; Bennis, Y.; Dahyot-Fizelier, C.; Dailly, E.; Gandia, P.; Goutelle, S.; Lefeuvre, S.; Mongardon, N.; Roger, C.; et al. Optimization of the Treatment with Beta-Lactam Antibiotics in Critically Ill Patients—Guidelines from the French Society of Pharmacology and Therapeutics (Société Française de Pharmacologie et Thérapeutique—SFPT) and the French Society of Anaesthesia and Intensive Care Medicine (Société Française d’Anesthésie et Réanimation—SFAR). Crit. Care 2019, 23, 104. [Google Scholar] [CrossRef] [Scilit] [PubMed]
- Gorham, J.; Taccone, F.S.; Hites, M. Ensuring Target Concentrations of Antibiotics in Critically Ill Patients through Dose Adjustment. Expert. Opin. Drug Metab. Toxicol. 2022, 18, 177–187. [Google Scholar] [CrossRef] [Scilit] [PubMed]
- CytoSorbents CytoSorb Therapy: Evidence in Septic and Vasoplegic Shock. 1 St Edition. Available online: https://cytosorbents.com/wp-content/uploads/2019/02/Sepsis_booklet_B1086R01EN2019_interaktiv.pdf (accessed on 4 May 2026).
- Kenda, S.; Gubenšek, J.; Vovk, T. Antibiotics and Other Drugs Removal by the CytoSorb® Haemoadsorber: A Systematic Review of Available Evidence. Antibiotics 2026, 15, 409. [Google Scholar] [CrossRef] [Scilit] [PubMed]
- Reiter, K.; Bordoni, V.; Dall’Olio, G.; Ricatti, M.G.; Soli, M.; Ruperti, S.; Soffiati, G.; Galloni, E.; D’Intini, V.; Bellomo, R.; et al. In Vitro Removal of Therapeutic Drugs with a Novel Adsorbent System. Blood Purif. 2002, 20, 380–388. [Google Scholar] [CrossRef] [Scilit] [PubMed]
- Scharf, C.; Weinelt, F.; Schroeder, I.; Paal, M.; Weigand, M.; Zoller, M.; Irlbeck, M.; Kloft, C.; Briegel, J.; Liebchen, U. Does the Cytokine Adsorber CytoSorb® Reduce Vancomycin Exposure in Critically Ill Patients with Sepsis or Septic Shock? A Prospective Observational Study. Ann. Intensive Care 2022, 12, 44. [Google Scholar] [CrossRef] [Scilit] [PubMed]
- Hassan, K.; Geidel, S.; Zamvar, V.; Tanaka, K.; Knezevic-Woods, Z.; Wendt, D.; Deliargyris, E.N.; Storey, R.F.; Schmoeckel, M. Intraoperative Ticagrelor Removal via Hemoadsorption during On-Pump Coronary Artery Bypass Grafting. JTCVS Open 2023, 15, 190–196. [Google Scholar] [CrossRef] [Scilit] [PubMed]
- Javanbakht, M.; Trevor, M.; Rezaei Hemami, M.; Rahimi, K.; Branagan-Harris, M.; Degener, F.; Adam, D.; Preissing, F.; Scheier, J.; Cook, S.F.; et al. Ticagrelor Removal by CytoSorb® in Patients Requiring Emergent or Urgent Cardiac Surgery: A UK-Based Cost-Utility Analysis. PharmacoEconomics Open 2020, 4, 307–319. [Google Scholar] [CrossRef] [Scilit] [PubMed]
- Schroeder, I.; Zoller, M.; Angstwurm, M.; Kur, F.; Frey, L. Venlafaxine Intoxication with Development of Takotsubo Cardiomyopathy: Successful Use of Extracorporeal Life Support, Intravenous Lipid Emulsion and Cytosorb®. Int. J. Artif. Organs 2017, 40, 358–360. [Google Scholar] [CrossRef] [Scilit] [PubMed]
- Roth, T.; Weber, L.; Niestroj, M.; Cipa, F.; Löscher, A.; Mihai, S.; Parsch, H. Simultaneous Determination of Six Antibiotics in Human Serum by High-performance Liquid Chromatography with UV Detection. Biomed. Chromatogr. 2021, 35, e5010. [Google Scholar] [CrossRef] [Scilit] [PubMed]
- Hoizey, G.; Lamiable, D.; Frances, C.; Trenque, T.; Kaltenbach, M.; Denis, J.; Millart, H. Simultaneous Determination of Amoxicillin and Clavulanic Acid in Human Plasma by HPLC with UV Detection. J. Pharm. Biomed. Anal. 2002, 30, 661–666. [Google Scholar] [CrossRef] [Scilit] [PubMed]
- Greibe, E.; Moser, C.E.; Bruun, N.E.; Hoffmann-Lücke, E. New Methods for Quantification of Amoxicillin and Clindamycin in Human Plasma Using HPLC with UV Detection. J. Antimicrob. Chemother. 2022, 77, 2437–2440. [Google Scholar] [CrossRef] [Scilit] [PubMed]
- Milla, P.; Ferrari, F.; Muntoni, E.; Sartori, M.; Ronco, C.; Arpicco, S. Validation of a Simple and Economic HPLC-UV Method for the Simultaneous Determination of Vancomycin, Meropenem, Piperacillin and Tazobactam in Plasma Samples. J. Chromatogr. B 2020, 1148, 122151. [Google Scholar] [CrossRef] [Scilit] [PubMed]
- Verdier, M.-C.; Tribut, O.; Tattevin, P.; Le Tulzo, Y.; Michelet, C.; Bentué-Ferrer, D. Simultaneous Determination of 12 β-Lactam Antibiotics in Human Plasma by High-Performance Liquid Chromatography with UV Detection: Application to Therapeutic Drug Monitoring. Antimicrob. Agents Chemother. 2011, 55, 4873–4879. [Google Scholar] [CrossRef] [Scilit] [PubMed]
- Isla, A.; Arzuaga, A.; Maynar, J.; Gascón, A.R.; Solinís, M.A.; Corral, E.; Pedraz, J.L. Determination of Ceftazidime and Cefepime in Plasma and Dialysate-Ultrafiltrate from Patients Undergoing Continuous Veno-Venous Hemodiafiltration by HPLC. J. Pharm. Biomed. Anal. 2005, 39, 996–1005. [Google Scholar] [CrossRef] [Scilit] [PubMed]
- Krishna, M.V.K. Simultaneous Determination of Imipenem and Cilastatin Impurities in Combination Product of Imipenem and Cilastatin Injection by RP-HPLC. J. Chem. Pharm. Res. 2020, 12, 35–47. [Google Scholar]
- Legg, A.; Devchand, F.; Gwee, A.; Sandaradura, I.; Lai, T. Safe and Effective Use of Vancomycin. Aust. Prescr. 2025, 48, 54–59. [Google Scholar] [CrossRef] [Scilit] [PubMed]
- Fratoni, A.J.; Nicolau, D.P.; Kuti, J.L. A Guide to Therapeutic Drug Monitoring of Β-lactam Antibiotics. Pharmacotherapy 2021, 41, 220–233. [Google Scholar] [CrossRef] [Scilit] [PubMed]
- König, C.; Röhr, A.C.; Frey, O.R.; Brinkmann, A.; Roberts, J.A.; Wichmann, D.; Braune, S.; Kluge, S.; Nierhaus, A. In Vitro Removal of Anti-Infective Agents by a Novel Cytokine Adsorbent System. Int. J. Artif. Organs 2019, 42, 57–64. [Google Scholar] [CrossRef] [Scilit] [PubMed]
- Bottari, G.; Goffredo, B.M.; Marano, M.; Maccarrone, C.; Simeoli, R.; Bianco, G.; Vallesi, L.; Beetham, J.C.C.; Mazzeo, A.T.; Cappoli, A.; et al. Impact of Continuous Kidney Replacement Therapy and Hemoadsorption with CytoSorb on Antimicrobial Drug Removal in Critically Ill Children with Septic Shock: A Single-Center Prospective Study on a Pediatric Cohort. Antibiotics 2023, 12, 1395. [Google Scholar] [CrossRef] [Scilit] [PubMed]
- Asgarpur, G.; Weber, F.; Kiessling, P.; Akbari, N.; Stroben, F.; Kleikamp, B.; Kloft, C.; Treskatsch, S.; Angermair, S. Impact of Hemoadsorption with CytoSorb® on Meropenem and Piperacillin Exposure in Critically Ill Patients in a Post-CKRT Setup: A Single-Center, Retrospective Data Analysis. ICMx 2025, 13, 7. [Google Scholar] [CrossRef] [Scilit] [PubMed]
- Schneider, A.G.; André, P.; Scheier, J.; Schmidt, M.; Ziervogel, H.; Buclin, T.; Kindgen-Milles, D. Pharmacokinetics of Anti-Infective Agents during CytoSorb Hemoadsorption. Sci. Rep. 2021, 11, 10493. [Google Scholar] [CrossRef] [Scilit] [PubMed]
- FDA Guidance for Industry. Bioanalytical Method Validation. US Department of Health and Human Services. Available online: https://www.fda.gov/files/drugs/published/Bioanalytical-Method-Validation-Guidance-for-Industry.pdf (accessed on 10 April 2026).
- Leonard, P.J.; Persaud, J.; Motwani, R. The Estimation of Plasma Albumin by BCG RCG Binding on the Technicon SMA 12/60 Analyser and a Comparison with the HABA Dye Binding Technique. Clin. Chim. Acta 1971, 35, 409–412. [Google Scholar] [CrossRef] [Scilit] [PubMed]
- Livshits, L.; Bilu, T.; Peretz, S.; Bogdanova, A.; Gassmann, M.; Eitam, H.; Koren, A.; Levin, C. Back to the “Gold Standard”: How Precise Is Hematocrit Detection Today?: Novel ImageJ-Based Approach for the Precise Hematocrit Measurement. Mediterr. J. Hematol. Infect. Dis. 2022, 14, e2022049. [Google Scholar] [CrossRef] [Scilit] [PubMed]
- Frenchik, M.D.; Tsonev, L.I.; McFaul, S.J. A Microplate Assay for the Determination of Hemoglobin Concentration. Clin. Chim. Acta 2004, 339, 199–201. [Google Scholar] [CrossRef] [Scilit] [PubMed]

Disclaimer/Publisher’s Note: The statements, opinions and data contained in all publications are solely those of the individual author(s) and contributor(s) and not of MDPI and/or the editor(s). MDPI and/or the editor(s) disclaim responsibility for any injury to people or property resulting from any ideas, methods, instructions or products referred to in the content. |
© 2026 by the authors. Licensee MDPI, Basel, Switzerland. This article is an open access article distributed under the terms and conditions of the Creative Commons Attribution (CC BY) license.