


Abstract
The use of organophosphate pesticides, such as profenofos, is a pressing environmental concern due to their persistence and toxicity to non-target organisms. For this reason, developing alternatives to remove them from the environment is crucial. The objective of this study was to biosynthesize ZnO nanoparticles (ZnO NPs) using an aqueous extract of Negra Criolla grape seeds for their application in the degradation of profenofos in synthetic solutions. The biosynthesized ZnO NPs had an average size of 52 ± 2 nm and a maximum absorption at 375 nm, characteristic of the surface plasmon resonance of ZnO NPs. The ATR-FTIR spectra showed peaks characteristic of ZnO NPs. The 22 × 3 factorial design showed that the optimal values for pH and ZnO NPs concentration are 5 and 3 g/L, respectively, achieving a primary degradation of profenofos (20 mg/L) of 59 ± 2% after 120 min of UV irradiation. In conclusion, it was demonstrated that ZnO NPs biosynthesized using an aqueous extract of Negra Criolla grape seeds exhibit photocatalytic activity for the degradation of profenofos; however, further studies are needed to evaluate their application in actual contaminated water.
1. Introduction
Population growth has created high demand for agricultural products to feed approximately 7 billion people worldwide [1]. For this reason, pesticides are commonly used to prevent, destroy, repel, or control pathogens and pests that could potentially harm crops [2]. Nowadays, environmental pollution caused by agrochemicals is a global problem, with pesticides being the main substances used in agro-industrial activities for pest control [3]. Agriculture is one of the main economic activities in Peru [4]. Organophosphorus (OPPs) pesticides are commonly used in agriculture [5]. OPPs irreversibly bind to acetylcholinesterase, making them effective at triggering cholinergic symptoms that can kill insects and even humans, which makes these compounds effective for pest control; however, humans and non-target organisms may be affected by the residual effects of these OPPs, which can leach into deep soil layers and reach groundwater, or run off into irrigation canals and ultimately into rivers [6]. Compounding this problem is the use of contaminated water for human consumption, as some communities in Arequipa lack access to potable water and rely on groundwater or river water that has been treated in ways that do not remove toxic molecules such as OPPs. OPPs account for approximately 28% of insecticides sold worldwide [7]. It is well known that OPPs have contributed significantly to agricultural activities by reducing the risk of crop losses due to their effectiveness against pests; however, the problem lies in the fact that these OPPs persist and bioaccumulate in the environment, posing a potential risk to mammals and non-target organisms in ecosystems adjacent to application areas [8,9].
Among the most commonly used OPPs is profenofos (PF), known for its effectiveness in controlling pests resistant to other OPPs, such as chlorpyrifos [10]. PF is widely and indiscriminately used in agricultural [11,12,13] and horticultural crops to control flying, crawling, chewing, and sucking insects [14]. For years, studies and process applications have been developed to accelerate the removal of OPPs from soil to prevent these toxic substances from entering the water. Among the options for degrading OPPs is the isolation of native soil microorganisms; this appears to be a highly promising technology for removing OPPs [1] such as chlorpyrifos [15,16] and PF [9,11]; likewise, photocatalytic [17,18] and microwave [19] processes were developed and also proved effective. In photocatalytic processes, various semiconductors are used to generate hydroxyl radicals that degrade organic matter; among these semiconductors are nanoparticles that can be synthesized using physical and chemical methods, as well as through biosynthesis or eco-synthesis [20]. Green synthesis enables the development of safer nanomaterials and addresses safety, health, and environmental concerns. Furthermore, these biogenic particles possess unique properties that make them suitable for applications in medicine, agriculture, bioengineering, and bioremediation [21]. The eco-friendly synthesis method for producing ZnO nanoparticles (ZnO NPs) employs natural waste materials that act as reducing agents and stabilizers [22]. For these reasons, ZnO NPs are entirely feasible for laboratory development, given their advantages, such as energy efficiency, low toxicity, high performance, high cost-effectiveness, environmental friendliness, and wide availability [23]. Some plant species contain reducing compounds, such as grape seeds, which are essential for the synthesis of nanoparticles [24]. Furthermore, the use of agro-industrial waste, such as grape seeds, plays a key role in the circular economy and sustainable development [25]. For this reason, this study aims to demonstrate that grape seeds are a source of reducing agents for the synthesis of ZnO nanoparticles, employing grape seed extract as the reducing agent, and subsequently applying these nanoparticles to remediate water contaminated with the organophosphate pesticide profenofos using synthetic solutions.
2. Results and Discussion
2.1. Characterization
2.1.1. Characterization by ATR-FTIR of GS and GSAE
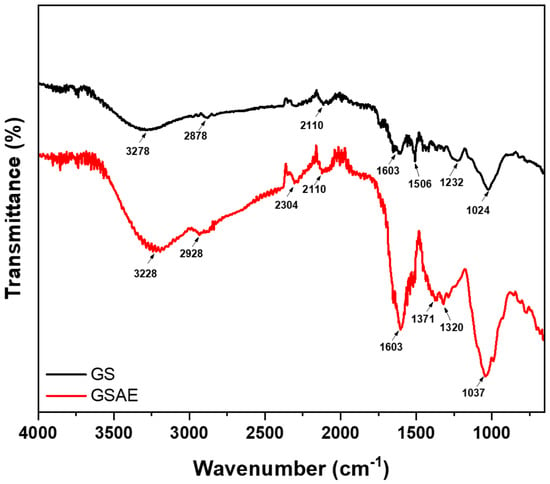
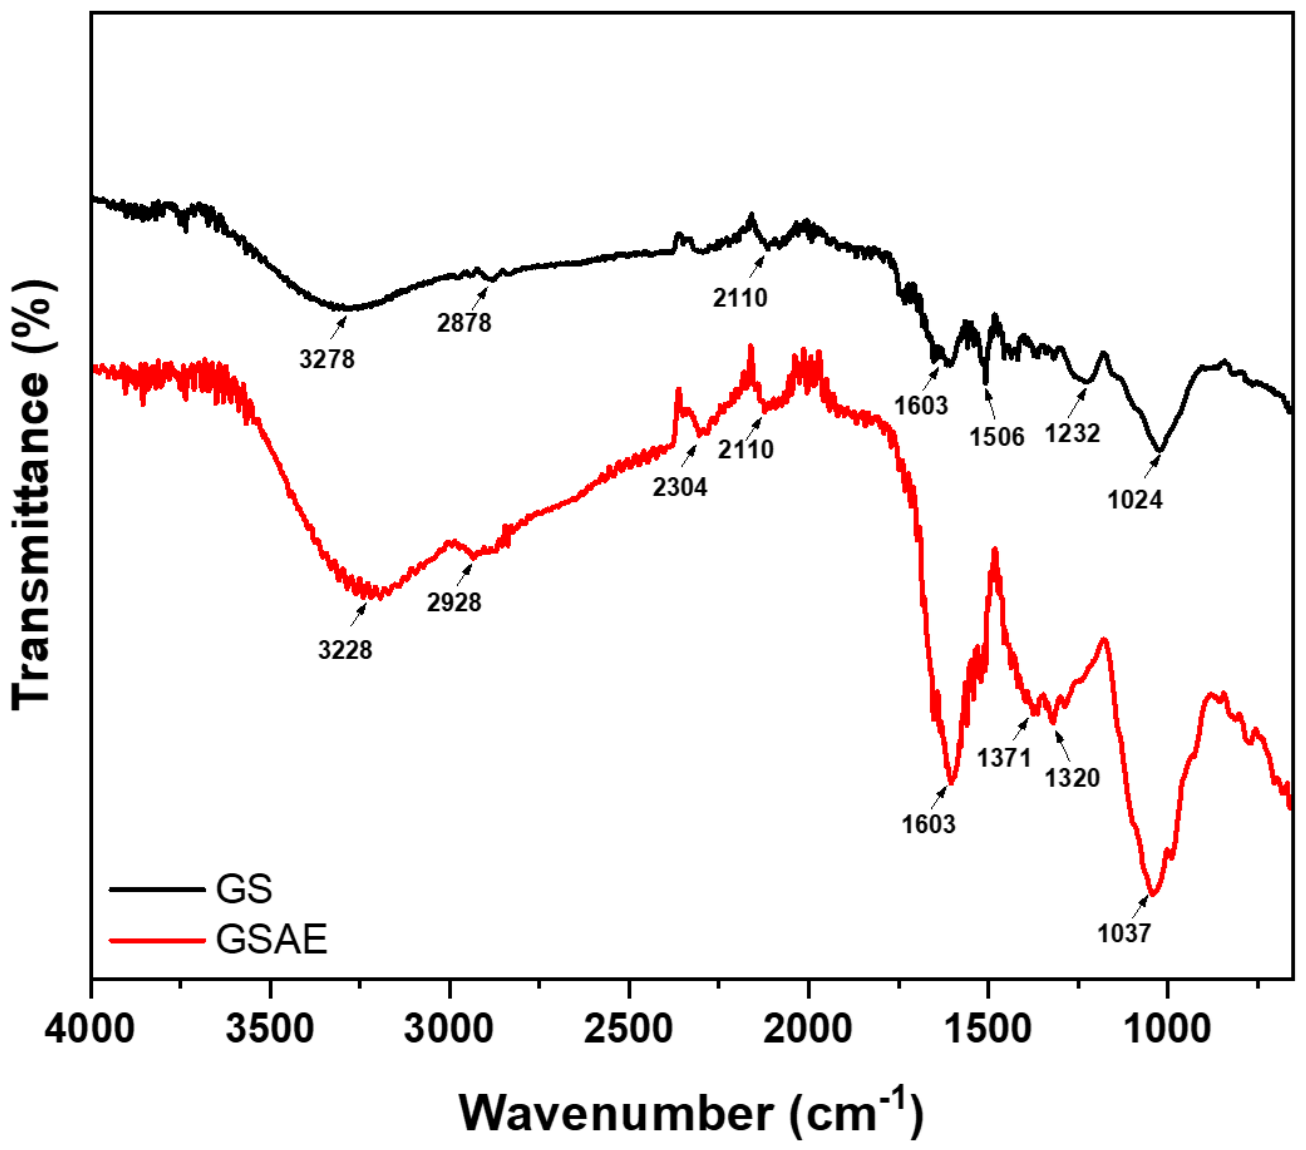
Figure 1 shows the FTIR spectra obtained via ATR-FTIR of pressed grape seeds (GS) (oil-free) and grape seed aqueous extract 5% (GSAE-5%). Given that both matrices represent complex organic mixtures containing a wide variety of secondary metabolites (such as polyphenols, flavonoids, fatty acids, and tannins), their infrared profiles exhibit inherently broad bands that reflect the overlapping signals of multiple functional groups rather than single isolated compounds. Consequently, these spectra are presented primarily as characteristic qualitative fingerprints of GS, GSAE-5%, and the extracting agent.
Figure 1.
ATR-FTIR spectra of grape seeds (GS) and aqueous grape seed extract (GSAE).
The black line spectrum corresponds to the pressed and pulverized GS, where a peak at 3228 cm−1, characteristic of the stretching vibrations of the -OH groups, is observed. These signals may be associated with the phenolic compound content in the seeds [26]. A characteristic peak corresponding to the stretching vibrations of C-H groups appears at 2878 cm−1. A peak corresponding to nitrogen-containing groups appears at 2110 cm−1. At 1603 and 1506 cm−1, a characteristic peak corresponding to the stretching vibrations of the C=C groups is observed; at 1232 cm−1, C-H bending vibrations are present; finally, a peak at 1024 cm−1 corresponding to the wagging vibrations of -CH3 is observed. The spectra of the 5% GSAE are shown in red, and it can be observed that the same signals from the functional groups found in the pressed GS are present; however, these signals are more intense, specifically at 3228 cm−1, which could correspond to flavonoids, alkaloids, carboxylic acids, or polyphenols [27] that were extracted with water.
2.1.2. Characterization of ZnO NPs
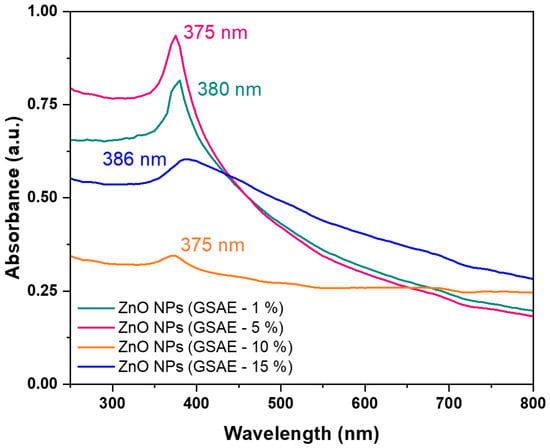
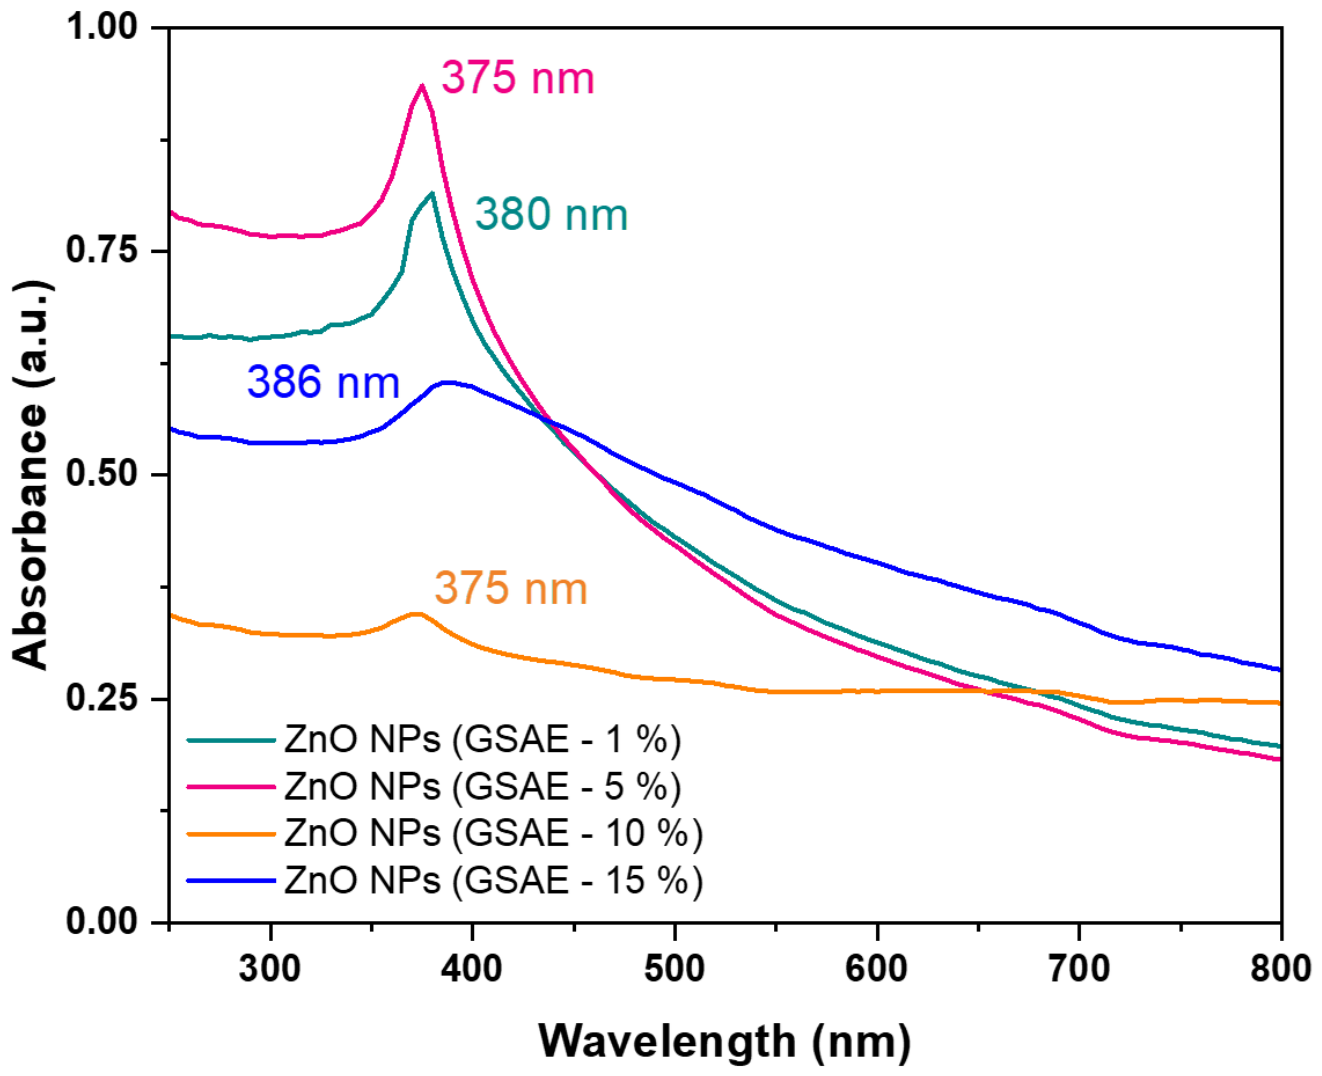
Figure 2 shows the UV/vis spectra of the four ZnO NPs suspensions biosynthesized using 1%, 5%, 10%, and 15% of grape seed aqueous extracts (GSAE). These spectra correspond to the surface plasmon resonance phenomenon. The ZnO NPs biosynthesized using 1% GSAE exhibited a spectrum with a maximum peak at 380 nm (green line); likewise, the ZnO NPs biosynthesized with 5% GSAE developed a peak at 375 nm (pink line); similarly, the ZnO NPs obtained with 10% GSAE (orange line). Finally, the ZnO NPs obtained using GSAE-15% exhibited a peak at 386 nm (blue line). In another study, ZnO NPs were biosynthesized using an extract of Cymbopogon proximus, yielding a maximum absorption peak at 375 nm [28], and using an extract of Amaranthus dubius, ZnO NPs were biosynthesized with an absorption peak at 377 nm [29]. These absorption peaks demonstrate the formation of ZnO NPs from the zinc salts used in the synthesis [30]. For the degradation experiments, ZnO NPs biosynthesized using 5% GSAE were used because they have a sharper absorption peak and higher absorption [31].
Figure 2.
Spectrophotometric scans of ZnO nanoparticles biosynthesized using grape seed aqueous extracts (GSAE).
The optical bandgap (Eg) was determined from the absorption spectra shown in Figures S1–S4 of the Supplementary Material using the Tauc method [32,33]. The bandgap of the ZnO NPs biosynthesized with 1%, 5%, and 10% GSAE was 2.84 eV (Figure S1), 2.92 eV (Figure S2), and 2.58 eV (Figure S3), respectively. These results show a smaller-than-expected bandgap for bulk ZnO (Eg = 3.37 eV). These values are similar to those reported in other studies in which ZnO NPs were biosynthesized, suggesting that this may be due to the nanoparticles’ small size or to the use of plant extracts as reducing agents [34]. A higher concentration of grape seed extract during synthesis would result in a higher density of oxygen- and carbon-rich organic compounds (such as polyphenols and flavonoids) bound to the zinc precursors. Following thermal calcination, these surface organic residues would introduce localized structural defects, which could effectively reduce the sample’s optical bandgap by 10% GSAE. Figure S4 shows the Tauc plot of the ZnO nanoparticles synthesized using a 15% aqueous grape seed extract; however, the bandgap value could not be calculated due to matrix (extract) interference.
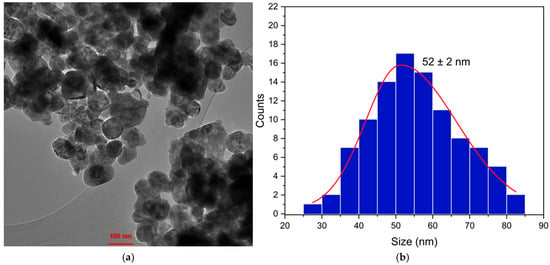
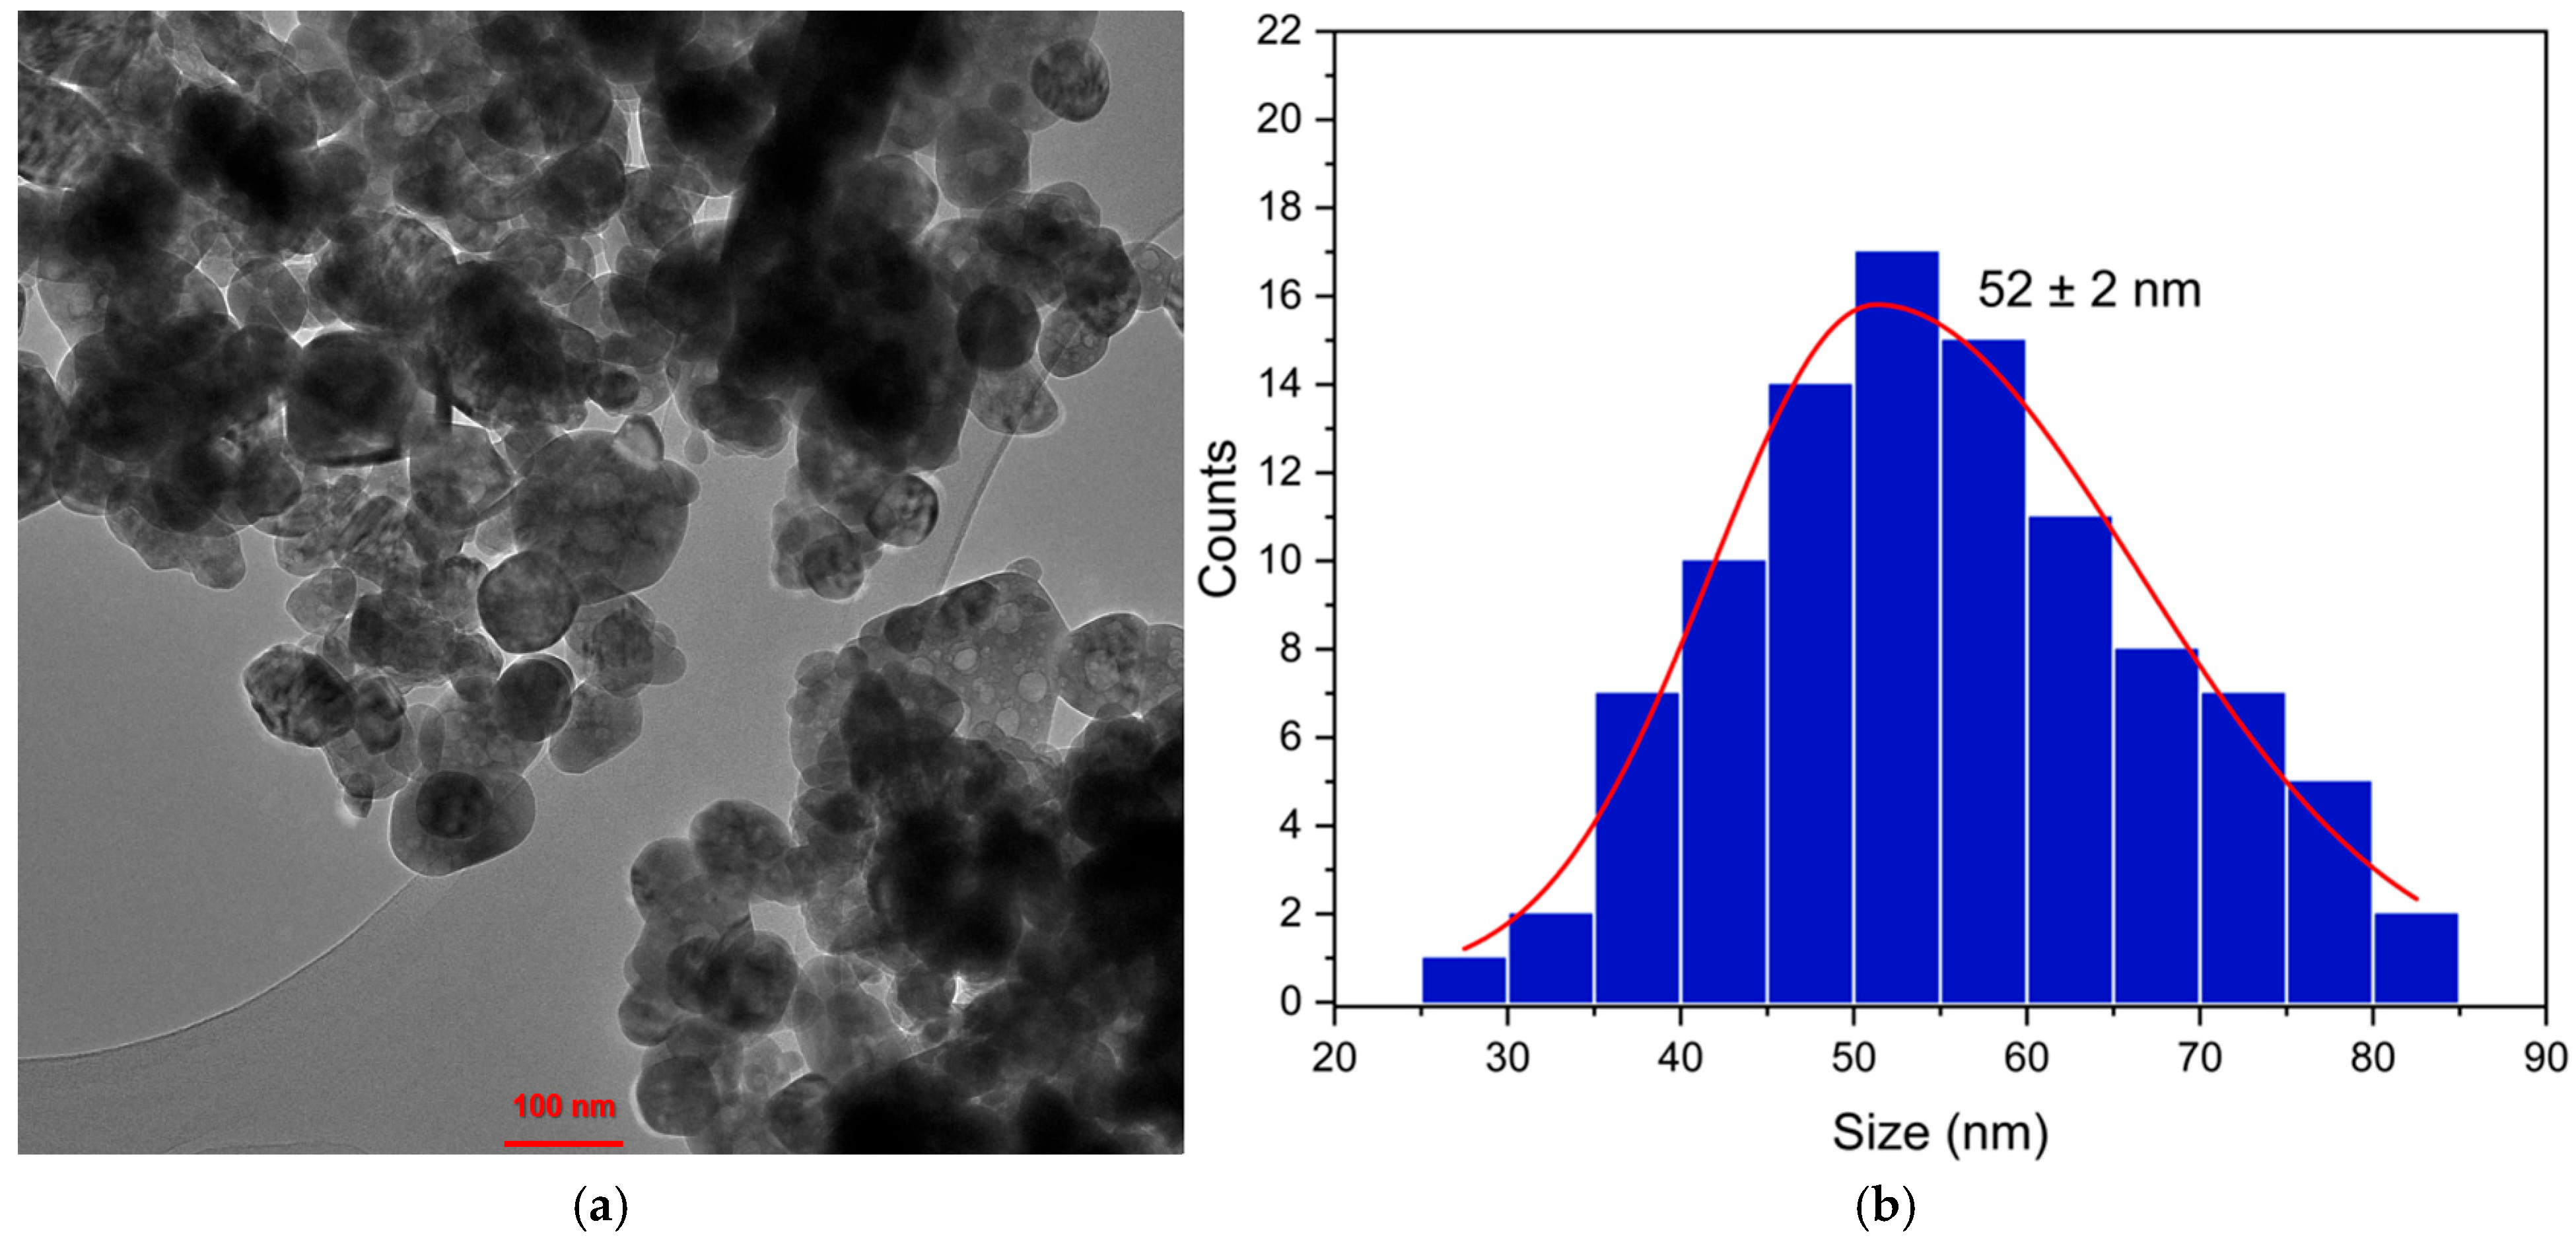
Figure 3a shows a TEM micrograph of the biosynthesized ZnO NPs, revealing spherical and irregularly shaped nanostructures. On the other hand, Figure 3b presents the histogram of biosynthesized ZnO NP diameters, indicating an average size of 52 ± 2 nm.
Figure 3.
(a) Transmission electron microscope (TEM) micrograph of ZnO nanoparticles and (b) histogram for nanoparticle counting.
On the other hand, Table 1 presents a comparison of various biosynthesized ZnO NPs with other aqueous extracts reported in previous studies, showing the range of particle sizes that can be achieved depending on the extract and calcination temperature.
Table 1.
Comparison of particle sizes obtained from different aqueous extracts.
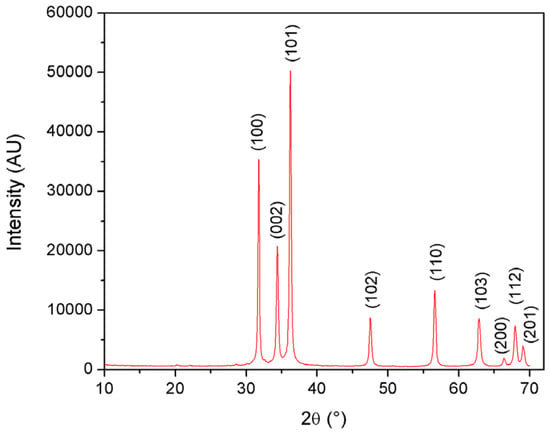
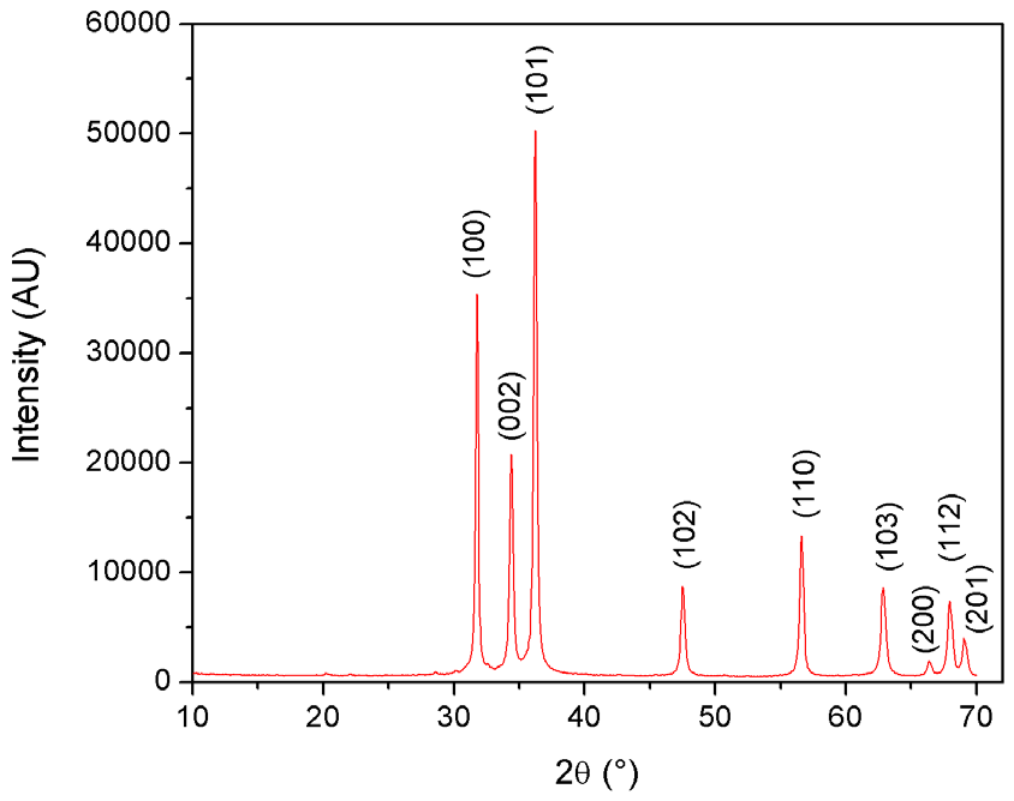
Figure 4 shows the XRD pattern of the synthesized ZnO nanoparticles, displaying several intense and well-defined diffraction maxima. All observed peaks were indexed to the hexagonal wurtzite phase of ZnO, with space group P63mc (No. 186), in agreement with the standard PDF card No. 36-1451. The indexed diffraction maxima are shown in Figure 4.
Figure 4.
X-ray diffraction pattern of the ZnO nanoparticles.
Le Bail refinement provided unit cell parameters of a = b = 3.2513(2) Å and c = 5.2076(5) Å, in good agreement with those reported for wurtzite ZnO in PDF card No. 36-1451 (a = b = 3.2498 Å and c = 5.2066 Å) and in previous studies on zinc oxide [40,41]. Based on the unit cell volume (V = 47.67 Å3), the X-ray density was calculated as 5.67 g cm–3, which is consistent with the literature values for ZnO, typically ranging from 5.00 to 5.68 g cm–3 [42,43]. The average crystallite size, estimated from the position and full width at half-maximum (FWHM) of the most intense diffraction peak, assigned to the (101) plane, using the Scherrer equation [44] with a shape factor (K) of 0.9, was approximately 34 nm.
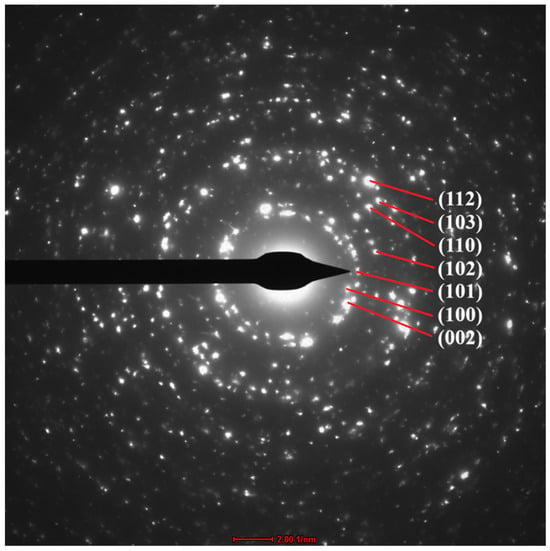
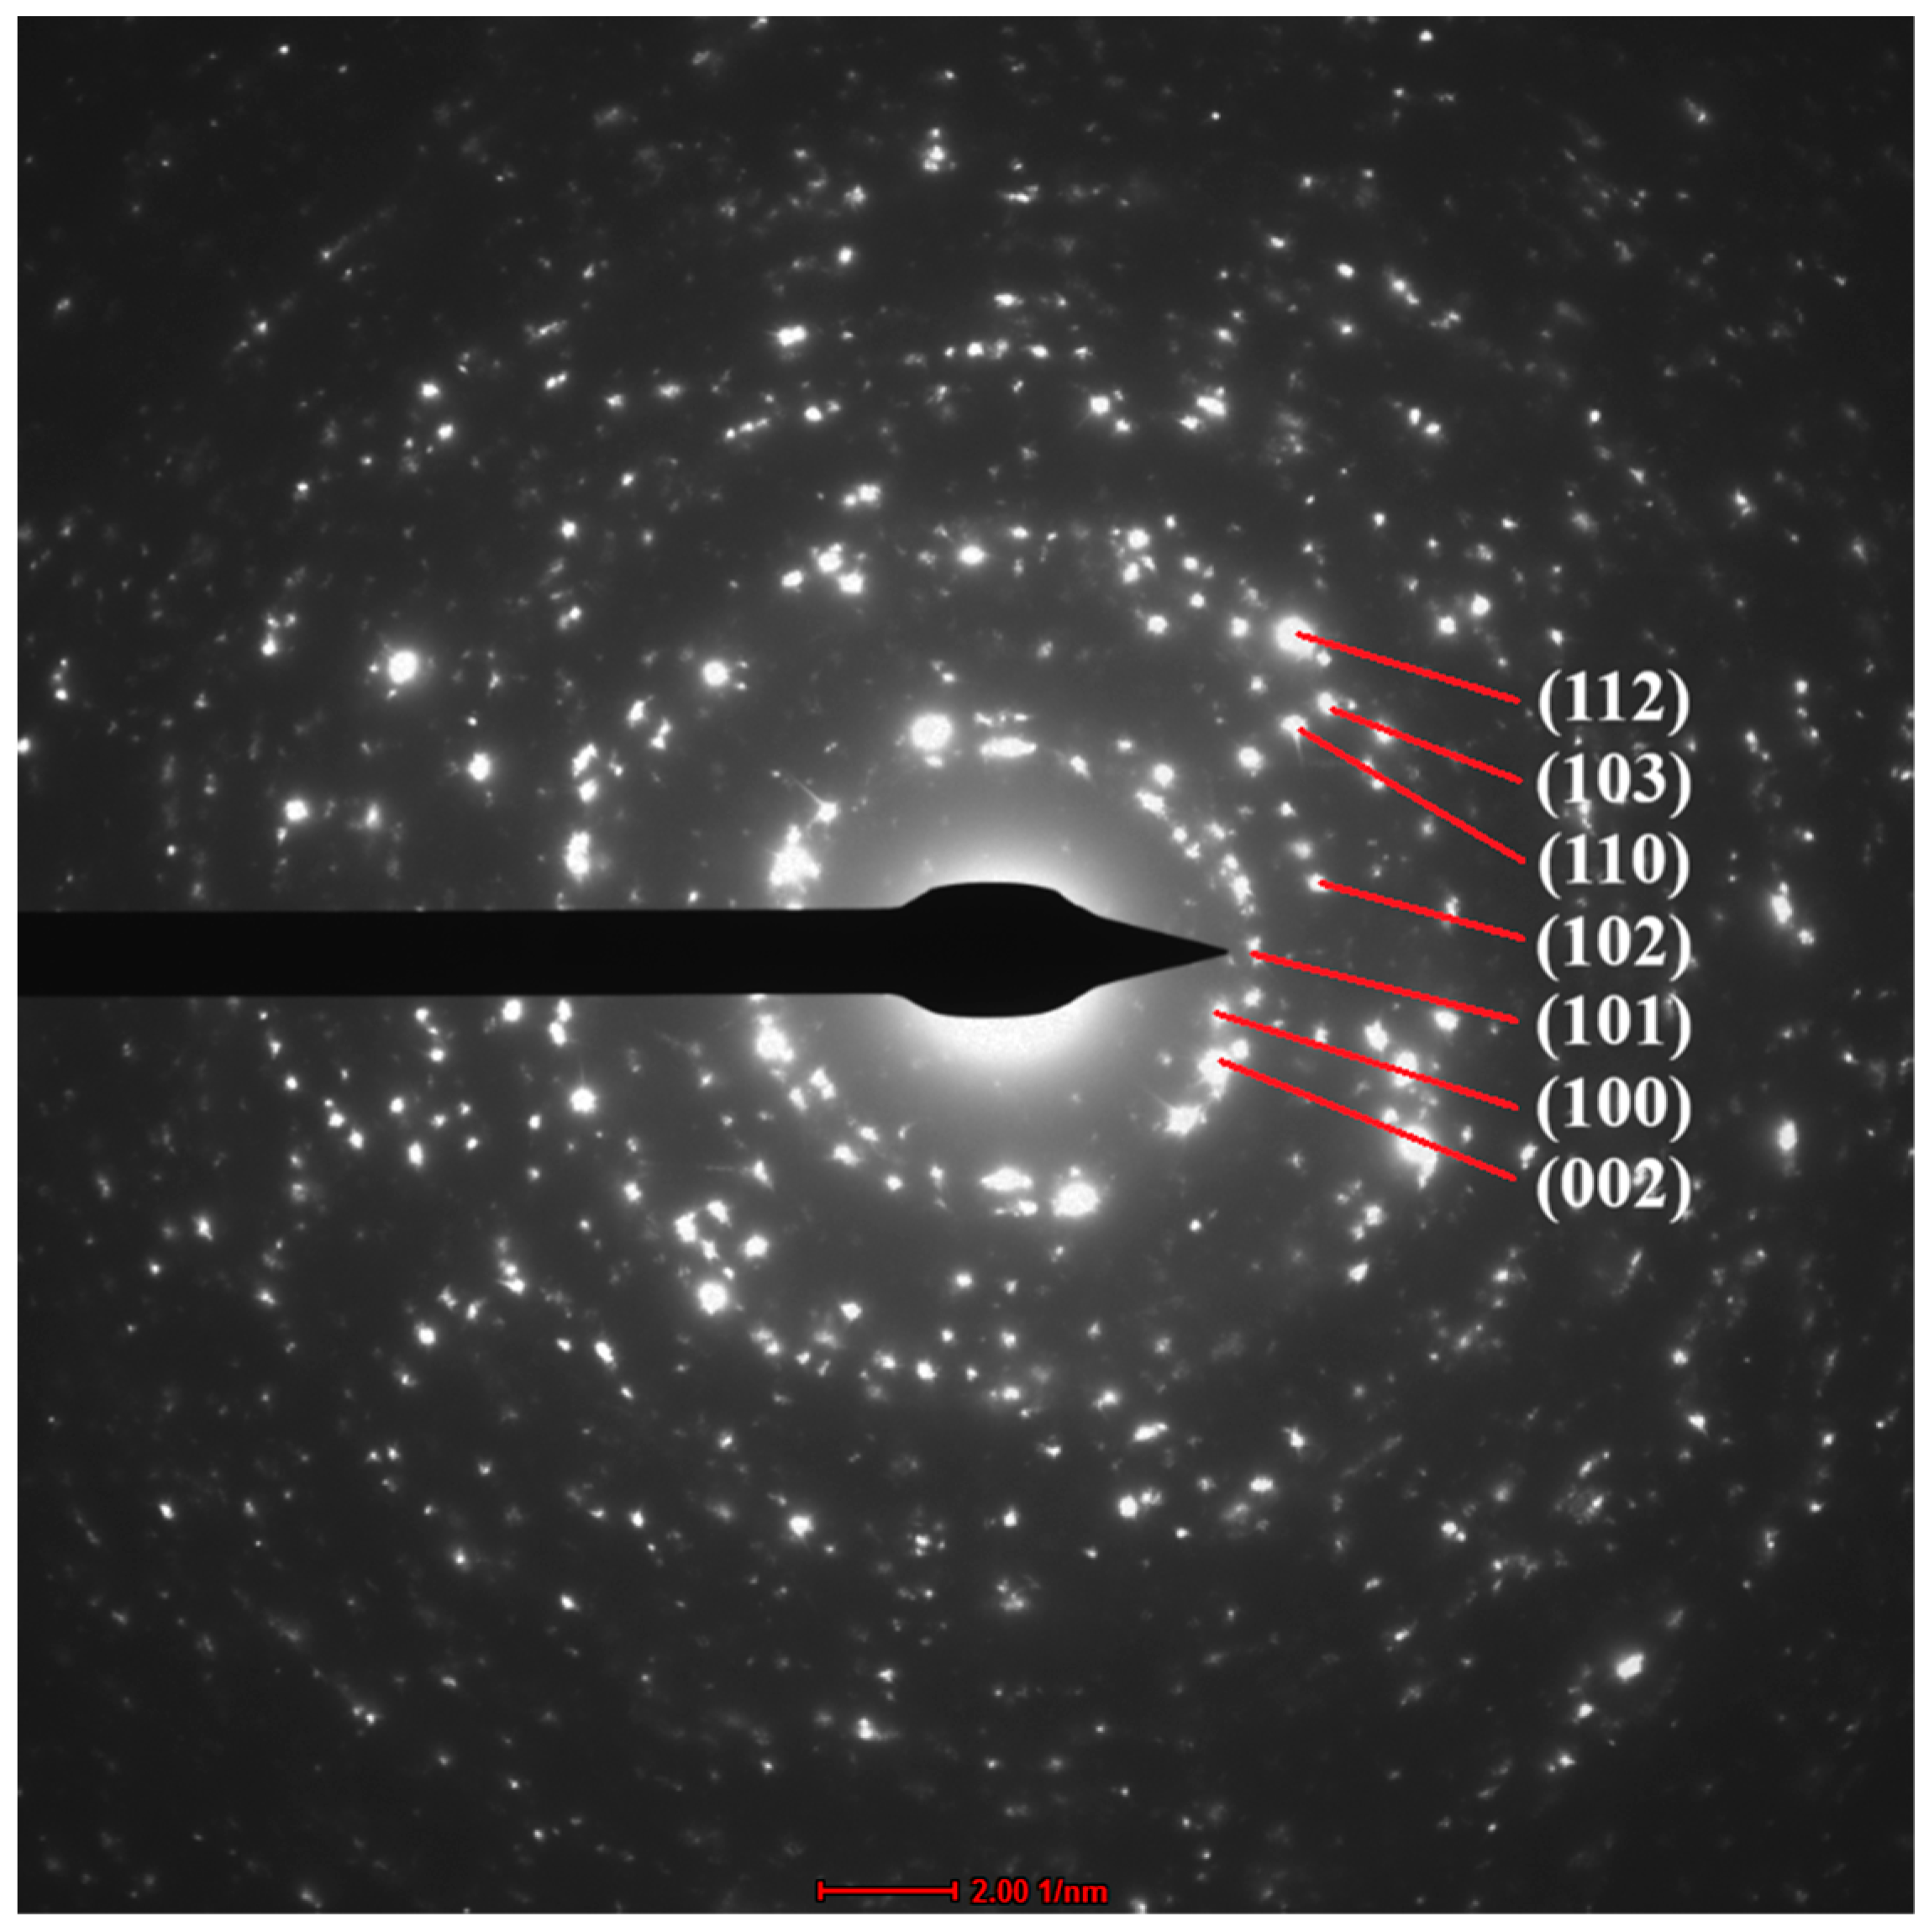
Figure 5 shows the selected-area electron diffraction pattern of the synthesized ZnO nanoparticles. The pattern displays diffraction maxima arranged as spotty rings, characteristic of a polycrystalline material composed of highly crystalline grains or particles. Indexing of these maxima confirmed that the nanoparticles crystallized in the hexagonal wurtzite structure of zincite (ZnO), thereby supporting the structural results obtained by X-ray diffraction.
Figure 5.
Selected-area electron diffraction pattern of the ZnO nanoparticles.
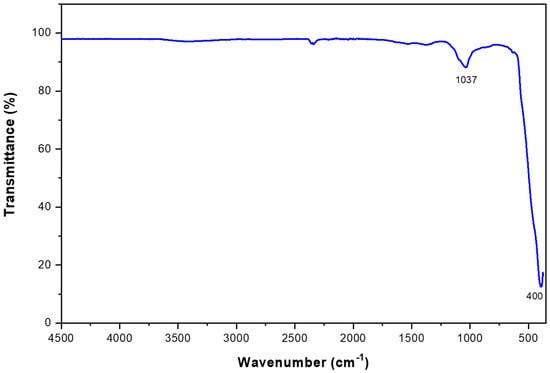
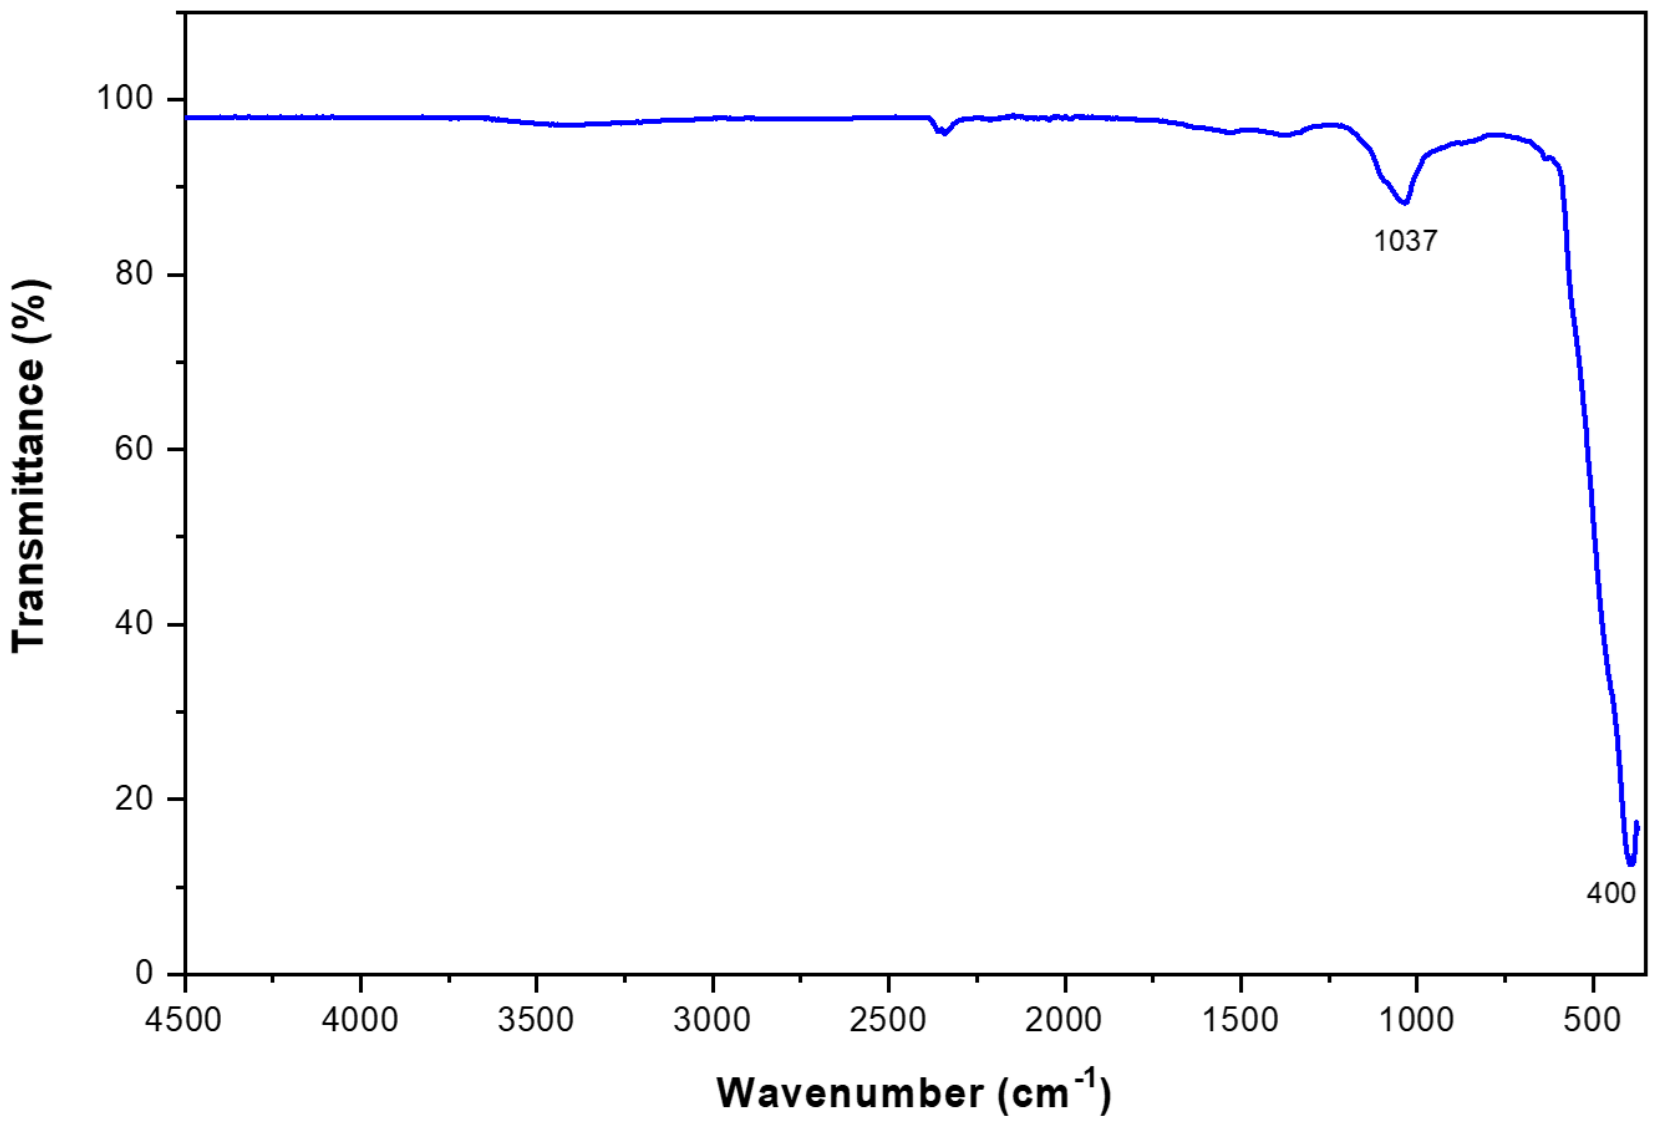
Figure 6 shows the ATR-FTIR spectrum of the biosynthesized ZnO NPs, in which a small peak is observed at 1037 cm−1, while a peak at 400 cm−1 is also observed, which could correspond to the ZnO NPs. These signals correspond to the Zn-O stretching mode, which appears between 400 and 850 cm−1 and is characteristic of the hexagonal crystal structure of ZnO [31,45]. This is confirmed by another study, which indicates these signals correspond to the formation of ZnO NPs [27].
Figure 6.
ATR-FTIR spectra of ZnO nanoparticles biosynthesized.
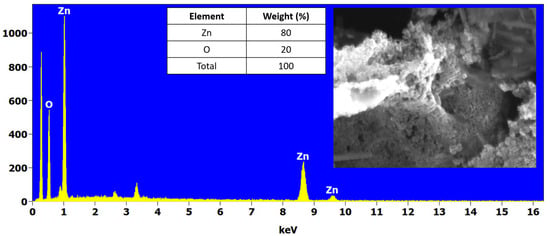
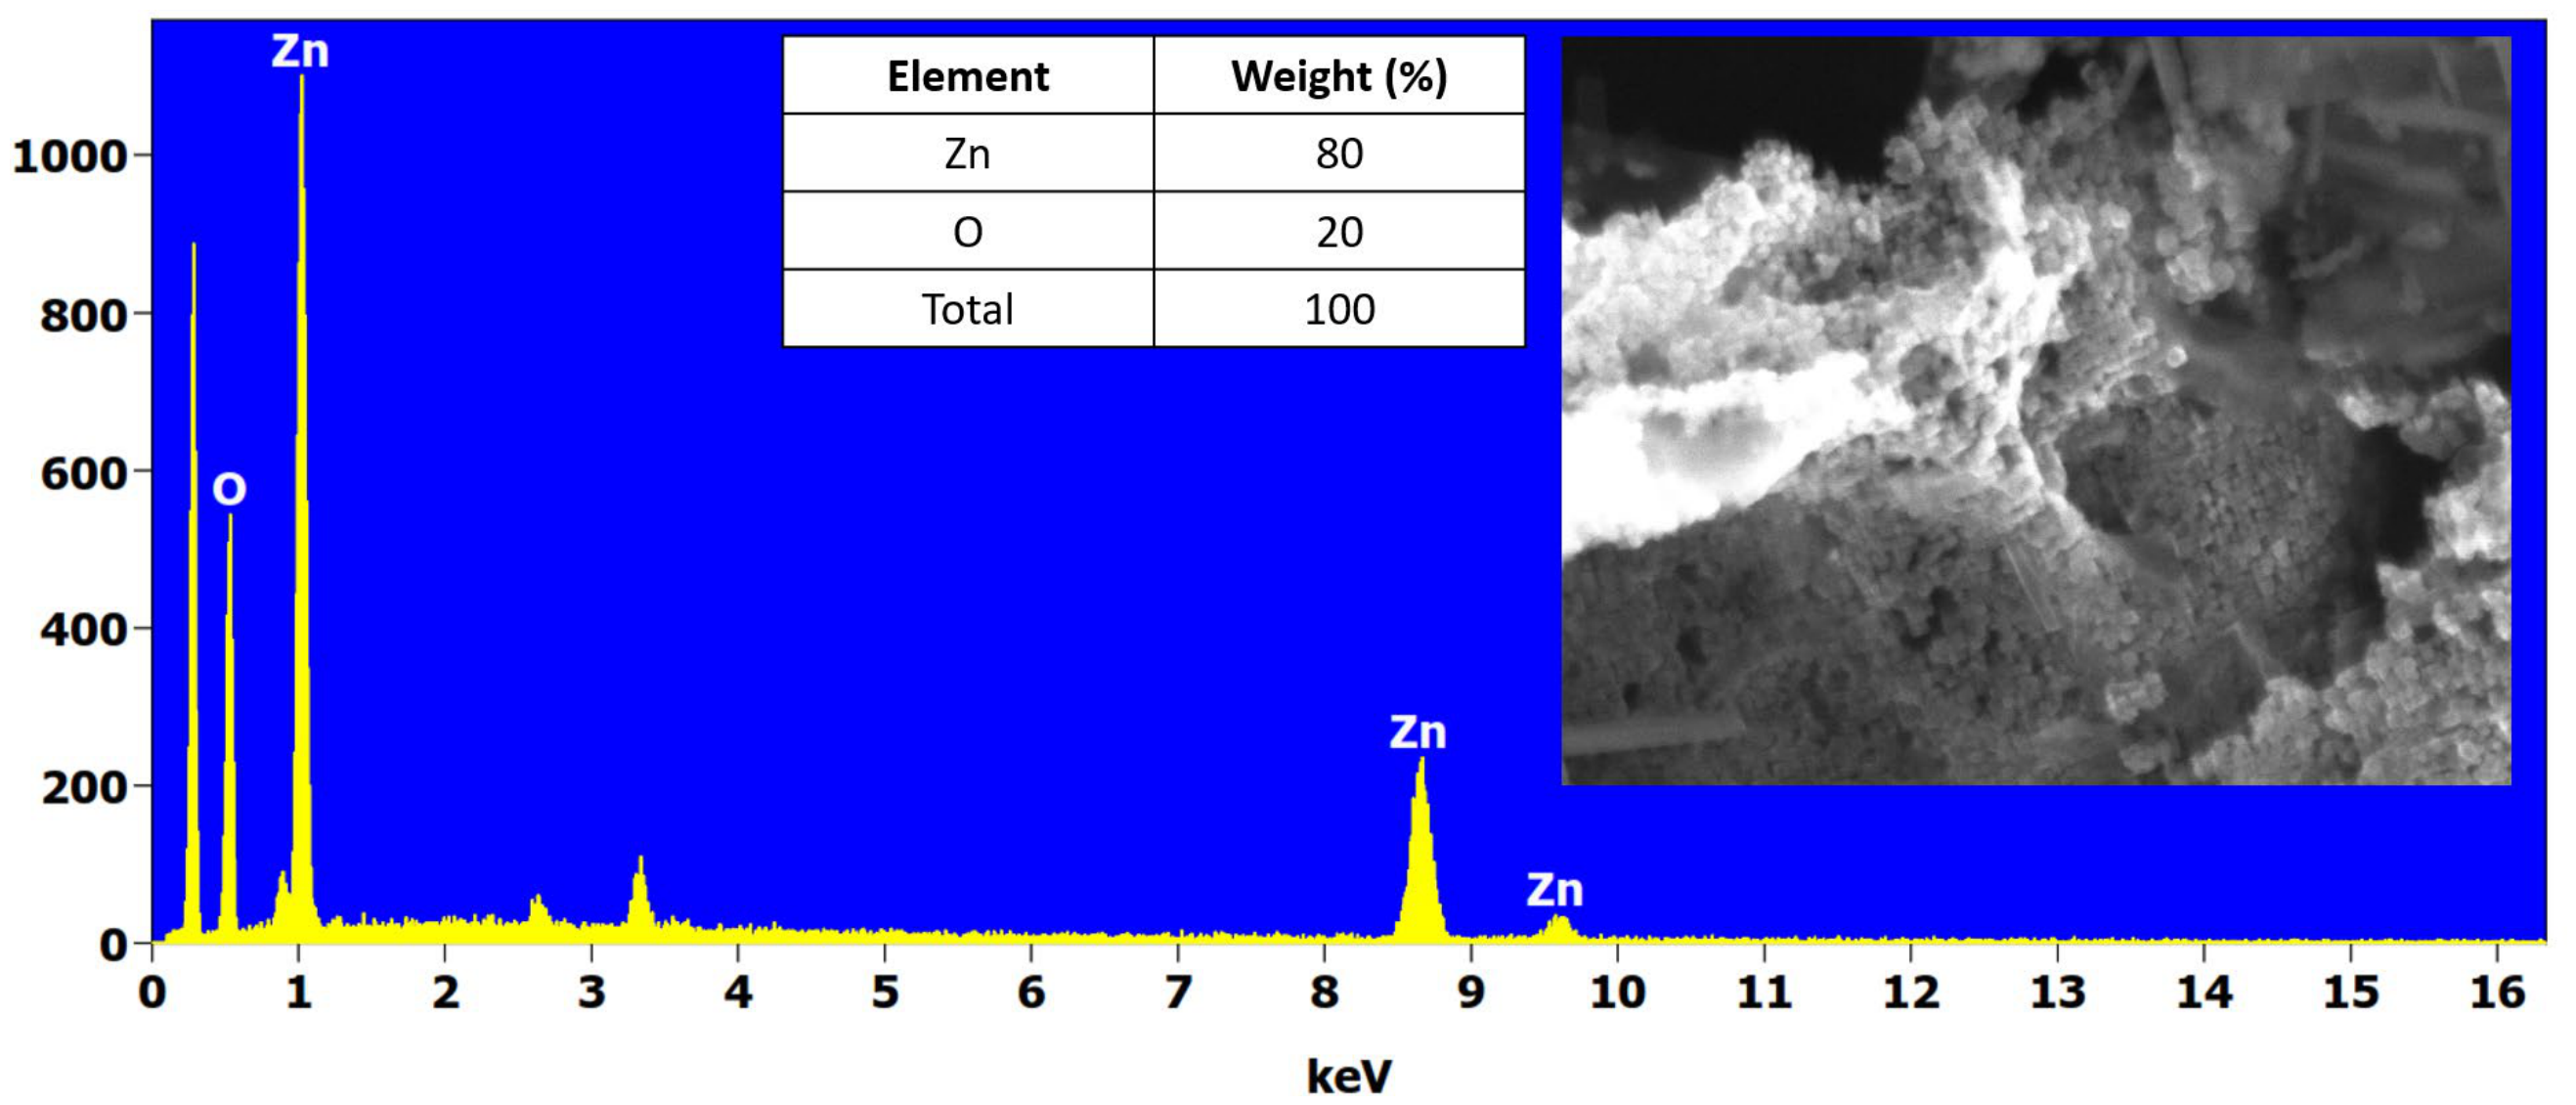
Figure 7 shows the surface morphological and elemental profile obtained by SEM-EDS analysis of the biosynthesized ZnO NPs. A substantial state of nanoparticle agglomeration is clearly visible in the low-magnification SEM micrograph, which contrasts with the high-resolution individual nanostructures isolated via TEM in Figure 3a. Furthermore, the EDS analysis revealed the presence of primarily Zn and O, with weight percentages of 80% and 20%, respectively.
Figure 7.
SEM-EDS analysis of ZnO nanoparticles biosynthesized.
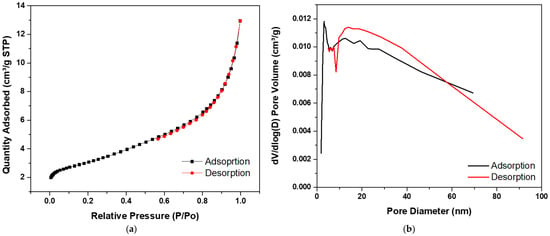
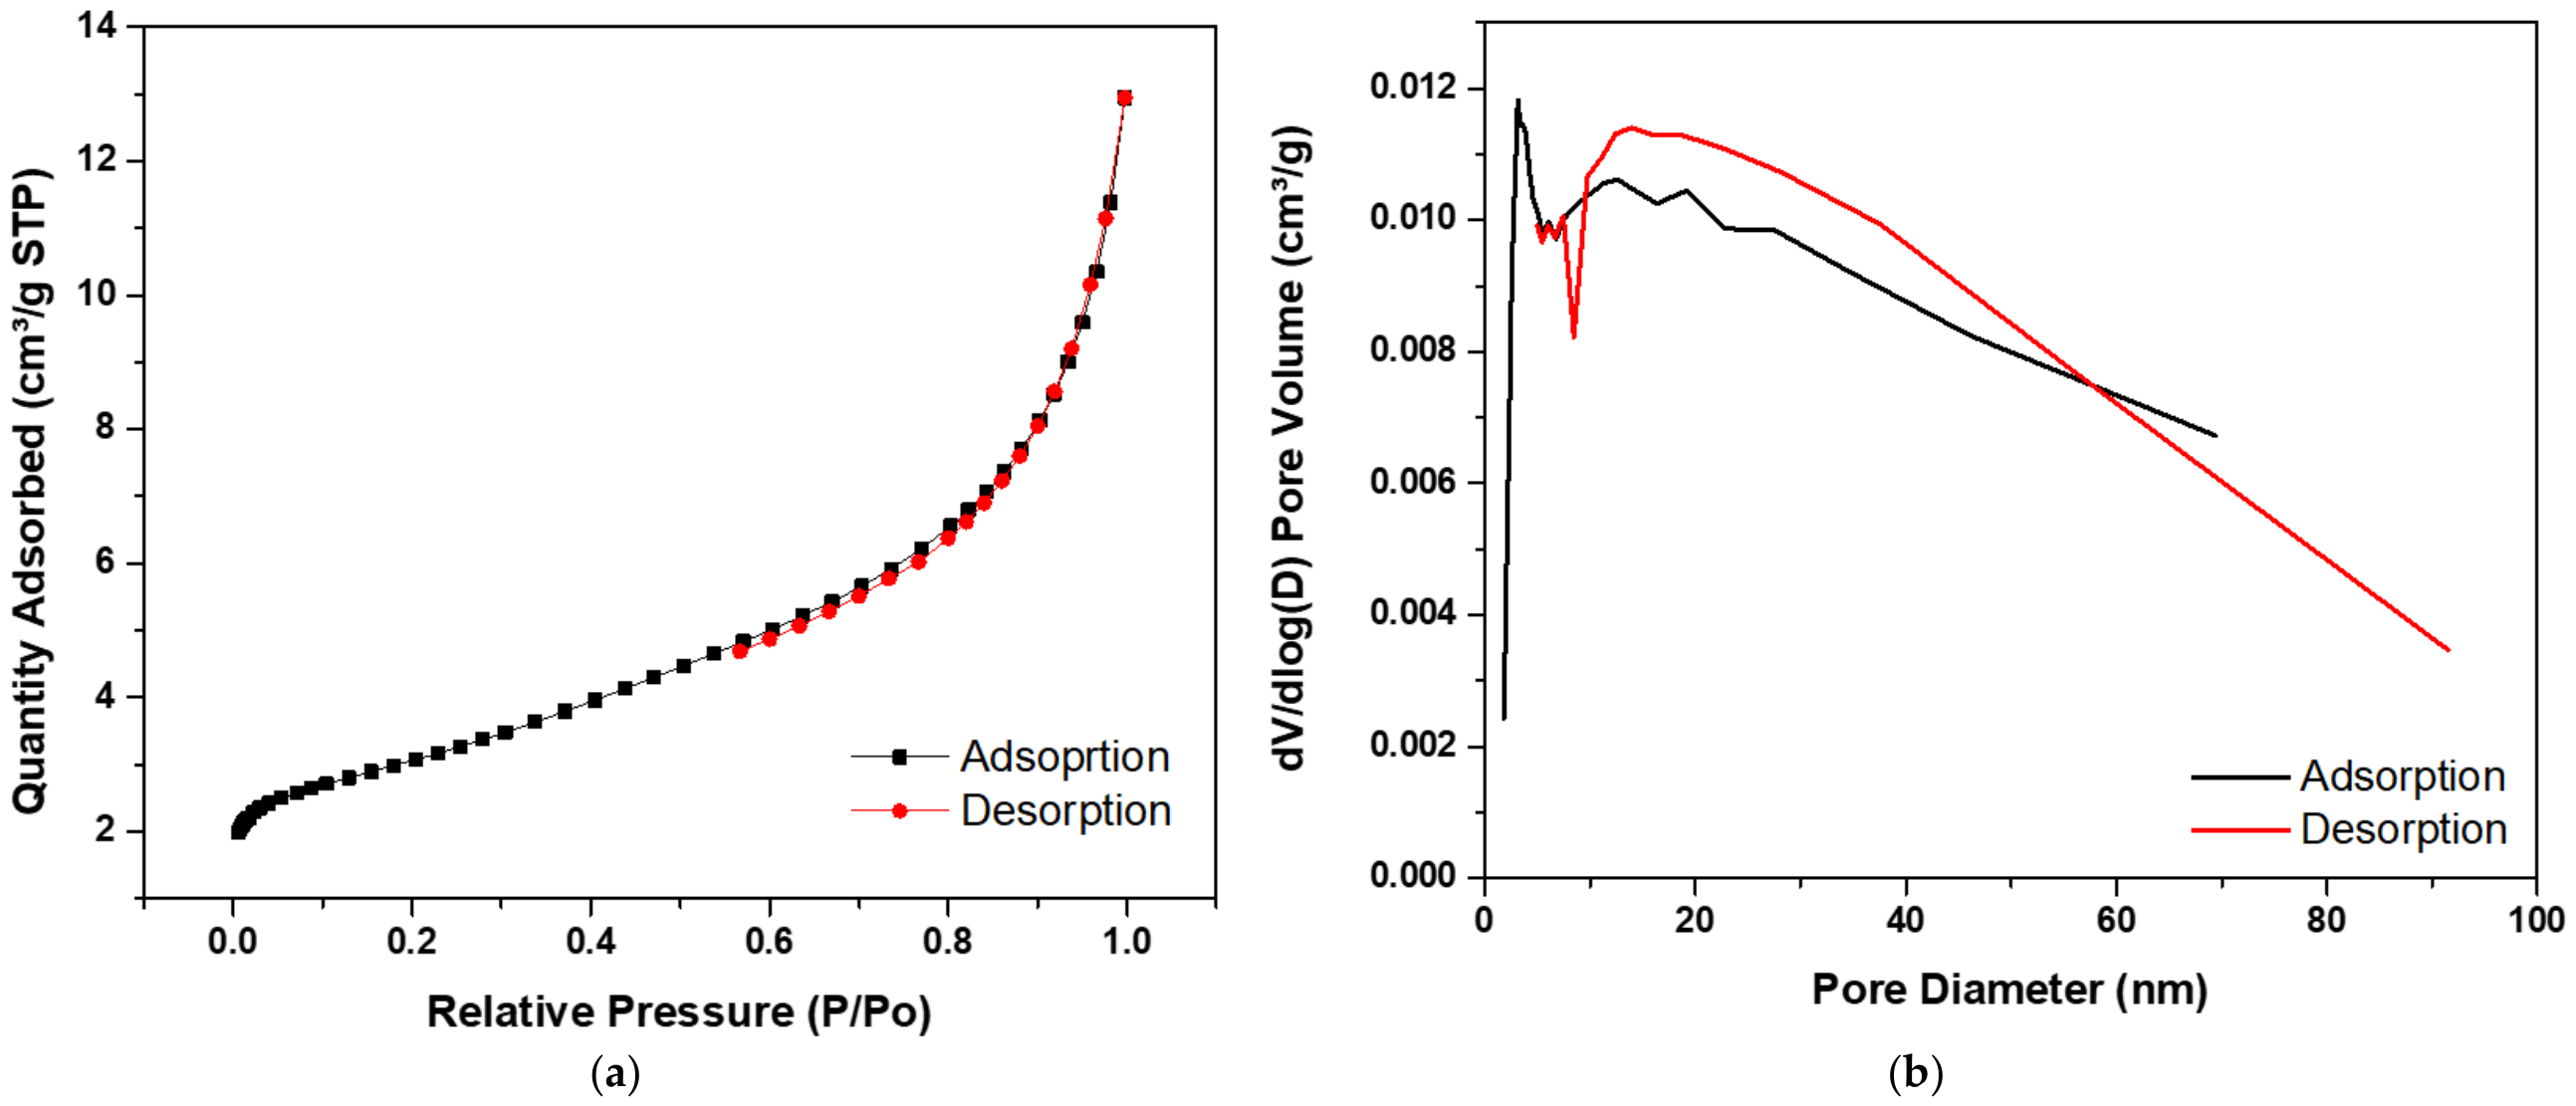
The textural properties and porosity structure of the biosynthesized ZnO NPs were analyzed using nitrogen physisorption. The results corresponding to the adsorption–desorption isotherm, pore size distribution, and calculated quantitative parameters are presented in Figure 8a, Figure 8b, and Table 2, respectively. As shown in Figure 8a, the physisorption profile of the ZnO NPs follows a Type IV isotherm, characteristic of the presence of predominantly mesoporous materials. It is noteworthy that the adsorption and desorption curves exhibit an extremely narrow hysteresis loop in the relative pressure (P/P0) range of 0.5 to 0.9. The absence of pronounced hysteresis suggests that the mesoporosity corresponds to interparticle porosity resulting from the agglomeration of the nanoparticles.
Figure 8.
(a) BET Adsorption/Desorption isotherm and (b) BJH plot.
Table 2.
Parameters obtained from BET analysis for the ZnO NPs biosynthesized.
Furthermore, Figure 8b shows the pore-size distribution curve calculated using the BJH (Barrett–Joyner–Halenda) analysis. The graph shows a detailed heterogeneous distribution ranging from 2 nm to values greater than 60 nm. The first, very sharp, and narrow peak is identified, centered between 3 and 4 nm, indicating the presence of a uniform population of very small mesopores, likely located in the closest-contact zones or at the junctions of the nanoparticle network. The curve shows a broad plateau between 10 and 40 nm, which could indicate a polydisperse, random nature of the interstitial pores, due to the packing of agglomerates of different sizes. The average pore diameter is 28 nm, which could confirm the formal classification of the material as a mesoporous system.
2.2. Degradation of Profenofos Using ZnO Nanoparticles
2.2.1. Optimization
Table 3 presents the results of profenofos degradation efficiency, expressed as a percentage, based on the twelve experiments of the 22 × 3 factorial design, which considered the factors of pH (4 and 5) and ZnO NPs dosage (1 and 3 g/L).
Table 3.
Percentages and degradation in the 22 × 3 factorial design experiments.
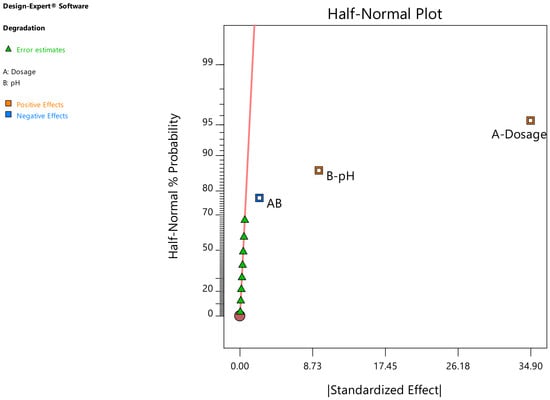
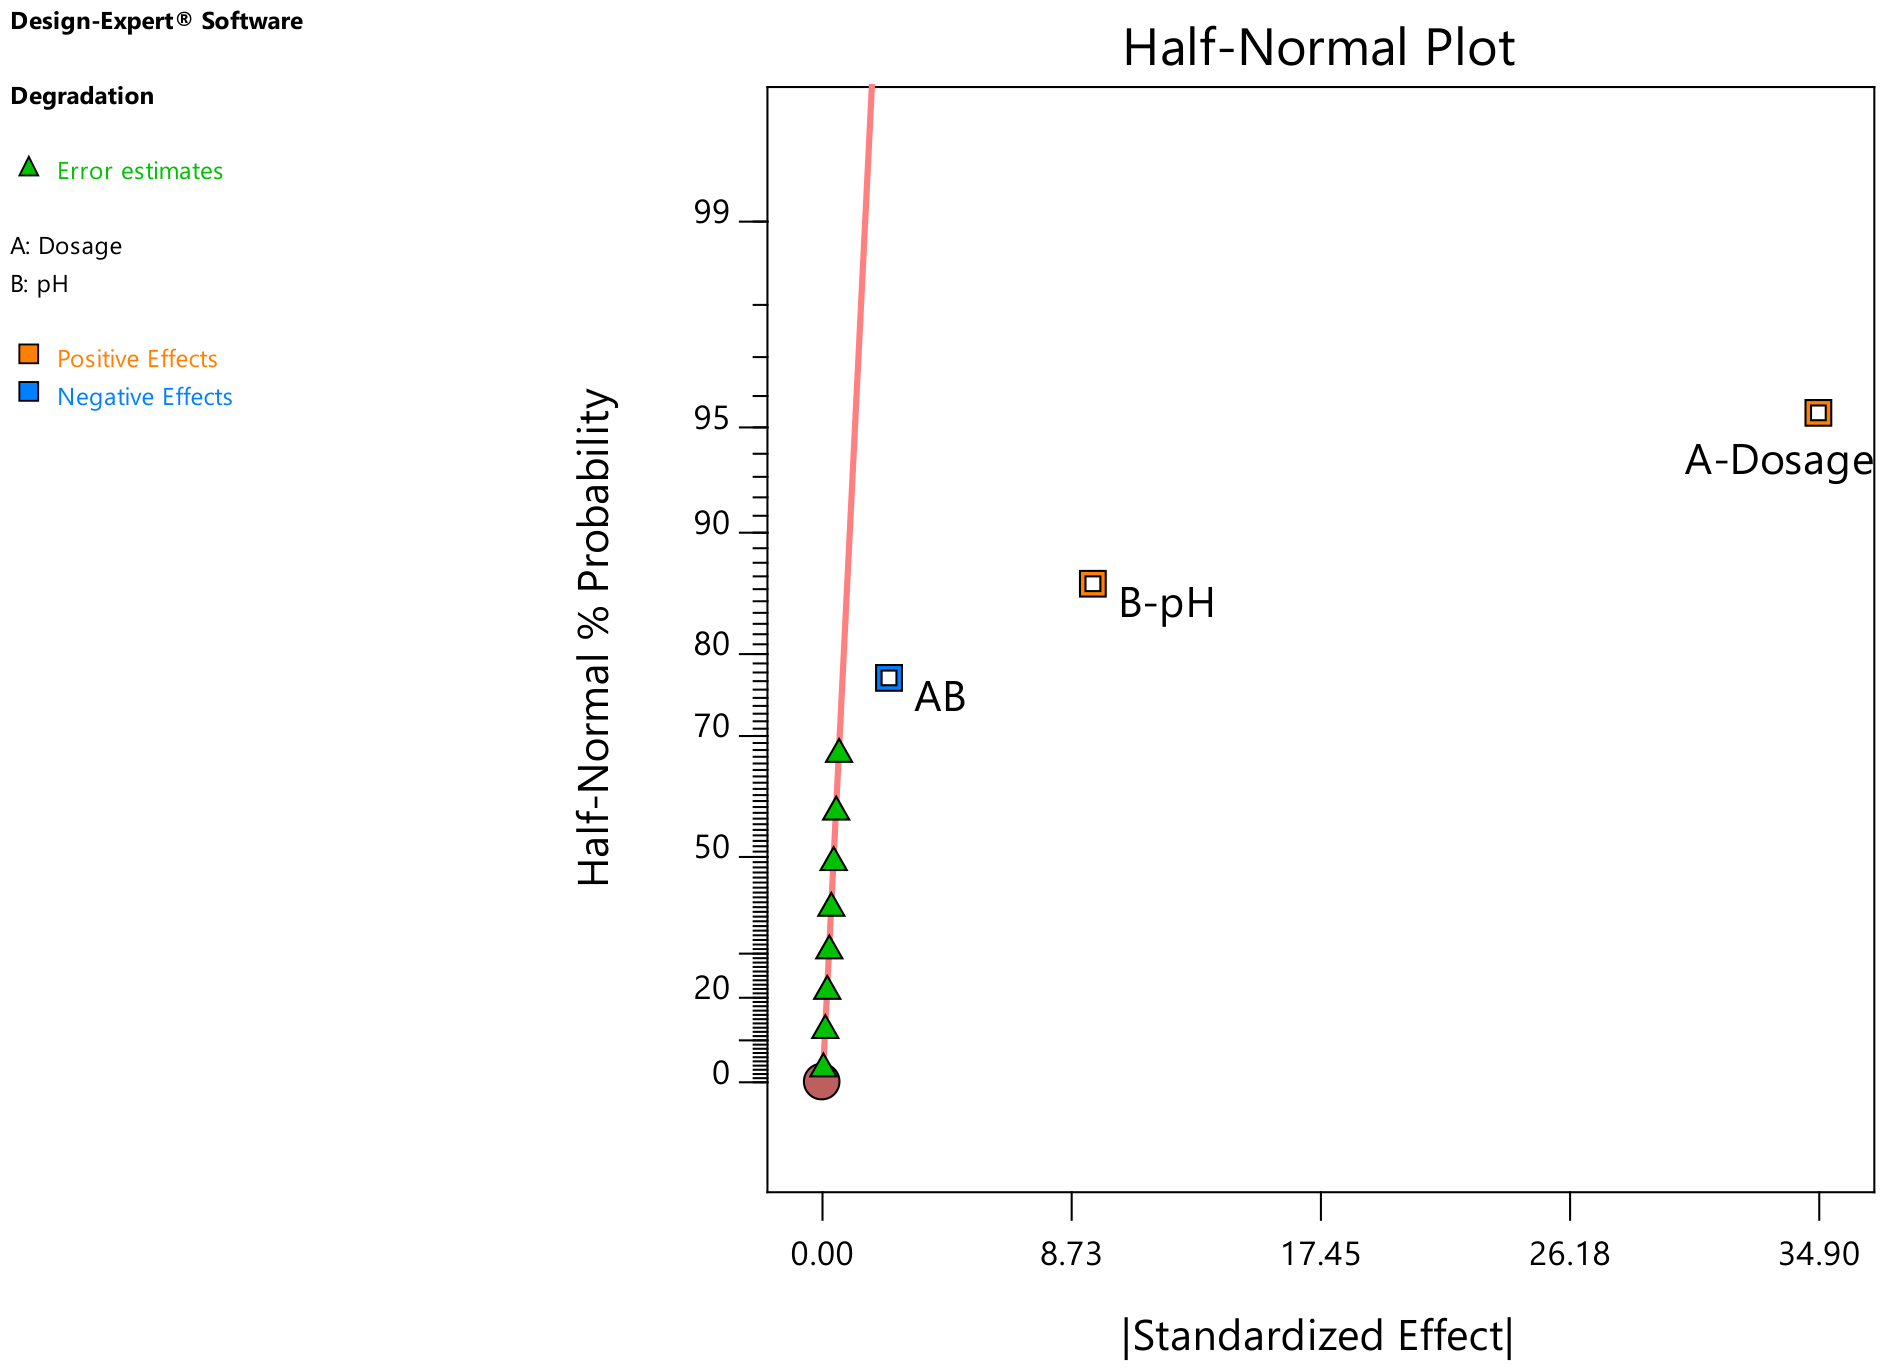
According to the half-normal plot (Figure 9), the dosage of ZnO NPs is the factor with the greatest positive influence on the degradation process; similarly, pH also has a positive influence. In contrast, the interaction between dosage and pH has a negative effect on the degradation process.
Figure 9.
Half-normal plot for evaluating the factors studied in factorial design 22 × 3.
Table 4 presents the analysis of variance for the 22 × 3 factorial design. The p-values are less than 0.05, indicating that the model and the factors studied have a significant influence on profenofos degradation.
Table 4.
Analysis of variance for 22 × 3 factorial design.
Table 5 shows that the value R2-predicted for the model is 0.9951. This value is reasonably consistent with the R2-adjusted value (0.9972), which is adequate; furthermore, the precision was found to be greater than 4 (value = 76.206), indicating an adequate signal, and allowing the model to be used for optimization and theoretical prediction of degradation percentages.
Table 5.
Values for R2, R2-adjusted, R2-predicted, and model precision.
The mathematical model is presented in Equation 1 below. This equation can be used to make theoretical predictions of profenofos degradation, considering the ZnO NPs dosage and pH.
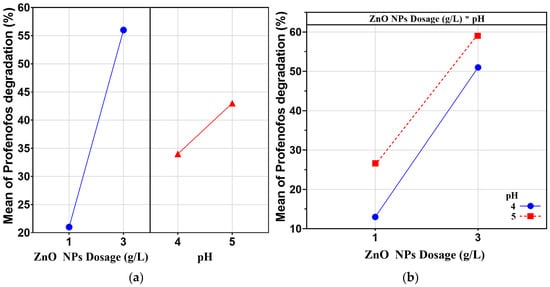
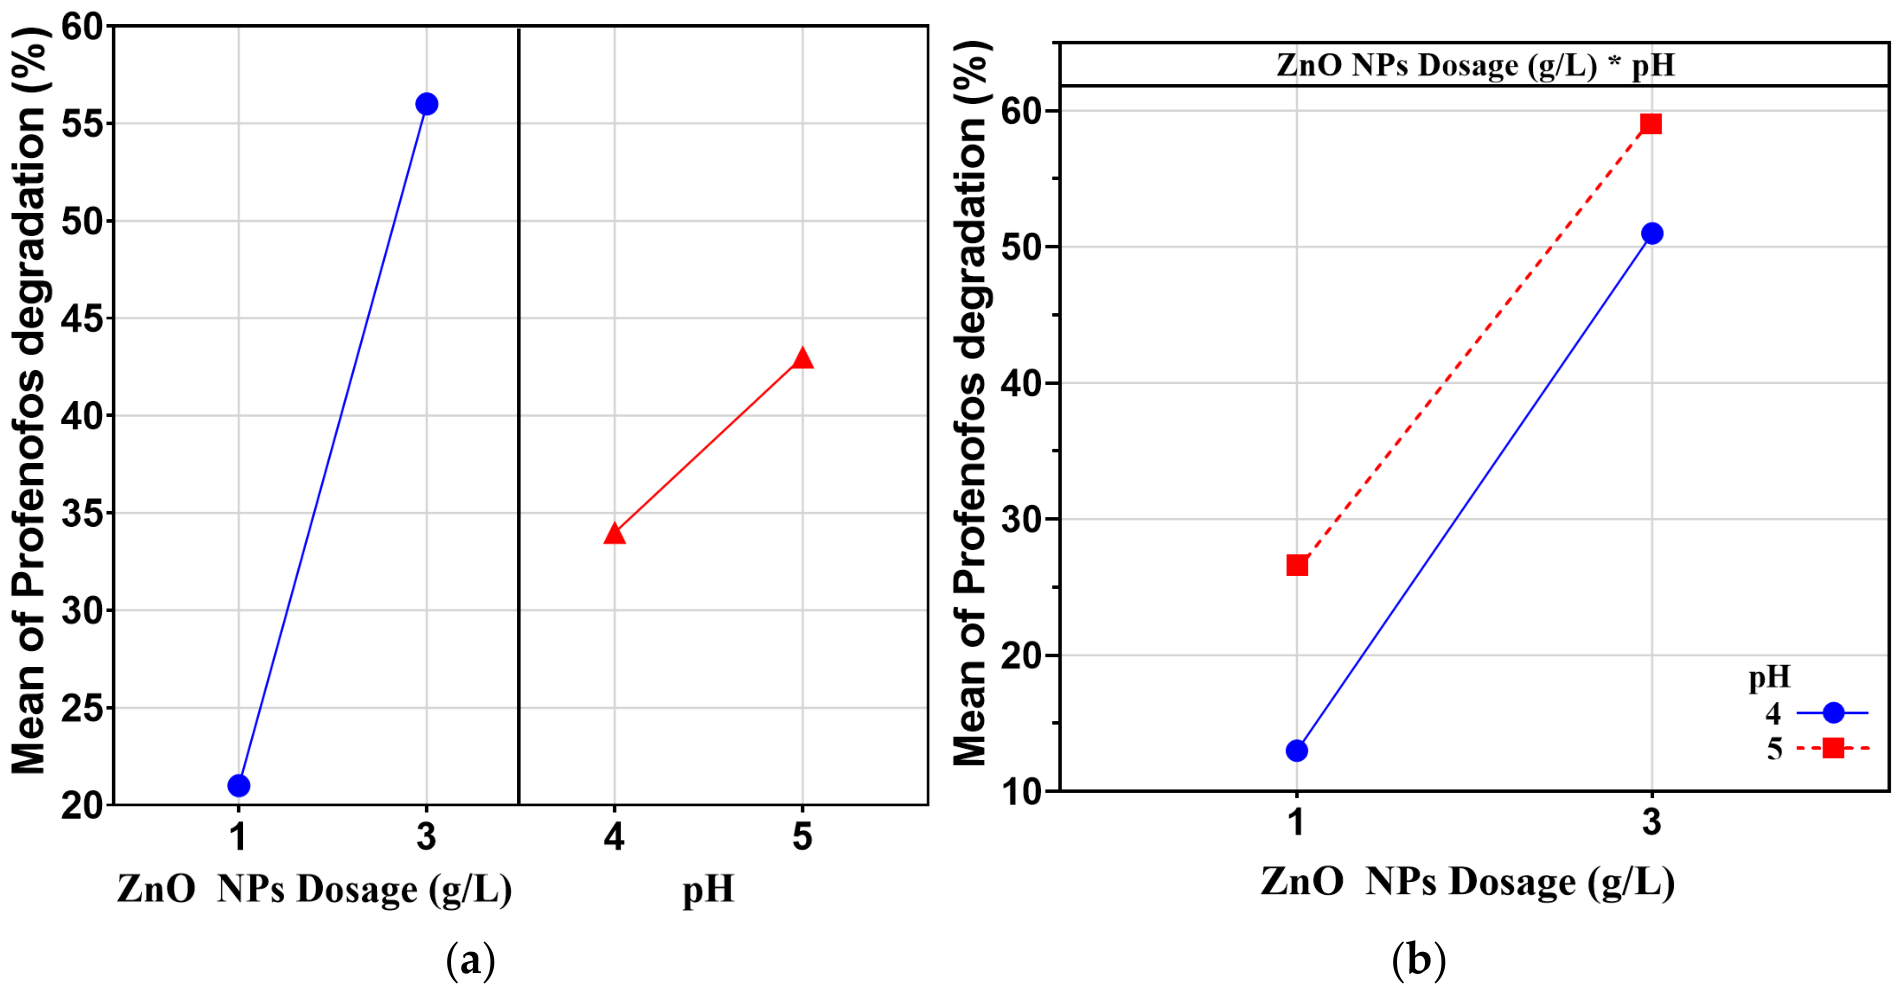
Figure 10a shows the main effects plot for the degradation of profenofos with respect to the factors of ZnO NP dosage and pH. It is observed that the highest degradation efficiency is achieved at a dosage of 3 g/L, and at pH = 5. Figure 10b shows the interaction plot for the degradation of profenofos, where pH has a positive effect at both low and high ZnO NPs dosage. This indicates a positive interaction between ZnO NPs dosage and pH with respect to profenofos degradation.
Figure 10.
(a) Main effects plot and (b) interaction plot for the degradation of profenofos as a function of ZnO NPs dosage and pH (*, interaction between ZnO NPs dosage and pH).
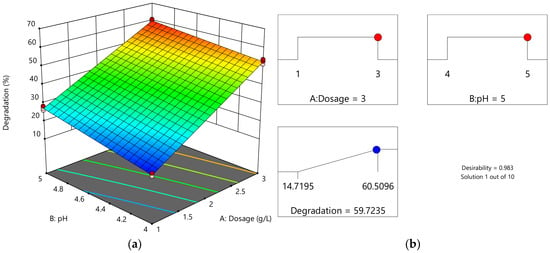
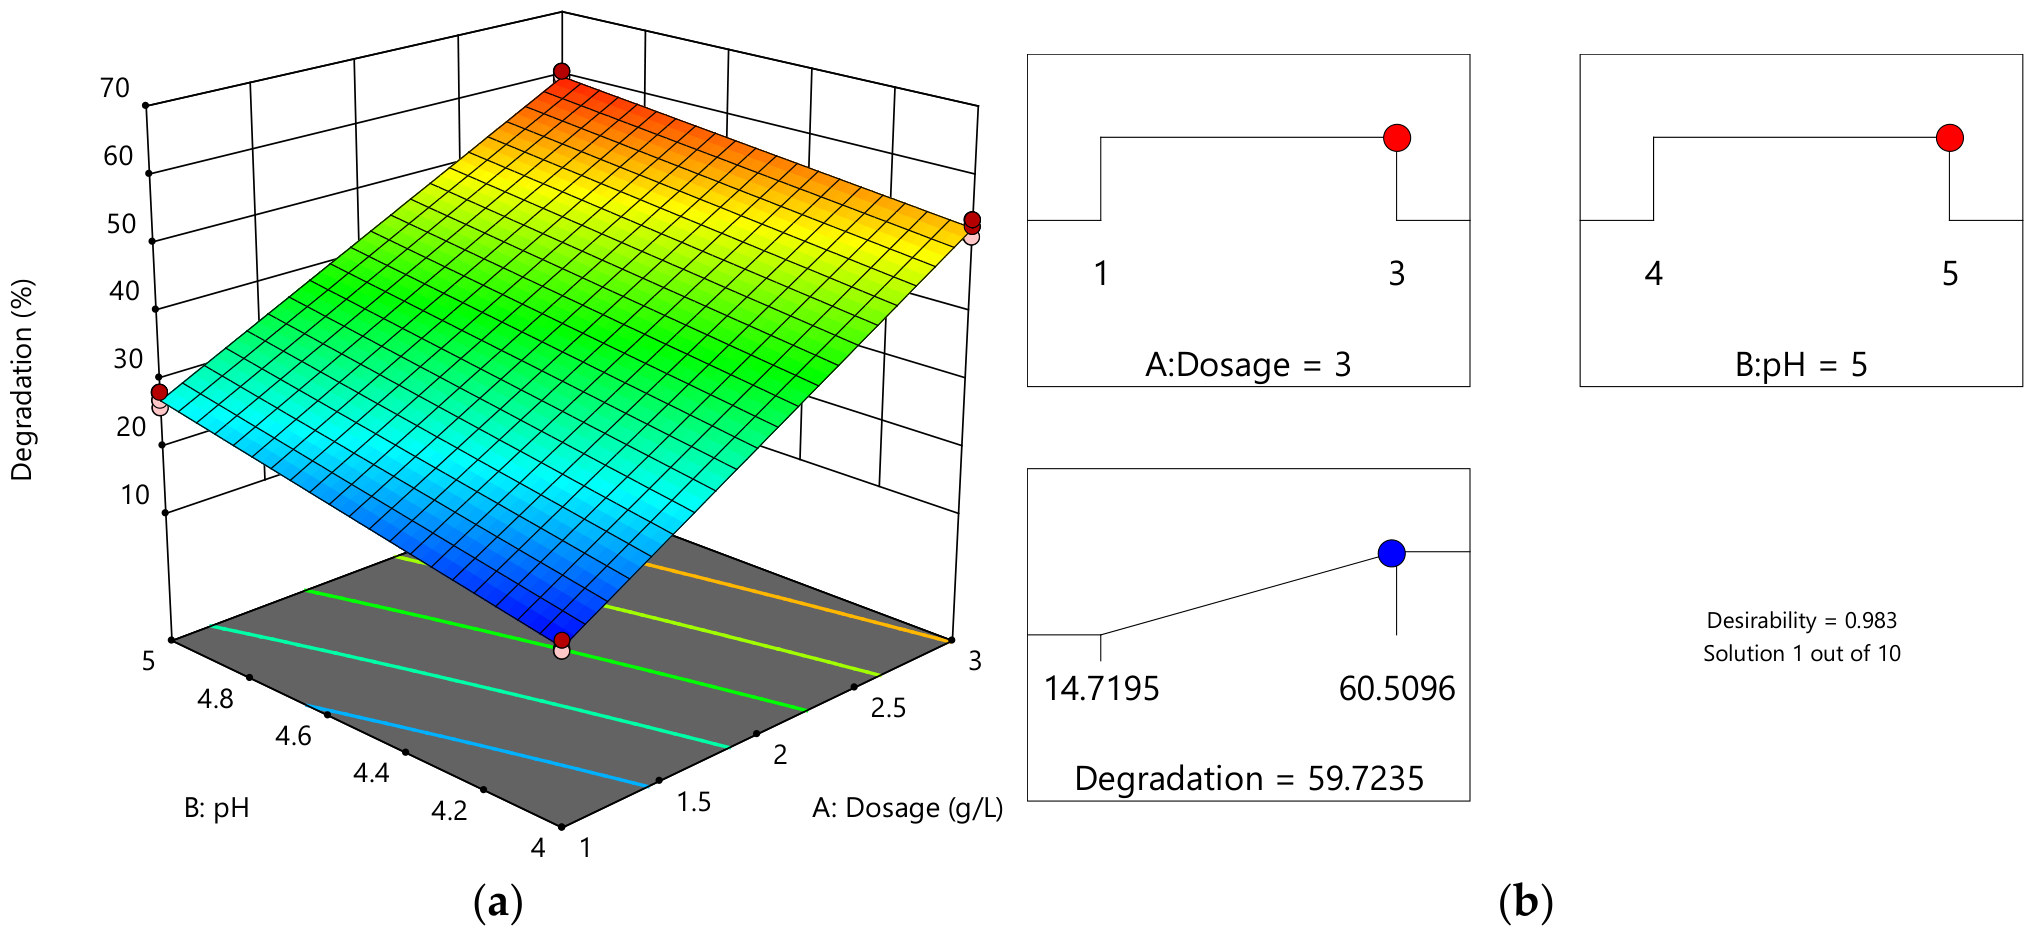
Figure 11a shows the surface plot of profenofos degradation, which indicates that degradation efficiency increases with higher dosages. Similarly, degradation efficiency also increases with higher pH. Furthermore, the greatest degradation occurs at higher ZnO NPs dosage and higher pH.
Figure 11.
(a) Surface plot and (b) ramp plot for the optimization of profenofos degradation as a function of ZnO NPs dosage and pH.
The degradation process of profenofos was optimized with the objective of maximizing the percentage of profenofos degradation; regarding the dosage values of ZnO NPs and pH, which were suggested by the optimization ramp tool in Design Expert software v.11 (Figure 11b), resulting in a 59.72% degradation efficiency of profenofos using an optimal ZnO NPs dosage of 3 g/L and an optimal pH of 5, with a desirability of 0.983.
2.2.2. Kinetics
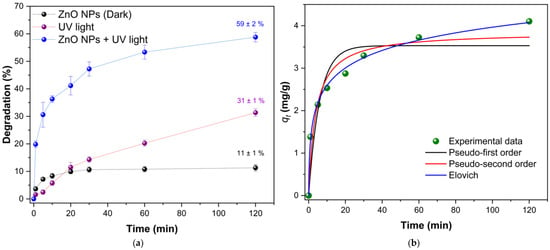
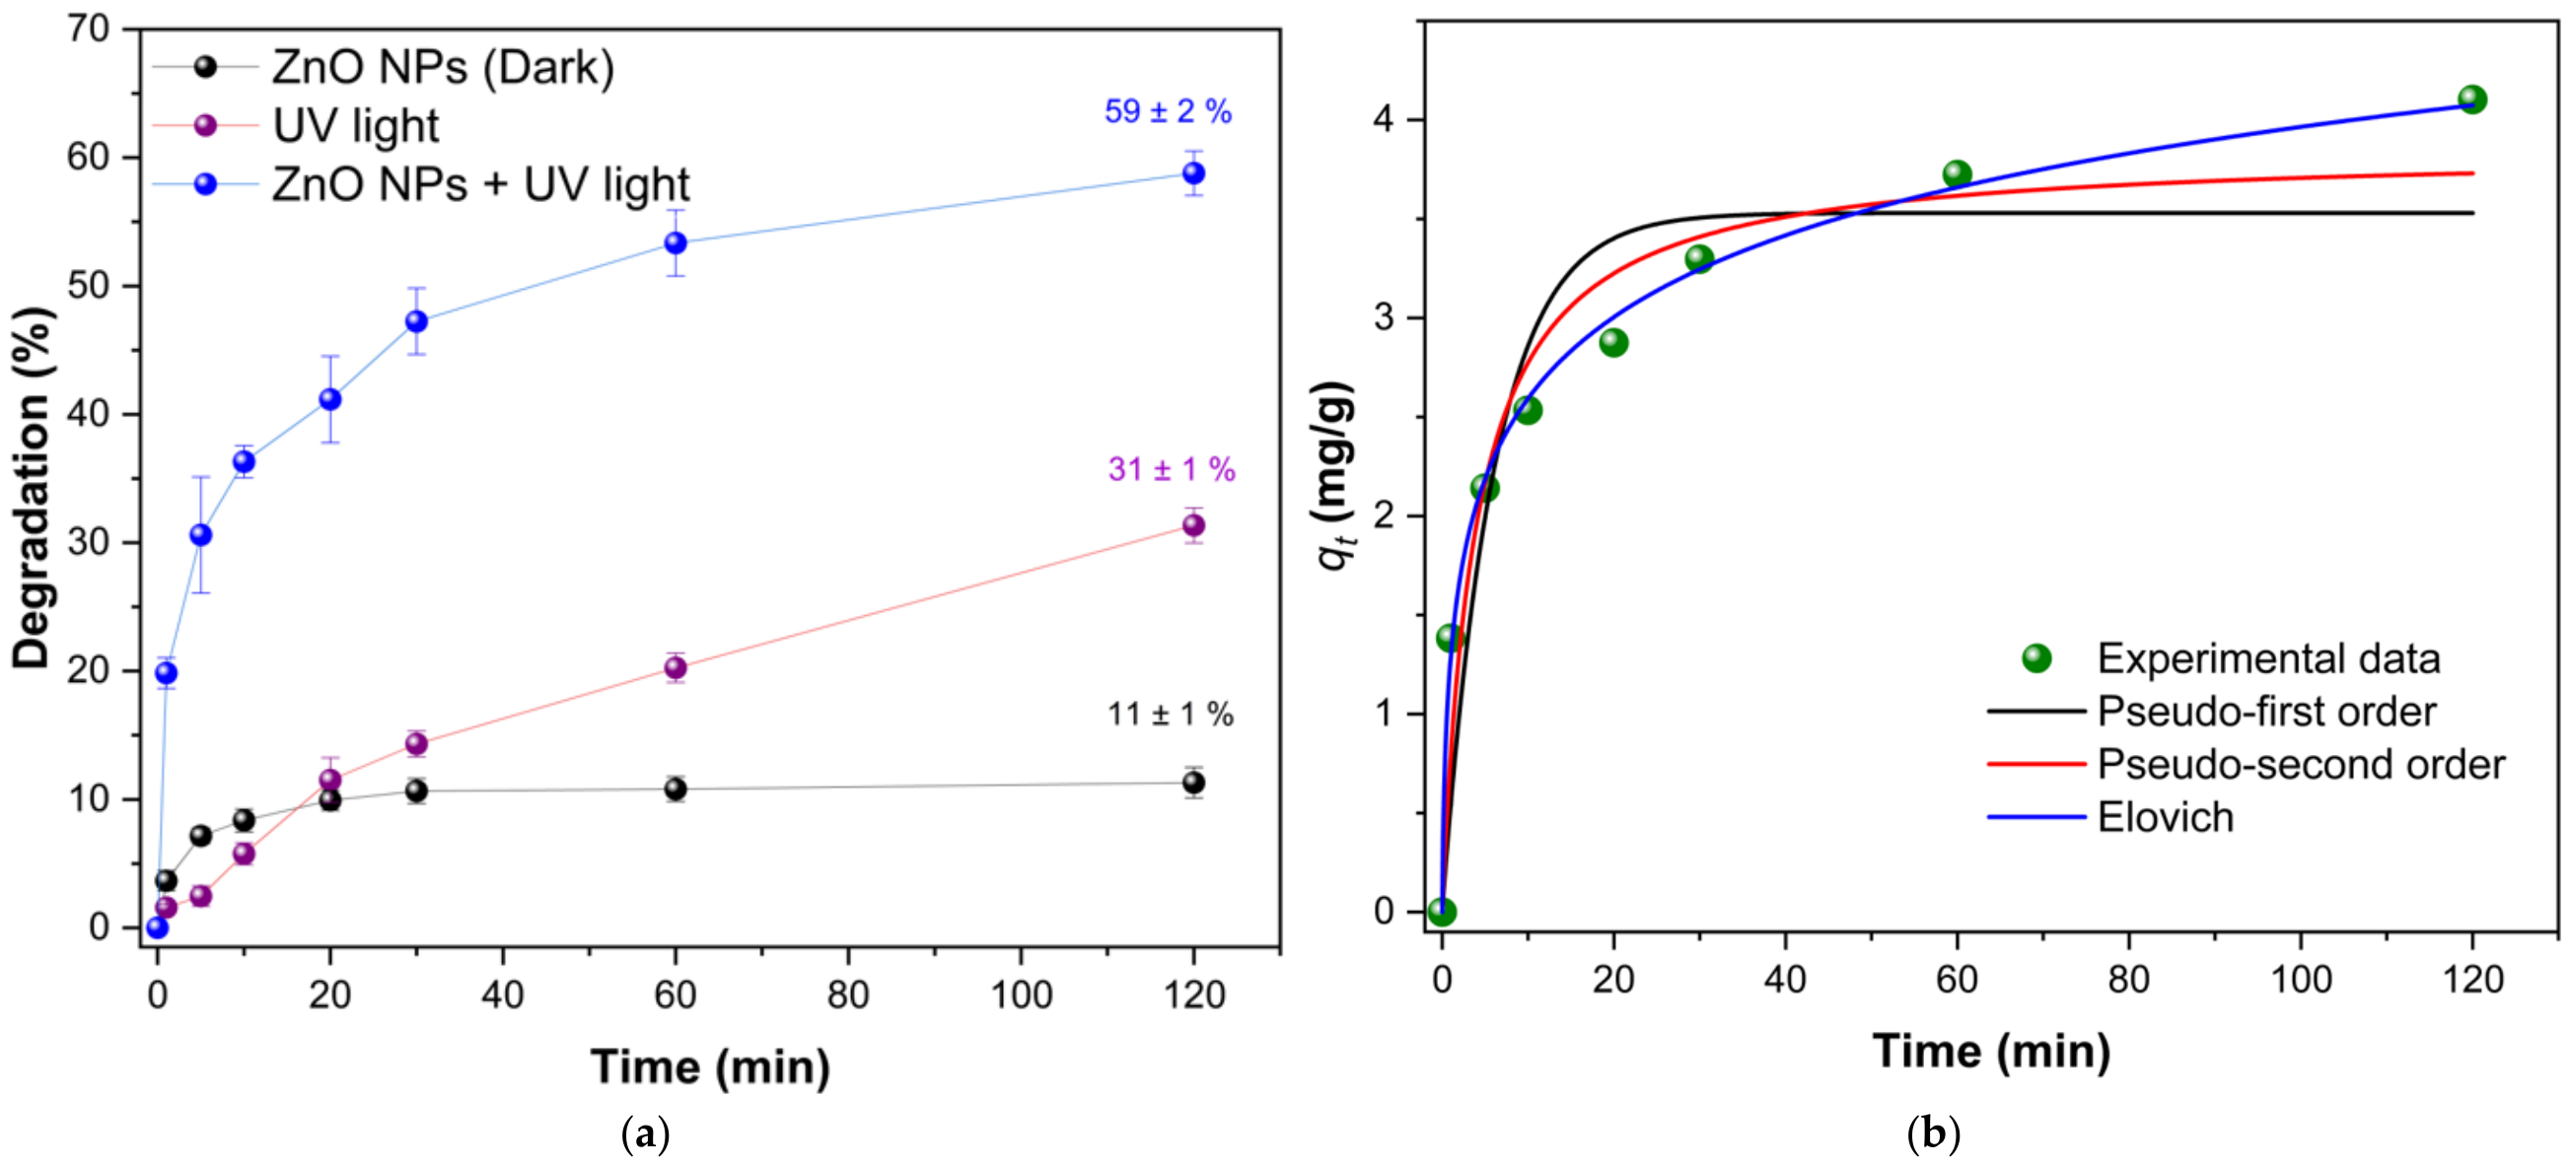
Degradation experiments of profenofos (initial concentration of 20 mg/L) were conducted at optimal ZnO NPs dosages and pH levels. Monitoring times were at 0, 1, 5, 10, 20, 30, 60, and 120 min. In addition, control experiments were conducted involving direct photolysis (UV light without ZnO NPs) and adsorption in the dark (ZnO NPs without light). Figure 12a shows the degradation efficiencies as a function of time. Under dark conditions (ZnO NPs Dark), a degradation of profenofos of 11 ± 1% was registered, reaching equilibrium after 20 min of stirring. This would indicate that profenofos molecules have an affinity for the mesoporous surface of the ZnO NPs. On the other hand, direct UV photolysis (UV light) produced a primary degradation of 31 ± 1% at 120 min, demonstrating that profenofos would undergo partial direct photolytic degradation under the studied UV radiation. It is important to note that the simultaneous presence of ZnO NPs and UV light (ZnO NPs + UV light) triggered a synergistic effect, maximizing primary degradation efficiency to 59 ± 2%. This notable improvement could be attributed to the continuous generation of reactive oxygen species on the surface of the ZnO NPs, which accelerates the decomposition of profenofos. This experimental degradation value (59 ± 2%) corresponds exactly to the average of three independent experiments conducted exclusively under optimized conditions, demonstrating the high precision of the advanced oxidation process under optimal parameters. Three distinct batches of ZnO nanoparticles were synthesized independently using three different aqueous grape seed extracts prepared prior to each synthesis. The low standard deviation demonstrates that the phytochemical matrix of the agro-industrial waste from the Negra Criolla variety provides a reliable and robust framework for the stable replication of the catalyst.
Figure 12.
(a) Comparison of profenofos degradation via dark adsorption (ZnO Dark), direct photolysis (UV light), and photocatalysis (ZnO + UV light). (b) Graph of pseudo first order, pseudo second order, and Elovich kinetic model fits for profenofos degradation.
Figure 12b shows the fit of the adsorption capacities as a function of time to the pseudo-first order, pseudo-second order, and Elovich nonlinear kinetic models. Graphically, the pseudo-second-order and Elovich models provide a better fit than the pseudo-first-order model.
Table 6 presents the parameter values for the kinetic models. The pseudo-second order model has an R2 of 0.9441, which is higher than the pseudo-first order model (R2 = 0.8775). Furthermore, the Elovich kinetic model shows an excellent fit (R2 = 0.9967), which would indicate a highly heterogeneous surface; this is consistent with the structural and biogenic nature of the ZnO biosynthesized in this study. As established by XRD, TEM, and BET characterizations, the nanoparticles exhibit a mesoporous structure formed by compact aggregates, which gives rise to a wide variety of surface defects, interstitial bonds, and uncompensated crystal edges. It was also observed that the adsorption capacity of profenofos on ZnO NPs at equilibrium is 3.851 mg/g, with a rate of 0.067 g.mg−1min−1.
Table 6.
Parameter values for nonlinear kinetic models.
Table 7 shows the degradation percentages of profenofos obtained using different catalysts, supporting the use of these materials for the removal of organophosphate pesticides such as profenofos.
Table 7.
Comparison of the degradation efficiency of profenofos using different photocatalysts.
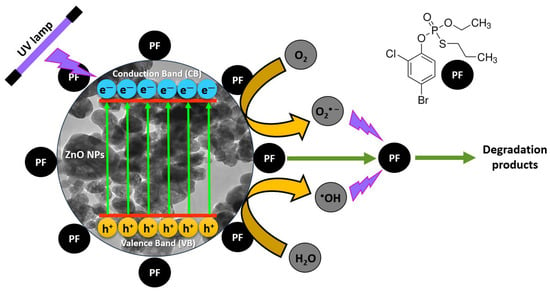
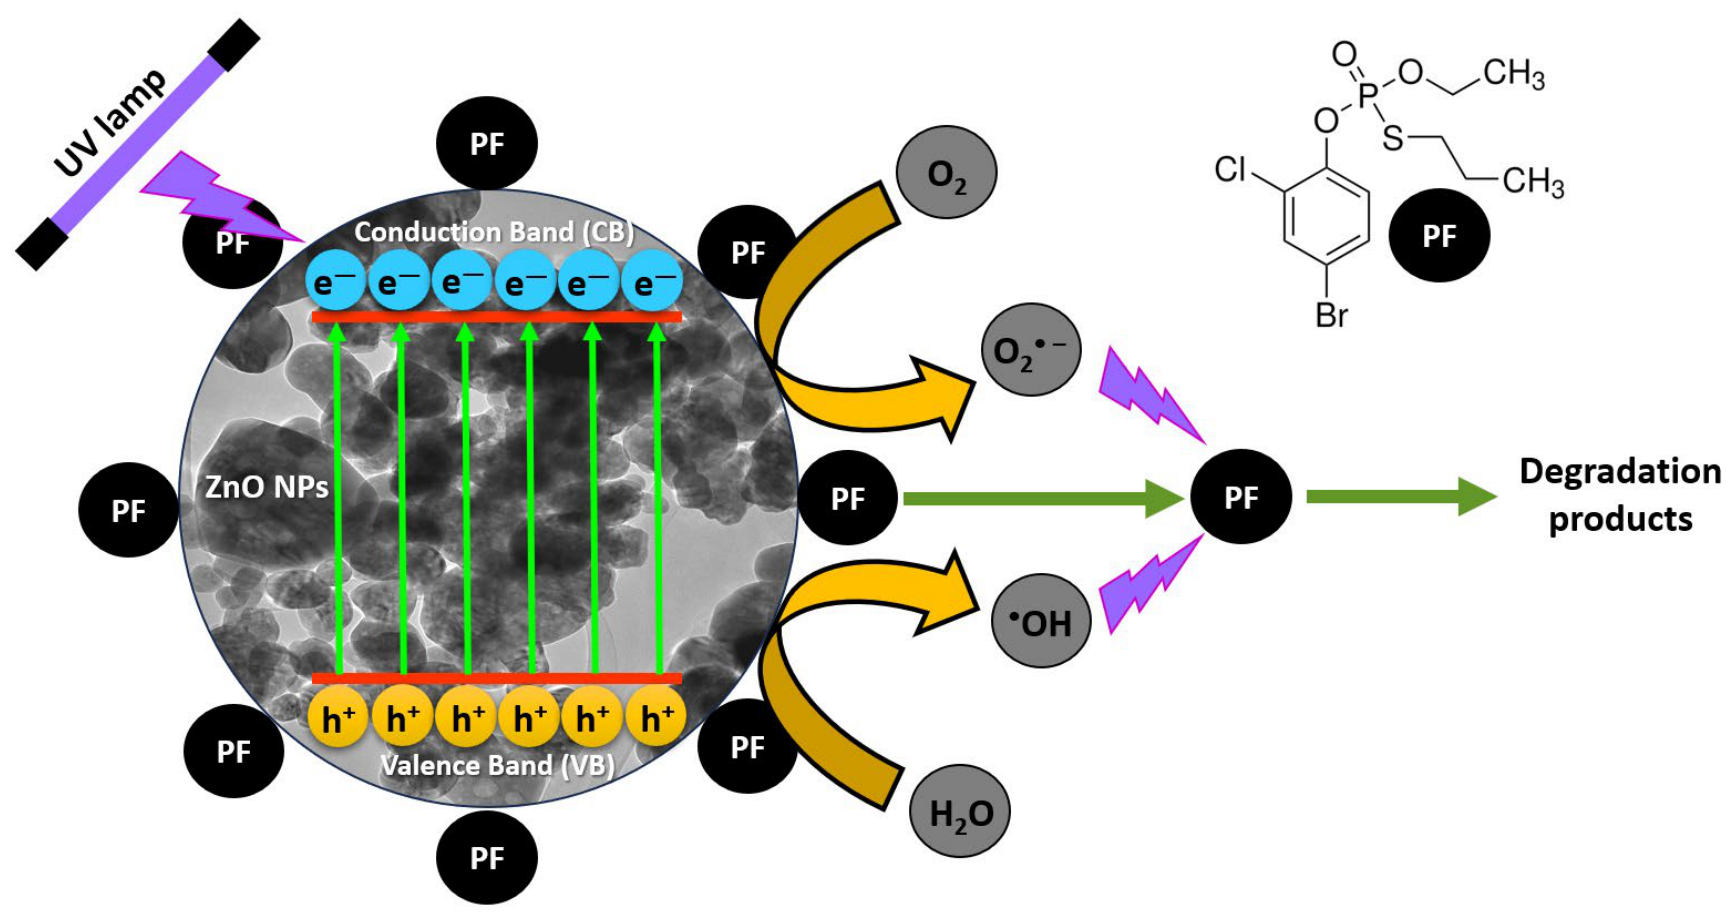
Figure 13 shows a schematic diagram of the degradation mechanism of profenofos using ZnO NPs biosynthesized from an aqueous extract of defatted grape seeds. This mechanism aligns with fundamental principles of semiconductor photocatalysis documented in the literature [48]. The process is initiated when photons from the UV radiation (30 W UV lamp) source (hν) strike the catalyst with an energy equal to or greater than the optical bandgap of the ZnO NPs (2.92 eV), promoting the separation and migration of charge carriers (electrons () and holes ()) (Equation (2)). The electrons interact with adsorbed oxygen molecules to generate superoxide anion radicals () (Equation (3)), while the holes interact with water molecules or hydroxyl ions to generate highly reactive hydroxyl radicals () (Equation (4)). Crucially, the subsequent degradation of the organophosphate pesticide does not take place exclusively at the ZnO NPs surface; instead, it proceeds via two simultaneous pathways (Equation (5)):
Figure 13.
Proposed mechanism of profenofos degradation.
2.3. Limitations
Although the biosynthesized ZnO nanoparticles demonstrated competitive performance in the primary degradation of profenofos in synthetic solutions, their long-term structural stability and reusability over multiple reaction cycles were not experimentally evaluated at this stage of the study. This aspect constitutes a recognized technical limitation, as zinc oxide semiconductors are known to undergo partial photocorrosion under prolonged ultraviolet radiation in aqueous environments.
On the other hand, the chromatographic methodology used only allowed for monitoring the primary degradation of the profenofos molecule. This is a limitation of the present study, as total mineralization into inorganic species was not quantified through total organic carbon analysis. However, according to the literature on the photocatalytic degradation of organophosphate pesticides, the initial attack by the generated reactive species targets the P=O and P=S groups of the pesticide, leading to its decomposition into phosphate compounds [49]. As a result of this primary degradation of profenofos’s chemical structure, the organophosphate would not bind to the enzyme acetylcholinesterase (AChE), which is an important step in terms of toxicity to non-target organisms.
To bridge the gap between controlled laboratory conditions and real-world applications, it is essential to consider the potential impact of the aqueous matrix composition on photocatalytic performance. Although biologically derived ZnO NPs achieved competitive primary degradation in synthetic solutions, transferring this system to an actual contaminated surface or groundwater introduces complex chemical species, such as natural organic matter and ubiquitous inorganic anions like chlorides, sulfates, and bicarbonates. These matrix components typically hinder photocatalytic kinetics through two main mechanisms: competitive occupation of active sites and radical scavenging [18].
3. Materials and Methods
3.1. Reagents and Equipment
For this study, HPLC-grade acetonitrile from Merck (Darmstadt, Germany) was used. Profenofos PESTANAL and zinc acetate were obtained from Sigma Aldrich (St. Louis, MO, USA). The 10% Tween was obtained from Bio-Rad (Hercules, CA, USA). Ultrapure water was used in all experiments. The surface plasmon resonance phenomenon was analyzed using the Agilent Technologies Cary 60 UV/Vis Spectrophotometer (Santa Clara, CA, USA). Characterization was performed using the Agilent Cary 630 Attenuated Total Reflectance (ATR)-Fourier Transform Infrared (FTIR) spectrometer. Profenofos quantifications were performed on the Hitachi Primaide high-resolution liquid chromatograph (HPLC, Tokyo, Japan). An RP-18 column (260 × 4 mm) was used. Calcination was performed in a Thermo Scientific Thermolyne muffle furnace, model FB1410M (Waltham, MA, USA). Microphotographs of the nanoparticles were taken using a Thermo Scientific Talos F200i transmission electron microscope.
3.2. Seed Collection
In this study, grape seeds of the Negra Criolla variety were used. The seeds, which had been defatted by pressing, were obtained from a company specializing in the production of wine and pisco in the district of Vitor, Arequipa (−16.4717188, −71.9393714). The pressed grape seeds were dried at 40 °C for 24 h and then pulverized in a blade mill. The pulverized seeds were dried a second time at 40 °C for 24 h.
3.3. Obtaining the Extract
To determine the extract to be used in the synthesis of nanoparticles, four aqueous extracts were prepared at concentrations of 1%, 5%, 10%, and 15%. To do this, 0.5, 2.5, 5, and 7.5 g of the powder were weighed into reflux flasks, and 50 mL of ultrapure water were added. The cooling system was then connected, and the mixture was boiled for 5 min. The extracts were allowed to cool and were then filtered. The aqueous extracts were used for the synthesis of nanoparticles.
3.4. Synthesis of Nanoparticles
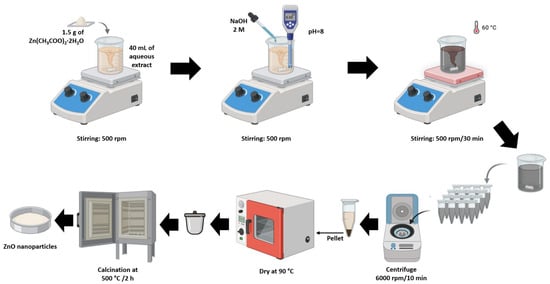
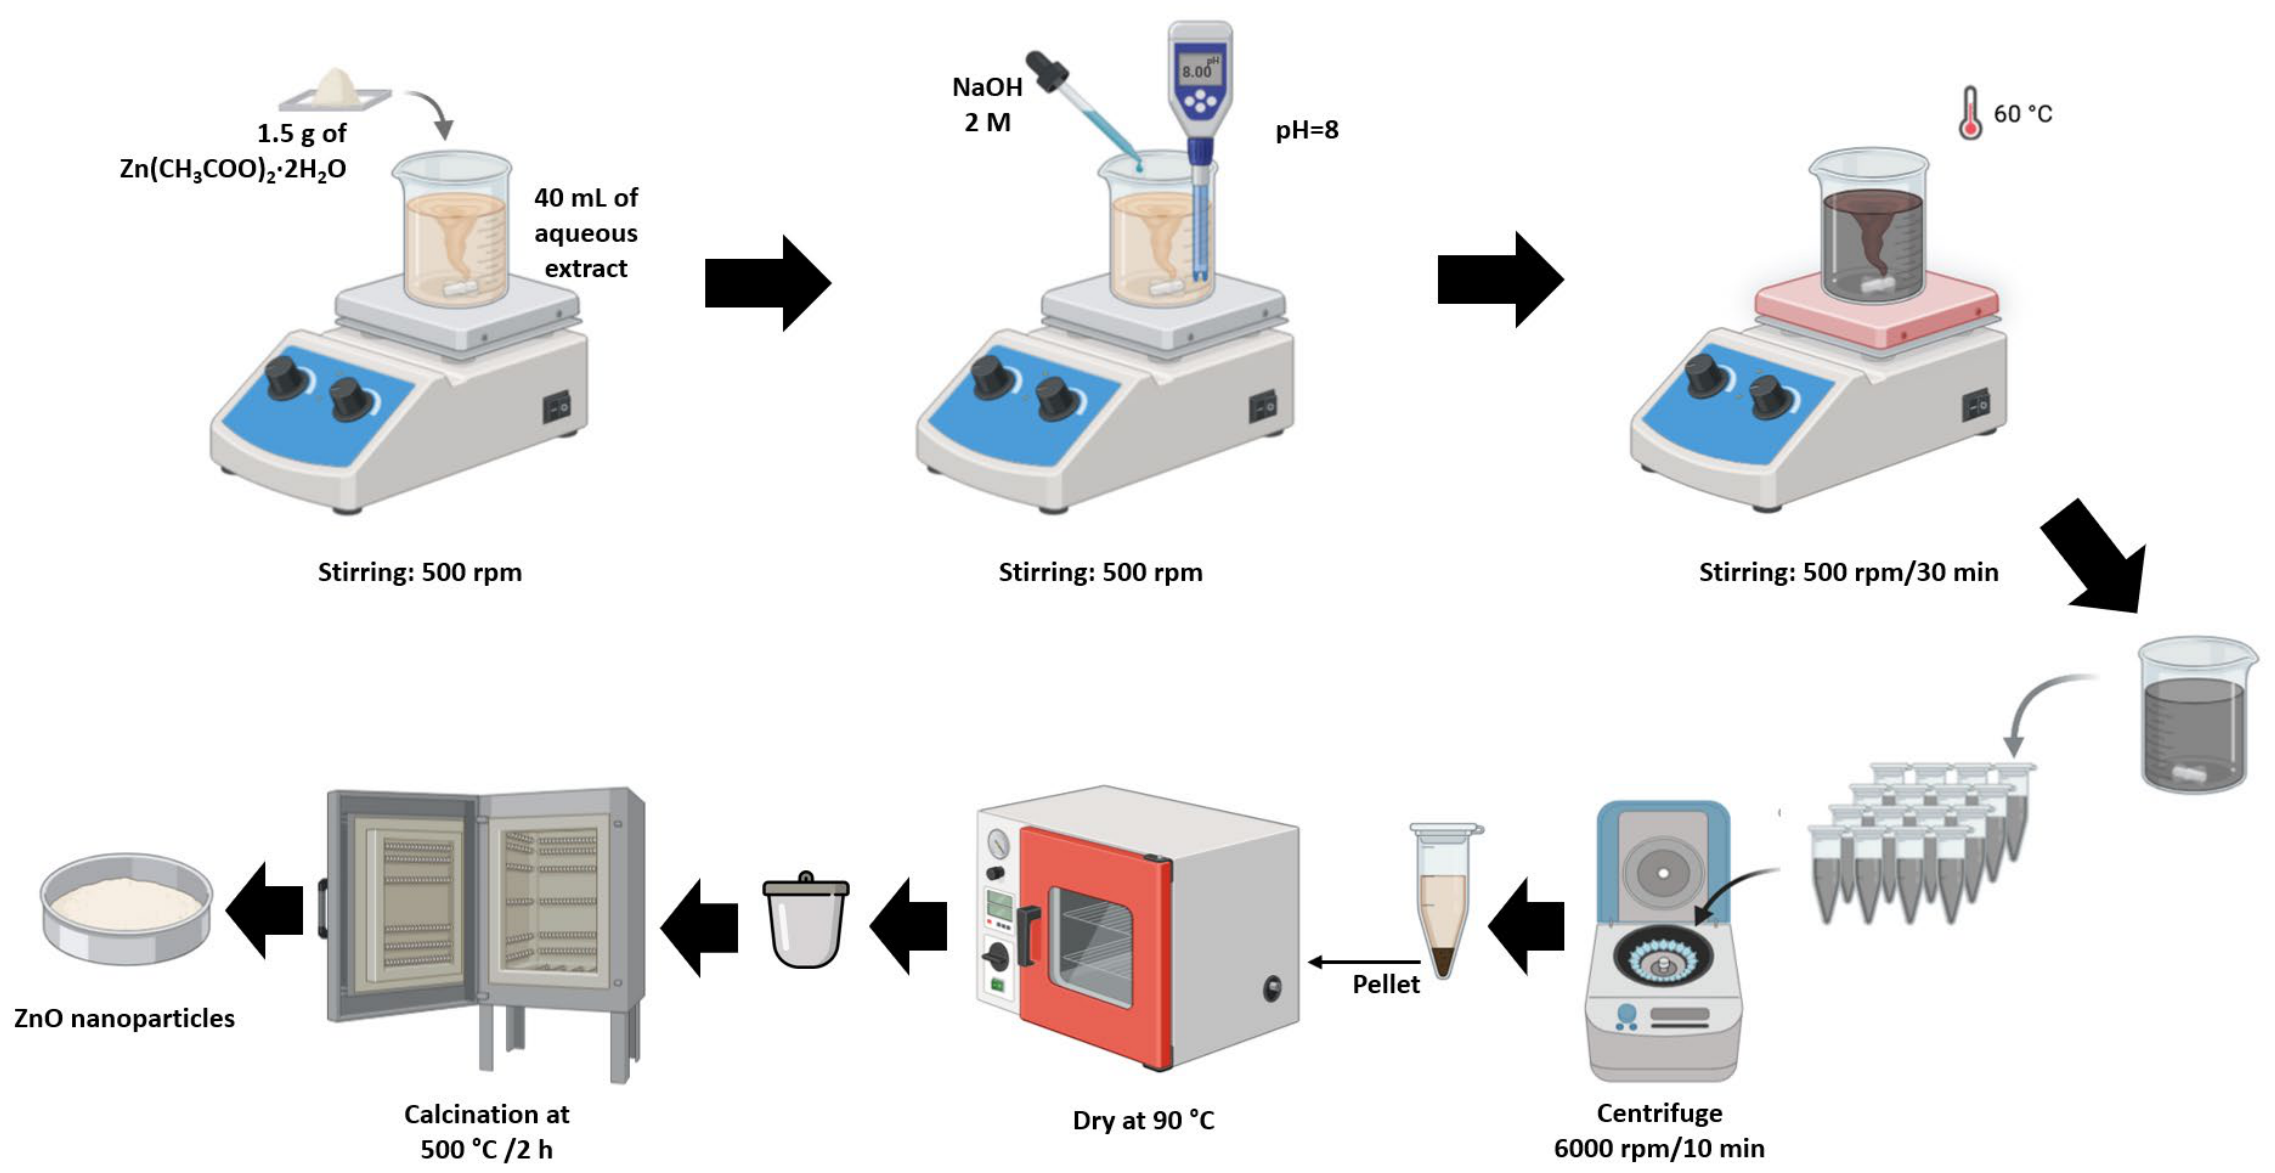
The synthesis process for nanoparticles of zinc oxide (ZnO NPs) was adapted from the study conducted by Faisal et al. [50]. The procedure is shown in Figure 14. A total of 2.4 g of zinc acetate dihydrate was added to 40 mL of aqueous extract, followed by the addition of drops of 2 M NaOH until a pH of 8 was reached; the mixture was then stirred at 60 °C on a heated magnetic stirrer for 30 min. It was then allowed to cool and centrifuged at 6000 rpm for 10 min. The supernatant was discarded, and the pellet was washed with ultrapure water and centrifuged three times. It was then dried in an oven at 90 °C. The dry pellet material was calcined for 2 h at 500 °C in a muffle furnace. A white powder was obtained, corresponding to the ZnO NPs.
Figure 14.
Process for synthesis of ZnO nanoparticles.
3.5. Characterization of Nanoparticles
The characterization of the biosynthesized ZnO NPs was performed using UV/Vis spectrophotometry [51]. The procedure involved weighing 0.01 g of ZnO NPs into a 10 mL volumetric flask, suspending the nanoparticles in absolute ethanol, and placing it in an ultrasonic bath for 5 min. Subsequently, spectrophotometric scans were performed from 250 to 800 nm. The appearance of a peak of maximum absorption in the scan spectrum between 370 and 380 nm indicates the formation of ZnO NPs, as this is characteristic of the surface plasmon resonance of ZnO NPs [28,29]. In addition, the ZnO NPs, the pressed grape seeds, and the aqueous extract (previously dried in a water bath at 40 °C) were characterized using ATR-FTIR. Finally, characterization was performed using TEM to obtain biogenic nanoparticle micrographs, which were processed in ImageJ software 2.9.0. to calculate the diameters of each nanoparticle. The data were then imported into OriginPro 2026 software to generate a histogram plot showing the average size ± standard deviation.
To analyze the crystalline structure of the synthesized nanoparticles, X-ray diffraction (XRD) measurements were performed using a Rigaku Ultima IV powder diffractometer equipped with Cu Kα radiation (Akishima, Japan, λ = 1.5406 Å). The XRD pattern was recorded over the 2θ range of 10–70°, with a step size of 0.05° and a scan rate of 0.5° min−1. The crystalline phases present in the synthesized material were identified using QualX software 8.40 by comparing the experimental pattern with the Powder Diffraction File (PDF-2) database of the International Centre for Diffraction Data (ICDD). The crystallographic parameters were determined through Le Bail refinement using FullProf Suite second version. The theoretical density of the synthesized material, also referred to as the X-ray density (ρx-ray), was calculated from the lattice parameters according to ρx-ray = (Z·M)/(V·NA), where Z represents the number of formula units per unit cell, M is the molar mass of the compound, V is the unit cell volume, and NA is Avogadro’s constant.
Selected area electron diffraction (SAED) patterns were recorded using a Thermo Scientific Talos F200i transmission electron microscope. The SAED patterns were processed in DigitalMicrograph 3.7.1 by measuring the radii of the diffraction rings associated with the diffraction maxima. The ratios of the experimental ring radii were then compared with those calculated from the interplanar spacings (dhkl) reported in the PDF-2 crystallographic database, enabling indexing of the diffraction pattern and identification of the crystalline phase of the synthesized material.
For Scanning Electron Microscopy-Energy-Dispersive Spectroscopy (SEM-EDS) characterization a Scios 2 DualBeam Scanning Electron Microscope with Energy-Dispersive Spectroscopy detector, Thermo Scientific, was used. The BET analysis was performed using a high-precision surface area and porosity analyzer Micromeritics Gemini VII 2390t (Norcross, GA, USA).
3.6. Determination of Profenofos by HPLC
To quantify profenofos, a high-performance liquid chromatography (HPLC) method was used, as described in a previous study [52]. The chromatographic separation was carried out using an RP-18 column (260 × 4 mm) obtained from Sigma Aldrich (St. Louis, MO, USA) maintained at a constant room temperature of 25 °C. The mobile phase consisted of acetonitrile:water (60:40, v/v), which remained strictly constant and unadjusted for both sample pH environments, operating under an isocratic flow rate of 2 mL/min and a 20 μL loop injection volume. Measurements were taken at 210 nm. The method was independently validated for the samples generated at pH = 4 and pH = 5. The analytical method proved to be linear, accurate, and precise under these constant parameters, exhibiting a detection limit of 0.155 mg/L and a quantification limit of 0.163 mg/L for the pH = 4 matrix, and a detection limit of 0.084 mg/L and a quantification limit of 0.130 mg/L for the pH = 5 matrix. The limits of detection and quantification were calculated using the procedure developed in a previous study [53,54].
3.7. Degradation Study
3.7.1. Conditions for Degradation Studies
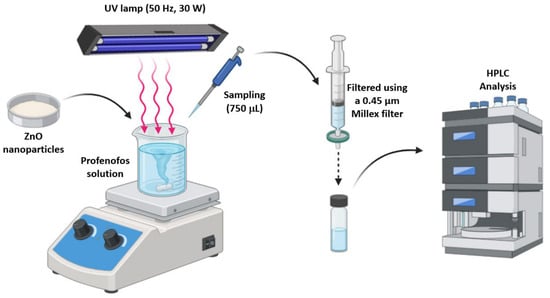
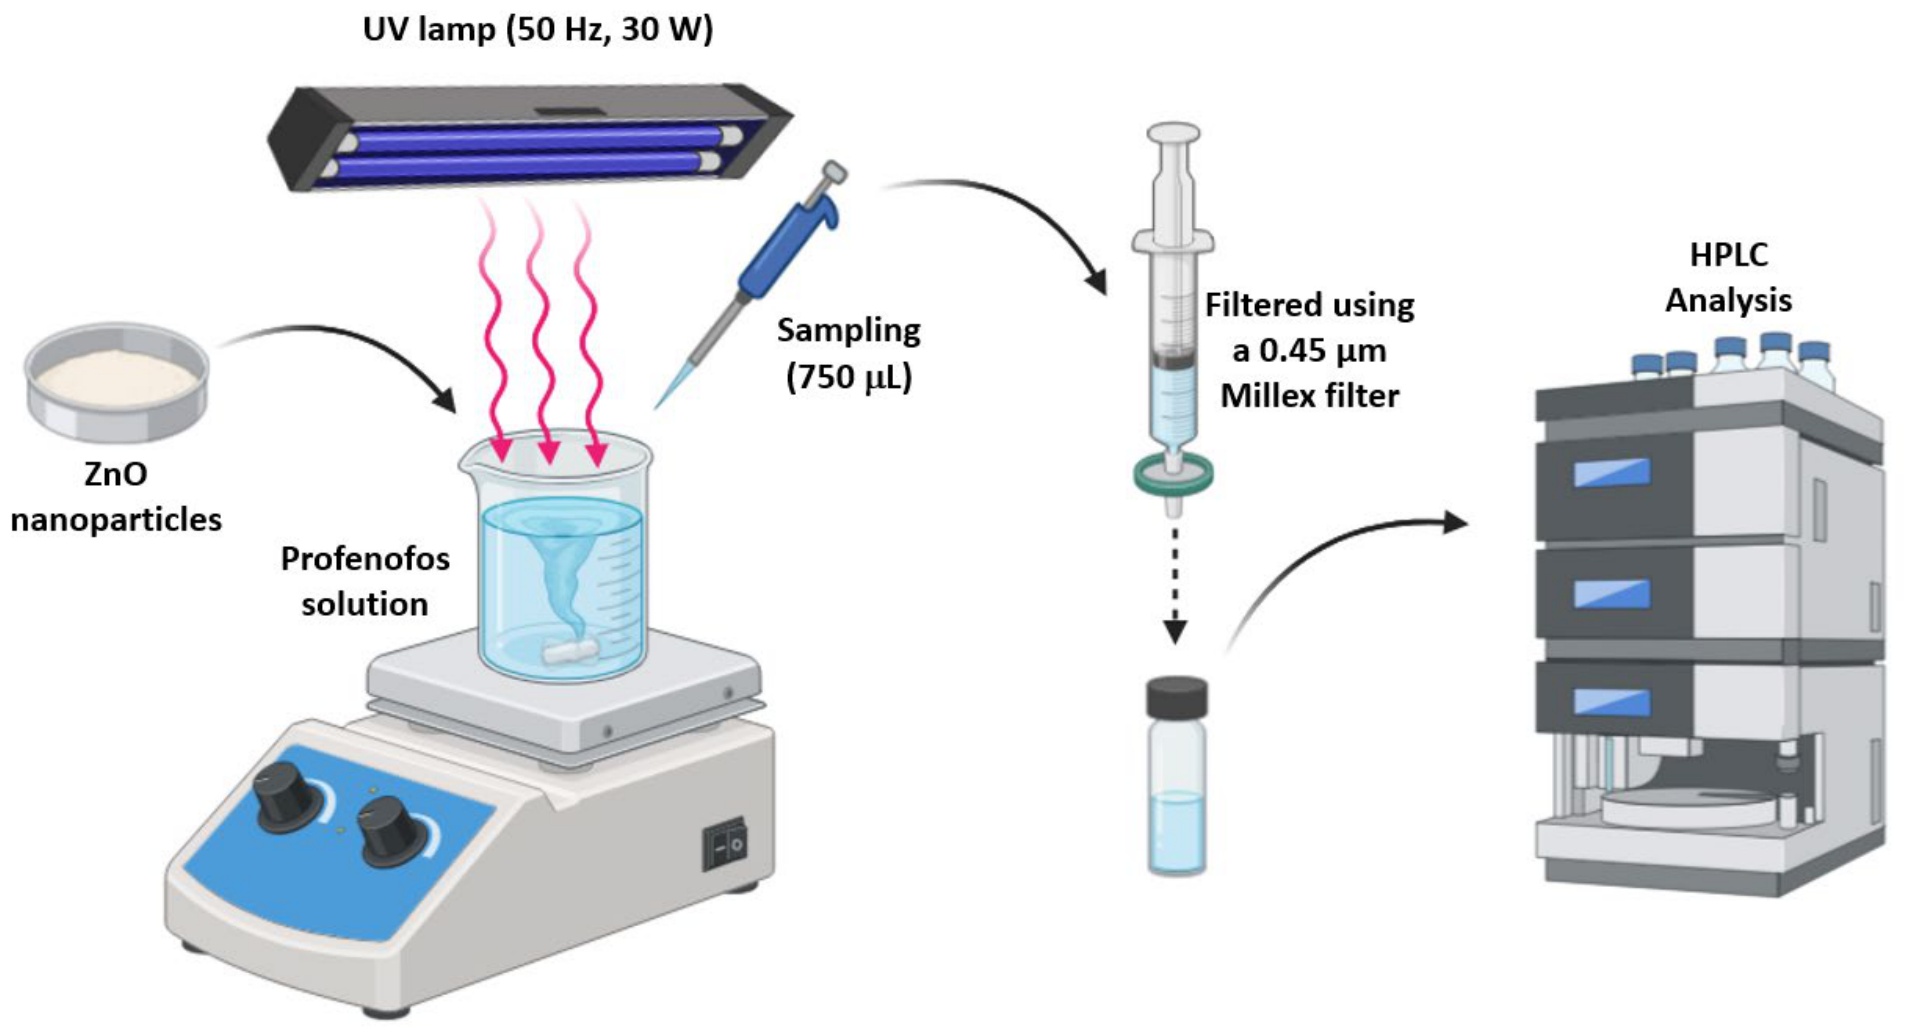
Aqueous solutions contaminated with profenofos (synthetic solutions) were prepared at a concentration of 20 mg/L. The solutions were prepared in 0.025% Tween and Britton-Robinson buffer at pH 4 and pH 5. A 10 mL volume of the synthetic solution was transferred to 25 mL beakers, to which the ZnO NPs were added. Subsequently, agitation was initiated under radiation using a 50 Hz, 30 W UV lamp. The agitation speed was 450 rpm for 120 min. Control groups were evaluated under identical conditions: direct photolysis was performed using UV light irradiation without adding ZnO NPs, and dark adsorption was evaluated by shielding the beaker containing the ZnO NPs from any light source. Degradation was monitored by measuring 750 μL samples, which were filtered through 0.45 μm Millex filters obtained from Sigma Aldrich (St. Louis, MO, USA) and then analyzed by HPLC (Figure 15).
Figure 15.
Photocatalysis system and analysis of profenofos in samples.
3.7.2. Factorial Design
To determine the pH value and ZnO NPs dosage for the profenofos degradation process, a 22 × 3 factorial design was developed (Table 8). The levels for the pH factor were 4 and 5, and the levels for the ZnO NPs dosage factor were 1 and 3 g/L. The experiments were conducted in triplicate, resulting in a total of 12 experiments. The degradation experiments were conducted using a 20 mg/L profenofos solution and a stirring time of 120 min. At the end of the stirring time, the concentration of profenofos in the aqueous solutions was analyzed by HPLC. The degradation efficiency was calculated using Equation (6).
where “Ci” represents the initial concentration of profenofos and “Cf” is the final concentration of profenofos or the concentration at each sampling time point. The results were analyzed using Design Expert 11 software to evaluate the factorial design and optimize the process to maximize degradation efficiency. In addition, the subsequent kinetic degradation experiments were conducted under the optimized conditions in triplicate (using independent batches of ZnO NPs) to calculate the average primary degradation efficiency.
Table 8.
Factors and levels of factorial design.
3.7.3. Degradation Kinetics
Experiments on the degradation of profenofos were conducted under optimal conditions of ZnO NPs dosage and pH. Samples were collected at 0, 1, 5, 10, 20, 30, 60, and 120 min. At the end of each time interval, the samples were analyzed by HPLC, and the adsorption capacity “qt” of profenofos on the ZnO NPs was calculated using Equation (7).
where “m” is the mass of ZnO NPs used in the degradation process and “V” is the volume of the profenofos solution in liters. The results were used to evaluate pseudo-first-order, pseudo-second-order, and Elovich kinetic models using Equations (8), (9) and (10), respectively.
where “k1” (min−1) and “k2” (g·mg−1·min−1) correspond to the rate constants of the pseudo-first order and pseudo-second order models, respectively. “α” and “β” are the Elovich constants, representing the initial adsorption rate (g·mg−1·min−1) and the desorption coefficient (mg·g−1·min−1), respectively. The results were analyzed using Origin Pro 2026 software.
4. Conclusions
ZnO nanoparticles were biosynthesized from an aqueous extract of Negra Criolla grape seeds at a concentration of 5% of the extract. The formation of ZnO nanoparticles was confirmed by UV/vis spectrophotometry, which revealed an absorption peak at 375 nm characteristic of the surface plasmon resonance of ZnO NPs. FTIR analysis revealed peaks at 872 and 703 cm−1 characteristic of Zn-O stretching, and the particles had an average size of 52 ± 2 nm. The biosynthesized ZnO NPs proved effective for the degradation of profenofos at an optimal dose of 3 g/L and pH = 5, achieving 59% degradation after 120 min of UV irradiation starting from an initial concentration of 20 mg/L. In conclusion, the biosynthesized ZnO NPs proved effective at degrading profenofos in synthetic solutions; however, further studies on their application in natural waters are needed to assess their potential for scale-up. Furthermore, future research should incorporate total organic carbon (TOC) analysis and liquid chromatography–tandem mass spectrometry (LC-MS/MS) to map the complete kinetics of mineralization and provide a detailed description of the degradation pathways of intermediate subproducts.
Supplementary Materials
The following supporting information can be downloaded at: https://www.mdpi.com/article/10.3390/molecules31132221/s1.
Author Contributions
Conceptualization, E.G.G.-C. and J.A.V.-S.; methodology, E.G.G.-C., R.J.J.-R., G.M. and A.Q.-M.; software, E.G.G.-C., J.A.V.-S., G.M. and J.M.-P.; validation, A.Q.-M., R.J.J.-R. and J.M.-P.; formal analysis, E.G.G.-C., J.M.C.-C., L.L.-M., G.M. and J.A.V.-S.; investigation, R.J.J.-R., A.Q.-M. and J.M.-P.; resources, E.G.G.-C., L.L.-M., J.M.C.-C., and J.A.V.-S.; data curation, E.G.G.-C., R.J.J.-R. and A.Q.-M.; writing—original draft preparation, E.G.G.-C. and G.M.; writing—review and editing, E.G.G.-C.; visualization, J.M.C.-C. and L.L.-M.; supervision, E.G.G.-C. and J.A.V.-S.; project administration, J.M.C.-C. and L.L.-M.; funding acquisition, E.G.G.-C. All authors have read and agreed to the published version of the manuscript.
Funding
This research was funded by Universidad Tecnológica del Perú, grant number “P-2023-SUR-11”.
Institutional Review Board Statement
Not applicable.
Informed Consent Statement
Not applicable.
Data Availability Statement
Data is contained within the article.
Acknowledgments
The authors acknowledge Jason Jerry Atoche Medrano (Instituto de Física, Universidade de Brasília—UnB) for his collaboration and support with the X-ray diffraction measurements.
Conflicts of Interest
The authors declare no conflicts of interest.
Abbreviations
The following abbreviations are used in this manuscript:
| ZnO NPs | ZnO nanoparticles |
| GSAE | Grape seed aqueous extracts |
| OPPs | Organophosphorus |
| PF | Profenofos |
| ATR-FTIR | Attenuated Total Reflectance-Fourier Transform Infrared |
| TEM | Transmission electron microscopy |
| HPLC | High-resolution liquid chromatograph |
| XRD | X-ray diffraction |
| ICDD | International Centre for Diffraction Data |
| SAED | Selected area electron diffraction |
| SEM | Scanning Electron Microscopy |
| EDS | Energy-Dispersive Spectroscopy |
| BET | Brunauer–Emmett–Teller |
| BJH | Barrett–Joyner–Halenda |
References
- Ghani, M.U.; Asghar, H.N.; Niaz, A.; Ahmad Zahir, Z.; Nawaz, M.F.; Häggblom, M.M. Efficacy of rhizobacteria for degradation of profenofos and improvement in tomato growth. Int. J. Phytoremediation 2022, 24, 463–473. [Google Scholar] [CrossRef] [Scilit] [PubMed]
- Thihara Rodrigues, F.; Marchioni, E.; Lordel-Madeleine, S.; Kuntz, F.; Casañas Haasis Villavicencio, A.L.; Julien-David, D. Degradation of profenofos in aqueous solution and in vegetable sample by electron beam radiation. Radiat. Phys. Chem. 2020, 166, 108441. [Google Scholar] [CrossRef] [Scilit]
- Sharma, A.; Kumar, V.; Shahzad, B.; Tanveer, M.; Sidhu, G.P.S.; Handa, N.; Kohli, S.K.; Yadav, P.; Bali, A.S.; Parihar, R.D.; et al. Worldwide pesticide usage and its impacts on ecosystem. SN Appl. Sci. 2019, 1, 1446. [Google Scholar] [CrossRef] [Scilit]
- FAO Peru|Global Partnership Initiative for Plant Breeding Capacity Building|Food and Agriculture Organization of the United Nations. Available online: https://openknowledge.fao.org/items/23ebc7ca-06fd-48dd-ba04-cc7c235b0d04 (accessed on 31 October 2023).
- Yucra, S.; Gasco, M.; Rubio, J.; Gonzales, G.F. Semen quality in Peruvian pesticide applicators: Association between urinary organophosphate metabolites and semen parameters. Environ. Health 2008, 7, 59. [Google Scholar] [CrossRef] [Scilit] [PubMed]
- Petreski, T.; Kit, B.; Strnad, M.; Grenc, D.; Svenšek, F. Cholinergic Syndrome: A Case Report of Acute Organophosphate and Carbamate Poisoning. Arch. Ind. Hyg. Toxicol. 2020, 71, 163–166. [Google Scholar] [CrossRef] [Scilit] [PubMed]
- Fang, L.; Shi, Q.; Xu, L.; Shi, T.; Wu, X.; Li, Q.X.; Hua, R. Enantioselective Uptake Determines Degradation Selectivity of Chiral Profenofos in Cupriavidus nantongensis X1T. J. Agric. Food Chem. 2020, 68, 6493–6501. [Google Scholar] [CrossRef] [Scilit] [PubMed]
- Liu, X.; Zhan, Y.; Zhang, Z.; Pan, L.; Hu, L.; Liu, K.; Zhou, X.; Bai, L. Photocatalytic Degradation of Profenofos and Triazophos Residues in the Chinese Cabbage, Brassica chinensis, Using Ce-Doped TiO2. Catalysts 2019, 9, 294. [Google Scholar] [CrossRef] [Scilit]
- Fang, L.; Zhou, Y.; Chen, T.; Geng, Y.; Li, Z.; Zha, W.; Shi, T.; Hua, R. Efficient biodegradation characteristics and detoxification pathway of organophosphorus insecticide profenofos via Cupriavidus nantongensis X1T and enzyme OpdB. Sci. Total Environ. 2023, 862, 160782. [Google Scholar] [CrossRef] [Scilit] [PubMed]
- McAbee, K.E.; Pendergraft, S.S.; Atala, A.; Bishop, C.; Sadri-Ardekani, H. Chapter 4—Effect of Environmental Toxins on Spermatogonial Stem Cells. In Bioenvironmental Issues Affecting Men’s Reproductive and Sexual Health; Sikka, S.C., Hellstrom, W.J.G., Eds.; Academic Press: Boston, MA, USA, 2018; pp. 53–70. ISBN 978-0-12-801299-4. [Google Scholar]
- Talwar, M.P.; Ninnekar, H.Z. Biodegradation of pesticide profenofos by the free and immobilized cells of Pseudoxanthomonas suwonensis strain HNM. J. Basic Microbiol. 2015, 55, 1094–1103. [Google Scholar] [CrossRef] [Scilit] [PubMed]
- Siripattanakul-Ratpukdi, S.; Vangnai, A.S.; Sangthean, P.; Singkibut, S. Profenofos insecticide degradation by novel microbial consortium and isolates enriched from contaminated chili farm soil. Environ. Sci. Pollut. Res. 2015, 22, 320–328. [Google Scholar] [CrossRef] [Scilit] [PubMed]
- Kumar, V.; Sharma, N.; Vangnai, A. Modeling degradation kinetics of profenofos using Acinetobacter sp.33F. Environ. Technol. Innov. 2021, 21, 101367. [Google Scholar] [CrossRef] [Scilit]
- Mahajan, R.; Verma, S.; Chatterjee, S. Biodegradation of organophosphorus pesticide profenofos by the bacterium Bacillus sp. PF1 and elucidation of initial degradation pathway. Environ. Technol. 2023, 44, 492–500. [Google Scholar] [CrossRef] [Scilit] [PubMed]
- Asamba, M.N.; Mugendi, E.N.; Oshule, P.S.; Essuman, S.; Chimbevo, L.M.; Atego, N.A. Molecular characterization of chlorpyrifos degrading bacteria isolated from contaminated dairy farm soils in Nakuru County, Kenya. Heliyon 2022, 8, e09176. [Google Scholar] [CrossRef] [Scilit] [PubMed]
- Hadibarata, T.; Kristanti, R.A.; Bilal, M.; Yilmaz, M.; Sathishkumar, P. Biodegradation mechanism of chlorpyrifos by halophilic bacterium Hortaea sp. B15. Chemosphere 2023, 312, 137260. [Google Scholar] [CrossRef] [Scilit] [PubMed]
- Rafique, N.; Tariq, S.R.; Ahad, K.; Rafique, F. Zn2+ and Cd2+ assisted photo-catalytic degradation of chlorpyrifos in soil. Heliyon 2019, 5, e01624. [Google Scholar] [CrossRef] [Scilit] [PubMed]
- Yucra-Condori, H.R.; Choquenaira-Quispe, C.; Villanueva–Salas, J.A.; Gonzales-Condori, E.G. Photocatalytic degradation of methamidophos in water using zinc oxide as a photocatalyst. Energy Nexus 2024, 15, 100317. [Google Scholar] [CrossRef] [Scilit]
- Shang, X.; Liu, X.; Ren, W.; Huang, J.; Zhou, Z.; Lin, C.; He, M.; Ouyang, W. Comparison of peroxodisulfate and peroxymonosulfate activated by microwave for degradation of chlorpyrifos in soil: Effects of microwaves, reaction mechanisms and degradation products. Sep. Purif. Technol. 2023, 306, 122682. [Google Scholar] [CrossRef] [Scilit]
- Altammar, K.A. A review on nanoparticles: Characteristics, synthesis, applications, and challenges. Front. Microbiol. 2023, 14, 1155622. [Google Scholar] [CrossRef] [Scilit] [PubMed]
- Yadav, R.S. Multifunctional Nanomaterials: Synthesis, Properties and Applications. Int. J. Mol. Sci. 2021, 22, 12073. [Google Scholar] [CrossRef] [Scilit] [PubMed]
- Rai, M.; Yadav, A.; Gade, A. Current [corrected] trends in phytosynthesis of metal nanoparticles. Crit. Rev. Biotechnol. 2008, 28, 277–284. [Google Scholar] [CrossRef] [Scilit] [PubMed]
- Mie, R.; Samsudin, M.W.; Din, L.B.; Ahmad, A.; Ibrahim, N.; Adnan, S.N.A. Synthesis of silver nanoparticles with antibacterial activity using the lichen Parmotrema praesorediosum. Int. J. Nanomed. 2014, 9, 121–127. [Google Scholar] [CrossRef] [Scilit] [PubMed]
- Gamez, M.J. Objetivos y Metas de Desarrollo Sostenible. Desarrollo Sostenible. 2022. Available online: https://www.un.org/sustainabledevelopment/es/objetivos-de-desarrollo-sostenible/ (accessed on 7 November 2022).
- Singh, S.; Kumar, V.; Anil, A.G.; Kapoor, D.; Khasnabis, S.; Shekar, S.; Pavithra, N.; Samuel, J.; Subramanian, S.; Singh, J.; et al. Adsorption and detoxification of pharmaceutical compounds from wastewater using nanomaterials: A review on mechanism, kinetics, valorization and circular economy. J. Environ. Manag. 2021, 300, 113569. [Google Scholar] [CrossRef] [Scilit] [PubMed]
- Hunde Gonfa, M.; Lealem Birhanu, A. Green synthesis, characterization and antibacterial evaluation of ZnO and Ag-doped ZnO nanoparticles using Ruta chalepensis leaf extract. Green Chem. Lett. Rev. 2024, 17, 2412613. [Google Scholar] [CrossRef] [Scilit]
- Pasieczna-Patkowska, S.; Cichy, M.; Flieger, J. Application of Fourier Transform Infrared (FTIR) Spectroscopy in Characterization of Green Synthesized Nanoparticles. Molecules 2025, 30, 684. [Google Scholar] [CrossRef] [Scilit] [PubMed]
- Awad, M.A.; Hendi, A.A.; Ortashi, K.M.O.; Alnamlah, R.A.; Alangery, A.; Ali Alshaya, E.; Alshammari, S.G. Utilizing Cymbopogon Proximus Grass Extract for Green Synthesis of Zinc Oxide Nanorod Needles in Dye Degradation Studies. Molecules 2024, 29, 355. [Google Scholar] [CrossRef] [Scilit] [PubMed]
- Faaiza, N.K.; Tiwari, A.; Shaik, A.H.; Indumathi, P.; Brianna, B.; Anwar, A.; Chandan, M.R. Anti-cancer and antimicrobial efficacy of ZnO nanoparticles synthesized via green route using Amaranthus dubius (Spleen Amaranth) leaves extract. Green Chem. Lett. Rev. 2025, 18, 2453532. [Google Scholar] [CrossRef] [Scilit]
- Kaur, H.; Sharma, A.; Anand, K.; Panday, A.; Tagotra, S.; Kakran, S.; Kumar Singh, A.; Waqas Alam, M.; Kumar, S.; Bouzid, G.; et al. Green synthesis of ZnO nanoparticles using E. cardamomum and zinc nitrate precursor: A dual-functional material for water purification and antibacterial applications. RSC Adv. 2025, 15, 16742–16765. [Google Scholar] [CrossRef] [Scilit] [PubMed]
- Muhammed, A.; Asere, T.G.; Diriba, T.F. Photocatalytic and Antimicrobial Properties of ZnO and Mg-Doped ZnO Nanoparticles Synthesized Using Lupinus albus Leaf Extract. ACS Omega 2024, 9, 2480–2490. [Google Scholar] [CrossRef] [Scilit] [PubMed]
- Aga, K.W.; Efa, M.T.; Beyene, T.T. Effects of Sulfur Doping and Temperature on the Energy Bandgap of ZnO Nanoparticles and Their Antibacterial Activities. ACS Omega 2022, 7, 10796–10803. [Google Scholar] [CrossRef] [Scilit] [PubMed]
- Wang, F.; Wang, Y.; Chen, Y.; Fan, Y.; Ouyang, K.; Luo, Y.; Chen, X.; Huang, P.; Xie, Y.; Zhang, Y.; et al. Heterojunction/active site co-construction of Mn0·5Cd0·5 S/NiO photocatalyst for boosting H2 evolution and enhanced stability. Int. J. Hydrogen Energy 2026, 218, 154075. [Google Scholar] [CrossRef] [Scilit]
- Thiam, M.; Bernardo, A.D.; Pellegrini, V.D.; Possatto, J.F.; Dlamini, Z.W.; Mahule, T.S.; Ngom, B.D.; Mosepele, B.Q.; Thema, F.T.; Mamba, B.B.; et al. Green Synthesis of ZnO Nanoparticles Using Licania tomentosa Benth (Oiti) Leaf Extract: Characterization and Applications for the Photocatalytic Degradation of Crystal Violet Dye. Processes 2025, 13, 880. [Google Scholar] [CrossRef] [Scilit]
- Padalia, H.; Chanda, S. Characterization, antifungal and cytotoxic evaluation of green synthesized zinc oxide nanoparticles using Ziziphus nummularia leaf extract. Artif. Cells Nanomed. Biotechnol. 2017, 45, 1751–1761. [Google Scholar] [CrossRef] [Scilit] [PubMed]
- Abdelbaky, A.S.; Mohamed, A.M.H.A.; Sharaky, M.; Mohamed, N.A.; Diab, Y.M. Green approach for the synthesis of ZnO nanoparticles using Cymbopogon citratus aqueous leaf extract: Characterization and evaluation of their biological activities. Chem. Biol. Technol. Agric. 2023, 10, 63. [Google Scholar] [CrossRef] [Scilit]
- Umavathi, S.; Mahboob, S.; Govindarajan, M.; Al-Ghanim, K.A.; Ahmed, Z.; Virik, P.; Al-Mulhm, N.; Subash, M.; Gopinath, K.; Kavitha, C. Green synthesis of ZnO nanoparticles for antimicrobial and vegetative growth applications: A novel approach for advancing efficient high quality health care to human wellbeing. Saudi J. Biol. Sci. 2021, 28, 1808–1815. [Google Scholar] [CrossRef] [Scilit] [PubMed]
- Mongy, Y.; Shalaby, T. Green synthesis of zinc oxide nanoparticles using Rhus coriaria extract and their anticancer activity against triple-negative breast cancer cells. Sci. Rep. 2024, 14, 13470. [Google Scholar] [CrossRef] [Scilit] [PubMed]
- Dehghani, M.; Ghadam, P. Green Synthesis of ZnO-NPs by Juglans regia Green Husk Aqueous Extract. Mater. Proc. 2023, 14, 7. [Google Scholar] [CrossRef] [Scilit]
- Ferreiro, A.; Flores-Carrasco, G.; Quevedo-López, M.; Urbieta, A.; Fernández, P.; Rabanal, M.E. Effect of lithium codoping on the structural, morphological and photocatalytic properties of Nd-doped ZnO. Ceram. Int. 2023, 49, 33513–33524. [Google Scholar] [CrossRef] [Scilit]
- Liu, J.; Liang, H. Heterogeneous nucleation and self-nucleation of isotactic polypropylene with addition of nano-ZnO. J. Therm. Anal. Calorim. 2021, 146, 2115–2126. [Google Scholar] [CrossRef] [Scilit]
- Mote, V.D.; Purushotham, Y.; Dole, B.N. Structural and morphological studies on Mn substituted ZnO nanometer-sized crystals. Cryst. Res. Technol. 2011, 46, 705–710. [Google Scholar] [CrossRef] [Scilit]
- Aziz, S. Effects of Engineered Zinc Oxide Nanoparticles on Freshwater Fish, Labeo rohita: Characterization of ZnO Nanoparticles, Acute Toxicity and Oxidative Stress. Pak. Vet. J. 2020, 40, 479–483. [Google Scholar] [CrossRef] [Scilit] [PubMed]
- Klug, H.P.; Alexander, L.E. X-Ray Diffraction Procedures: For Polycrystalline and Amorphous Materials, 2nd ed.; Wiley-VCH: New York, NY, USA, 1974; ISBN 0-471-49369-4. [Google Scholar]
- Rafique, A.; Amjad, F.; Janjua, M.R.S.A.; Naqvi, S.A.R.; Hassan, S.U.; Abdullah, H.; Nazir, M.S.; Ali, Z.; Alshihri, A.A.; Momenah, M.A.; et al. Chia seed-mediated fabrication of ZnO/Ag/Ag2O nanocomposites: Structural, antioxidant, anticancer, and wound healing studies. Front. Chem. 2024, 12, 1405385. [Google Scholar] [CrossRef] [Scilit] [PubMed]
- Tariq, S.R.; Nisar, L. Reductive transformation of profenofos with nanoscale Fe/Ni particles. Environ. Monit. Assess. 2018, 190, 123. [Google Scholar] [CrossRef] [Scilit] [PubMed]
- Samara, F.; Feghaly, F.; Kanan, S. Photocatalytic degradation of profenofos using silver-platinum doped zeolite. Catal. Today 2023, 424, 112602. [Google Scholar] [CrossRef] [Scilit]
- Sathish Kumar, P.; Shobana, B.; Prakash, P. Light harvesting enhancement through band structure engineering in graphite carbon nitride / polydopamine nanocomposite photocatalyst: Addressing persistent organophosphorus pesticide pollution in water systems. Chemosphere 2024, 354, 141708. [Google Scholar] [CrossRef] [Scilit] [PubMed]
- Premalatha, N.; Rex, P. A comprehensive review on photocatalytic degradation of organophosphorus pesticide using ZnO coupled photocatalysts. Desalination Water Treat. 2024, 320, 100753. [Google Scholar] [CrossRef] [Scilit]
- Faisal, S.; Jan, H.; Shah, S.A.; Shah, S.; Khan, A.; Akbar, M.T.; Rizwan, M.; Jan, F.; Wajidullah; Akhtar, N.; et al. Green Synthesis of Zinc Oxide (ZnO) Nanoparticles Using Aqueous Fruit Extracts of Myristica fragrans: Their Characterizations and Biological and Environmental Applications. ACS Omega 2021, 6, 9709–9722. [Google Scholar] [CrossRef] [Scilit] [PubMed]
- Eya’ane Meva, F.; Segnou, M.L.; Okalla Ebongue, C.; Ntoumba, A.A.; Belle Ebanda Kedi, P.; Deli, V.; Etoh, M.-A.; Mpondo Mpondo, E. Spectroscopic synthetic optimizations monitoring of silver nanoparticles formation from Megaphrynium macrostachyum leaf extract. Rev. Bras. Farmacogn. 2016, 26, 640–646. [Google Scholar] [CrossRef] [Scilit]
- Gonzales-Condori, E.G.; Ramírez-Revilla, S.A.; Villanueva-Salas, J.A. Role of Eisenia foetida in the degradation of profenofos in presence of native bacterial communities. Rev. Mex. Ing. Quím. 2020, 19, 45–57. [Google Scholar] [CrossRef] [Scilit]
- Gonzales-Condori, E. A simple and fast ultrasound-assisted extraction procedure for the determination of chlorpyrifos and profenofos in soils by High Performance Liquid Chromatography. In Proceedings of the 19th LACCEI International Multi-Conference for Engineering, Education and Technology, Virtual, 19–23 July 2021. [Google Scholar]
- Quattrocchi, O.; Abelaira, S.; Felipe Laba, R. Introduccion a la HPLC, Aplicacion y Practica; Artes Gráficas Farro: Porlamar, Venezuela, 1992; ISBN 978-950-43-4181-9. [Google Scholar]

Disclaimer/Publisher’s Note: The statements, opinions and data contained in all publications are solely those of the individual author(s) and contributor(s) and not of MDPI and/or the editor(s). MDPI and/or the editor(s) disclaim responsibility for any injury to people or property resulting from any ideas, methods, instructions or products referred to in the content. |
© 2026 by the authors. Licensee MDPI, Basel, Switzerland. This article is an open access article distributed under the terms and conditions of the Creative Commons Attribution (CC BY) license.