


Abstract
The grayscale histogram plays an important role in image thresholding. However, this kind of global statistical information always involves fluctuations. And the mode of the gray-level distribution is essential to improve segmentation quality. This paper adopts a power-law-like function to fit the grayscale histogram, and a novel multi-thresholding algorithm is proposed. The algorithm generalizes the Gaussian mixture model (GMM) and introduces a non-extensive parameter q to flexibly adapt to the segmentation requirements. Experimental results show that, at threshold numbers of 3, 4, and 5, the proposed algorithm achieves higher PSNR (peak signal-to-noise ratio) on CT images compared with the Kapur algorithm, the Tsallis entropy algorithm, and the self-adaptive Tsallis entropy algorithm (STEA). For images from the same sequence, the optimal q values converge within a narrow range, demonstrating excellent consistency and stability of the proposed algorithm. Furthermore, in terms of the PSNR, SSIM (Structural Similarity Index), FSIM (Feature Similarity Index), and MHD (Modified Hausdorff distance) metrics, the proposed algorithm outperforms the GMM on most CT images, validating its broad applicability to images presenting long-range correlations and heavy-tailed grayscale distributions.
1. Introduction
As a fundamental preprocessing technique in computer vision, medical image analysis, and remote sensing interpretation, image thresholding aims to achieve effective separation between objects and backgrounds based on grayscale statistical characteristics. Medical images play a critical role in clinical diagnosis, necessitating that the applied algorithms possess both high segmentation accuracy and stability. The precise extraction of multiple target regions in images represents the frontier in image thresholding research [1,2,3,4]. Within the framework of information theory, Kapur entropy [5] is regarded as a classical criterion. The method constructs the segmentation objective function by assuming mutual independence among intra-class grayscale probability distributions. It offers wide methodological applicability across diverse settings [6,7]. However, gray-level overlap and boundary diffusion are widely observed in medical imaging. The intensity distributions of the target and background often intercross with each other. Their statistical correlations cannot be ignored. As a generalized form of Kapur entropy, Tsallis entropy [8,9] fully considers the non-additivity between the target and the background [10,11,12]. Therefore, it can effectively improve the quality of image thresholding [13,14,15,16,17].
Nevertheless, noise and perturbations are inherent in the imaging process. They persist and directly affect the grayscale histogram. This limits the applicability of the aforementioned methods. The limitations are especially evident in complex scenarios and multi-object recognition tasks. To address this issue, many researchers employ the Gaussian distribution to estimate the grayscale distribution of each class in the image. Different criteria are then applied to determine the optimal segmentation threshold. This strategy suppresses the interference of noise and perturbations on segmentation accuracy. Therefore, Gaussian distribution-based threshold segmentation methods have attracted increasing attention recently. For example, Gaussian mixture models (GMMs) are estimated via the expectation-maximization (EM) algorithm to improve optimization strategies. The segmentation threshold is subsequently determined based on the statistics of the Gaussian components [18,19,20]. Furthermore, in order to overcome the assumption of pixel independence and identical distribution in histogram modeling, spatial neighborhood and local contextual information can be introduced into the GMM framework. Consequently, the robustness of segmentation algorithms against noise and intensity inhomogeneity is enhanced [21,22,23,24]. In addition, the Gaussian distribution can be embedded as a probabilistic model or an evolutionary operator into swarm intelligence optimization algorithms. This strategy is designed to improve the search strategies and optimization capabilities of classical thresholding criteria, such as Otsu’s [25] and Kapur’s methods [26,27,28]. The above achievements demonstrate the effectiveness of the Gaussian distribution. It can effectively describe the statistical properties of corrupted images. However, medical images often exhibit more complex grayscale distributions. In such cases, the Gaussian distribution has certain limitations. It struggles to accurately characterize the actual grayscale distributions of medical images.
To solve these issues, this paper proposes a fitted distribution model with a power-law estimation function. It utilizes the non-additive properties of Tsallis entropy to analyze medical images. The fitted estimation function and Tsallis entropy are naturally combined to yield a power-law distribution-based multi-threshold segmentation algorithm. The algorithm evaluates the strength of statistical correlations at different numbers of thresholds, and then achieves appropriate fitting to actual grayscale distributions. Experimental results show that the proposed algorithm can effectively improve segmentation quality for medical images.
2. Related Works
2.1. Image Segmentation Algorithm Based on Tsallis Entropy
Tsallis entropy was first introduced by Tsallis C [10] in 1988 to deal with complex physical systems with long-range correlations. Albuquerque et al. [12] indicate that thresholding methods based on Tsallis entropy exhibit favorable performance on images with significant background noise, unimodal grayscale distributions or strongly correlated pixels. The parameter q in Tsallis entropy serves as a sensitive factor for regulating the segmentation results.
This algorithm assumes that the grey-level values of an image are divided into background b and object o by a threshold t. The non-extensive entropies for the background and object classes are defined as [12]:
respectively, where denotes the probability distribution for gray-level i, q is the non-extensive parameter, and . The objective function is given by:
The optimal threshold is determined by maximizing the objective function, yielding:
2.2. Theoretical Formulation of Power-Law Distribution
The power-law estimation function adopted in this paper is theoretically grounded in the non-extensive statistical mechanics proposed by Tsallis C [11]. Specifically, by maximizing Tsallis non-extensive entropy under probability normalization and second-moment constraints, the q-Gaussian distribution is obtained. The original form of Tsallis entropy is given as [11]:
where k is a positive constant, and W is the total number of microstates of the system. If denotes the spectrum of the system, its expectation can be written as . Therefore, within the canonical ensemble, two Lagrangian multipliers— and , associated with and —can be adopted to construct the functional as:
Maximization of Equation (6) with arbitrary microstate i, i.e., , yields . Consequently, the following distribution is obtained [11]:
where is the partition function to keep the normalization of Equation (7). It is worth mentioning that Equation (7) and the standard q-Gaussian distribution () are not identical, since the expectation constraints are different [11]. The heavy tail appears at , and for Equation (7), it is at by mapping .
In the limit of , Equations (7) and (8) return to the well-known Boltzmann–Gibbs distribution:
Therefore, the power-law distribution shown in Equation (7) is a generalized form of Equation (9), with the help of the non-extensive parameter q. Since q is deeply related to the correlation strength among different classes of images, a power-law distribution-based multi-thresholding algorithm is proposed below to further study this issue.
3. A Multi-Level Image Thresholding Algorithm Based on the Power-Law Distribution
In ideal conditions, Gaussian distributions adequately describe image pixel statistics. However, practical imaging is always affected by illumination variations and non-stationary interference. These factors result in histograms exhibiting non-Gaussian characteristics such as heavy tails, skewness, and modality overlapping. Under such circumstances, thresholding based on Gaussian fitting fails to accurately estimate the actual distributions of objects and backgrounds. Therefore, it is reasonable to describe the image histogram with power-law distributions.
3.1. Formulation of Power-Law Distribution
In the case of bi-level thresholding, the distributions of the target region and the background region can be estimated by power-law functions. On the other hand, the gray levels of different classes inside an image can be treated as subsystems, and their statistical properties depend closely on the mean of each class. Therefore, Equation (7) is a kind of q-Gaussian distribution by setting , where m is the mean of the subsystem and represents the variance of the corresponding histogram. And the gray-level distributions of the object and background are given as follows:
where and are normalization constants, represent the means of different subsystems that are determined by the threshold t, and are variances of the corresponding histograms. Equations (11) and (12) enable flexible estimation of non-Gaussian distributions in the image grayscale histogram. As mentioned above, heavy tails appear at , and Equations (11) and (12) are identical to the Student-t distribution [29,30] under parameter transformation. The difference appears at since the density vanishes outside a compact interval. This lays the statistical foundation for the subsequent construction of the objective function for thresholding.
In the case of , Equation (11) can be rewritten as:
If i in Equation (13) varies continuously, the normalization condition of the probability distribution requires:
Since the integrand in Equation (14) is an even function of i, the symmetry property of the even function leads to:
and the normalization constant is then obtained as:
where denotes the Gamma function. By using Equations (11) and (16), the variance of i can be obtained as:
Equation (17) shows that the finite variance for q-Gaussian fitting holds when .
In the case of , normalizing Equation (11) yields:
where requires the value of the inside bracket to be nonnegative.
Within the theoretical framework of non-extensive statistical mechanics, the entropic index q serves as the key parameter governing the degree of non-extensivity of the system. When , the Tsallis entropy converges to the classical Boltzmann–Gibbs entropy. Consequently, the power-law estimation function derived from the maximum entropy principle degenerates to the classical Gaussian distribution:
By the same process, the explicit forms of the probability density functions for the background regions of the image are given as follows:
where
3.2. Proposed Multi-Level Image Thresholding Algorithm
For a given image, according to the weights of the target and background that are determined by threshold t, the fitting grayscale distributions of Equations (11) and (12) can be combined as follows:
where and denote the weights of the target-region pixels and background-region pixels, respectively.
Based on the renormalized grayscale histogram distribution of Equation (24), this paper further incorporates it into the computational framework mentioned in Section 2.1. The new formulation is given as follows:
where and are the cumulative probabilities for the object and background regions.
In the case of bi-level thresholding, the definitions of the objective function and the optimal threshold are given as follows:
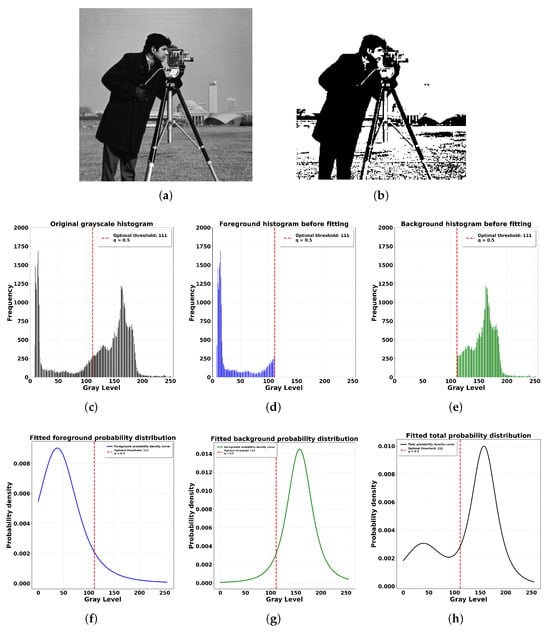
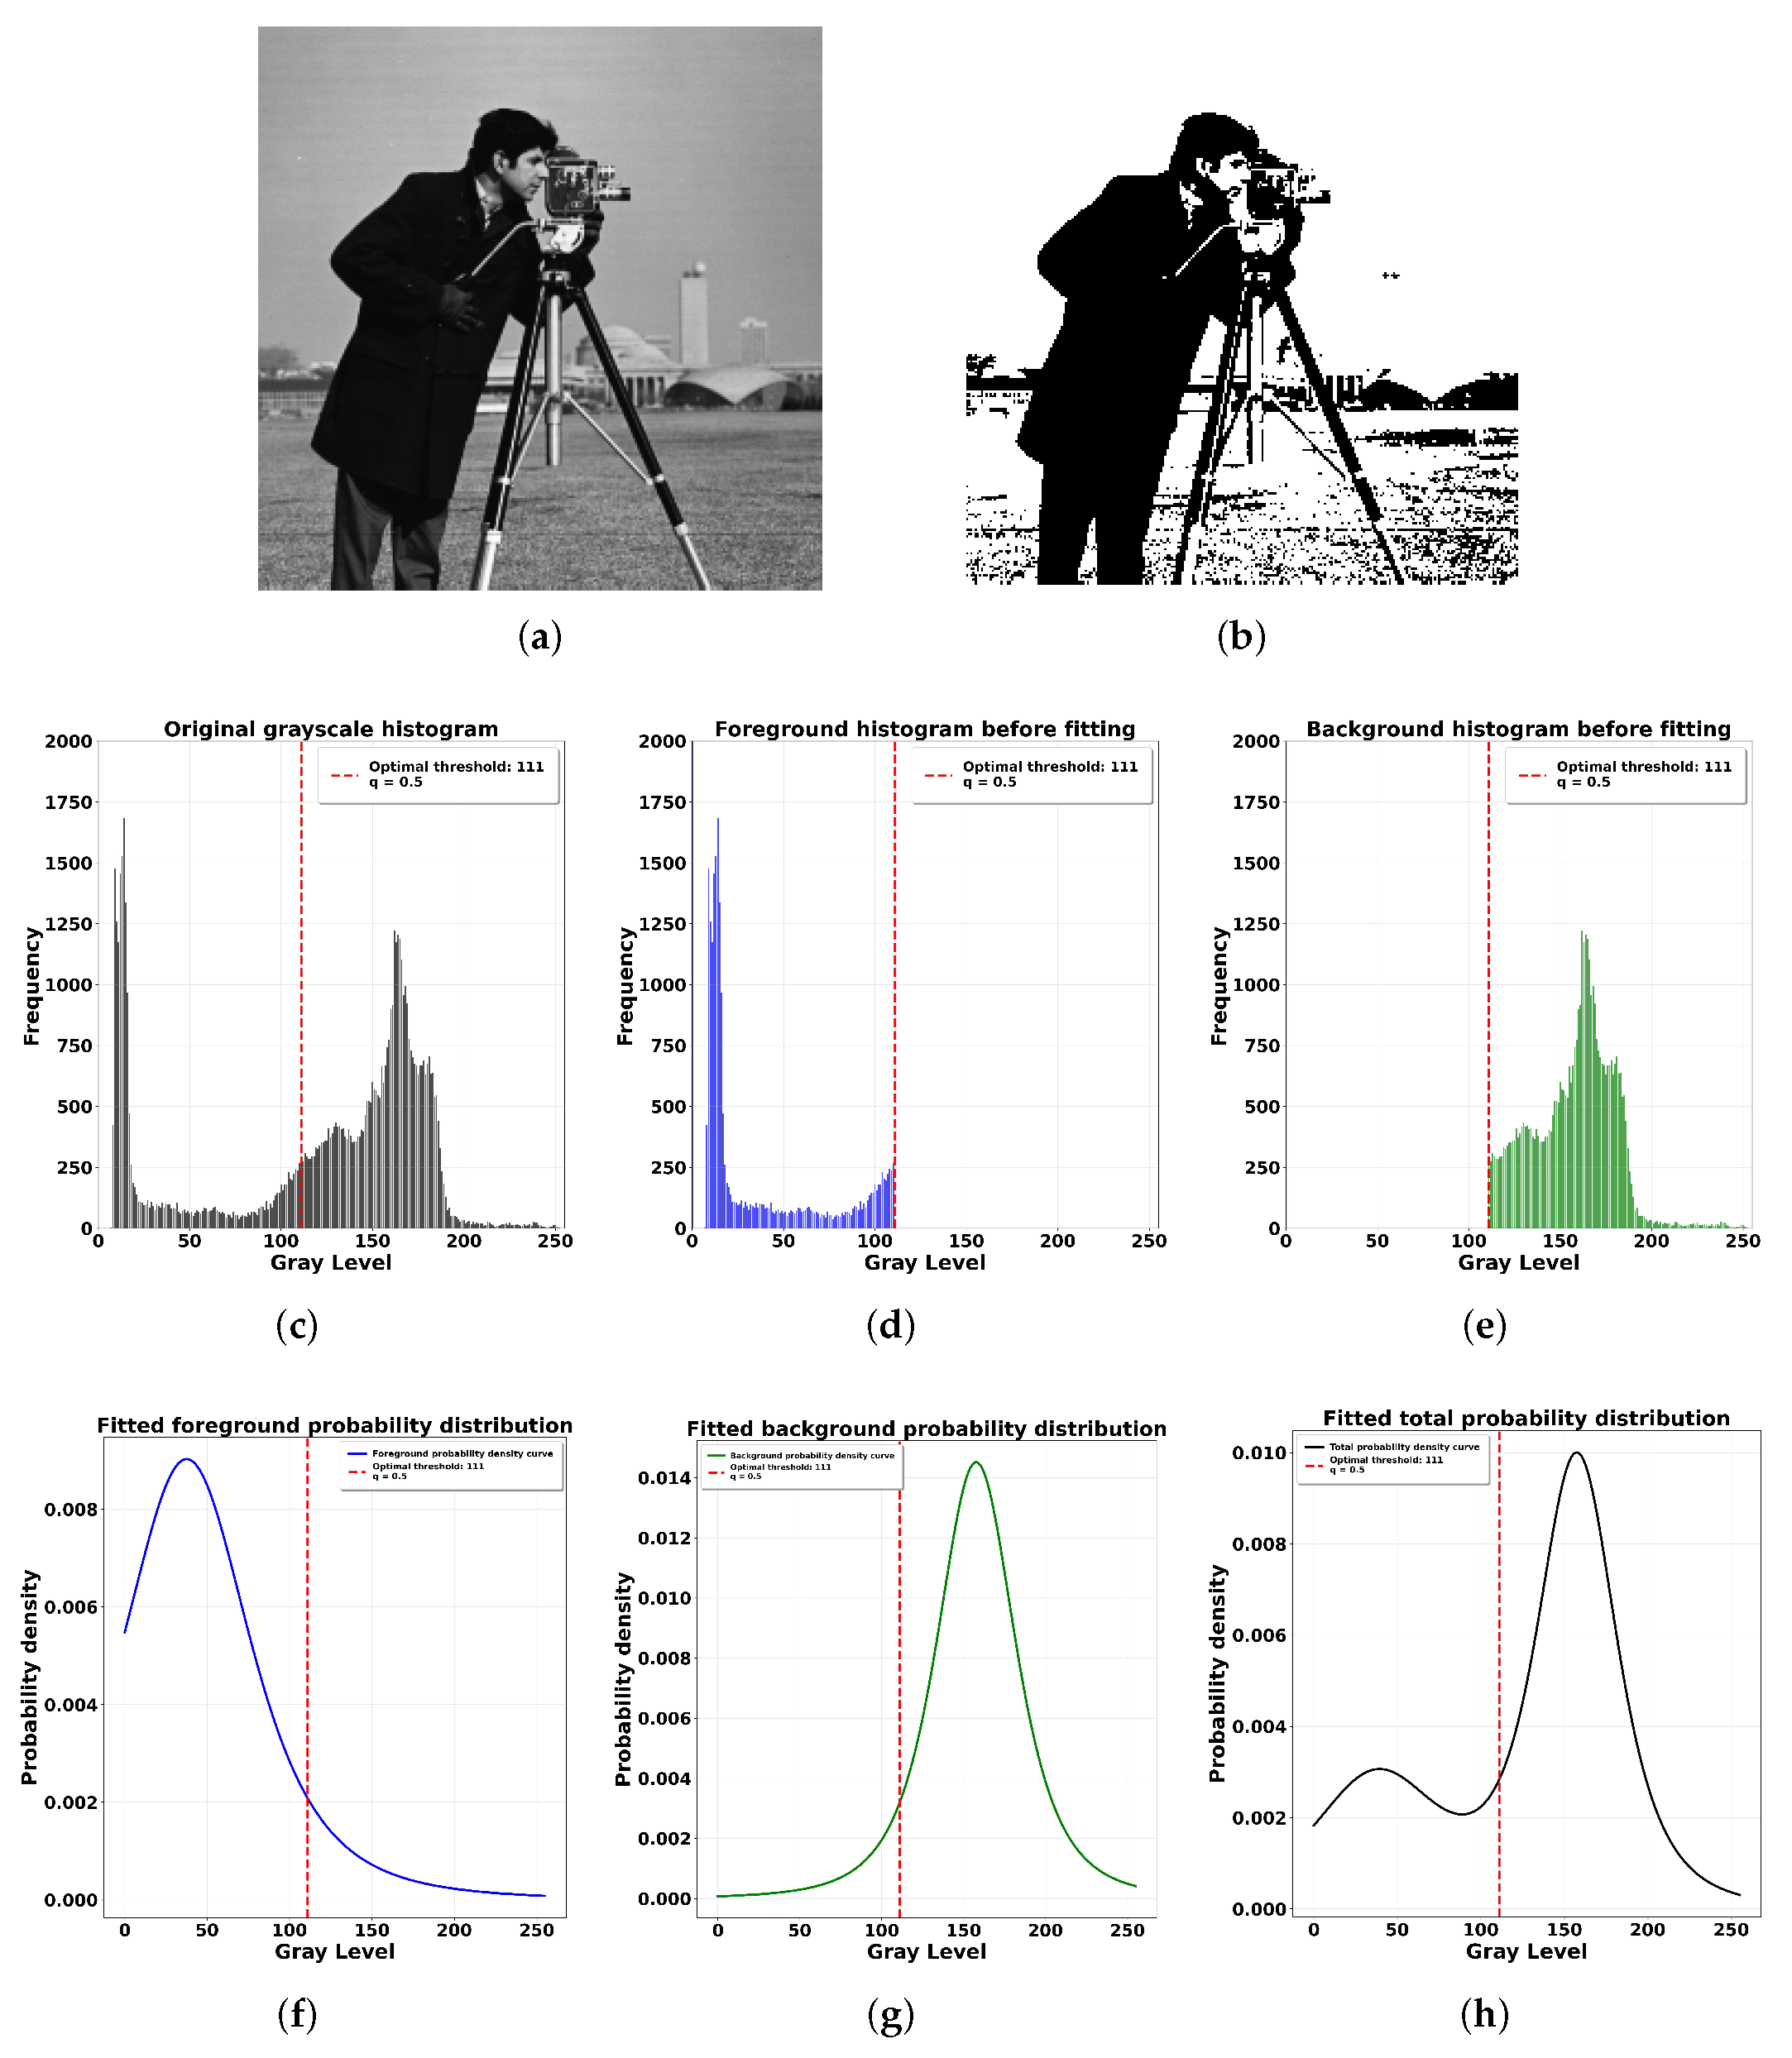
A bi-level thresholding example of the proposed algorithm with q = 0.5 is shown in Figure 1 below.
Figure 1.
Single-thresholding example of the Cameraman256 image using the proposed algorithm. (a) Original Cameraman256 image. (b) Segmented result by optimal threshold . (c) Original grayscale histogram. (d) Foreground histogram before fitting. (e) Background histogram before fitting. (f) Fitted foreground probability distribution. (g) Fitted background probability distribution. (h) Fitted total probability distribution.
By extending Equations (27) and (28) to the multi-thresholding case, the objective function and the optimal thresholds are defined as follows:
Specifically, with the newly fitted histogram as input, the maximization criterion of Tsallis entropy is adopted to search for the optimal threshold that maximizes the total entropy among the classes determined by . Obviously, the complexity of searching the optimal solution of Equation (30) will increase exponentially as n grows; another complexity comes from recomputing the mean and variance for each class when the thresholds are reset. Therefore, employing an optimization algorithm is necessary [31]. The proposed algorithm treats the image as a system consisting of several different targets and background regions, which can be considered as subsystems. It achieves optimal partitioning in the grayscale space by maximizing the non-extensive entropy of the total system. The pseudocode of the proposed algorithm is presented in Algorithm 1.
| Algorithm 1. The main algorithm for multi-level image thresholding based on the power-law distribution. | |
| 1: | Input: Grayscale histogram of the image , range of q, number of thresholds n. |
| 2: | Output: Optimal threshold set . |
| 3: | Compute the grayscale probabilities |
| 4: | For to n do Traverse each grayscale class |
| 5: | Compute the class weights , means , variances , construct the distribution by replacing “b” to “k” in Equations (22) and (23), construct the mixture distribution |
| 6: | Extract class segments: , where is the k-th threshold |
| 7: | If : , Else If : |
| 8: | End for |
| 9: | Evaluate the objective function by Equations (29) and (30), determine the optimal threshold |
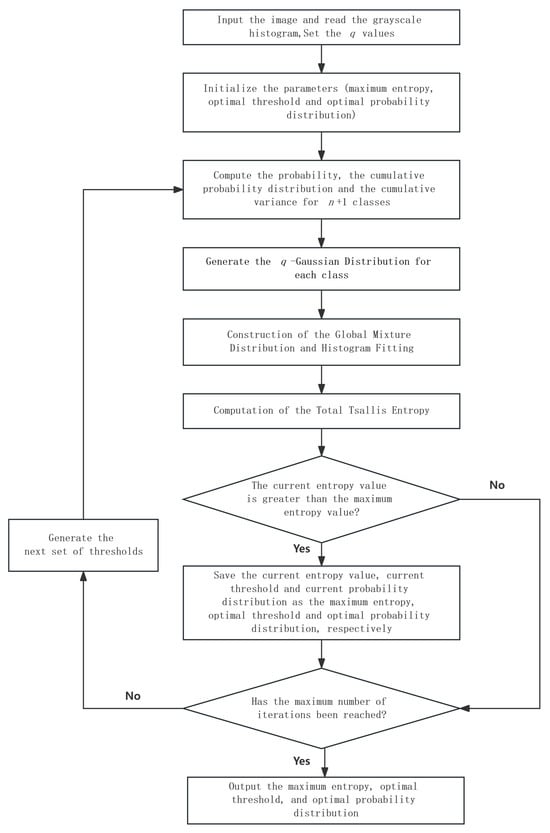
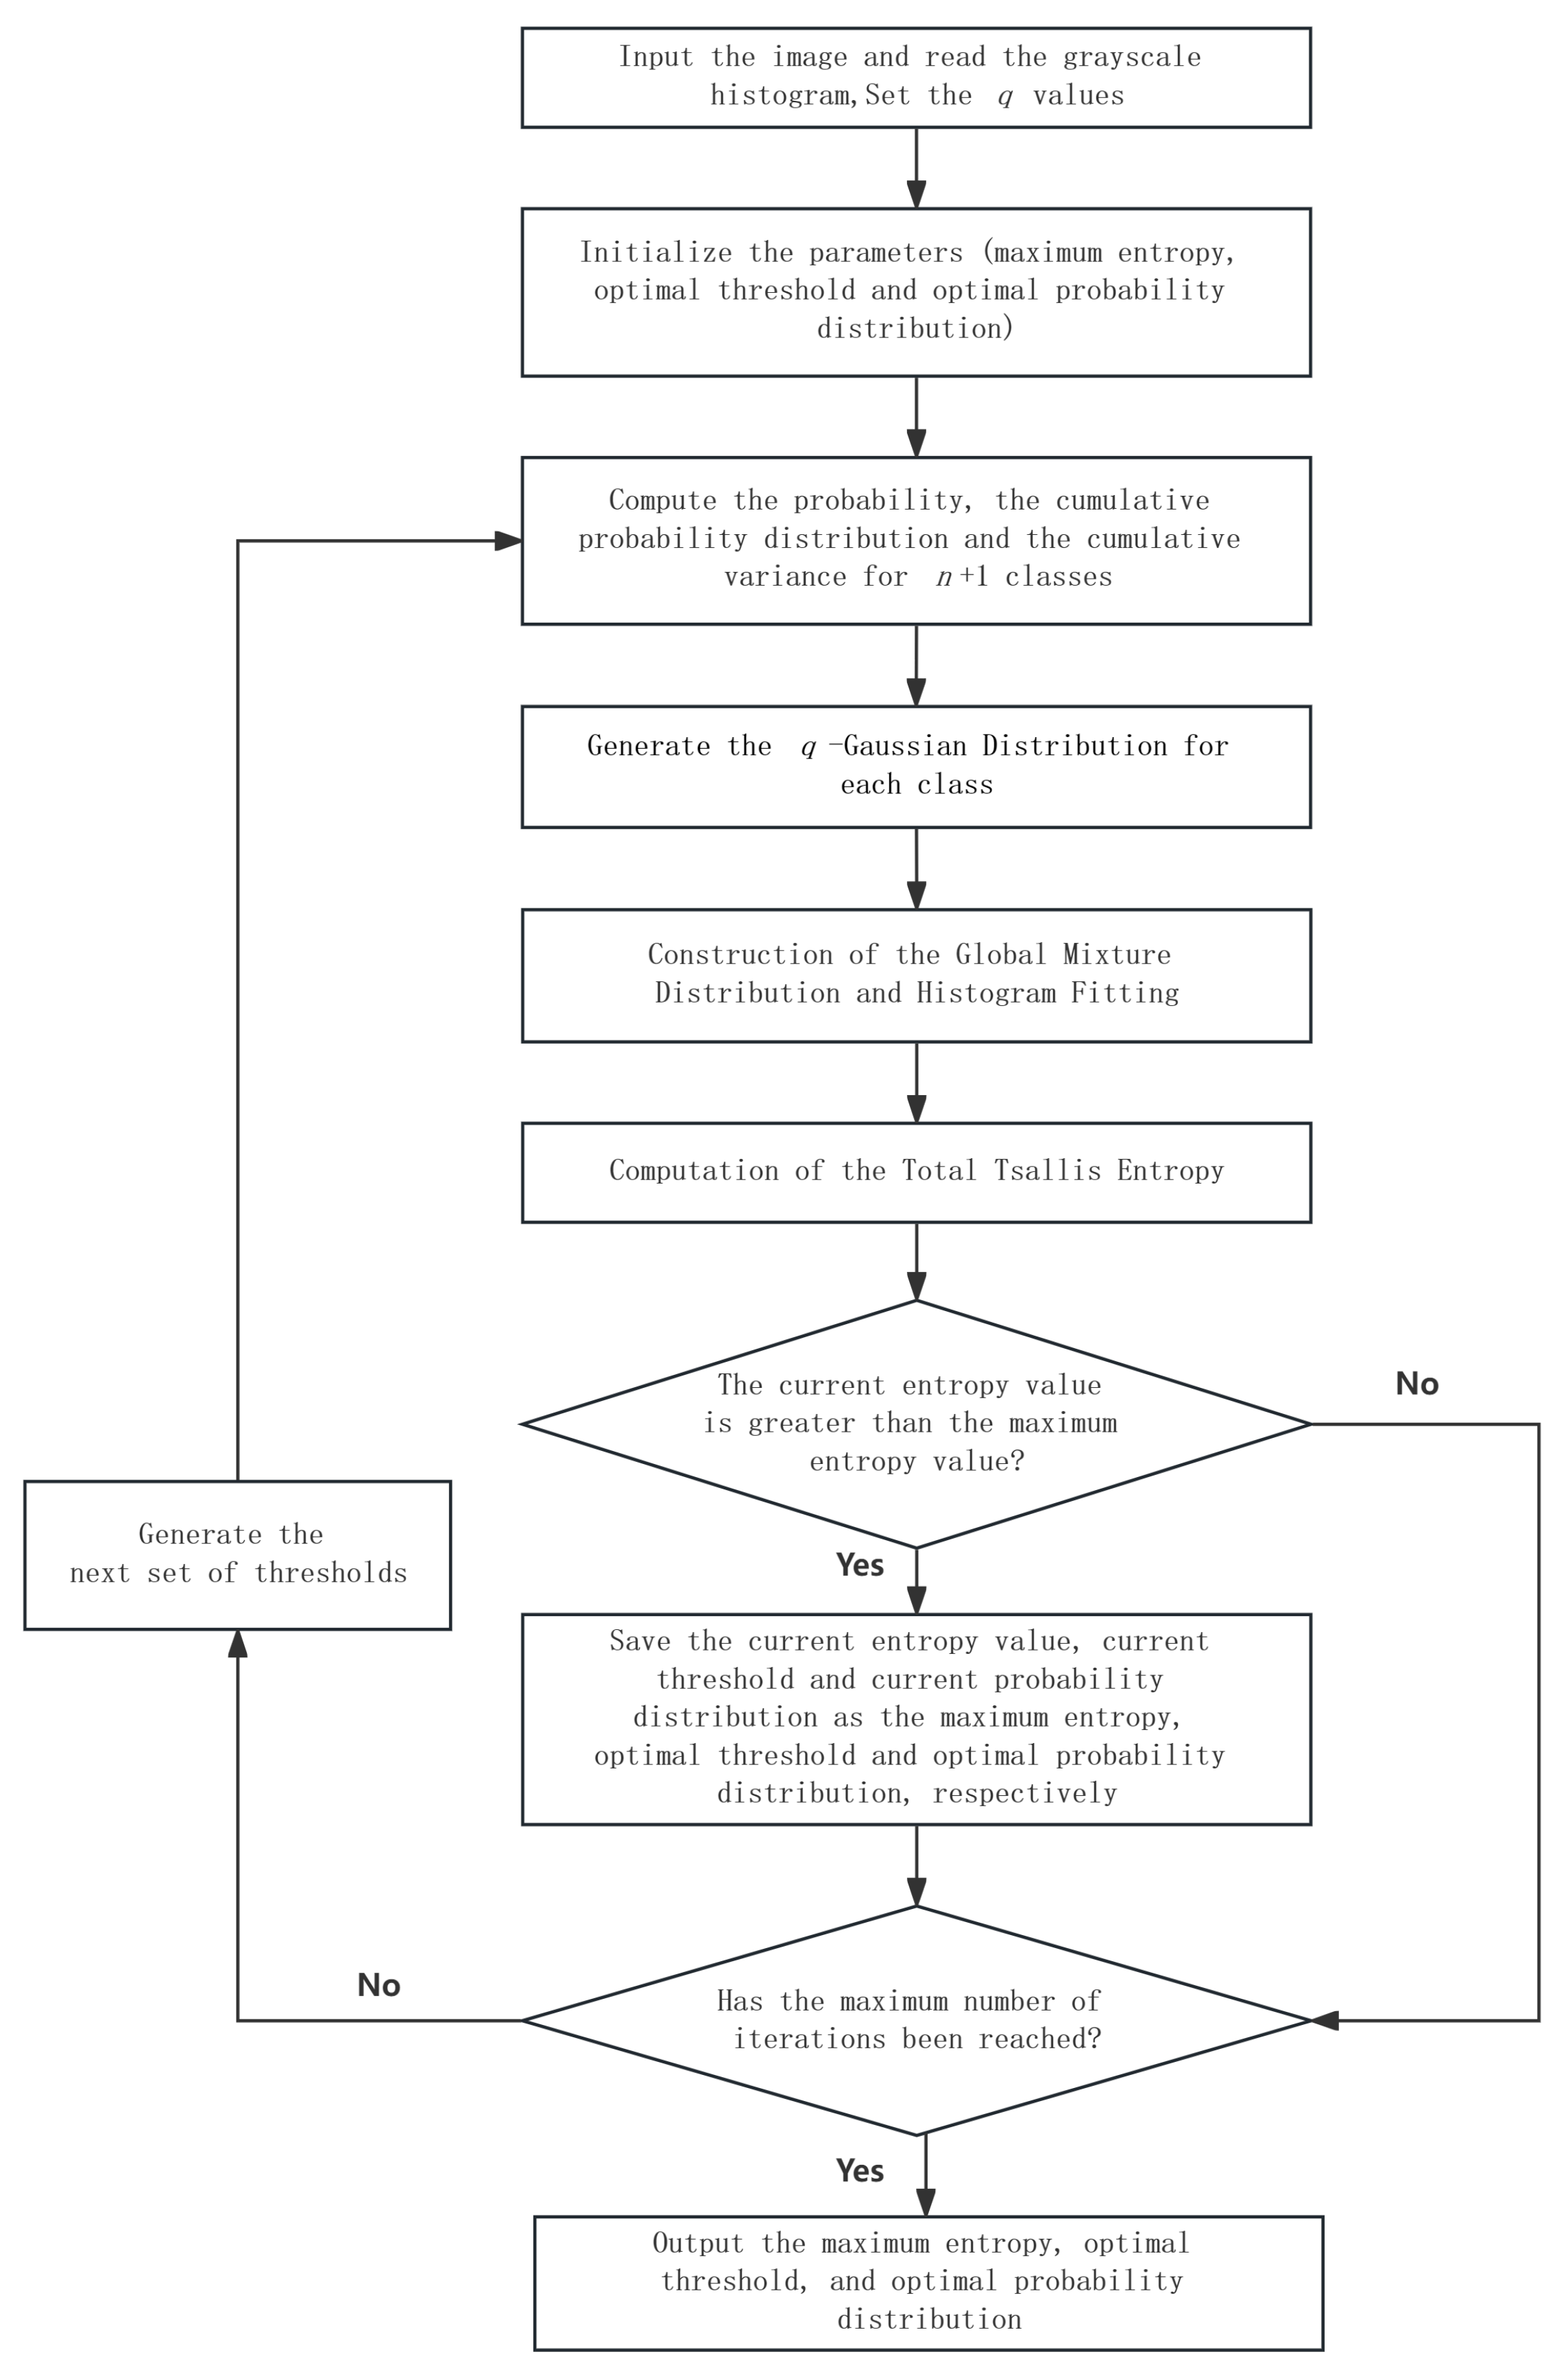
According to the algorithmic framework illustrated in Figure 2, this paper proposes an image thresholding method based on Tsallis entropy. The method first extracts the grayscale histogram from the input image to obtain the occurrence probability of each gray level. In the parameter initialization stage, the initial states of the maximum entropy, the thresholds and the corresponding probability distributions are determined by the cumulative probability distributions and cumulative variances. This establishes a statistical foundation for subsequent threshold selection. The non-extensive parameter is introduced to evaluate the non-extensive characteristics of the system. Subsequently, the procedure proceeds to the power-law distribution parameter estimation module. A global mixture distribution is constructed to fit the original histogram without changing the mean of each class. On this basis, the algorithm evaluates the entropy variation of the system under the current threshold partition by computing the objective function defined by Tsallis entropy. This workflow fully leverages the advantages of non-extensive statistical mechanics in handling complex systems. The aim of power-law distribution fitting is to avoid grayscale fluctuations, so that long-range correlations among pixels can be further utilized to improve the segmentation quality of images with noise, non-uniform illumination, or multimodal histogram distributions.
Figure 2.
Flowchart of the proposed algorithm.
4. Experimental Results and Analysis
4.1. Dataset
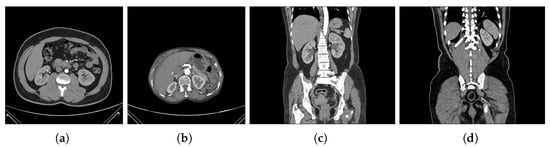
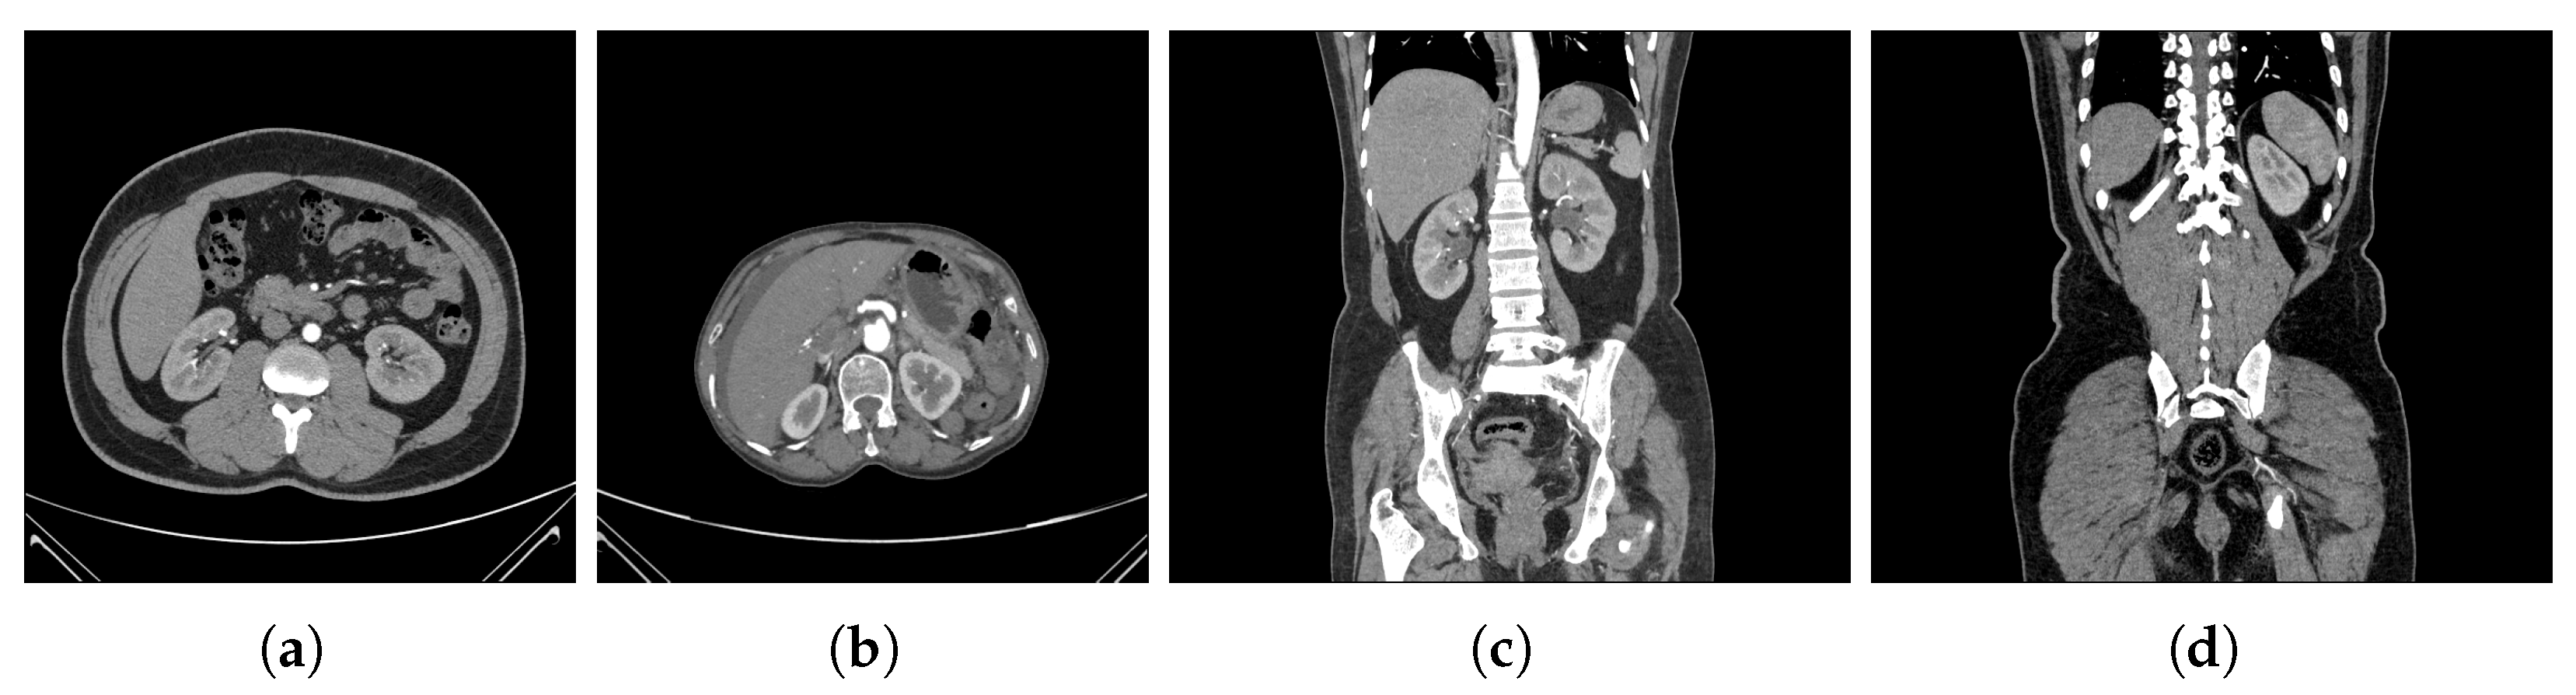
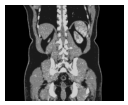
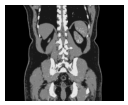
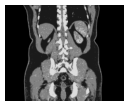
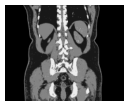
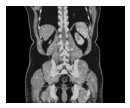
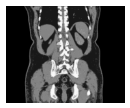
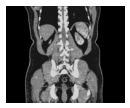
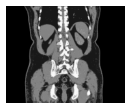
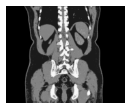
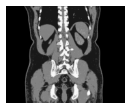
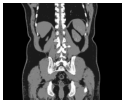
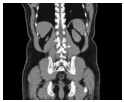
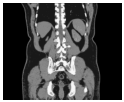
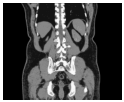
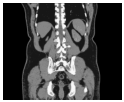
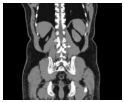
The test set used in this experiment comprises 12 series of CT images, totaling 106 CT images, all of which are randomly selected from coronal and axial sections of anonymous patients. To visually illustrate the characteristics of the dataset, four representative CT images are displayed in Figure 3.
Figure 3.
Representative CT images from the test dataset. (a) Normal-(71). (b) Normal-(1286). (c) Normal-(1695). (d) Normal-(2969).
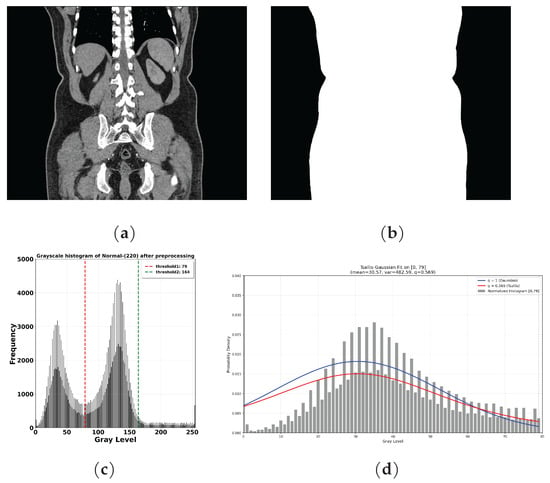
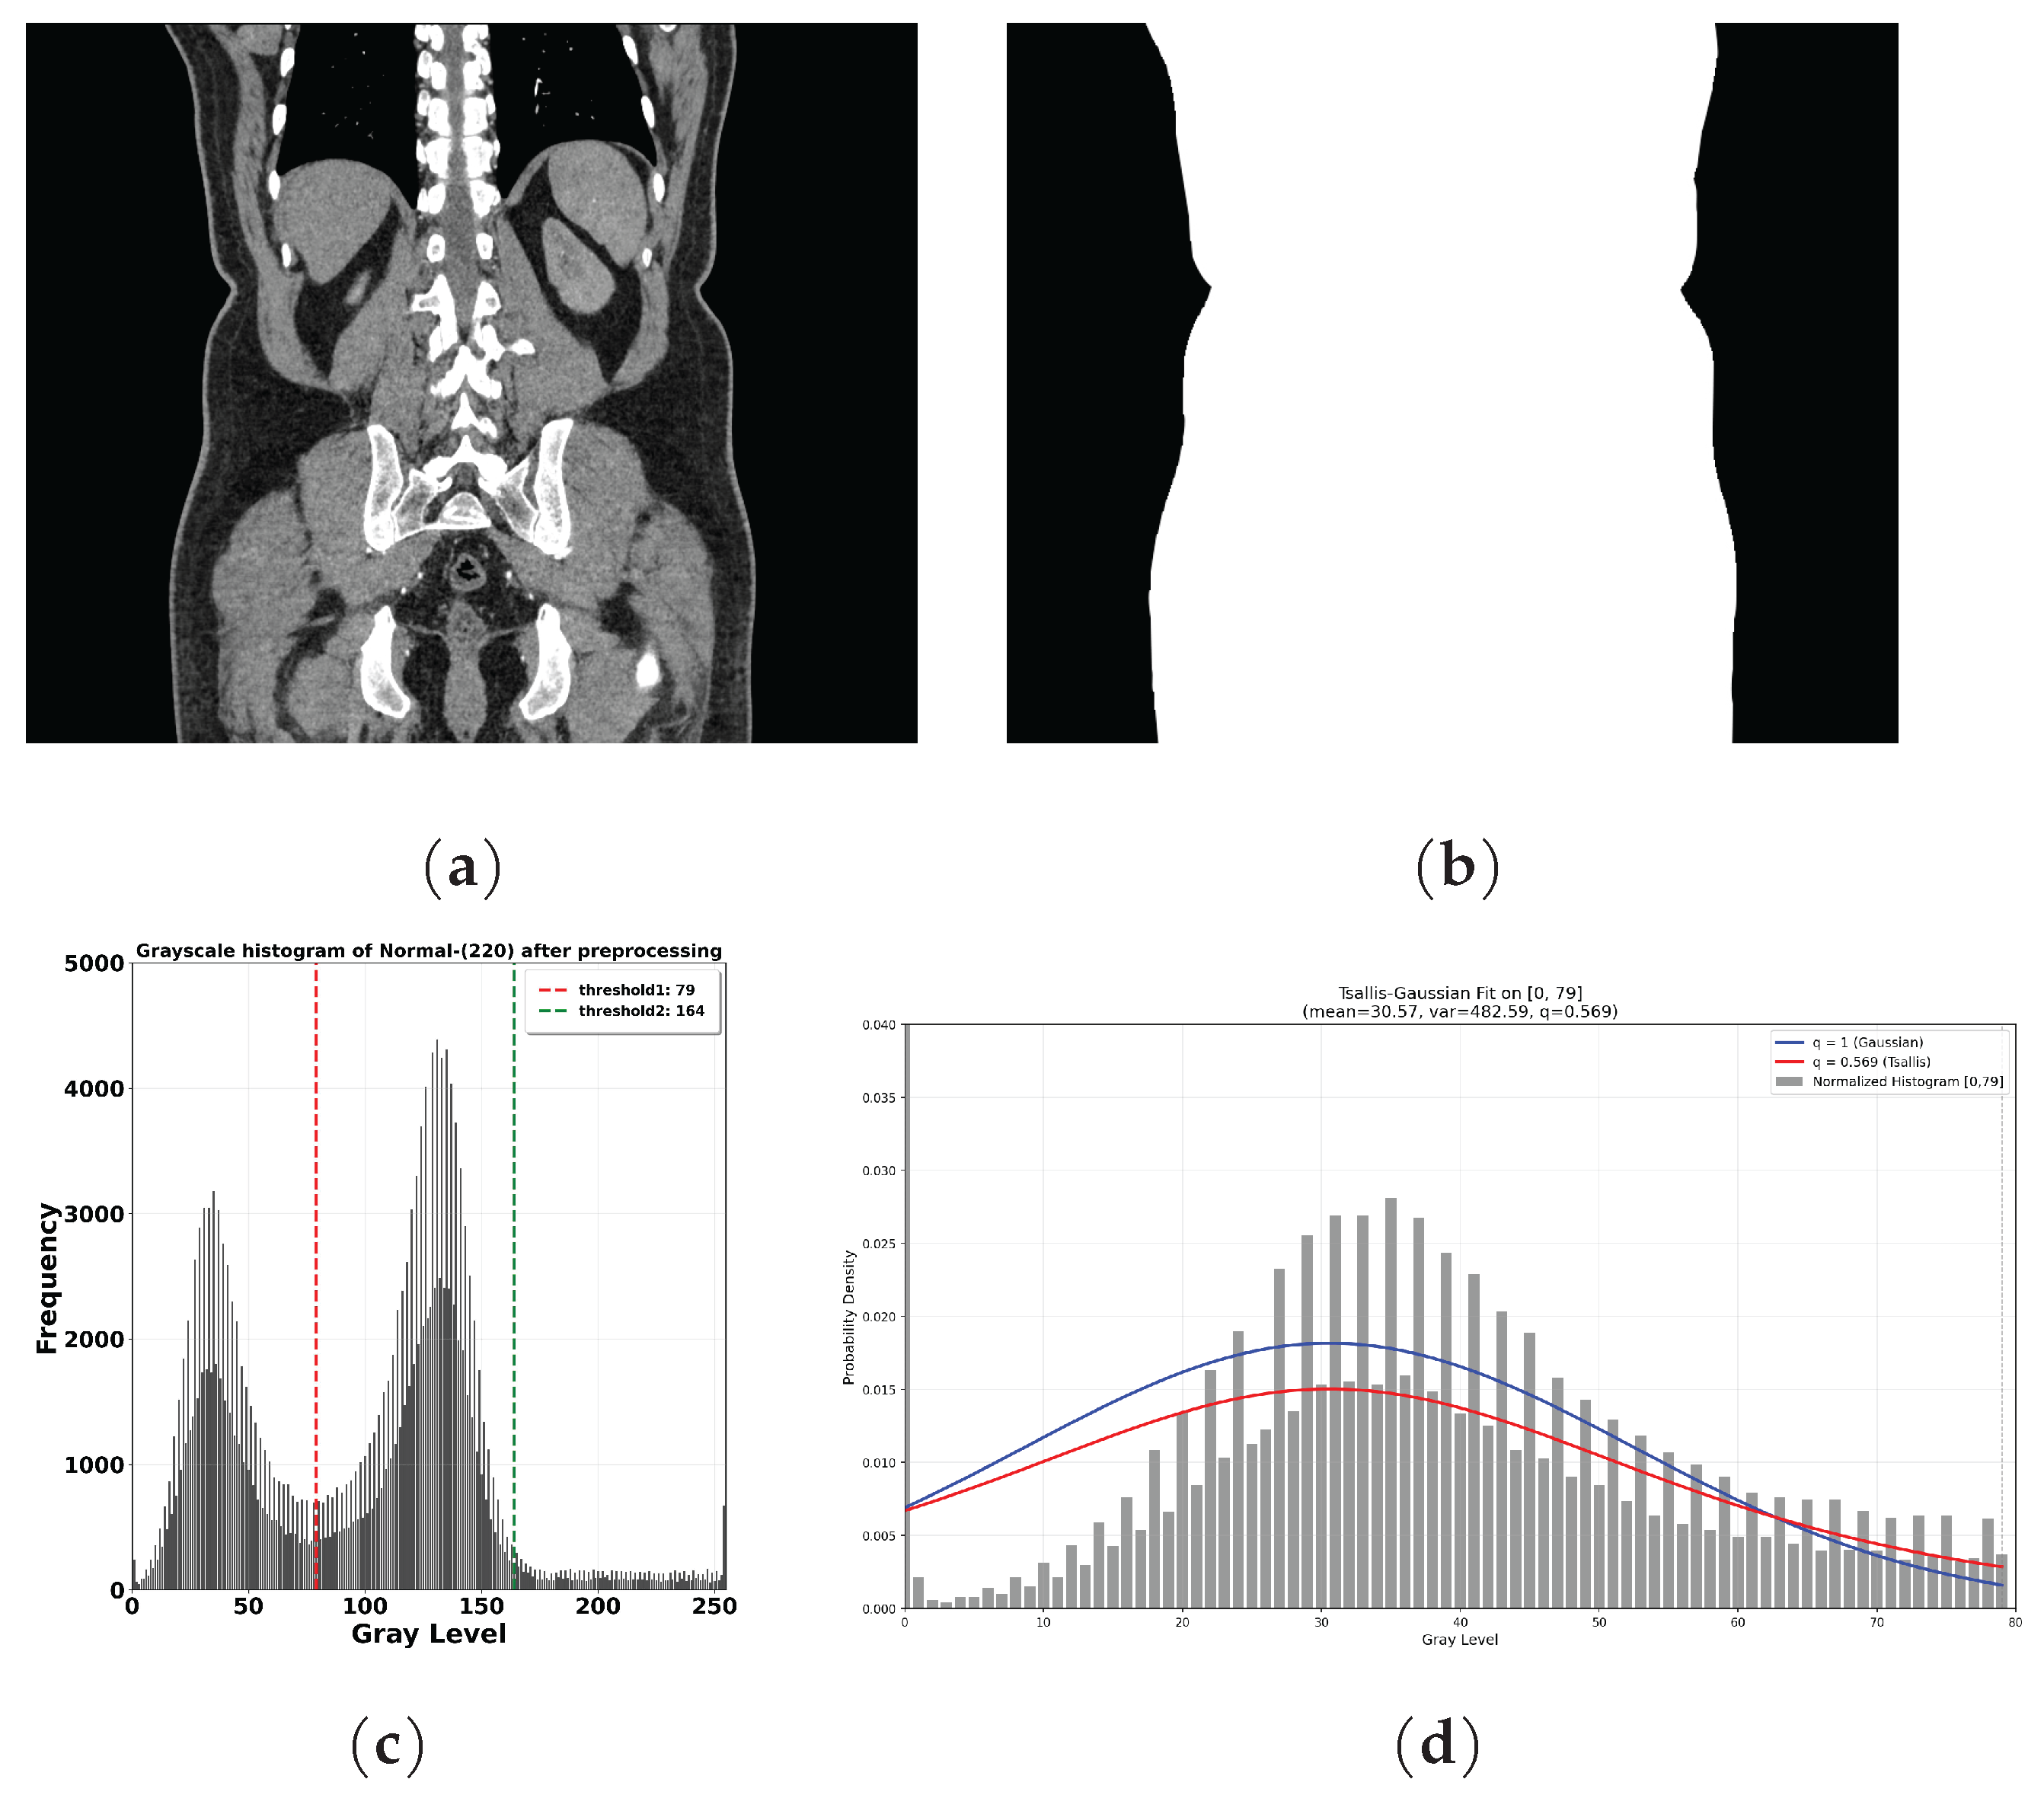
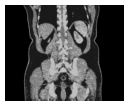
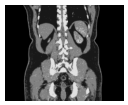
In CT images, a large number of pixels are concentrated in the background region and fail to provide valid information relevant to the target tissues. Directly performing grayscale histogram statistics on the entire image would introduce a substantial number of irrelevant pixels, which not only affects the accuracy of the threshold solution but also significantly increases the computational cost. In order to improve both experimental efficiency and segmentation accuracy, a mask is helpful to extract the target region of interest from each CT image in the tests. Only the pixels within the masked area are used for grayscale histogram statistics and subsequent analysis. An example of the mask is shown in Figure 4. Figure 4a is the original image and Figure 4b is the corresponding mask. Since the margin (left and right) of Figure 4a is uniformly black, this area can be conveniently labeled by merging. The reverse of this area is the mask. Through this preprocessing strategy, the interference from irrelevant regions in grayscale distribution modeling can be effectively eliminated. This allows the Tsallis entropy thresholding method to focus on the region of interest, which supports the following metric evaluation. In case of 2-threshold segmentation, the proposed algorithm yields and , which are properly located at the valley of the bimodal histogram, as shown in Figure 4c. Figure 4d shows the histogram fitting in range . In comparison, the sum of squares due to the error (SSE) yielded by Gaussian fitting is , while that yielded by q-Gaussian fitting is . Therefore, the q-Gaussian distribution matches the histogram better.
Figure 4.
Normal-(220) image and its corresponding mask. (a) Normal-(220). (b) Mask of Normal-(220). (c) Grayscale histogram of Normal-(220) after preprocessing and corresponding 2-threshold segmentation results suggested by proposed algorithm. (d) Comparison of Gaussian fitting and q-Gaussian fitting at .
4.2. Evaluation Metrics
To systematically evaluate the performance of the proposed algorithm in multi-threshold segmentation tasks, this paper adopts the Peak Signal-to-Noise Ratio (PSNR), Structural Similarity Index (SSIM), Feature Similarity Index (FSIM) and Modified Hausdorff Distance (MHD) as indices to evaluate the segmentation quality in this experiment. The definition of the PSNR [32] is given as follows:
where the maximum pixel value of the image is 255, and the original image x and the processed image y are both of size . For multi-level thresholding, the histogram of x is separated to many classes by gray-level thresholds. For each class, the gray values of pixels in it are replaced by the mean gray value of this class and finally yield the output y. The mean squared error (MSE) between the original image and the processed output image is defined as follows:
The Structural Similarity Index (SSIM) [33] is defined as follows:
where and are the means of the original and processed images, respectively; and are the variances of the original and processed images; is the covariance between the two images; and and are two constants. In accordance with the original SSIM [34], the size of the local window is and , , where L is the range of gray value of the image. The range of SSIM values is .
The Feature Similarity Index (FSIM) [35] is defined as follows:
where denotes the phase congruency similarity, denotes the gradient magnitude similarity, and denotes the maximum value of the phase congruency. Their definitions are given as follows:
where x represents an arbitrary pixel position within the image; and are the phase congruency values of the original image and the segmented image at pixel x, respectively; and are the gradient magnitude values of the original image and the segmented image at pixel x, respectively; and and are constants. The range of FSIM values is .
The Modified Hausdorff Distance (MHD) [36] is defined as follows:
where X and Y denote the original image and the processed image, respectively; x represents a pixel under condition ; denotes the minimum Euclidean distance from pixel x to Y; and denotes the total number of pixels in X. The distance from a pixel to another image depends on both the pixel’s gray-level value and its position. The minimum distance is found by searching for the nearest pixel with the same gray value around the same position in Y.
A higher PSNR value indicates smaller pixel deviation and higher similarity between the segmented image and the original image. It implies stronger capability in preserving detailed information during multi-thresholding. A higher SSIM value reflects greater similarity between the segmented image and the original image in terms of luminance, contrast and structural features. This leads to improved visual quality of the segmentation results. A higher FSIM value indicates better matching of phase congruency and gradient features between the segmented image and the original image. This corresponds to superior preservation of key structural and edge information. A lower MHD value signifies smaller spatial deviation between the segmented contour and the original contour. This reflects higher boundary localization accuracy and better contour matching performance.
4.3. Experimental Results and Analysis
4.3.1. Analysis of PSNR Metrics for Multi-Threshold Segmentation
In order to verify the effectiveness of the proposed algorithm, three representative threshold segmentation methods are selected to conduct comparative experiments from two aspects: entropy function modeling and parameter adaptivity. First, with the classical Kapur entropy and Tsallis entropy, the performance of the proposed algorithm in entropy function construction and threshold optimization is compared and analyzed, thereby verifying its improvements in segmentation accuracy and applicability. Second, a self-adaptive algorithm [37] based on Tsallis entropy (STEA), which automatically determines the optimal q value for each image by maximizing redundancy, is selected. The proposed algorithm is compared with this algorithm under the same optimal q value condition, so as to eliminate interference caused by parameter differences. By combining the two sets of experiments, the superiority and stability of the proposed algorithm in multi-level image thresholding are comprehensively demonstrated.
Equation (5) shows that the kernel entropy function of the Kapur algorithm [5] can be obtained at the limit ; the corresponding comparison of the proposed method is then set at . Many studies in the literature have indicated that Tsallis entropy achieves optimal segmentation performance when [38,39,40]. And STEA suggests an adaptive q value to improve segmentation quality. From Equations (11) and (12), the q-Gaussian distribution can be generated with given m and , which are related to each histogram class. And the combination of all classes yields the q dependent fitting. Therefore, the counterparts of the three abovementioned cases can be established in a generic way, with corresponding q values. The comparisons are performed under the identical objective, i.e., the Normal-(220) image shown in Figure 4. The visual results are presented in Table 1.
Table 1.
Segmentation results and visual comparison of the Normal-(220) image obtained by three different algorithms and proposed counterparts.
Table 1 presents the segmentation results of the Normal-(220) image obtained by the proposed algorithm and three other methods, with the number of thresholds set to 3, 4, and 5, respectively. The results demonstrate that the proposed algorithm achieves superior visual performance to the three competing methods at different multi-levels. Accordingly, Table 2 summarizes the comparison of the corresponding PSNR values from Table 1.
Table 2.
Comparison of PSNR values between the proposed algorithm and other methods under threshold numbers of 3, 4, and 5.
Based on the quantitative analysis of different algorithms in terms of the PSNR metrics presented in Table 2, it is evident that the proposed segmentation algorithm exhibits advantages. First, when the number of thresholds is set to 3, 4, and 5, respectively, the PSNR values of the proposed algorithm are consistently higher than those of the Kapur algorithm, the Tsallis algorithm, and the STEA algorithm, demonstrating its superior segmentation capability. Second, under a fixed number of thresholds, the proposed algorithm can optimize the parameter q, leading to an increasing trend in the PSNR, which shows the effectiveness of distribution fitting. It is worth mentioning that at 5-threshold, the results of and are identical. Nevertheless, the proposed algorithm suggests that the optimal PSNR in this case is 28.6338 with . This combination of parameter tunability and threshold scalability enhances the applicability of the algorithm in practical image processing tasks.
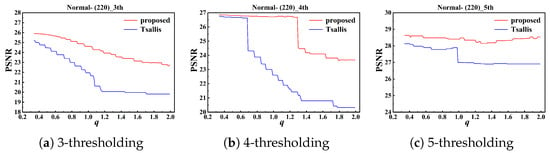
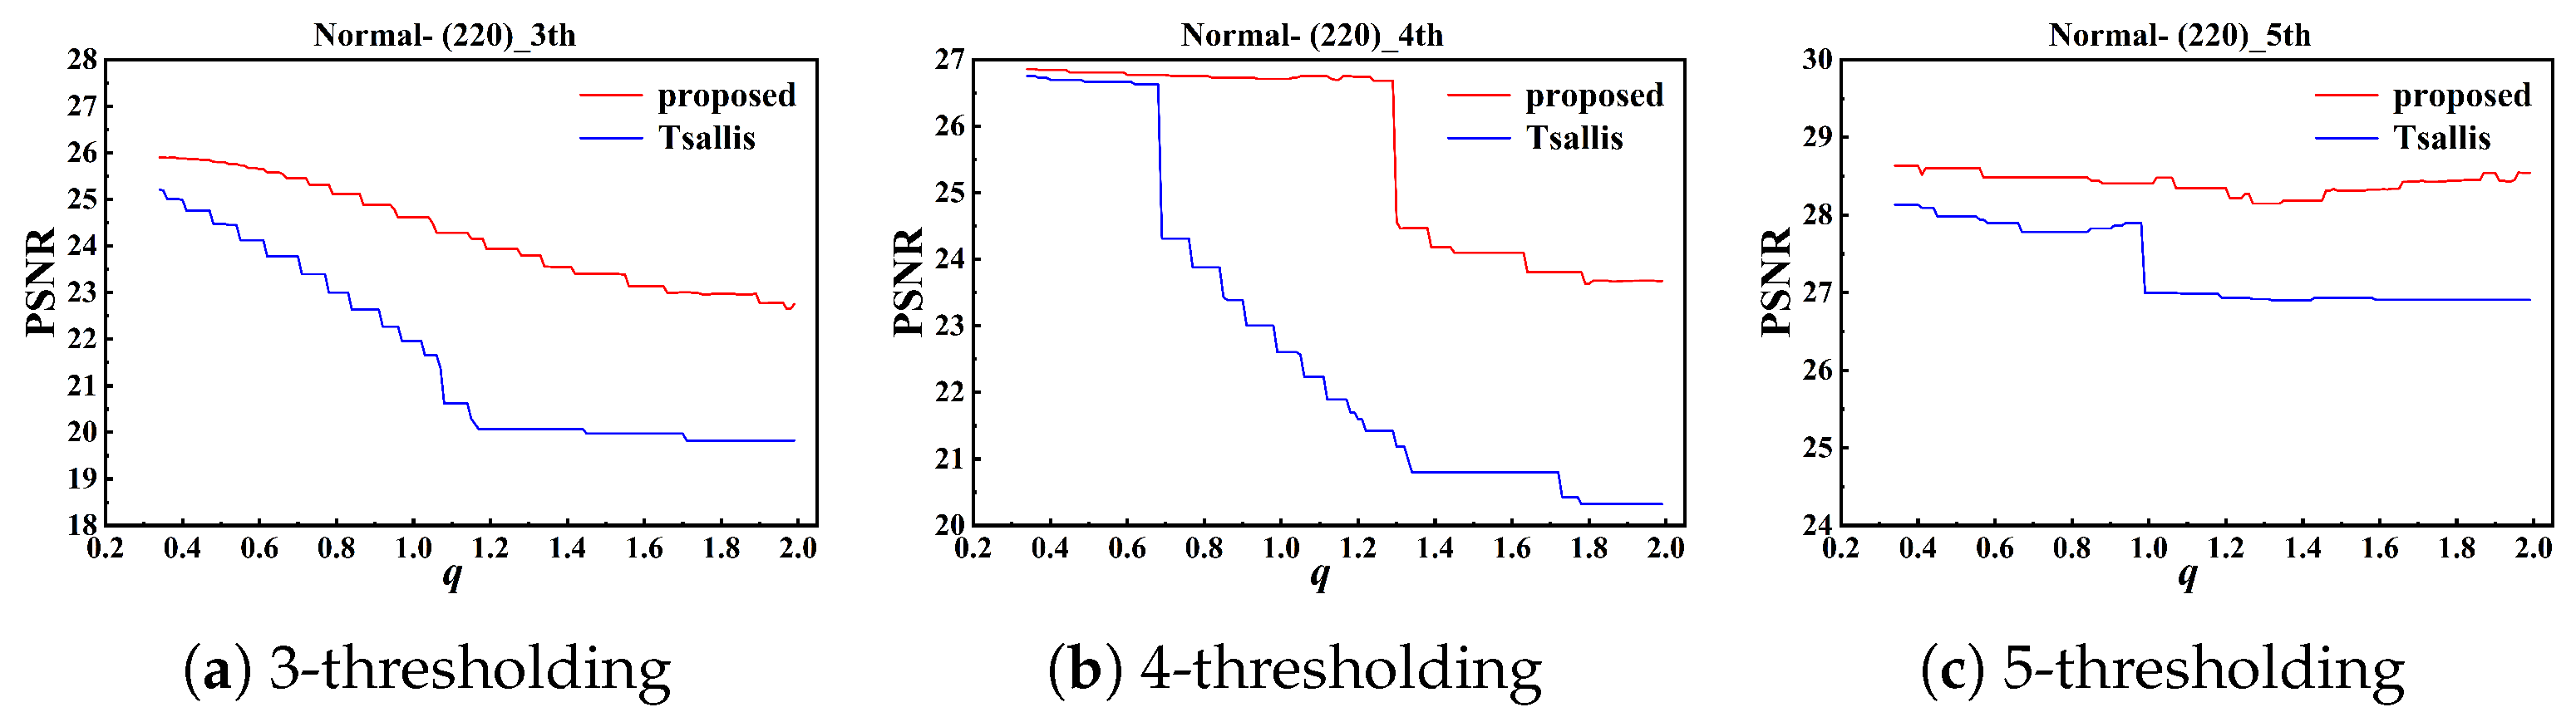
The advantages of power-law distribution fitting can be further illustrated by the comparison between the Tsallis entropy algorithm and the proposed one for continuous changes in q. The normalized probabilities of gray-level i in Equations (1) and (24) are always far less than 1 in practice. A large exponent, i.e., , on it may quickly push the value to an infinitesimal that exceeds computational accuracy. Therefore, the interval of the non-extensive parameter is set as , which includes the case of extensive entropy at . Based on the original image and its corresponding mask shown in Figure 4, the specific experimental results are presented in Figure 5 below.
Figure 5.
Segmentation results of the proposed algorithm and the Tsallis entropy algorithm with 3, 4, and 5 thresholds for .
As can be observed in Figure 5, the proposed algorithm consistently demonstrates superior performance at different numbers of thresholds. Specifically, in the cases of 3, 4, and 5 thresholds, the proposed algorithm outperforms the traditional Tsallis entropy thresholding algorithm in terms of the PSNR metric in most instances, exhibiting a significant improvement in segmentation effectiveness. This further validates the adaptability and superiority of the proposed algorithm in handling complex grayscale distributions of images.
Besides image Normal-(220), comparisons of PSNR values are extended to 106 CT images that are mentioned in Section 4.1. It is worth mentioning that for STEA, the 106 adaptive q values are different from each other. The proposed algorithm is performed at the same q value as STEA for each image, so that their performance is evaluated objectively. If the PSNR obtained by the proposed algorithm is larger than that of STEA for a given image, the count of the proposed algorithm increases by 1, and vice versa. Therefore, the sum of both counts is kept in the total number of images. The comparisons with the Kapur algorithm and the Tsallis algorithm () are performed in the same way. The results are listed below.
In Table 3, the proposed algorithm is systematically evaluated against three comparative methods on a test set of 106 CT images. Since, at the limit , the conventional Tsallis entropy-based thresholding method degenerates into the Kapur entropy thresholding method, it is of interest to perform the proposed algorithm at . The statistical results suggest that, with grayscale distribution fitting, the segmentation quality will be apparently improved. At , although the Tsallis entropy method has been widely reported in the literature to exhibit satisfactory segmentation performance, the proposed algorithm still outperforms it in terms of the PSNR on approximately 80% of the test images for different numbers of thresholds, demonstrating superior segmentation accuracy and enhanced adaptability in handling the complex gray-level distributions inherent in CT images. As for the STEA algorithm, the optimal non-extensive parameter is obtained by maximizing the redundancy criterion, and is then substituted into the proposed algorithm to estimate the power-law distribution of grayscale. The results still demonstrate the dominant advantages of the proposed algorithm. Furthermore, the median PSNR between the proposed algorithm at and other algorithms also supports the improvement, since a higher PSNR means a lower MSE. Therefore, grayscale distribution fitting can effectively reduce the noise and fluctuations generated during the imaging process. The power-law estimations associated with the non-extensive parameter accurately match the long-range pixel correlations among CT images, which exhibit more complex imaging modes. The relationship between correlation strength and imaging mode can be further discussed below.
Table 3.
Comparison of PSNR metrics between the proposed algorithm and the Kapur, Tsallis, and STEA algorithms.
4.3.2. Consistency and Robustness of Parameter q
The performance of the proposed algorithm is illustrated at several given q values in Table 3. It is of interest to further verify the intrinsic advantages of the proposed algorithm in terms of the optimal parameter . The idea is to evaluate the segmentation metrics yielded by the proposed algorithm with the parameter q varying in a specific interval, i.e., . If the metric reaches its optimal value, the corresponding parameter can be denoted as . The test set consists of 12 independent image series. Each series contains 8-10 images that are generated in the same circumstance, i.e., from the same position or the same patient. Take images from Normal-(1695) to Normal-(1702) that belong to the same series as examples. The maximal PSNR metrics and corresponding are listed in Table 4 for 3, 4, and 5 thresholding, respectively.
Table 4.
The maximal PSNR and corresponding yielded by the proposed algorithm for images belonging to the same series.
As shown in Table 4, in the same case of multi-thresholding, all images exhibit a distinct and consistently stable trend. The optimal values corresponding to the maximal PSNR metric for each image converge to a relatively narrow interval, without showing significant dispersion or fluctuation. This indicates that the proposed algorithm can recognize the common pattern of the images generated in the same situations, and it achieves good repeatability and intra-series consistency, which may substantially reduce subjectivity and randomness in the parameter tuning process. Table 4 also shows that the optimal values are quite different from each other when the number of thresholds changes. Since the definition of objects and backgrounds depends closely on the levels of thresholding, different segmentations obviously exhibit different patterns, and this difference can be successfully captured by the proposed algorithm. On the other hand, q represents the strength of non-extensivity among gray-level classes of an image. means the most suitable strength at a given number of thresholds. As the number of thresholds changes, the computer needs to reclassify the pixels and fit the histogram with another proper distribution. There is no evidence that there exists a unique that is suitable for all numbers of thresholds.
The proposed algorithm not only exhibits a significant and consistently stable trend in terms of the PSNR but also demonstrates similar behavior in optimizing the SSIM, FSIM, and MHD. For instance, optimizing the SSIM for the image sequence Normal-(1695–1702) in the case of 3-thresholding yields eight values of . The mean and standard deviation of those values can be obtained as 0.35 and 0.01, respectively. The same procedure is then applied to other multi-thresholding cases and other evaluation metrics. The experimental results are listed in Table 5 for all 12 series of images. At the series level, the optimal seems irrelevant to each other, even though the evaluation metric and the number of thresholds are the same. The reason may lie in the randomness of the positions and patients. In statistics, the smaller the standard deviation, the better the inter-series consistency. Therefore, the proposed algorithm is not significantly affected by variations in image of the same series for most cases. It shows strong robustness in recognizing patterns on images in the same sequence. These characteristics not only improve the stability of multi-thresholding for images with complex grayscale distributions but also provide a novel perspective for image histogram modeling within the non-extensive statistical framework.
Table 5.
Mean and standard deviation of values corresponding to the optimal SSIM, FSIM, and MHD for image sequences.
4.3.3. Gaussian Distribution Fitting and Proposed Algorithm
As mentioned above, the grayscale distributions of many images may exhibit complex statistical characteristics such as non-Gaussianity, heavy tails or multimodality. In this case, the Gaussian estimation of the grayscale distribution is limited, and the proposed power-law estimation model can be considered as a kind of generalization, which demonstrates favorable accuracy and robustness. On the test dataset comprising 106 randomly chosen CT images whose grayscale histograms deviate from the conventional Gaussian distribution, the performance of the proposed algorithm and that of the GMM [19] can be listed in terms of the four metrics mentioned in Section 4.2. Quite similar to Table 3, for a given image, the count of the proposed algorithm will increase by 1 if it yields a better metric result than that of the GMM, and vice versa. The experiments are performed with different numbers of thresholds.
The results are listed in Table 6. It can be seen that the proposed power-law estimation function model greatly improves the segmentation quality when the image grayscale distribution shows long-range correlations among pixels. In fact, according to the definitions in Equations (21) and (22), the Gaussian estimation function is a kind of special case of the proposed q-Gaussian estimation. Therefore, the GMM is intrinsically part of the proposed algorithm and is only suitable for images that prefer a normal gray-level distribution. Experimental results show that most of the tested images exhibit power-law properties in terms of arbitrary evaluation metrics—the PSNR, SSIM, FSIM, and MHD. The improvement in q-Gaussian fitting can also be quantitatively illustrated by the median differences of these four metrics. As shown in Table 6, the median PSNR obtained by the proposed algorithm minus that of the GMM is always positive for different numbers of thresholds, as are the SSIM and FSIM. For MHD, the value is negative, as expected. It is worth mentioning that the results slightly fluctuate at different numbers of thresholds, since the pattern of objects and backgrounds will slightly adjust when the segmentation level changes. However, the non-Gaussian mode is always dominant in more than 90% of the test images. The above findings fully validate the significant advantages of the proposed algorithm in handling image data characterized by non-Gaussian, heavy-tailed, or non-extensive distribution properties, which endows the algorithm with broader applicability in real-world image processing tasks.
Table 6.
Performance of the proposed algorithm and GMM in terms of 4 metrics.
5. Conclusions
In this paper, the origin between the q-Gaussian function and non-extensive Tsallis entropy is traced, which inspires the proposed multi-threshold image segmentation algorithm. Its effectiveness for images presenting power-law grayscale distributions is shown. In the preprocessing stage, a mask is employed to extract the target subject region, and grayscale histogram statistics are performed solely on the region of interest, which effectively reduces computational redundancy and improves segmentation accuracy. To validate the proposed algorithm’s performance, three strongly correlated multi-thresholding algorithms associated with Kapur entropy, traditional Tsallis entropy, and the STEA optimization are adopted to perform comparative experiments. For a given CT image, the results of the PSNR demonstrate that the proposed algorithm significantly outperforms the comparison methods under threshold settings of 3, 4, and 5. This indicates that the proposed algorithm can flexibly adapt to the segmentation tasks by varying the non-extensive parameter q, and the power-law fitting to the grayscale distribution plays an important role in noise reduction. For the test set containing 106 CT images, the statistical results further support that the proposed algorithm outperforms Shannon entropy and Tsallis entropy on approximately 80% of the images. Even for the STEA algorithm with a self-adaptive value, the proposed algorithm achieves a superior PSNR on two-thirds of the test images. For CT images belonging to the same sequence, the q values corresponding to the best evaluation metrics converge to small intervals, demonstrating excellent parameter consistency and robustness. Moreover, the proposed algorithm outperforms the GMM algorithm on more than 90% of the CT images across the PSNR, SSIM, FSIM, and MHD metrics, verifying its general scope for images presenting non-extensive, heavy-tailed distribution characteristics. Therefore, the advantages of non-extensive statistical mechanics in modeling complex systems are inherited by image segmentation. The proposed algorithm accurately characterizes the grayscale histogram of the CT images by the power-law distribution, and achieves efficient, stable, and scalable multi-threshold segmentation. It is of interest to apply the proposed algorithm to images presenting long-range pixel correlations, not limited to the medical image category.
Author Contributions
Conceptualization, C.O. and S.Z.; methodology, C.O.; software, S.Z.; validation, C.O. and S.Z.; formal analysis, C.O. and S.Z.; investigation, S.Z. and J.C.; resources, C.O.; data curation, S.Z.; writing—original draft preparation, S.Z.; writing—review and editing, C.O.; visualization, S.Z. and J.C.; supervision, C.O. All authors have read and agreed to the published version of the manuscript.
Funding
The authors would like to thank the support of the Program for Prominent Talents in Fujian Province and the Scientific Research Foundation for the Returned Overseas Chinese Scholars, State Education Ministry.
Institutional Review Board Statement
Not applicable.
Informed Consent Statement
Not applicable.
Data Availability Statement
The original contributions presented in this study are included in the article. Further inquiries can be directed to the corresponding author.
Acknowledgments
The authors would like to thank https://www.kaggle.com/datasets/nazmul0087/ct-kidney-dataset-normal-cyst-tumor-and-stone (accessed on 25 October 2026) for providing source images.
Conflicts of Interest
The authors declare no conflicts of interest.
References
- Batenburg, K.J.; Sijbers, J. Optimal threshold selection for tomogram segmentation by projection distance minimization. IEEE Trans. Med. Imaging 2009, 28, 676–686. [Google Scholar] [CrossRef] [Scilit] [PubMed]
- Su, H.; Zhao, D.; Elmannai, H.; Heidari, A.A.; Bourouis, S.; Wu, Z.; Cai, Z.; Gui, W.; Chen, M. Multilevel threshold image segmentation for COVID-19 chest radiography: A framework using horizontal and vertical multiverse optimization. Comput. Biol. Med. 2022, 146, 105618. [Google Scholar] [CrossRef] [Scilit] [PubMed]
- Jumiawi, W.A.H.; EI-Zaart, A. Improvement in the between-class variance based on lognormal distribution for accurate image segmentation. Entropy 2022, 24, 1204. [Google Scholar] [CrossRef] [Scilit] [PubMed]
- Singh, S.; Singh, H.; Mousavirad, S.J.; Oliva, D.; Hussien, A.G.; Abualigah, L. Improved COOT optimization: An approach to multilevel thresholding in image segmentation. Sci. Rep. 2025, 15, 41160. [Google Scholar] [CrossRef] [Scilit] [PubMed]
- Kapur, J.N.; Sahoo, P.K.; Wong, A.K.C. A new method for gray-level picture thresholding using the entropy of the histogram. Comput. Vis. Graph. Image Process. 1985, 29, 273–285. [Google Scholar] [CrossRef] [Scilit]
- Ramos-Frutos, J.A.; Miguel-Andrés, I.; Oliva, D.; Casas-Ordaz, A. Improving the estimation of distribution algorithm with a differential mutation for multilevel thresholding image segmentation. Int. J. Mach. Learn. Cybern. 2024, 15, 4255–4323. [Google Scholar] [CrossRef] [Scilit]
- Ramos-Frutos, J.A.; Oliva, D.; Miguel-Andrés, I.; Casas-Ordaz, A.; Ramos-Soto, O.; Aranguren, I.; Zapotecas-Martínez, S. Multi-population estimation of distribution algorithm for multilevel thresholding in image segmentation. Neurocomputing 2025, 641, 130325. [Google Scholar] [CrossRef] [Scilit]
- Havrda, J.; Charvát, F. Quantification method of classification processes: Concept of structural a-entropy. Kybernetika 1967, 3, 30–35. [Google Scholar]
- Daróczy, Z. Generalized information functions. Inf. Control 1970, 16, 36–51. [Google Scholar] [CrossRef] [Scilit]
- Tsallis, C. Possible generalization of Boltzmann-Gibbs statistics. J. Stat. Phys. 1988, 52, 479–487. [Google Scholar] [CrossRef] [Scilit]
- Tsallis, C.; Mendes, R.; Plastino, A.R. The role of constraints within generalized nonextensive statistics. Phys. A Stat. Mech. Appl. 1998, 261, 534–554. [Google Scholar] [CrossRef] [Scilit]
- Albuquerque, M.P.D.; Esquef, I.A.; Mello, A.R.G.; Albuquerque, M.P.D. Image thresholding using Tsallis entropy. Pattern Recognit. Lett. 2004, 25, 1059–1065. [Google Scholar] [CrossRef] [Scilit]
- Bhandari, A.K.; Kumar, A.; Singh, G.K. Tsallis entropy based multilevel thresholding for colored satellite image segmentation using evolutionary algorithms. Expert Syst. Appl. 2015, 42, 8707–8730. [Google Scholar] [CrossRef] [Scilit]
- Luo, S.; Luo, Z.; Zhan, Z.; Liang, G. Optimum Thresholding for Medical Brain Images Based on Tsallis Entropy and Bayesian Estimation. In Proceedings of the 2022 IEEE 35th International Symposium on Computer-Based Medical Systems, Shenzhen, China, 21–23 July 2022; IEEE: Piscataway, NJ, USA, 2022; pp. 360–365. [Google Scholar] [CrossRef] [Scilit]
- Wang, S.; Fan, J.; Liu, H. Linearized circular energy curve color image segmentation based on Tsallis entropy. Expert Syst. Appl. 2025, 273, 126746. [Google Scholar] [CrossRef] [Scilit]
- Wang, S.; Fan, J. Simplified expression and recursive algorithm of multi-threshold Tsallis entropy. Expert Syst. Appl. 2024, 237, 121690. [Google Scholar] [CrossRef] [Scilit]
- Wang, X.; Yang, Y.; Nan, M.; Bao, G.; Liang, G. Optimum multilevel thresholding for medical brain images based on Tsallis entropy, incorporating Bayesian estimation and the Cauchy distribution. Appl. Sci. 2025, 15, 2355. [Google Scholar] [CrossRef] [Scilit]
- Bazi, Y.; Bruzzone, L.; Melgani, F. Image thresholding based on the EM algorithm and the generalized Gaussian distribution. Pattern Recognit. 2007, 40, 619–634. [Google Scholar] [CrossRef] [Scilit]
- Huang, Z.K.; Chau, K.W. A new image thresholding method based on Gaussian mixture model. Appl. Math. Comput. 2008, 205, 899–907. [Google Scholar] [CrossRef] [Scilit]
- Ehsaeyan, E. An efficient image segmentation method based on expectation maximization and Salp swarm algorithm. Multimed. Tools Appl. 2023, 82, 40625–40655. [Google Scholar] [CrossRef] [Scilit] [PubMed]
- Nguyen, T.M.; Wu, Q.M.J. Dirichlet Gaussian mixture model: Application to image segmentation. Image Vis. Comput. 2011, 29, 818–828. [Google Scholar] [CrossRef] [Scilit]
- Xu, H.; Jiang, G.; Yu, M.; Luo, T. A local Gaussian distribution fitting energy-based active contour model for image segmentation. Comput. Electr. Eng. 2018, 70, 317–333. [Google Scholar] [CrossRef] [Scilit]
- Zhao, L.; Zheng, S.; Yang, W.; Wei, H.; Huang, X. An image thresholding approach based on Gaussian mixture model. Pattern Anal. Appl. 2019, 22, 75–88. [Google Scholar] [CrossRef] [Scilit]
- Shi, X.; Li, Y.; Zhao, Q. Flexible hierarchical Gaussian mixture model for high-resolution remote sensing image segmentation. Remote Sens. 2020, 12, 1219. [Google Scholar] [CrossRef] [Scilit]
- Otsu, N. A Threshold Selection Method from Gray-Level Histograms. IEEE Trans. Syst. Man Cybern. 1979, 9, 62–66. [Google Scholar] [CrossRef] [Scilit]
- Munoz-Minjares, J.; Vite-Chavez, O.; Flores-Troncoso, J.; Cruz-Duarte, J.M. Alternative thresholding technique for image segmentation based on Cuckoo search and generalized Gaussians. Mathematics 2021, 9, 2287. [Google Scholar] [CrossRef] [Scilit]
- Jia, H. Design of fruit fly optimization algorithm based on Gaussian distribution and its application to image processing. Syst. Soft Comput. 2024, 6, 200090. [Google Scholar] [CrossRef] [Scilit]
- Salhi, A.; Ayadi, M.; Aldosari, F.M.; Algarni, F.; Ismail, A.; Emam, M.M. Multilevel thresholding segmentation of medical images using the Crested Porcupine Optimizer with enhanced solution quality and Gaussian distribution: Applications to liver, COVID-19, and brain diseases. Biomed. Signal Process. Control 2026, 113, 108847. [Google Scholar] [CrossRef] [Scilit]
- Peel, D.; McLachlan, G.J. Robust mixture modelling using the t distribution. Stat. Comput. 2000, 10, 339–348. [Google Scholar] [CrossRef] [Scilit]
- Sfikas, G.; Nikou, C.; Galatsanos, N. Robust image segmentation with mixtures of Student’s t-distributions. In Proceedings of the 2007 IEEE International Conference on Image Processing (ICIP), San Antonio, TX, USA, 16–19 September 2007; pp. I-273–I-276. [Google Scholar] [CrossRef] [Scilit]
- Zhang, J.; Zhang, G.; Kong, M.; Zhang, T. SCGJO: A hybrid golden jackal optimization with a sine cosine algorithm for tackling multilevel thresholding image segmentation. Multimed. Tools Appl. 2024, 83, 7681–7719. [Google Scholar] [CrossRef] [Scilit]
- Horé, A.; Ziou, D. Image Quality Metrics: PSNR vs. SSIM. In Proceedings of the 2010 20th International Conference on Pattern Recognition, Istanbul, Turkey, 23–26 August 2010; IEEE: Piscataway, NJ, USA, 2010; pp. 2366–2369. [Google Scholar] [CrossRef] [Scilit]
- AI-Najjar, Y.A.Y.; Soong, D.C. Comparison of image quality assessment: PSNR, HVS, SSIM, UIQI. Int. J. Sci. Eng. Res. 2012, 3, 1–5. Available online: https://www.researchgate.net/publication/303517356_Comparison_of_image_quality_assessment_PSNR_HVS_SSIM_UIQI (accessed on 14 September 2026).
- Wang, Z.; Bovik, A.C.; Sheikh, H.R.; Simoncelli, E.P. Image Quality Assessment: From Error Visibility to Structural Similarity. IEEE Trans. Image Process. 2004, 13, 600–612. [Google Scholar] [CrossRef] [Scilit] [PubMed]
- Zhang, L.; Zhang, L.; Mou, X.; Zhang, D. FSIM: A feature similarity index for image quality assessment. IEEE Trans. Image Process 2011, 20, 2378–2386. [Google Scholar] [CrossRef] [Scilit] [PubMed]
- Dubuisson, M.P.; Jain, A.K. A Modified Hausdorff Distance for Object Matching. In Proceedings of the 12th International Conference on Pattern Recognition, Jerusalem, Israel, 9–13 October 1994; IEEE: Piscataway, NJ, USA, 1994; pp. 566–568. [Google Scholar] [CrossRef] [Scilit]
- Zhang, K.; He, M.; Dong, L.; Ou, C. The application of Tsallis entropy based self-adaptive algorithm for multi-threshold image segmentation. Entropy 2024, 26, 777. [Google Scholar] [CrossRef] [Scilit] [PubMed]
- Sahoo, P.K.; Arora, G. Image thresholding using two-dimensional Tsallis–Havrda–Charvát entropy. Pattern Recognit. Lett. 2006, 27, 520–528. [Google Scholar] [CrossRef] [Scilit]
- Lin, Q.; Ou, C. Tsallis entropy and the long-range correlation in image thresholding. Signal Process. 2012, 92, 2931–2939. [Google Scholar] [CrossRef] [Scilit]
- Das, V.; Puhan, N.B. Tsallis entropy and sparse reconstructive dictionary learning for exudate detection in diabetic retinopathy. J. Med. Imaging 2017, 4, 024002. [Google Scholar] [CrossRef] [Scilit] [PubMed]

Disclaimer/Publisher’s Note: The statements, opinions and data contained in all publications are solely those of the individual author(s) and contributor(s) and not of MDPI and/or the editor(s). MDPI and/or the editor(s) disclaim responsibility for any injury to people or property resulting from any ideas, methods, instructions or products referred to in the content. |
© 2026 by the authors. Licensee MDPI, Basel, Switzerland. This article is an open access article distributed under the terms and conditions of the Creative Commons Attribution (CC BY) license.