


Abstract
The National E-Commerce Demonstration City (NEDC) program provides a quasi-natural experiment for assessing whether e-commerce-oriented place-based policies improve urban green productivity. Using a balanced panel of 298 Chinese cities from 2007 to 2023, this study measures green total factor productivity (GTFP) with a global frontier SBM-EFF-ML index and exploits the program’s staggered rollout in a difference-in-differences framework. NEDC designation increases GTFP by 0.0293 index units, equivalent to approximately 12.2% of the sample mean. The result is robust to event-study and placebo tests, an alternative GTFP measure, controls for concurrent national pilot policies, entropy balancing, and estimators that accommodate heterogeneous treatment effects. Channel tests provide evidence consistent with information service agglomeration and improved e-commerce logistics; the evidence for digital-payment facilitation is positive but weaker. Pooled interaction models further identify significant differences across comprehensive economic regions and city administrative levels, although the latter result is exploratory. These findings suggest that e-commerce demonstration policies can support greener urban growth when accompanied by specialized digital services, efficient circulation systems, and adequate local administrative capacity.
1. Introduction
China’s economy has shifted from rapid expansion toward higher-quality development, with ecological sustainability becoming a central policy objective. The 2020 commitments to peak carbon emissions and achieve carbon neutrality placed carbon constraints at the center of the national development strategy. Against this background, growth models driven primarily by additional factor inputs are increasingly constrained by resource scarcity and environmental limits. China therefore needs new sources of economic dynamism and a development path that reconciles productivity growth with environmental protection.
Digital technologies and artificial intelligence are reshaping production, distribution, and consumption. Jiang and Li [1] show that digital transformation changes how firms organize transactions and allocate resources. E-commerce is particularly relevant from a policy perspective because it reorganizes the flow of goods, accelerates the matching of supply and demand, and reshapes local industrial ecosystems. This development raises a central question: Can e-commerce expansion promote greener urban development while sustaining economic activity?
This question is theoretically and practically important, yet comprehensive causal evidence remains limited. The staggered rollout of the NEDC program provides a useful quasi-natural experiment. Three official batches designated 70 demonstration cities nationwide, creating variation in treatment timing that can be used to estimate how e-commerce-oriented policy affects urban GTFP [2].
From a practical standpoint, cities concentrate much of China’s population, industrial activity, energy use, and transportation demand [3]. Improving urban environmental efficiency is therefore central to achieving national climate objectives. NEDC designation may affect urban environmental outcomes by encouraging digital service investment, new commercial practices, and the reorganization of local production and circulation systems [4]. The expected effect is nevertheless ambiguous. E-commerce can reduce search costs, improve supply-demand matching, and support more precise production decisions, thereby lowering resource use and undesirable outputs for a given level of production.
By lowering search costs, electronic marketplaces can improve matching and reduce transaction frictions [5]. These efficiency gains may reduce resource use and pollutant emissions for a given level of output. Conversely, expanding logistics and distribution networks may increase transport emissions, while easier access to online consumption may stimulate additional demand and create a rebound effect that offsets some environmental gains from digitalization [6]. Determining the net effect and the conditions and channels through which it arises therefore requires careful empirical analysis. This study uses the NEDC program to assess the relationship between e-commerce-oriented development and urban GTFP and to examine the underlying transmission channels.
Existing research provides mixed evidence on the relationship between the digital economy and the environment. Some studies find that digital development reduces pollutant emissions by improving resource allocation and technological efficiency [7], whereas others emphasize the energy and material demands associated with digital infrastructure and consumption expansion [8]. Much of this literature treats the digital economy as an aggregate concept and relies on broad measures such as internet penetration or digital-finance indices. Less attention has been paid to e-commerce as a specific policy-supported commercial system or to its productivity effects under joint resource and environmental constraints.
Building on the literature on the environmental consequences of e-commerce development, this study makes three contributions. First, it provides updated and extended evidence on the environmental-productivity effects of the NEDC policy while distinguishing its focus from closely related studies. Liu et al. [2] examine the policy’s air-purification effect and emphasize industrial upgrading and lower energy intensity, whereas Liu et al. [9] investigate urban green and high-quality development through industrial upgrading, economic agglomeration, and transaction-cost reduction. Cao et al. [10] provide more directly related evidence on urban GTFP using 230 cities and a sample ending in 2017. In comparison, the present study uses 298 Chinese cities from 2007 to 2023, incorporates the later policy cohort, and provides a longer post-treatment period in which to assess whether the policy effect persists as e-commerce infrastructure and business ecosystems mature.
Second, the study strengthens the empirical evaluation of the policy by combining an environmentally adjusted measure of urban productivity with the staggered implementation of the NEDC program. GTFP is calculated using the non-oriented global-frontier SBM-EFF-ML approach, which simultaneously accounts for input slack, desirable output, and undesirable outputs while maintaining comparability across cities and years. To address non-random policy selection, the analysis applies entropy balancing to pre-policy city characteristics and a doubly robust inverse-probability-weighted DID estimator. It also implements the heterogeneous-treatment-robust estimators proposed by Callaway and Sant’Anna [11], Sun and Abraham [12], and de Chaisemartin and D’Haultfoeuille [13], together with a Goodman-Bacon [14] decomposition. This combined approach evaluates both selection on observables and bias arising from heterogeneous treatment effects and forbidden comparisons.
Third, the theoretical contribution of this study lies in conceptualizing the NEDC policy not merely as another digital-policy shock, but as a bundled place-based intervention that simultaneously expands the supply of specialized digital services, reorganizes e-commerce logistics and circulation, and strengthens digital payment and settlement infrastructure. Whereas earlier research has mainly focused on industrial-structure upgrading, energy-intensity reduction, economic agglomeration, and transaction-cost reduction, this study investigates information service agglomeration, e-commerce logistics efficiency, and digital-payment facilitation as three complementary channels. It further examines whether policy effects vary across the eight comprehensive economic regions and by city administrative status. This framework helps explain why the environmental-productivity effects of e-commerce-oriented policies may differ from those of general digital-infrastructure or smart-city programs.
The empirical investigation yields three principal conclusions. First, designation as a National E-commerce Demonstration City increases urban GTFP. The baseline estimate is approximately 0.0293. The entropy-balanced DID estimate is 0.0330, and the Callaway-Sant’Anna doubly robust overall ATT is 0.0327; both are statistically significant. The Sun-Abraham average post-treatment effect is similar in magnitude and remains statistically significant, while the de Chaisemartin-D’Haultfoeuille dynamic estimates are less precise. The Goodman-Bacon decomposition indicates that already-treated comparison groups receive only a small weight. Second, the two-step channel analysis provides evidence consistent with information service agglomeration, e-commerce logistics and circulation, and digital-payment facilitation. Third, pooled interaction models and formal Wald tests identify statistically significant coefficient differences across the eight comprehensive economic regions and by city administrative status.
This study employs panel data covering 298 cities at the prefecture level and above from 2007 to 2023. The primary explanatory variable is a time-varying indicator for NEDC designation. Baseline regressions include industrial composition, market demand, educational attainment, and transportation infrastructure, together with city and year fixed effects. Robustness analysis combines placebo and alternative-variable tests with controls for overlapping Broadband China, Smart City, Low-Carbon City, and Big Data pilot policies, pre-policy entropy balancing, doubly robust inverse-probability weighting, the Callaway-Sant’Anna, Sun-Abraham, and de Chaisemartin-D’Haultfoeuille estimators, and a Goodman-Bacon decomposition. The analysis then examines potential transmission mechanisms and formally tests coefficient differences across city groups.
The remainder of the paper is organized as follows. Section 2 reviews the literature and develops the theoretical framework and hypotheses. Section 3 describes the variables, empirical specification, and data. Section 4 reports the baseline and robustness results. Section 5 examines potential channels and heterogeneous effects. Section 6 presents the conclusions, policy implications, and limitations.
2. Literature Review
2.1. Determinants of GTFP
2.1.1. Institutional and Techno-Economic Determinants of GTFP
GTFP extends conventional productivity analysis by incorporating resource use and undesirable environmental outputs. The literature generally attributes variation in GTFP to institutional arrangements and techno-economic conditions.
Environmental governance is among the most widely studied institutional determinants of GTFP. The Porter hypothesis holds that well-designed regulation can induce innovation that offsets compliance costs and improves both environmental and economic performance [15]. Empirical evidence is mixed, however. Some studies find that environmental regulation raises GTFP but that the effect depends on threshold conditions and varies across regions [16]. Other evidence suggests that regulation may reduce productivity once its stringency exceeds a certain level, producing an inverted U-shaped relationship [17]. Market-oriented reform is another important institutional determinant because more effective price signals, competition, and factor mobility can improve resource allocation.
Price signals, competitive pressure, and factor mobility can improve resource allocation and thereby enhance environmental performance [18]. The composition of local public expenditure and the orientation of industrial policy also influence a city’s path toward sustainable development. Fiscal policies that prioritize productive infrastructure may raise output in the short run, but economic expansion may worsen environmental outcomes if ecological governance and public services are underfunded [19].
From a techno-economic perspective, the relationship between foreign investment and GTFP has been widely examined. The pollution-halo hypothesis suggests that multinational corporations introduce advanced production techniques, managerial expertise, and higher environmental standards, thereby improving local firms through demonstration, competition, and supply-chain linkages [20]. Conversely, the pollution-haven hypothesis holds that firms may relocate pollution-intensive activities to jurisdictions with less stringent environmental regulation [21].
2.1.2. Environmental Effects of E-Commerce
The rapid diffusion of digital technologies has intensified scholarly interest in their environmental consequences. This literature offers two broad perspectives: one emphasizes potential environmental benefits, while the other highlights the ecological costs of digital expansion.
The first perspective identifies several channels through which the digital economy may improve environmental outcomes. Internet technologies and digital platforms reduce information-search and transaction costs, allowing supply and demand to be matched more accurately and limiting resource waste and excess inventories caused by information gaps [22]. Platform-based and sharing-economy models may also increase the utilization of underused assets and reduce the need for additional production [23]. In industrial settings, Internet-of-Things monitoring, intelligent management systems, and data analytics enable firms to track energy use and pollutant emissions more precisely. This information supports real-time process adjustments that can reduce energy consumption and emissions per unit of output [24].
Studies emphasizing adverse effects caution that the ecological burdens of digital economic activity should not be overlooked. First, the construction and operation of data centers, 5G facilities, and telecommunication networks require substantial electricity and material inputs, so efficiency gains must be weighed against infrastructure-related consumption. Second, the expansion of online commerce increases parcel delivery and packaging demand, which can create additional material waste and transport emissions [25].
Research on e-commerce has expanded from conventional economic outcomes, including growth, employment, income distribution, and regional linkages, to environmental and green-development effects. Several studies use the NEDC program as a quasi-natural experiment. Cao et al. [10] find that the program improves urban GTFP through greater attention to environmental governance, industrial upgrading, energy efficiency, and technological innovation. Liu et al. [9] emphasize industrial upgrading, economic agglomeration, and lower transaction costs, whereas Liu et al. [2] focus on air-pollution reduction through industrial upgrading and lower energy intensity. The present study extends this literature by analyzing 298 cities over 2007–2023, applying modern staggered-DID estimators, examining three channels directly related to e-commerce operations (information service agglomeration, parcel and postal logistics, and digital payments), and formally testing heterogeneity across comprehensive economic regions and administrative levels.
2.2. Theoretical Framework and Hypothesis Development
The NEDC policy is a place-based digital-development initiative that combines investment in digital infrastructure, institutional support for e-commerce, the cultivation of platform-based business models, and improvements in the local business environment. Its influence on urban GTFP can be understood within a unified theoretical framework. On the one hand, the policy may directly improve the efficiency with which cities transform labor, capital, and energy inputs into economic output while reducing undesirable environmental outputs. On the other hand, it may create favorable conditions for green-productivity growth by attracting specialized information service activities, improving logistics and circulation efficiency, and reducing payment and settlement frictions. Accordingly, this section first examines the overall policy effect and then develops hypotheses concerning these three transmission channels (Figure 1).
Figure 1.
Technical roadmap. Notes: Red dotted arrows denote the three transmission channels (information service agglomeration, e-commerce logistics and circulation, and digital payment facilitation).
2.2.1. Overall Effect of the NEDC Policy on Urban GTFP
GTFP measures economic productivity under joint resource and environmental constraints. An improvement in GTFP can arise from more efficient factor allocation, technological progress, reductions in resource consumption, or decreases in undesirable outputs for a given level of desirable output. The NEDC policy may affect each of these dimensions.
First, e-commerce platforms reduce information asymmetry between producers, suppliers, and consumers. By allowing market participants to obtain demand and price information more rapidly, the policy facilitates more accurate matching between supply and demand and reduces the inefficient use of productive resources. Second, the construction of digital infrastructure and logistics service systems improves coordination across production, circulation, and consumption. Firms can adjust production schedules, inventories, procurement, and transportation arrangements more efficiently, thereby reducing excessive input use and unnecessary emissions. Third, the institutional support associated with demonstration-city designation may encourage the adoption of digital technologies, stimulate new business models, and accelerate the transformation of traditional industries. These changes can improve production efficiency and facilitate the diffusion of cleaner technologies. Related firm-level evidence from China further shows that industrial robot adoption affects innovation performance through changes in labor and capital misallocation, with nonlinear and heterogeneous effects [26].
The environmental consequences of e-commerce are not necessarily positive. Expanding online consumption, packaging, logistics, and data infrastructure may increase energy use and emissions. The NEDC program, however, does more than increase online transaction volumes: it also promotes infrastructure upgrading, institutional coordination, digital governance, and the integration of digital technologies with traditional industries. These complementary measures may strengthen the resource-allocation and technological benefits of digitalization and offset some environmental costs of e-commerce expansion. Existing evidence indicates that e-commerce city pilots can improve urban green productivity and environmental performance [2,9,10]. The program’s net effect is therefore expected to be positive.
H1.
The implementation of the NEDC policy significantly improves urban GTFP.
2.2.2. Information Service Agglomeration Channel
The first transmission channel operates through the agglomeration of information transmission, computer services, and software activities. E-commerce firms depend on specialized providers of platform operation, data processing, software development, cybersecurity, cloud services, and digital marketing. When these providers and skilled workers cluster locally, firms can acquire digital solutions more quickly and at lower cost, while repeated interactions facilitate knowledge spillovers and the adaptation of technologies to local production conditions.
Digital technologies reduce search, replication, transportation, tracking, and verification costs, thereby altering how firms organize transactions and production [27]. A denser information service sector also lowers the fixed cost of digital adoption for conventional firms and improves access to real-time information on orders, inventories, energy consumption, and supply-chain conditions. These capabilities support more accurate demand forecasting and resource allocation, reducing idle capacity, excessive inventories, and unnecessary intermediate inputs [1].
The environmental contribution of information service agglomeration arises when specialized digital inputs are embedded in production and environmental management. Data-based monitoring and software-supported process control can improve energy efficiency, facilitate cleaner production, and reduce corporate carbon emissions [28]. At the city level, employment density in information transmission, computer services, and software therefore captures the local supply of specialized digital capabilities more directly than the number of communication-device users.
The NEDC policy creates concentrated demand for platform development, data services, software maintenance, and digital business solutions. Demonstration-city support can attract specialized service firms and workers, improve matching between digital suppliers and local enterprises, and accelerate the diffusion of digital management tools. These changes provide a plausible route from policy designation to more efficient and environmentally sustainable urban production. On this basis, the following hypothesis is proposed:
H2.
The NEDC policy improves urban GTFP through the information service agglomeration channel by expanding the local supply of specialized digital services and lowering technology-adoption and coordination costs.
2.2.3. E-Commerce Logistics and Circulation Channel
The second transmission channel operates through e-commerce logistics and circulation. Online transactions do not eliminate geographic and delivery costs; distance and trade frictions continue to influence online market activity [29]. The environmental and productivity effects of e-commerce therefore depend on whether cities develop sufficiently dense, coordinated, and technologically capable parcel, postal, warehousing, and last-mile delivery systems.
A stronger e-commerce logistics system can consolidate shipments, shorten delivery times, reduce inventory holding, and improve matching between warehouse locations, delivery routes, and customer demand. Digital tracking and route optimization can reduce empty running and repeated delivery attempts, while more efficient circulation reduces spoilage and unnecessary use of storage and packaging. These improvements raise desirable output relative to labor, capital, energy, and transportation inputs.
The environmental effect is nevertheless not automatic: fragmented last-mile deliveries and excessive packaging can increase emissions and material use [25]. The relevant mechanism is therefore the improvement of logistics service capacity and coordination rather than a mechanical expansion of freight activity. Postal business revenue per capita captures the intensity of parcel and postal circulation associated with e-commerce and remains conceptually distinct from aggregate freight volume, which is retained as a baseline control.
NEDC designation can encourage investment in logistics hubs, parcel networks, warehousing information systems, and last-mile delivery services. When supported by smart transportation and cleaner distribution technologies, these changes can improve circulation efficiency and reduce the energy and emission intensity of urban distribution [30]. Accordingly, the following hypothesis is proposed:
H3.
The NEDC policy improves urban GTFP through the e-commerce logistics and circulation channel by strengthening parcel service capacity and improving inventory, routing, and distribution efficiency.
2.2.4. Digital Payment Facilitation Channel
The third transmission channel concerns digital payment facilitation. Payment and settlement frictions can prevent otherwise viable transactions, especially when buyers and sellers are geographically separated or when small firms lack access to conventional financial services. Digital payment systems integrate ordering, settlement, transaction records, and customer verification, thereby reducing the time and monetary costs of completing e-commerce transactions.
Lower payment costs expand the effective market available to firms and make small-value, high-frequency transactions more feasible. Digital transaction records can also improve traceability, reduce information asymmetry, and support access to complementary financial services. Evidence on digital financial services shows that reducing the distance and cost of accessing accounts increases financial activity and inclusion [31]. For e-commerce firms, these gains can improve cash-flow management, inventory turnover, and the allocation of working capital.
More efficient payments do not directly guarantee greener production, but they strengthen the transactional foundation on which digital coordination and platform-based resource allocation operate. The digital-payment sub-index of the Peking University Digital Financial Inclusion Index measures the local development of digital payment services within a multidimensional and widely used city-level framework [32]. It is therefore a more specific proxy for the transaction-facilitation function of e-commerce than an aggregate measure of financial openness.
By promoting online platforms, merchant digitalization, interoperable transaction services, and supporting business infrastructure, the NEDC policy may accelerate the adoption and use of digital payments. Reduced settlement frictions and improved transaction traceability can facilitate market matching and more responsive production decisions, thereby supporting improvements in resource-allocation efficiency. Based on this reasoning, the following hypothesis is proposed:
H4.
The NEDC policy improves urban GTFP through the digital-payment facilitation channel by lowering payment and settlement frictions and improving transaction traceability and market access.
3. Variables and Model
3.1. Variable Selection and Measurement
3.1.1. Dependent Variable: GTFP
We select GTFP as the dependent variable because it captures the quality of economic growth while accounting for resource constraints and environmental pressures. Unlike traditional TFP, which primarily evaluates the efficiency with which inputs are transformed into desirable outputs, GTFP simultaneously incorporates energy consumption and undesirable environmental outputs. Following Chung et al. [33], Tone [34], and Oh [35], this study measures urban GTFP using a non-oriented global-frontier slack-based measure-Malmquist–Luenberger (SBM-EFF-ML) index. This approach has three advantages. First, the SBM framework explicitly accounts for input and output slacks, thereby relaxing the proportional-adjustment assumption imposed by radial DEA models. Second, the Malmquist–Luenberger index evaluates productivity changes while simultaneously considering desirable and undesirable outputs. Third, the use of a global production frontier provides a common benchmark across cities and years, thereby improving intertemporal comparability and avoiding potentially infeasible solutions and spurious technological regress associated with sequential frontiers. These properties make the SBM-EFF-ML index particularly suitable for evaluating the effects of the NEDC policy on urban green productivity.
The urban production possibility set comprises three inputs, one desirable output, and three undesirable outputs. Labor input is measured by the year-end number of employees in urban work units, capital input by the estimated capital stock, and energy input by total electricity consumption. Real urban GDP is used as the desirable output. Industrial wastewater discharge, industrial sulfur dioxide emissions, and industrial smoke and dust emissions are included as undesirable outputs to capture the environmental costs of urban production. Based on these indicators, annual city-level GTFP is calculated using MaxDEA software (version 5.2) under a non-oriented SBM-EFF-ML model with variable returns to scale.
3.1.2. Explanatory Variable: NEDC
The core explanatory variable is NEDC, which represents a municipal-level pilot program jointly promoted by central government agencies to explore e-commerce development models suited to China’s institutional context. The program was introduced in three official batches: 23 cities were designated in 2011, 30 in 2014, and 17 in 2017. In total, the three batches cover 70 demonstration cities across 28 provincial-level regions.
The program’s batch-based rollout creates a staggered difference-in-differences setting. NEDC is therefore defined as a time-varying indicator equal to one for city i from its designation year onward, and zero otherwise. For cities that are never designated during the sample period, NEDC remains zero in every year. The coefficient on this variable captures the average change in GTFP associated with NEDC designation, conditional on the controls and fixed effects described below.
3.1.3. Control Variables
To reduce omitted-variable bias, the baseline model includes city-level characteristics that may be related to both NEDC selection and GTFP. The controls cover four dimensions.
(1) Industrial structure. Industrial composition is an important determinant of urban GTFP. Compared with manufacturing, services are generally less energy intensive and more knowledge intensive, so a larger service sector may facilitate information-technology diffusion, the concentration of innovative factors, and the adoption of cleaner production methods [36]. We therefore measure industrial structure as the share of tertiary-industry value added in GDP.
(2) Market demand. The scale and composition of consumer demand affect production efficiency through market size and demand-structure channels. A larger market can support specialization and economies of scale, thereby reducing factor inputs per unit of output [37]. Greener consumption patterns may also encourage producers to adopt cleaner methods. We use total retail sales of consumer goods to measure market demand.
(3) Human capital. A skilled workforce supports technological progress and knowledge diffusion and shapes a city’s capacity to absorb, replicate, and improve new technologies [38]. Greater human capital accumulation may also strengthen firms’ environmental management and clean technology capabilities. Human capital is measured by the number of university students per 10,000 residents.
(4) Transportation activity. Freight transportation is both a component of economic activity and an important source of energy use and emissions. Higher freight volumes may intensify congestion and pollution, but they also reflect the scale of urban production and circulation [30]. We therefore control for total freight volume.
3.2. Model Specification
The designation of NEDCs provides a quasi-natural experiment for estimating the green-productivity effect of e-commerce policy, but designation was not random, and the program was implemented in three cohorts. We therefore treat the staggered two-way fixed effects DID with city and year fixed effects as the benchmark. Section 4.3.5 controls for four overlapping national policy families that vary across cities and years. Entropy balancing of 2007–2011 city characteristics is used in Section 4.3.6 to address selection on observables. Section 4.3.7 complements TWFE with the doubly robust group-time estimator of Callaway and Sant’Anna [11], the interaction-weighted estimator of Sun and Abraham [12], the dynamic estimator of de Chaisemartin and D’Haultfoeuille [13], and a Goodman-Bacon decomposition. These procedures address distinct concerns arising from concurrent policies, non-random designation, treatment-effect heterogeneity, and comparisons that use already-treated cities as controls.
The baseline specification includes the control variables described above and city and year fixed effects. The regression is specified as follows:
In Equation (1), GTFPi,t is green total factor productivity in city i and year t, and NEDCi,t indicates whether the city has been designated by year t. Ci,t is a vector of time-varying city-level controls. City fixed effects, represented by μi, absorb time-invariant characteristics such as geographic location, natural-resource endowments, and historical or cultural attributes. Year fixed effects, λt, absorb shocks common to all cities, including national business cycles, policy changes, and technological trends. The coefficient α1 is the parameter of interest, β is the vector of control-variable coefficients, and εi,t is the error term. Standard errors are clustered at the city level to allow for heteroskedasticity and serial correlation within cities.
3.3. Data Sources
The initial sample covers Chinese prefecture-level cities and above from 2007 to 2023. Cities were retained when the information required to construct GTFP and the principal explanatory and control variables was available. The treatment group was identified from the official approval documents and designation announcements for the three NEDC batches. Of the 70 officially designated cities, 68 are included in the final estimation sample; two are excluded because the data required to construct the complete city panel are unavailable. The final sample therefore contains 68 treated and 230 never-treated cities. For each treated city, NEDC equals one from its effective treatment year onward and zero beforehand.
Data used to calculate GTFP, including employment, electricity consumption, fixed-asset investment, real gross regional product, industrial smoke and dust emissions, industrial wastewater discharge, and industrial sulfur dioxide emissions, were primarily obtained from the China City Statistical Yearbook and the statistical yearbooks of the relevant provinces and municipalities. Nominal variables were converted into real terms using the fixed-asset investment price index and GDP deflator obtained from the China Statistical Yearbook. Occasional gaps in the explanatory and control variables were filled using linear interpolation, whereas city-year observations with extensive missing information, particularly those lacking the data required to calculate GTFP, were excluded rather than interpolated. The resulting balanced panel contains 298 cities and 5066 city-year observations over the 2007–2023 period. The descriptive statistics for the final estimation sample are reported in Table 1.
Table 1.
Descriptive statistics.
4. Empirical Results
4.1. Parallel-Trends Test
To assess the parallel-trends assumption, we estimate a conventional TWFE event-study model. Event time −1, the year immediately preceding NEDC designation, is the omitted reference period. To preserve precision where event-time support is sparse, periods at t ≤ −5 and t ≥ 5 are grouped into endpoint bins, while event times −4 to −2 and 0 to 4 are entered separately. The model includes the baseline controls and city and year fixed effects, with standard errors clustered at the city level. Figure 2 reports the estimated coefficients and 95% confidence intervals.
Figure 2.
Parallel trends test for the effect of the NEDC policy on urban GTFP. Notes: The solid line denotes point estimates, and dotted lines denote 95% confidence intervals.
Figure 2 shows the evolution of GTFP around NEDC designation. Before implementation, the confidence intervals for all reported event-time coefficients include zero. The point estimate for the t ≤ −5 endpoint bin is positive but small and statistically insignificant (coefficient = 0.0089, SE = 0.0168, p = 0.596). A joint F-test of the pre-treatment coefficients at t ≤ −5, −4, −3, and −2 yields F(4, 297) = 1.828 and p = 0.123. We therefore cannot reject the null that these coefficients are jointly zero, which supports the parallel trends assumption. After designation, the coefficients become positive and generally increase over event time, consistent with an effect that develops as digital infrastructure, e-commerce ecosystems, and demonstration effects mature.
4.2. Baseline Regression
Table 2 presents the core regression results. Column (1) incorporates only city and year fixed effects. Column (2) further introduces four city-level control variables: industrial structure (Ind), market demand (Mar), human capital (Stu), and transportation infrastructure (Fre).
Table 2.
Baseline regression results.
The coefficient on the NEDC variable is positive and statistically significant in both model specifications. In the preferred specification reported in column (2), the estimated coefficient is 0.0293, indicating that NEDC designation increases urban GTFP by approximately 0.0293 index units relative to non-designated cities, holding the other variables and fixed effects constant. Given that the sample mean of GTFP is 0.241, the estimated effect is equivalent to approximately 12.2% of the sample mean. This magnitude suggests that the policy effect is not only statistically significant but also economically meaningful. The results therefore provide support for H1.
4.3. Robustness Tests
4.3.1. Placebo Test
Although the event-study evidence supports the parallel trends assumption, the baseline estimate could still reflect chance correlations. We therefore conduct a placebo test. If the estimated effect is generated by the actual NEDC program rather than random treatment assignment, placebo treatments should generally produce coefficients centered near zero. We randomly reassign treatment status 500 times and re-estimate the baseline model in each iteration. Figure 3 plots the resulting pseudo-treatment coefficients and p-values.
Figure 3.
Placebo test for the effect of the NEDC policy on urban GTFP.
The horizontal axis displays the pseudo-treatment coefficient, with the left vertical axis representing kernel density and the right vertical axis showing the p-value. A solid vertical line indicates the actual NEDC estimate of 0.0293, and a horizontal dashed line marks the 10% significance level.
The placebo coefficients are concentrated near zero and are approximately symmetric, and most corresponding p-values exceed 0.1. The actual DID estimate lies well outside the center of the placebo distribution. These results reduce concern that the baseline finding is a product of random treatment assignment, although a placebo exercise cannot rule out all forms of omitted-variable bias.
4.3.2. Replacing the Dependent Variable
We first examine whether the results depend on the method used to measure GTFP. The baseline analysis uses the SBM-EFF-ML index, which incorporates undesirable outputs and allows for non-radial input-output inefficiency. As an alternative, we construct GTFP_EBM using a global Malmquist-Luenberger index based on the EBM hybrid distance function. EBM combines radial and non-radial features: it retains proportional adjustment while accounting for slack-based inefficiency.
Column (1) of Table 3 reports the results obtained using GTFP_EBM, following Tone and Tsutsui [39], as the alternative dependent variable. The estimated coefficient on NEDC remains positive and statistically significant at the 1% level, indicating that the main conclusion is robust to the alternative productivity measure. Because SBM-EFF-ML and EBM characterize production inefficiency differently, the resulting indices differ in their scales and variance structures. Their raw coefficients and overall goodness-of-fit statistics are therefore not directly comparable. In particular, GTFP_EBM exhibits substantially less within-city variation and a stronger persistent city-specific component. Consequently, the city fixed effects absorb a larger proportion of its total variation, producing a considerably higher adjusted R-squared.
Table 3.
Robustness tests: alternative dependent variable, alternative control variable, and pre-policy innovation capacity.
4.3.3. Replacing Control Variables
We next examine whether the results are sensitive to the choice of industrial structure control. In the baseline model, industrial structure is proxied by the tertiary sector share. A higher share of services typically implies a more knowledge-intensive and less energy-intensive urban economy, which may support GTFP. As an alternative, we replace this measure with the secondary sector share, which captures the degree of industrialization and manufacturing concentration. Since manufacturing is a major source of energy use and pollution, this alternative variable provides a contrasting representation of industrial structure and offers a stricter robustness check.
Column (2) of Table 3 shows that replacing the tertiary sector share with the secondary sector share yields an NEDC coefficient of 0.0289, which remains significant at the 1% level and is close to the baseline estimate of 0.0293. As expected, the coefficient on the secondary sector share is negative, consistent with the greater environmental burden of manufacturing-intensive urban economies. The signs of the remaining controls and the adjusted R-squared are similar to those in the baseline model. The main result is therefore not driven by the specific measure of industrial structure.
4.3.4. Controlling for Pre-Policy Innovation Capacity
The contemporaneous number of invention patents granted may respond to the NEDC policy and would therefore be a post-treatment control. We consequently remove contemporaneous patent output from this robustness specification. Initial innovation capacity is instead measured by the city-level average of ln(1 + invention patents granted) over 2007–2011, before policy exposure begins in the estimation period. Because this pre-policy measure is time-invariant and absorbed by city fixed effects, it is interacted with a centered linear time trend. This allows cities with different initial innovation capacity to follow different underlying trajectories without conditioning on innovation outcomes that may have been affected by the policy.
As a complementary sensitivity check, we replace the contemporaneous patent measure with the one-year lag of ln(1 + invention patents granted). Although a lagged measure cannot eliminate every concern when policy effects persist over time, it avoids conditioning on current-period patent output and provides a direct comparison with the original specification. All models retain the baseline controls, city fixed effects, year fixed effects, and city-clustered standard errors.
Column (3) of Table 3 reports the specification based exclusively on pre-policy innovation information. After allowing the 2007–2011 average innovation capacity to generate a differential linear trend, the NEDC coefficient remains positive at 0.0207 and is statistically significant at the 10% level. Its magnitude is smaller than the baseline estimate of 0.0293, indicating that pre-existing innovation-related trends explain part, but not all, of the estimated policy effect. Column (4) reports the lagged patent specification. The NEDC coefficient is 0.0294 and remains statistically significant at the 1% level. Because lagging reduces the sample to 4768 observations, we also re-estimate the baseline model on the same sample; the resulting coefficient is 0.0297. The near equality of these two estimates indicates that neither the lagged innovation control nor the associated sample change drives the main finding. Taken together, the revised tests avoid conditioning on contemporaneous patent output and continue to support a positive effect of the NEDC policy on urban GTFP.
4.3.5. Controlling for Concurrent National Pilot Policies
Several national place-based initiatives overlapped with NEDC designation in both time and space and may independently affect urban GTFP. We therefore construct four additional city-year indicators from official pilot announcements: Broadband China demonstration cities (2014, 2015, and 2016 batches), National Smart City pilots (the first two batches in 2013 and the third formally announced in 2015), Low-Carbon Province and City pilots (2010, 2012, and 2017 batches), and National Big Data Comprehensive Pilot Zones (approved in 2016). Each indicator equals one from the city’s first approval year onward. Province-level pilots are assigned to all sample cities within the relevant province, and county- or district-level pilots are mapped to their parent prefecture-level city. The official notices and coding rules are documented in the table notes [40,41,42,43].
Adding each concurrent-policy indicator separately leaves the NEDC coefficient between 0.0266 and 0.0300, and it remains statistically significant at the 5% level in every specification. More importantly, the joint specification reported in Panel A of Table 4 includes all four policy indicators together with the original covariates and city and year fixed effects. The NEDC coefficient is 0.0276 (SE = 0.0105, p = 0.009), close to the baseline estimate of 0.0293. Thus, the estimated improvement in GTFP is not explained by differential exposure to these major overlapping national pilot policies.
Table 4.
Concurrent policy, selection-adjusted, and heterogeneous-treatment-robust DID estimates and Goodman-Bacon decomposition.
4.3.6. Endogenous Selection and Covariate Balancing
NEDC designation was not randomly assigned: cities with stronger pre-existing e-commerce activity and administrative capacity may have been more likely to be selected. To address selection on observable characteristics, we implement entropy balancing using city-level information measured before the first designation cohort [44]. The balancing set consists of average GTFP and its linear trend over 2007–2011, pre-policy averages of the four baseline covariates, and three indicators of e-commerce readiness: internet users per capita, mobile-phone subscribers per capita, and postal business revenue per capita. Continuous scale variables are transformed before balancing to limit the influence of highly skewed city-size differences.
The entropy-balancing weights reweight the 230 never-treated cities to reproduce the pre-policy covariate means of the 68 eventually treated cities while retaining all 298 cities. After weighting, the mean absolute standardized mean difference across the nine balancing variables is 0.408%, and the largest standardized difference is 0.676%, both well below the conventional 10% threshold. The effective number of weighted control cities is approximately 22, indicating that the identifying comparison is concentrated among a smaller set of observationally similar controls. We therefore interpret the weighted estimate together with the doubly robust estimator rather than as a stand-alone result.
Panel A of Table 4 reports an entropy-weighted DID coefficient of 0.0330 (SE = 0.0158, p = 0.038) with city and year fixed effects. Because the balancing stage uses only pre-policy information, this specification does not condition on contemporaneous city characteristics that may themselves respond to designation. As a complementary check that retains the original time-varying controls, the Callaway-Sant’Anna estimator is implemented with doubly robust inverse-probability weighting. This estimator combines propensity-score weighting and outcome regression and remains consistent if either working model is correctly specified [45]. Its overall ATT is 0.0327 (SE = 0.0165, p = 0.048), and the joint policy-pre-trend test does not reject zero (p = 0.585). Together, the two estimates reduce concern about selection on observed pre-policy characteristics, but they cannot rule out selection on unobserved factors.
4.3.7. Heterogeneous-Treatment-Robust Staggered DID Estimators
The conventional TWFE estimator can be contaminated under staggered adoption when treatment effects differ across cohorts or event time, because already-treated cities may serve as controls and the resulting weights need not identify a convex average treatment effect [13,14]. We therefore re-estimate the policy effect using three complementary estimators. Callaway and Sant’Anna’s [11] group-time estimator uses never-treated cities as controls and is implemented with the doubly robust inverse-probability-weighted method of Sant’Anna and Zhao [45]. Sun and Abraham’s [12] interaction-weighted event study estimates cohort-specific dynamic effects and then aggregates them using cohort shares. The Sun-Abraham regression includes the full event-time support from −10 to 11, omits event time −1, and reports the common window from −5 to 6. Finally, the de Chaisemartin and D’Haultfoeuille [13] switching group estimator reports effects from event time 0 to 6 and five pre-treatment placebo effects, with standard errors based on 199 city-level block-bootstrap replications.
Panel A of Table 4 presents the concurrent-policy and selection-adjusted average treatment effects. The Callaway-Sant’Anna DRIPW estimate discussed in Section 4.3.6 is close to the benchmark TWFE coefficient. The Sun-Abraham mean effect over event times 0–6 is 0.0332 (SE = 0.0078, p < 0.001). Joint tests over event times −5 to −2 do not reject the policy-pre-trend restrictions for either Callaway-Sant’Anna (p = 0.585) or Sun-Abraham (p = 0.196). Panel B reports the de Chaisemartin-D’Haultfoeuille dynamic estimates. The point estimates become positive at longer horizons, but none is individually significant; all five pre-treatment placebo effects are also insignificant. These results support the positive direction of the main finding while indicating that precision varies across estimators.
Panel C reports the detailed Goodman-Bacon decomposition. Comparisons between treated cohorts and never-treated cities receive 94.42% of the unadjusted decomposition weight. Valid comparisons in which later-treated cities remain untreated receive 2.32%, while forbidden comparisons that use already-treated cohorts as controls receive only 3.26%. The forbidden component contributes −0.0013 to the unadjusted TWFE coefficient, compared with 0.0603 from treated-versus-never-treated comparisons. In the covariate-adjusted decomposition, treated-versus-never-treated comparisons account for 81.33% of the weight, timing group comparisons for 8.29%, and the covariate-related within component for 10.38%. Together with the positive Callaway-Sant’Anna and Sun-Abraham estimates, these results substantially reduce the concern that the positive TWFE estimate is driven by forbidden comparisons. They do not, however, prove that every possible form of treatment-effect heterogeneity is irrelevant (Figure 4).
Figure 4.
Heterogeneous-treatment-robust event-study estimates. Notes: Points are event-time treatment effects, and bars are 95% confidence intervals. Event time −1 is the omitted reference period. Both estimators use never-treated cities as controls and include the baseline covariates. The Sun-Abraham estimator is fitted over the full supported event-time range (−10 to 11); the figure displays the common window from −5 to 6.
5. Extended Analysis
5.1. Mechanism Analysis
The earlier empirical findings show that the NEDC policy significantly enhances urban GTFP. To investigate how the policy may generate this effect, the empirical analysis focuses on the three channels developed in Section 2.2: information service agglomeration, e-commerce logistics and circulation, and digital-payment facilitation. These channels are measured using indicators tied directly to the operation of e-commerce rather than broad proxies for communication access, public cultural resources, or external openness.
The study employs a two-step channel test. The first step verifies that NEDC designation significantly affects GTFP in the sample used for each channel variable. The second step estimates the effect of NEDC designation on the proposed channel variable using the same controls, city fixed effects, year fixed effects, and city-clustered standard errors as the baseline model. A positive and statistically significant policy coefficient, combined with the theoretical link between the channel and GTFP, is interpreted as evidence consistent with the proposed pathway. This procedure does not estimate an indirect effect and should therefore be understood as a channel-consistency test rather than a formal causal-mediation analysis.
The information service agglomeration variable (ISE) is the natural logarithm of one plus employment in information transmission, computer services, and software per 10,000 residents. The logistics and circulation variable (LOG) is the natural logarithm of one plus postal business revenue per capita. Both variables are constructed from the city panel and are available for 2007–2023. The digital payment variable (PAY) is the original-value payment sub-index of the Peking University Digital Financial Inclusion Index. The city-level index covers 2011–2023, so its regression uses the corresponding common sample. None of these channel variables duplicates the baseline controls for industrial structure, retail demand, university students, or freight volume. Table 5 reports the second-step estimates.
Table 5.
Two-step channel tests.
Column (1) reports the information service agglomeration result. The NEDC coefficient is 0.2846 and is statistically significant at the 5% level (p = 0.023). Because the dependent variable is a log-transformed employment-density measure, the result indicates that designation is associated with a meaningful expansion of local employment in information transmission, computer services, and software relative to population. This finding is consistent with the view that the policy attracts specialized digital service capacity and lowers the cost of adopting and applying digital technologies in local production.
Column (2) examines e-commerce logistics and circulation. The coefficient on NEDC is 0.2063 and is significant at the 5% level (p = 0.020), indicating that designation increases postal business revenue per capita. Postal business activity is closely linked to parcel handling and last-mile delivery and is therefore more directly connected to online commerce than aggregate freight volume. The positive estimate is consistent with NEDC designation strengthening parcel service capacity and the logistics infrastructure needed for more efficient inventory, routing, and distribution.
Column (3) presents the digital payment result. In the 2011–2023 common sample, the NEDC coefficient is 4.5157 and is positive at the 10% significance level (p = 0.074). The corresponding first-step policy effect on GTFP remains positive and statistically significant at the 1% level. This evidence suggests that demonstration city designation supports the development of digital payment services, which can reduce settlement frictions, improve transaction traceability, and broaden the range of buyers and sellers able to participate in platform-based commerce. Because the estimate is marginally significant, it is interpreted as suggestive rather than definitive evidence.
Taken together, the policy coefficients for information service employment density and postal business revenue per capita are positive and significant at the 5% level, while the digital payment coefficient is positive at the 10% level. The first-step GTFP effect remains positive and significant in both the full mechanism sample and the shorter digital-payment sample. These estimates provide evidence consistent with the three proposed pathways, but the two-step design does not identify the size of an indirect effect. The digital payment finding also warrants particular caution because it is weaker statistically and is estimated over a shorter period.
Overall, the mechanism estimates show that NEDC designation expands specialized information service employment, strengthens postal and parcel circulation, and is associated with greater development of digital payment services. When considered together with the theoretical analysis of how these factors affect production coordination and resource allocation, the estimates provide channel-consistent evidence for H2–H4. They should not be interpreted as proving causal mediation.
5.2. Heterogeneity Analysis and Formal Coefficient-Difference Tests
The preceding estimates identify a positive average effect of the NEDC policy, but the magnitude may vary with regional economic conditions and city administrative capacity. Statistical significance in one subgroup and insignificance in another do not by themselves establish a coefficient difference. We therefore estimate pooled interaction models and conduct formal Wald tests. The models include the NEDC indicator, its interactions with each classification, the baseline controls, common year fixed effects, city fixed effects, and city-clustered standard errors. The external classification table matches 297 cities in the regression sample; Hainan Tibetan Autonomous Prefecture is unmatched and is excluded from these models. Given the subgroup sizes and the unmatched observation, the heterogeneity evidence is interpreted as exploratory.
5.2.1. Heterogeneity Across Comprehensive Economic Regions
China’s eight comprehensive economic regions capture differences in industrial foundations, market access, openness, infrastructure, and structural-adjustment pressures more finely than the conventional East-Central-West-Northeast division. The classification distinguishes the Northeast, Northern Coastal, Eastern Coastal, Southern Coastal, Middle Yellow River, Middle Yangtze, Southwest, and Northwest regions. Such differences may shape both the capacity to implement the NEDC program and the scope for digital commerce to improve resource allocation and green productivity.
We estimate a pooled model using the Northeast as the reference group and interact NEDC with indicators for the other seven comprehensive economic regions. Group-specific policy effects are recovered as linear combinations of the NEDC coefficient and the relevant interaction. A joint Wald test examines equality of all eight policy coefficients, while the reported interaction tests compare each region with the Northeast. The results are presented in Panel A of Table 6.
Table 6.
Pooled interaction tests of heterogeneous NEDC effects.
The estimated NEDC effects are 0.1077 in the Northeast, 0.0450 in the Northern Coastal region, 0.0006 in the Eastern Coastal region, 0.0391 in the Southern Coastal region, 0.0451 in the Middle Yellow River region, 0.0220 in the Middle Yangtze region, 0.0084 in the Southwest, and −0.0358 in the Northwest. The joint Wald test strongly rejects equality of the eight coefficients (F(7, 296) = 5.182, p < 0.001). Relative to the Northeast, all seven interaction coefficients are negative; the differences are statistically significant at the 1% level except for the Southern Coastal comparison, which is significant at the 10% level.
The comparatively large Northeastern estimate is consistent with a catch-up interpretation: cities facing stronger structural adjustment pressures may obtain larger marginal gains when e-commerce demonstration policies improve market connectivity and facilitate new forms of business organization. Positive and significant estimates in the Northern Coastal and Middle Yellow River regions also suggest that policy gains are not confined to a single macro-region. These interpretations concern differential policy associations and do not establish the specific mechanisms responsible for the regional pattern.
5.2.2. Heterogeneity by City Administrative Status
We next examine whether the NEDC effect differs between China’s four municipalities and fifteen sub-provincial cities and other sample cities. Higher administrative status is generally associated with stronger policy-coordination capacity, denser digital and logistics infrastructure, greater fiscal resources, and a stronger ability to mobilize complementary public services. These conditions may increase the effectiveness with which a city translates NEDC designation into green-productivity improvements.
We estimate a pooled interaction model using other cities as the reference group. The NEDC-by-administrative-status interaction directly measures the coefficient difference for municipalities and sub-provincial cities. All nineteen cities in the higher-status group are eventually designated as NEDCs, so their group-specific effect is identified by differences in designation timing rather than by comparison with never-treated cities within that group. This limitation warrants a cautious interpretation. The results are presented in Panel B of Table 6.
The estimated NEDC effect is 0.0209 for other cities and 0.0698 for municipalities and sub-provincial cities. The interaction coefficient is 0.0489 and is statistically significant at the 1% level (F(1, 296) = 7.511, p = 0.0065). The formal test therefore rejects equality of the two policy coefficients.
The larger estimate for municipalities and sub-provincial cities is consistent with stronger administrative coordination and complementary infrastructure enhancing policy implementation. Nevertheless, because this group is small and contains no never-treated city, the finding should be regarded as exploratory evidence of administrative-capacity heterogeneity rather than a definitive ranking of city types.
6. Conclusions and Policy Implications
6.1. Main Conclusions
Using panel data for 298 cities from 2007 to 2023, this study applies a staggered DID framework to estimate the effect of the NEDC program on urban GTFP. It also examines selection into the program, potential transmission channels, and heterogeneity in policy effects. The main findings are as follows.
(1) The designation of a city as an NEDC exerts a positive and statistically significant influence on urban GTFP in the baseline TWFE model. The estimated coefficient is 0.0293. After jointly controlling for Broadband China, Smart City, Low-Carbon City, and Big Data pilot policies, the coefficient remains 0.0276 (p = 0.009). After balancing pre-policy GTFP, trends, baseline covariates, and e-commerce readiness, the entropy-weighted estimate is 0.0330. The Callaway-Sant’Anna doubly robust overall ATT is 0.0327, and the Sun-Abraham mean effect over event times 0–6 is 0.0332; all three estimates are statistically significant. The Callaway-Sant’Anna and Sun-Abraham policy-pre-trend tests over event times −5 to −2 do not reject zero. The de Chaisemartin-D’Haultfoeuille dynamic point estimates turn positive at longer horizons but are imprecisely estimated. The Goodman-Bacon decomposition assigns 94.42% of the detailed unadjusted weight to comparisons with never-treated cities and 3.26% to comparisons using already-treated cohorts as controls. Thus, the main finding remains after accounting for major concurrent policies, observable selection, and heterogeneous treatment effects, although these procedures cannot eliminate selection on unobserved factors.
(2) The two-step channel analysis provides evidence consistent with three potential transmission channels. First, NEDC designation increases employment density in information transmission, computer services, and software, indicating an expansion of specialized digital service capacity. Second, the policy increases postal business revenue per capita, consistent with stronger parcel, delivery, and circulation services. Third, the policy raises the city-level digital payment index in the 2011–2023 common sample, although this estimate is significant only at the 10% level. Together, these results support information service agglomeration, e-commerce logistics and circulation, and digital payment facilitation as plausible channels, while not constituting formal estimates of causal indirect effects.
(3) Pooled interaction models and formal Wald tests reveal statistically significant heterogeneity across the eight comprehensive economic regions and by city administrative status. The joint test rejects equality of the eight regional effects (p < 0.001), with the largest estimated effect in the Northeast. The estimated effect for municipalities and sub-provincial cities is 0.0698, compared with 0.0209 for other cities, and the difference is statistically significant (p = 0.0065). Because every city in the higher-administrative-status group is eventually treated, this comparison relies on staggered designation timing and should be interpreted as exploratory.
6.2. Policy Implications
The following policy implications are bounded by the scope of the empirical evidence presented in this study.
First, environmental performance should be incorporated more explicitly into the implementation and evaluation of the NEDC program. The baseline results show that NEDC designation is associated with an increase of 0.0293 in the GTFP index, equivalent to approximately 12.2% of its sample mean. This finding suggests that the performance of demonstration cities should not be assessed solely in terms of e-commerce transactions, business formation, or logistics expansion. The evaluation framework could also consider improvements in resource-use efficiency and reductions in the environmental costs associated with urban production. Such an approach would better align e-commerce development with the objective of improving the quality of urban economic growth.
Second, implementation of the NEDC program should be accompanied by complementary investments in specialized digital services, efficient e-commerce logistics, and reliable digital-payment infrastructure. Local governments can facilitate the entry and training of information service firms and workers, support parcel-network coordination and cleaner last-mile delivery, and improve interoperable payment and settlement services for small merchants. These measures can help translate e-commerce expansion into better production coordination, faster inventory turnover, lower transaction costs, and more efficient resource use. The digital payment result is statistically weaker than the other two channel estimates, so policy emphasis should remain on building a balanced ecosystem rather than relying on payment digitalization alone.
Third, policy implementation should account for differences in regional economic conditions and administrative capacity. The larger estimated effect in the Northeast suggests that e-commerce demonstration policies may generate substantial gains in regions facing stronger structural transformation needs, while the larger estimate for municipalities and sub-provincial cities highlights the possible importance of policy coordination, digital infrastructure, and complementary public services. These findings support strengthening implementation capacity in ordinary prefecture-level cities rather than mechanically concentrating future designations in higher-status cities. Because the administrative-status result relies on staggered timing within a small, eventually treated group, targeting decisions should be supported by additional evidence on local implementation conditions.
6.3. Limitations and Future Research
This study has several limitations that provide directions for future research. First, entropy balancing and doubly robust weighting adjust for observed pre-policy characteristics but cannot eliminate selection on unobserved determinants of NEDC designation. In addition, the national agencies’ public notices describe eligibility rules and publish approved-city lists but do not provide a complete national list of unsuccessful applicants for all three cohorts. The study therefore does not label later-approved cities as rejected applicants. Future research could obtain administrative application records and compare approved and unsuccessful applicants directly.
Second, information service employment density, postal business revenue per capita, and the digital-payment index capture specific operational dimensions of e-commerce but remain proxies for broader processes of service agglomeration, logistics efficiency, and transaction facilitation. The two-step estimates establish policy effects on these channel variables but do not identify causal indirect effects. Moreover, the payment index is available only for 2011–2023, and its policy coefficient is significant at the 10% level. Future research could combine firm-level service procurement, parcel flow and route data, and merchant-level payment records with formal causal-mediation designs.
Third, the analysis is conducted at the city level and therefore cannot directly identify the responses of individual firms or households to the NEDC policy. Future research could combine city-level policy information with firm-level data to examine changes in production technology, resource allocation, e-commerce adoption, and environmental performance. Such evidence would provide a more detailed understanding of the micro-level foundations of changes in urban GTFP.
Fourth, this study focuses on the effects of the NEDC policy within designated cities. Potential spatial spillovers to neighboring cities and interactions with other digital policies are not fully investigated. Future research could employ spatial econometric models or policy-interaction designs to examine whether the effects extend beyond administrative boundaries. Moreover, because the evidence is derived from Chinese cities, caution is required when generalizing the findings to countries with different institutional and digital-development conditions.
Author Contributions
Conceptualization, L.Y.; Methodology, X.Q.; Software, X.Q. and L.W.; Investigation, L.Y.; Resources, X.Q.; Data curation, L.W.; Writing—review and editing, C.L.; Supervision, L.Y. All authors have read and agreed to the published version of the manuscript.
Funding
This research received no external funding.
Institutional Review Board Statement
Not applicable.
Informed Consent Statement
Not applicable.
Data Availability Statement
The data that support the findings of this study are available from the first corresponding author upon reasonable request.
Conflicts of Interest
The authors declare no conflicts of interest.
References
- Jiang, W.; Li, J. Digital transformation and its effect on resource allocation efficiency and productivity in Chinese corporations. Technol. Soc. 2024, 78, 102638. [Google Scholar] [CrossRef] [Scilit]
- Liu, Y.; Zhang, M.; Fan, B.; Fu, S.; Liu, Y. The green side of digital trade: Evaluating the impact of the National E-Commerce Demonstration Cities Policy. Int. Rev. Econ. Financ. 2025, 99, 104071. [Google Scholar] [CrossRef] [Scilit]
- Wang, S.; Shi, C.; Fang, C.; Feng, K. Examining the spatial variations of determinants of energy-related CO2 emissions in China at the city level using a geographically weighted regression model. Appl. Energy 2019, 235, 95–105. [Google Scholar] [CrossRef] [Scilit]
- Jiang, H.; Hu, W.; Guo, Z.; Hou, Y.; Chen, T. E-commerce development and carbon emission efficiency: Evidence from 240 cities in China. Econ. Anal. Policy 2024, 82, 586–603. [Google Scholar] [CrossRef] [Scilit]
- Bakos, J.Y. Reducing buyer search costs: Implications for electronic marketplaces. Manag. Sci. 1997, 43, 1676–1692. [Google Scholar] [CrossRef] [Scilit]
- Wang, L.; Shao, J. The energy saving effects of digital infrastructure construction: Empirical evidence from Chinese industry. Energy 2024, 294, 130778. [Google Scholar] [CrossRef] [Scilit]
- Zhou, D.; Chu, J. The carbon emission reduction effect of the digital economy from the perspective of biased technological progress. J. Environ. Manag. 2025, 373, 123857. [Google Scholar] [CrossRef] [Scilit]
- Xu, D.; Guo, D.; Yue, P.; Li, M. Household green consumption: Does digital inclusion matter? Int. Rev. Financ. Anal. 2024, 91, 102977. [Google Scholar] [CrossRef] [Scilit]
- Liu, N.; Deng, M.; Cao, X. Does the e-commerce transformation of cities promote green and high-quality development? Evidence from a quasi-natural experiment based on national e-commerce demonstration cities. J. Financ. Econ. 2021, 47, 49–63. (In Chinese) [Google Scholar] [CrossRef]
- Cao, X.; Deng, M.; Li, H. How does e-commerce city pilot improve green total factor productivity? Evidence from 230 cities in China. J. Environ. Manag. 2021, 289, 112520. [Google Scholar] [CrossRef] [Scilit]
- Callaway, B.; Sant’Anna, P.H.C. Difference-in-differences with multiple time periods. J. Econom. 2021, 225, 200–230. [Google Scholar] [CrossRef] [Scilit]
- Sun, L.; Abraham, S. Estimating dynamic treatment effects in event studies with heterogeneous treatment effects. J. Econom. 2021, 225, 175–199. [Google Scholar] [CrossRef] [Scilit]
- de Chaisemartin, C.; D’Haultfoeuille, X. Two-way fixed effects estimators with heterogeneous treatment effects. Am. Econ. Rev. 2020, 110, 2964–2996. [Google Scholar] [CrossRef] [Scilit]
- Goodman-Bacon, A. Difference-in-differences with variation in treatment timing. J. Econom. 2021, 225, 254–277. [Google Scholar] [CrossRef] [Scilit]
- Qiu, L.D.; Zhou, M.; Wei, X. Regulation, innovation, and firm selection: The Porter hypothesis under monopolistic competition. J. Environ. Econ. Manag. 2018, 92, 638–658. [Google Scholar] [CrossRef] [Scilit]
- Cui, Z.; Li, X.; Wang, L.; Zhang, Y.; Ni, L. Effects of environmental regulation on green total factor productivity under different regional synergistic development thresholds. J. Environ. Manag. 2025, 394, 127311. [Google Scholar] [CrossRef] [Scilit]
- Hu, W.; Wang, D. How does environmental regulation influence China’s carbon productivity? An empirical analysis based on the spatial spillover effect. J. Clean. Prod. 2020, 257, 120484. [Google Scholar] [CrossRef] [Scilit]
- Zhao, X.; Hu, S. Does market-based electricity price affect China’s energy efficiency? Energy Econ. 2020, 91, 104909. [Google Scholar] [CrossRef] [Scilit]
- Zhu, J.; Yang, Z.W.; Jiang, S. The trade-off between economic growth and green development under fiscal pressure: Evidence from China. Emerg. Mark. Financ. Trade 2026, 62, 2285–2299. [Google Scholar] [CrossRef] [Scilit]
- Liu, Y.; Cao, L.; Wu, L.; Xi, Y.; Zhang, S. The impact of FDI on firms’ pollution emissions: Evidence from China. Int. Rev. Econ. Financ. 2025, 100, 104113. [Google Scholar] [CrossRef] [Scilit]
- Neumayer, E. Pollution havens: An analysis of policy options for dealing with an elusive phenomenon. J. Environ. Dev. 2001, 10, 147–177. [Google Scholar] [CrossRef] [Scilit]
- Deichmann, U.; Goyal, A.; Mishra, D. Will digital technologies transform agriculture in developing countries? Agric. Econ. 2016, 47, 21–33. [Google Scholar] [CrossRef] [Scilit]
- Lai, X.; Sun, Z.; Liu, J.; Wu, G. Resource recycle efficiency improvement analysis for sharing bicycles: Value chain perspective. J. Clean. Prod. 2020, 255, 120284. [Google Scholar] [CrossRef] [Scilit]
- Zhao, S.; Zhang, L.; Peng, L.; Zhou, H.; Hu, F. Enterprise pollution reduction through digital transformation? Evidence from Chinese manufacturing enterprises. Technol. Soc. 2024, 77, 102520. [Google Scholar] [CrossRef] [Scilit]
- Su, Y.; Duan, H.; Wang, Z.; Song, G.; Kang, P.; Chen, D. Characterizing the environmental impact of packaging materials for express delivery via life cycle assessment. J. Clean. Prod. 2020, 274, 122961. [Google Scholar] [CrossRef] [Scilit]
- Yang, B.; Fan, F.; Dai, S.; Chen, S. Industrial robots, resource misallocation, and firm innovation performance: Evidence from China. J. Reg. Sci. 2026, 66, 399–425. [Google Scholar] [CrossRef] [Scilit]
- Goldfarb, A.; Tucker, C. Digital economics. J. Econ. Lit. 2019, 57, 3–43. [Google Scholar] [CrossRef] [Scilit]
- Li, T.; Huang, S. Does digital-industrial technology integration reduce corporate carbon emissions? Environ. Res. 2024, 257, 119313. [Google Scholar] [CrossRef] [Scilit]
- Hortacsu, A.; Martinez-Jerez, F.A.; Douglas, J. The geography of trade in online transactions: Evidence from eBay and MercadoLibre. Am. Econ. J. Microecon. 2009, 1, 53–74. [Google Scholar] [CrossRef] [Scilit]
- Zhao, C.; Wang, K.; Dong, X.; Dong, K. Is smart transportation associated with reduced carbon emissions? The case of China. Energy Econ. 2022, 105, 105715. [Google Scholar] [CrossRef] [Scilit]
- Bachas, P.; Gertler, P.; Higgins, S.; Seira, E. Digital financial services go a long way: Transaction costs and financial inclusion. AEA Pap. Proc. 2018, 108, 444–448. [Google Scholar] [CrossRef] [Scilit]
- Guo, F.; Wang, J.; Wang, F.; Kong, T.; Zhang, X.; Cheng, Z. Measuring China’s digital financial inclusion: Index compilation and spatial characteristics. China Econ. Q. 2020, 19, 1401–1418. (In Chinese) [Google Scholar] [CrossRef]
- Chung, Y.H.; Fare, R.; Grosskopf, S. Productivity and undesirable outputs: A directional distance function approach. J. Environ. Manag. 1997, 51, 229–240. [Google Scholar] [CrossRef] [Scilit]
- Tone, K. A slacks-based measure of efficiency in data envelopment analysis. Eur. J. Oper. Res. 2001, 130, 498–509. [Google Scholar] [CrossRef] [Scilit]
- Oh, D.H. A global Malmquist-Luenberger productivity index. J. Product. Anal. 2010, 34, 183–197. [Google Scholar] [CrossRef] [Scilit]
- Luan, B.; Zou, H.; Chen, S.; Huang, J. The effect of industrial structure adjustment on China’s energy intensity: Evidence from linear and nonlinear analysis. Energy 2021, 218, 119517. [Google Scholar] [CrossRef] [Scilit]
- Rodriguez-Clare, A. The division of labor and economic development. J. Dev. Econ. 1996, 49, 3–32. [Google Scholar] [CrossRef] [Scilit]
- Hu, G.G. Is knowledge spillover from human capital investment a catalyst for technological innovation? The curious case of the fourth industrial revolution in BRICS economies. Technol. Forecast. Soc. Change 2021, 162, 120327. [Google Scholar] [CrossRef] [Scilit]
- Tone, K.; Tsutsui, M. An epsilon-based measure of efficiency in DEA: A third pole of technical efficiency. Eur. J. Oper. Res. 2010, 207, 1554–1563. [Google Scholar] [CrossRef] [Scilit]
- National Development and Reform Commission (NDRC). Notices on the National Low-Carbon Province and City Pilot Programs, 2010, 2012, and 2017. Available online: https://zfxxgk.ndrc.gov.cn/web/iteminfo.jsp?id=1070 (accessed on 21 August 2026). (In Chinese)
- Ministry of Housing and Urban-Rural Development (MOHURD). Announcements of the National Smart-City Pilot Lists, 2013 and 2015. Available online: https://www.gov.cn/gzdt/2013-08/08/content_2463569.htm (accessed on 21 August 2026). (In Chinese)
- Ministry of Industry and Information Technology (MIIT); National Development and Reform Commission (NDRC). Announcements of the Broadband China Demonstration-City Lists, 2014–2016. Available online: https://www.miit.gov.cn/ztzl/lszt/qltjkdzg/mtjj/art/2014/art_20c18114eeb542c1bc8987ab1c43a2d7.html (accessed on 21 August 2026). (In Chinese)
- National Development and Reform Commission (NDRC); Ministry of Industry and Information Technology (MIIT); Cyberspace Administration of China (CAC). Approvals of National Big-Data Comprehensive Pilot Zones, 2016. Available online: https://www.ndrc.gov.cn/fzggw/jgsj/gjss/sjdt/201707/t20170731_1154774.html (accessed on 21 August 2026). (In Chinese)
- Hainmueller, J. Entropy balancing for causal effects: A multivariate reweighting method to produce balanced samples in observational studies. Political Anal. 2012, 20, 25–46. [Google Scholar] [CrossRef] [Scilit]
- Sant’Anna, P.H.C.; Zhao, J. Doubly robust difference-in-differences estimators. J. Econom. 2020, 219, 101–122. [Google Scholar] [CrossRef] [Scilit]
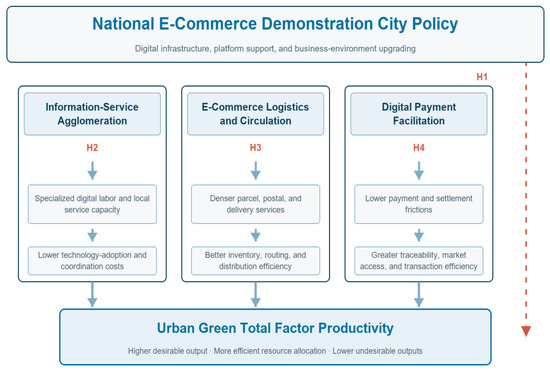
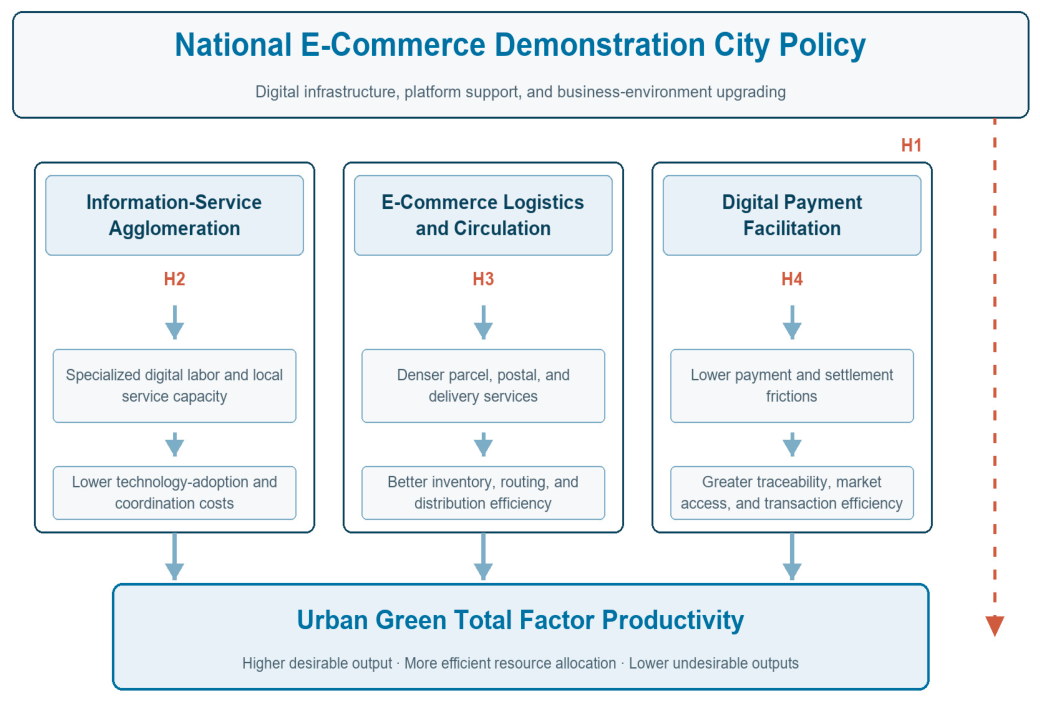
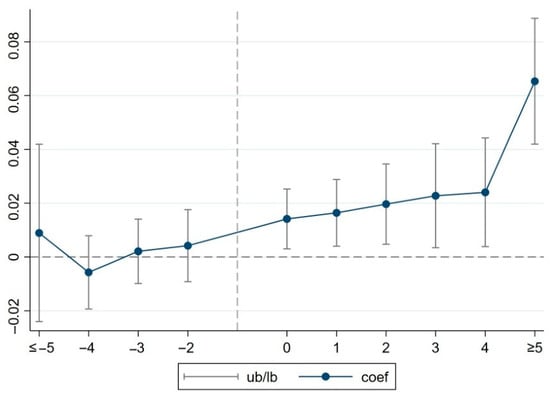
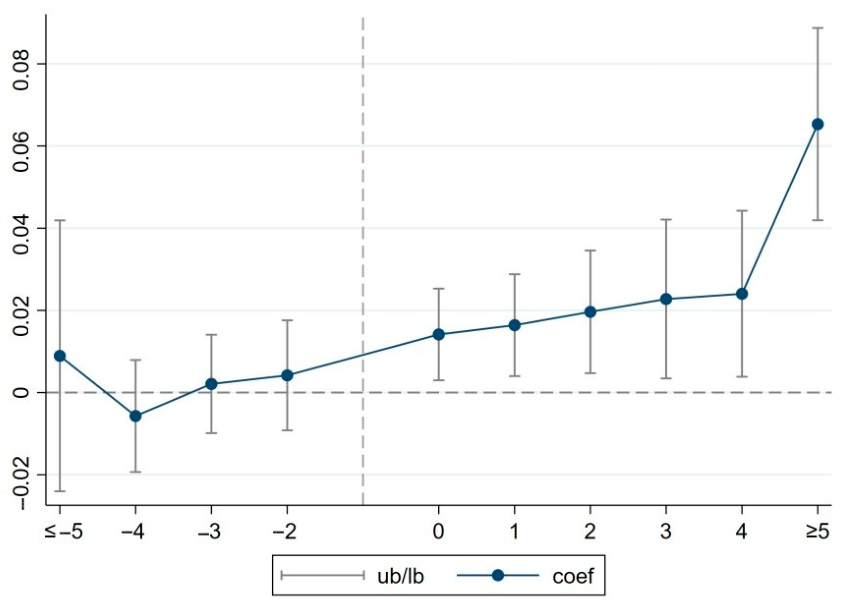
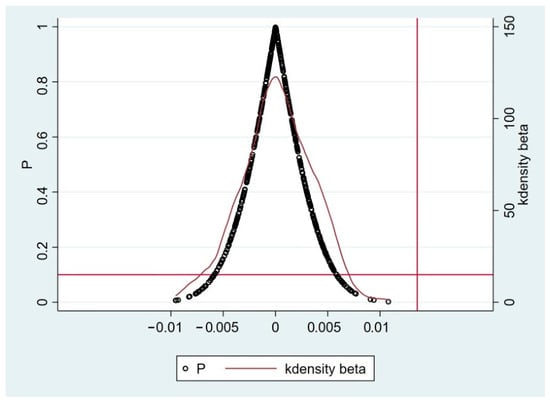
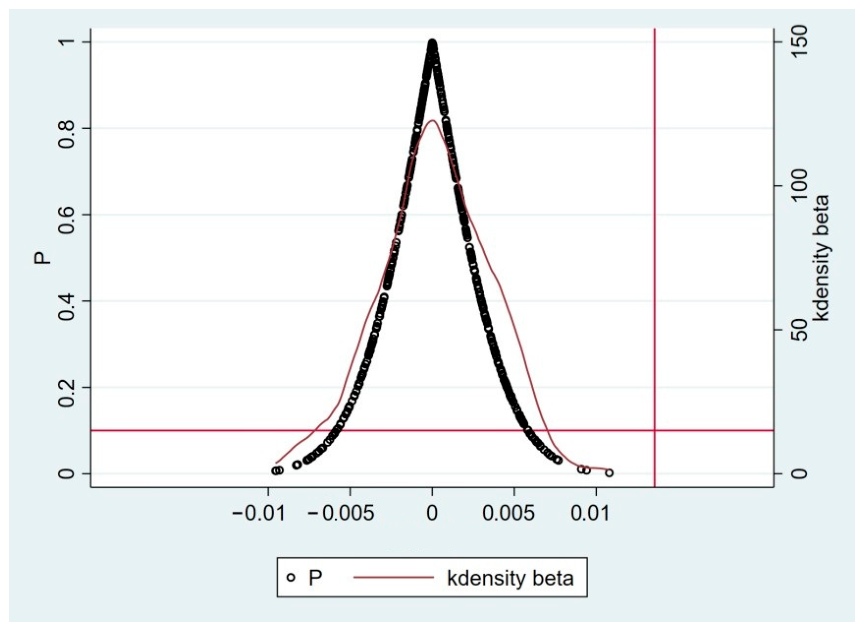
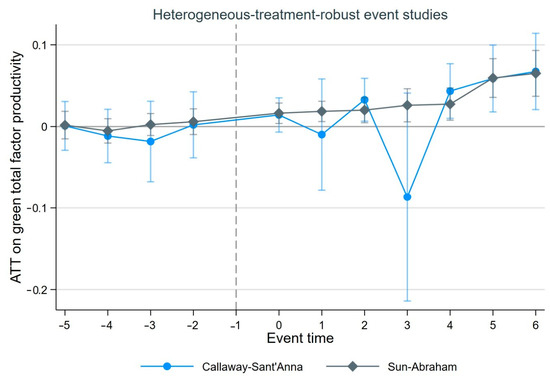
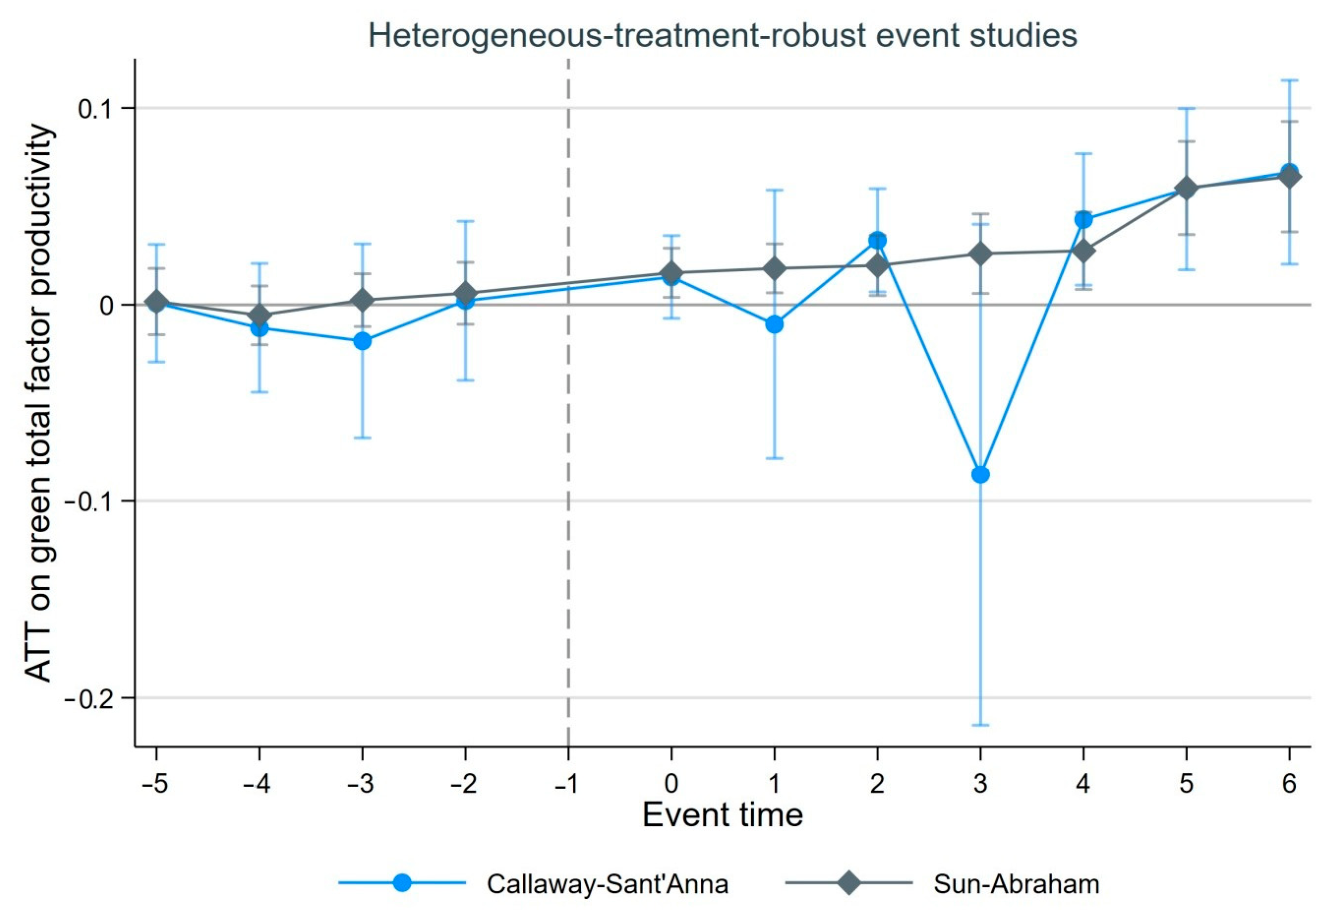

Disclaimer/Publisher’s Note: The statements, opinions and data contained in all publications are solely those of the individual author(s) and contributor(s) and not of MDPI and/or the editor(s). MDPI and/or the editor(s) disclaim responsibility for any injury to people or property resulting from any ideas, methods, instructions or products referred to in the content. |
© 2026 by the authors. Licensee MDPI, Basel, Switzerland. This article is an open access article distributed under the terms and conditions of the Creative Commons Attribution (CC BY) license.