


Abstract
In recent years, numerous mobile platforms have introduced product ranking systems to guide consumer choices. Yet, how such rankings shape purchasing decisions remains insufficiently understood. This paper employed an event-related potential (ERP) experiment to capture the neurophysiological responses of consumers during mobile shopping, thereby uncovering the psychological processes and neural mechanisms underlying the influence of online rankings. Our findings reveal that consumers in mobile shopping environments are equally susceptible to information cascades. When product rankings were presented as decision aids, despite limited cognitive resources, low-ranking cues elicited high attentional engagement, as indicated by a higher P2 amplitude. Subsequently, ranking cues appeared to be associated with evaluative processing, as reflected in P3 amplitude differences. These neural and behavioral patterns reflect the avoidance tendencies toward low-ranking products and relatively greater trust-related evaluation of higher-ranked products, ultimately shaping purchase intentions. This study provides cognitive neuroscience evidence for how online rankings modulate mobile consumers’ decision-making.
1. Introduction
With the rapid evolution of mobile Internet technology and the widespread coverage of e-commerce platforms, mobile shopping has become a vital component of contemporary consumers’ daily lives. The monthly active users of mobile shopping exceeded one billion during the first half of 2025 [1], and the global mobile commerce market size was valued at USD 2239.11 billion in 2025 [2], highlighting the enormous potential and vitality of the mobile shopping market. However, compared to traditional e-commerce, mobile consumers face greater uncertainty when online shopping. On the one hand, with the explosive growth in the number of products, mobile consumers encounter significant information overload. On the other hand, due to the multidimensional constraints of mobile terminals, such as screen size, processing efficiency, and network speed, mobile consumers face challenges in effectively comparing and filtering the vast array of products. Hence, numerous mobile shopping platforms have introduced product rankings, such as bestseller lists, hot sale lists, and discount lists, aiming to provide decision-making support to consumers and enhance their shopping experience [3,4,5,6,7].
As an important decision-making support tool for mobile consumers during online shopping, product rankings sort products through algorithms and data models, helping online consumers more efficiently locate products that meet their needs, thereby effectively reducing search costs and potentially influencing consumers’ purchasing behavior and decision-making [8,9]. As market competition intensifies, many online retailers widely adopt marketing strategies such as Taobao’s Cost Per Click (CPC), aiming to attract more potential consumers by improving product rankings on mobile shopping platforms, thereby boosting sales. In some cases, there have even been illegal practices such as boosting sales through fake transactions and manipulating product rankings, posing a serious threat to market fairness and consumer trust. Therefore, does the platform product ranking still have an impact on mobile consumers’ purchasing decisions? How does the product ranking affect the purchasing decisions of mobile consumers?
Numerous studies have explored the impact of product rankings on online user behavior. These studies have found that consumers’ decisions are often shaped by cognitive biases, such as trust in rankings or quality bias, where higher-ranked products are more likely to be selected due to their perceived trustworthiness [10,11,12,13]. Trust, particularly in online platforms, plays a central role in decision-making processes, as users often rely on ranking systems to navigate the overwhelming number of choices available. However, most existing literature relies on questionnaires, interviews, econometric models, or behavioral experiments to study online user behavior and decision-making [5]. Since people may not be willing or are unwilling to fully express their true opinions, accurately capturing and objectively presenting users’ actual psychological states during online shopping is extremely challenging and often leads to measurement bias [14]. With the rapid development of cognitive neuroscience methods, such as event-related potentials (ERPs) and brain imaging technologies, it is possible to analyze advanced cognitive processes by precisely recording relevant brain activities [15,16]. These methods provide a more objective and scientific basis for businesses to evaluate the effectiveness of marketing strategies and improve the accuracy of predicting online consumer behavior [16,17]. However, few studies have examined the underlying cognitive and neural processes to fully understand the influence of rankings on mobile consumers’ decision-making behavior.
Specifically, prior e-commerce research has established that online rankings shape clicks and purchases, often interpreted through information cascades or herding behavior [18,19,20]. However, these theories are primarily inferred from behavioral patterns and do not detail the cognitive processes through which ranking cues translate into purchase intentions, particularly in mobile environments with limited cognitive resources [13]. To address this gap, we draw on the S-O-R framework [21] to conceptualize online rankings as an external stimulus (S) that triggers a two-stage organismic process (O): an early attentional allocation stage and a later evaluative categorization stage, both of which jointly predict consumers’ purchase responses (R). By using ERPs, we provide process-level neurophysiological evidence that refines the ‘black box’ of the organism in the S-O-R framework and clarifies how ranking-based social information can translate into cascade-like purchase decisions in mobile shopping. This study contributes to online consumer decision-making theory by offering neurocognitive insights into how external ranking cues influence cognitive processes at multiple stages. Additionally, the findings provide practical guidance for online platforms and retailers, offering insights into optimizing ranking algorithms and product marketing strategies in mobile environments.
2. Literature Review
2.1. Online Rankings and Consumer Behavior
Online rankings sort online products based on consumer clicks or product sales, providing references for online consumers’ purchasing decision-making and significantly influencing their decision-making behavior [3,6,7,10,22]. The impact of online ranking systems on consumer behavior has attracted attention from researchers in various fields, such as technology adoption [10,11,12], online ratings [18,19,23,24], online purchasing [6,25,26,27], P2P lending [28], social networks [7,29,30], and online media [31]. Pan et al. [32] found that consumers exhibit “trust bias” and “quality bias” toward ranking results; thus, their decision-making is influenced by the ranking order in online rankings. Ursu [33] pointed out that higher-ranked hotels have higher click-through rates in online hotel bookings.
In recent years, numerous studies have explored the impact of product online rankings on user behavior from the perspective of information cascades. Duan et al. [10] found that online users’ choices of software are largely determined by software download rankings and popularity information. Additionally, several studies found that online users’ observation of others’ ratings of movies triggers information cascades in their rating generation [18,19]. In the book market, Liu et al. [20] found that online users’ choices of e-books are influenced by book rankings, and the number of reviews has no impact on the click-through rates of higher-ranked e-books but has a positive impact on those of lower-ranked ones. In the Internet finance market, many studies have shown that ranking system information is an important driver for lenders in microfinance and P2P lending decision-making [34]. Furthermore, several studies emphasize the importance of hotel rankings on online booking platforms for consumers’ booking choices, indicating that for every one-position increase in hotel ranking, consumers are more likely to click to view its details, thereby influencing their booking intentions [35,36,37]. Dewan et al. [31] found that ranking systems have a more significant impact on non-popular music compared to popular music.
Therefore, the impact of online product rankings on consumer behavior has generated a considerable number of research findings. However, most literature employs traditional methods, such as questionnaires and interviews, to explore consumer behavior. Although traditional methods have revealed certain behavioral patterns, they have not yet uncovered the cognitive mechanisms and neural processes by which product rankings influence consumer behavior. Several studies have pointed out that revealing brain neural activity during online consumers’ decision-making can enhance the reliability and reproducibility of research conclusions, making the results more objective and in-depth [14,38], but few existing studies have yet explored the neural mechanisms underlying the influence of online rankings.
2.2. Neural Mechanisms of Consumer Decision-Making
Event-related potentials (ERPs), as one of the most widely used tools in cognitive neuroscience, provide direct and objective neurophysiological data collection capabilities, opening the “black box” of the human brain and offering effective supplementation to traditional data sources and leading to a new perspective in consumer decision-making research [39]. In recent years, an increasing number of researchers have used ERP experiments to explore the neural mechanisms behind consumers’ online shopping decision-making. ERP components have been widely recognized by researchers as reliable indicators of the influence of attitudes and preferences towards products on consumer behavior and decision-making. The ERP components induced during the early decision-making stages of consumers’ online shopping decision-making, such as the P2 component, reflect that consumers’ preference-driven responses to products are spontaneous. Meanwhile, those induced during the late decision-making stages, such as the P3 component, indicate that consumers’ final decisions about products are based on conscious and more refined cognitive processes [40].
The P2 component is an ERP component associated with early attentional bias [41,42,43], reflecting individuals’ allocation of attentional resources and their attentional demands during experimental tasks. Negative materials occupy more attentional resources from individuals compared to positive and neutral materials [44], allowing such stimulus materials to win limited attentional resource allocation in the early cognitive stages. The late positive component P3 is the most frequently studied ERP component in consumers’ decision-making research, reflecting evaluative categorization processing of stimuli and closely related to the decision-making process [45,46,47]. The amplitude of the P3 component is influenced by the difficulty of decision-making tasks, decision-making information cues, and individual decision-making preferences [46,48], and can be used to characterize decision-makers’ attitudes and preferences toward decision-making tasks. Ito et al. [49] found that compared to negative situations, participants exhibit higher P3 amplitudes in positive situations.
The literature provides evidence for the feasibility and advantages of cognitive neuroscience-related theories and technologies in studying online consumers’ behavior. Therefore, we hypothesize that when online consumers face different product online ranking cues, these cues will first influence attentional resource allocation and then influence decision-making mechanisms, thereby forming final purchasing decisions, as reflected in the P2 and P3 components.
2.3. Conceptual Model and Hypotheses
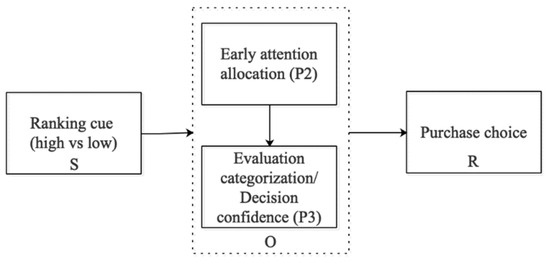
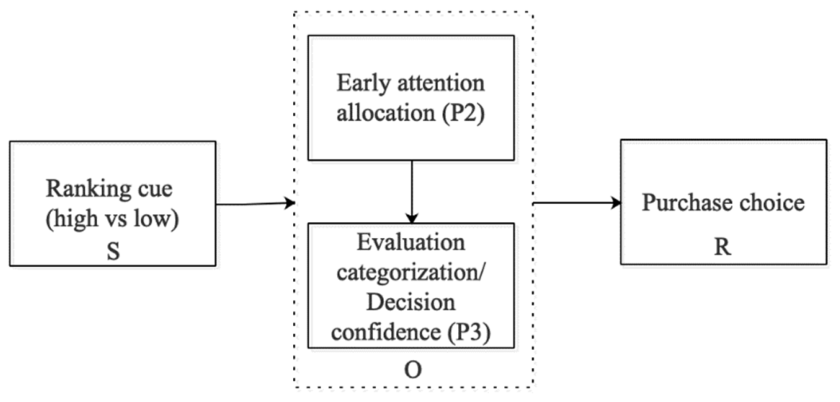
Online rankings in mobile shopping can be viewed as a form of social information cue that summarizes the actions or preferences of prior users (e.g., sales-based or click-based ordering). Consistent with information cascade logic, such aggregated cues may induce consumers to rely on others’ implied choices when facing uncertainty and limited processing capacity [6,7,10,22]. From the perspective of the S-O-R framework [21], ranking cues serve as an external stimulus (S) that initiates organismic processing (O) and ultimately shapes purchase responses (R).
Importantly, our contribution is to unpack the organismic “black box” into temporally ordered stages that can be indexed by ERPs. First, ranking cues may bias early attentional allocation toward diagnostically salient or potentially threatening information. In mobile interfaces, low ranking can be interpreted as a warning signal (e.g., low popularity or low acceptance) and thus may capture attention more strongly under resource constraints, which should manifest as an enhanced P2 component. Second, consumers subsequently engage in evaluative categorization and form an overall decision tendency (e.g., trust vs. avoidance) based on the ranking cue. This later stage is commonly indexed by the P3 component, reflecting stimulus evaluation, categorization, and decision confidence.
Therefore, we propose the conceptual model shown in Figure 1: online ranking cues (S) influence purchase intention/choice (R) through a two-stage organismic pathway (O), consisting of early attentional engagement (P2) and later evaluative processing and decision confidence (P3).
Figure 1.
Conceptual model.
H1.
Compared with low-ranking cues, high-ranking cues will lead to higher purchase choice.
H2.
Low-ranking cues will elicit greater early attentional engagement than high-ranking cues, as reflected by a larger P2 amplitude.
H3.
High-ranking cues will elicit greater decision confidence than low-ranking cues, as reflected by a larger P3 amplitude.
3. Materials and Methods
3.1. Participants
Fifty-two undergraduate students (32 females, 20 males; Mage = 22.52, SD = 2.26, age range: 18–27 years) from multidisciplinary academic backgrounds were recruited from Fuzhou, China, between April and June 2024. Participants were recruited via campus advertisements and online postings, and all participated voluntarily, signing an informed consent form. All participants were right-handed, with no history of mental illness, familial hereditary neurological diseases, or brain injuries. They reported no habits of smoking, alcohol consumption, or psychotropic drug use and had normal vision or corrected-to-normal vision. Due to equipment malfunctions leading to abnormal EEG data for three participants, their behavioral data and corresponding EEG data were excluded. Ultimately, data from 49 participants were included in the experimental analysis, including 19 males (Mage = 22.56, SD = 2.96) and 30 females (Mage = 22.32, SD = 1.80). Before initiating the experiment, we explained the experimental procedure and its non-invasive nature in detail to all participants, ensuring that each participant voluntarily participated and signed an informed consent form. They received a token of appreciation equivalent to $8 as compensation for their time.
3.2. Experimental Materials
This study selected 3C products as experimental materials. We removed all information not directly related to the experimental purpose, such as brand logos, price tags, and specific attributes, and standardized product image quality to maximize internal validity and isolate the causal impact of product ranking information. The brightness and contrast were adjusted to ensure consistency, and product sizes were uniformly standardized across stimuli. For the product rankings, we created two distinct ranking groups based on the ranking range of specific product categories on a mobile shopping platform, including a high-ranking group (ranking from 1 to 5) and a low-ranking group (ranking from 46 to 50). The chosen ranges were intended to represent highly salient head-versus-tail ranking cues that consumers commonly encounter in category lists (e.g., top sellers vs. lower-listed items) on mobile platforms. Subsequently, we randomly paired each product image, assigning it a set of high-ranking stimulus materials and a set of low-ranking stimulus materials, thereby constructing two ranking levels for the same product (i.e., high-ranking and low-ranking).
In terms of operationalization, the visual format of the ranking cues was designed to resemble typical online shopping platforms, where each product was displayed with its ranking in text. The realism of the ranking cues was ensured by using actual rankings from a simulated shopping environment rather than arbitrary rankings created for the experiment. To enhance the immersion of the experiment, all product images and ranking information were presented in a format that simulated a mobile shopping environment. This closely resembled participants’ actual mobile shopping experiences.
3.3. Experimental Procedure
The experimental process was programmed and presented using E-Prime 3.0 software (Psychology Software Tools, Sharpsburg, PA, USA). This experiment adopted a within-subjects repeated-measures ERP design with different conditions of product rankings (2 conditions: high-ranking vs. low-ranking). The experiment was conducted in a quiet, distraction-free laboratory.
During the presentation of experimental stimuli, participants were asked to maintain stable eye movements, avoid blinking or unnecessary body movements, and keep their fingers on the keyboard’s ready position in preparation for the start of the formal experiment. The experiment used an S1–S2 paradigm [50]. At the beginning of each round of the experiment, a “+” symbol was first displayed at the center of the screen for 500 ms as a fixation point, indicating to participants that the round was ready to begin and guiding them to focus their attention. Subsequently, the product image was displayed for 2000 ms, followed by the product’s ranking information for another 2000 ms. Participants were asked to quickly evaluate the product ranking based on their first impression and express their purchase intention by pressing a key. Once the participants made their purchase decision, the system automatically proceeded to the next trial; if participants did not respond within 3000 ms, the system automatically advanced to the next trial.
To enhance the signal-to-noise ratio of the data, experimental stimuli were randomly repeated three times. After completing five pre-practice trials, the experiment consisted of a total of 60 trials (2 product types × 5 products × 2 ranking groups × 3 repetitions). All 60 trials were combined into a single list and presented in a mixed, trial-level randomized order for each participant, such that high-ranking and low-ranking cues were interleaved rather than presented in separate blocks. Thus, the three repetitions of the same trial were also distributed throughout the overall trial stream instead of appearing consecutively, reducing potential order, learning, and fatigue effects. After the experiment, participants were asked to complete a brief interview and a post-test questionnaire designed to assess their perceptions of the experimental conditions. Specifically, participants were asked to rate whether they believed the ranking positions accurately represented product quality or popularity and whether they felt the rankings influenced their purchase intentions. A five-point Likert-type scale (1 = low-ranking, 5 = high-ranking) was employed in the post-test questionnaire to assess participants’ perceptions of the experimental conditions. The results showed that participants in the high-ranking condition rated the ranking significantly higher than those in the low-ranking condition (Mhigh = 4.35, SDhigh = 0.73; Mlow = 1.92, SDlow = 0.76; F = 259.57, p = 0.000), confirming the effectiveness of the experimental manipulation. Additionally, the post-test data revealed that the participants generally recognized the ranking cues as meaningful, with 85% of participants indicating that they believed higher-ranked products were more likely to be of higher quality. The majority also reported that the rankings influenced their purchase decisions, particularly in the case of the higher-ranked products.
3.4. EEG Acquisition and Preprocessing
EEG was acquired with a mobile 64-channel system (eegoTM mylab with a waveguardTM cap, ANT Neuro, Berlin, Germany) using gel-based electrodes. Signals were recorded according to the international 10–20 layout at 1000 Hz and within a nominal acquisition passband of 0.01–100 Hz [51]. Cz served as the reference electrode, and the ground electrode was located at GND; for analysis, data were re-referenced to the average of the bilateral mastoid electrodes (M1 and M2). Task events and behavioral responses were delivered and logged in E-Prime 3.0, and event markers were aligned with the EEG to form a unified dataset.
Data preprocessing was performed in ASA 4.10 software (ANT Neuro, Hengelo, The Netherlands) and MATLAB v25.1 (The MathWorks, Inc., Natick, MA, USA). Data were band-pass filtered at 0.1–45 Hz [52] and cleaned using ICA (Infomax implementation in EEGLAB, version 2024.0, La Jolla, CA, USA), after which non-neural components (primarily ocular and muscle activity) were identified with the ADJUST procedure and removed [53]. Cleaned continuous data were epoched around stimulus onset (−200 to 800 ms) and baseline-corrected (−200 to 0 ms) to the pre-stimulus interval; trials exceeding ±80 μV were discarded [54]. Remaining epochs were averaged per participant and condition to obtain ERPs, followed by across-participant grand averages. On average, each participant contributed 28–30 valid trials per condition (out of 30), which ensured a sufficient signal-to-noise ratio for ERP analysis. To isolate task-relevant activity, ICs were retained when they matched expected scalp distributions and exhibited the characteristic polarity within the latency ranges of interest (e.g., P2 and P3), with timing stability additionally checked via jackknife-based latency estimates (95% CI shift < 20 ms). Final ERP windows were defined by combining literature-guided ranges with a data-driven scan of global field power using 50 ms steps to accommodate task-specific latency shifts [55,56,57].
4. Data Analysis
4.1. Control Analysis
We conducted a control analysis for all participants, including demographic characteristics, the mobile shopping experience, and product involvement. It is important to rule out the possibility that any observed effects were due to these external factors rather than the experimental manipulation. Given the sample size and data characteristics, appropriate statistical tests were conducted to ensure comparability across participants. Specifically, we used chi-square tests for nominal variables, such as gender and education level, and independent-samples t-tests for continuous variables, such as age and monthly income. The results showed that there were no significant differences among participants in terms of gender (X2 = 0.042, p = 0.838), age (t = 1.848, p = 0.104), education level (X2 = 3.648, p = 0.056), and monthly income (t = 2.329, p = 0.109). Additionally, there were no significant differences among participants in shopping behavior and platform familiarity, such as monthly mobile shopping frequency (t = 2.166, p = 0.105), monthly shopping expenditure (t = 2.111, p = 0.095), average unit price of mobile shopping (t = 1.033, p = 0.387), and time preference for mobile shopping (X2 = 2.414, p = 0.120). We further evaluated participants’ involvement with the experimental materials. The analysis results showed no significant differences in participants’ involvement with electric toothbrushes (t = 1.687, p = 0.100) and Bluetooth headsets (t = 1.629, p = 0.115). Hence, the participants selected for this study showed no significant differences in demographic characteristics, mobile shopping experience, or product involvement, suggesting that differences in subsequent analysis results were caused by the experiment.
4.2. Behavioral Data Analysis
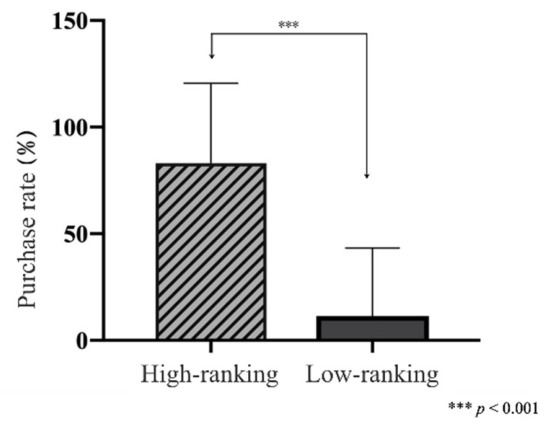
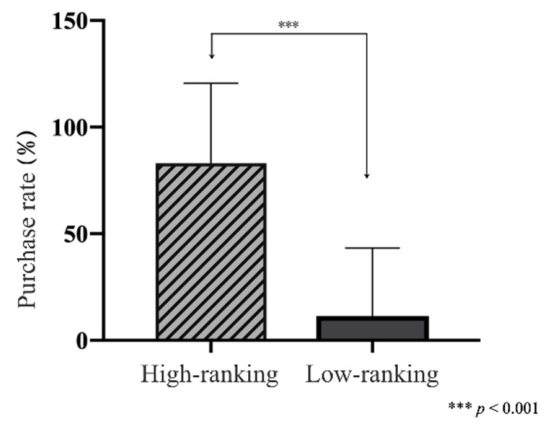
This experiment used E-prime 3.0 software to record behavioral data generated by participants during the purchase decision-making, including purchase choice and reaction times. The behavioral data were statistically analyzed using SPSS 19.0 software. The results of participants’ purchase choices under different product ranking scenarios are shown in Figure 2. To compare purchase rates across conditions, paired t-tests were conducted at the participant level. Specifically, for each participant, purchase rates were aggregated across all trials within each condition (high-ranking vs. low-ranking products). The aggregated participant-level means were then used as the input for the paired t-test, ensuring that the unit of analysis aligned with the level of randomization. This approach respects independence assumptions and avoids inflating statistical significance due to trial-level dependencies. The results showed a significant difference in purchase rates between the high-ranking product group and the low-ranking product group (t1,48 = 16.194, 95%CI = [0.628, 0.896], p = 0.000), with the purchase rate of the high-ranking product group (M = 0.831, SE = 0.026) being significantly higher than that of the low-ranking product group (M = 0.114, SE = 0.028), supporting H1.
Figure 2.
The purchase rate in different product ranking scenarios.
4.3. EEG Data Analysis
This study focuses on how online rankings, as external cues, influence the neural mechanisms underlying participants’ decision-making processes. All ERP analyses were time-locked to the onset of the ranking information. While the product image was presented first to introduce the item, the ranking cue provided the decision-relevant information whose neural processing we aimed to investigate. By analyzing EEG waveforms recorded from each participant under two distinct stimulus conditions and drawing on prior findings in the consumer decision-making literature, this research primarily investigates two key ERP components: P2 and P3. Based on the cortical regions associated with these components in existing studies, the analysis of the P2 component in this experiment involves 23 electrode sites covering the frontal region F (F7, F5, F3, F1, Fz, F2, F4, F6, F8), the frontocentral region FC (FC5, FC3, FC1, FCz, FC2, FC4, FC6), and the central region C (C5, C3, C1, Cz, C2, C4, C6). Similarly, the P3 component is analyzed using 19 electrode sites spanning the parietal region P (P7, P5, P3, P1, Pz, P2, P4, P6, P8), the parieto-occipital region PO (PO7, PO5, PO3, POz, PO4, PO6, PO8), and the occipital region O (O1, Oz, O2). The P2 and P3 components were quantified using time windows of 100–150 ms and 350–450 ms, respectively, time-locked to the onset of the ranking cue. These windows were determined based on a combination of prior ERP research on attentional allocation and evaluative categorization in decision-making tasks [41,43,45,46,47] and verification of the present grand-average waveforms and scalp topographies. In our data, the P2 component peaked around 120 ms, consistent with early attentional engagement [43], while the P3 component peaked around 400 ms, consistent with evaluative categorization and decision confidence processing [45,47].
4.3.1. P2 Component
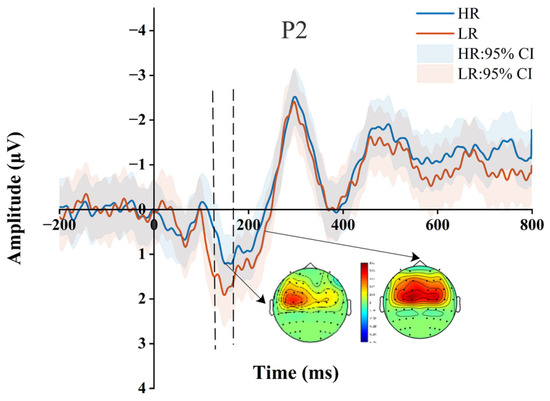
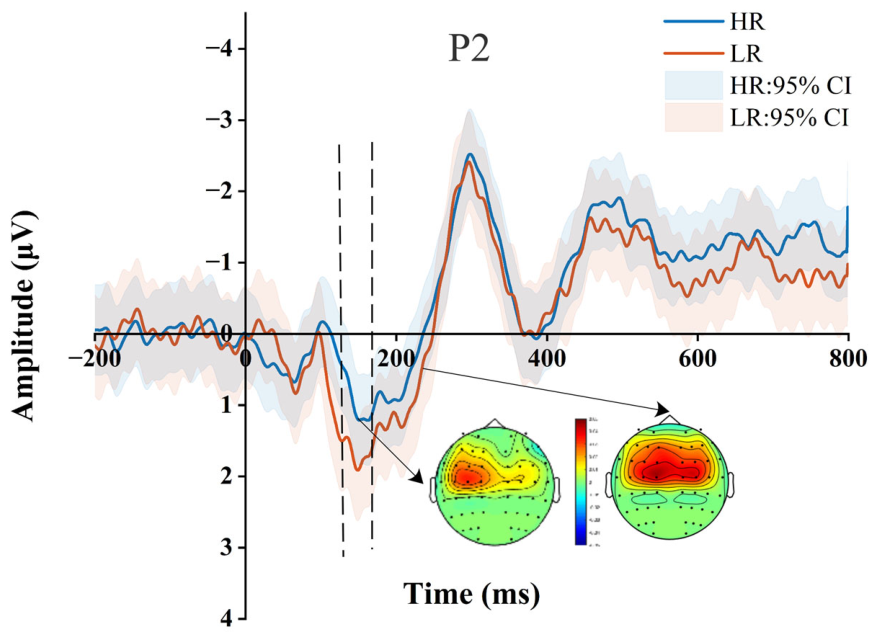
In Figure 3, we present the ERP waveform at the representative electrode Fz for the P2 component (due to space limitations, this study only plots the EEG waveform and topographic maps at the representative electrode Fz during participants’ processing of product online ranking stimuli). We conducted three repeated-measures ANOVAs of the mean ERP amplitude between 100 ms and 150 ms as follows: 2 (product ranking: high ranking, low ranking) × 9 (frontal: F7, F5, F3, F1, Fz, F2, F4, F6, F8); 2 (product ranking: high ranking, low ranking) × 7 (frontocentral: FC5, FC3, FC1, FCz, FC2, FC4, FC6); 2 (product ranking: high ranking, low ranking) × 7 (central: C5, C3, C1, Cz, C2, C4, C6). To address potential type I error inflation due to multiple comparisons, post hoc tests were corrected using the Benjamini–Hochberg (BH) method to control the false discovery rate (FDR) [58,59]. Following precedent in neurobehavioral research that balances statistical rigor with discovery sensitivity, an adjusted p value < 0.10 was considered statistically significant [60,61,62]. We also reported the effect size and confidence intervals to ensure that the interpretation of this effect was cautious. The results in Table 1 showed that the main effect of stimulus type was significant in the frontal region (F1, 49 = 7.999, p = 0.007, η2 = 0.140) and the frontocentral region (F1, 49 = 5.708, p = 0.021, η2 = 0.104), and marginally significant in the central region (F1, 49 = 3.676, p = 0.061, η2 = 0.070). The main effect of electrode was marginally significant in the frontal region (F8, 392 = 2.390, p = 0.085, η2 = 0.046) and the central region (F6, 294 = 2.532, p = 0.067, η2 = 0.049), but not significant in the frontocentral region (F6, 294 = 0.974, p = 0.405, η2 = 0.019). The interaction effect between stimulus type and electrode was significant in the central region (F6, 294 = 3.933, p = 0.008, η2 = 0.074) and marginally significant in the frontocentral region (F6, 294 = 2.718, p = 0.053, η2 = 0.053), but not significant in the frontal region (F8, 392 = 1.239, p = 0.298, η2 = 0.025).
Figure 3.
ERP waveforms and topographic maps of the P2 component.
Table 1.
Repeated ANOVAs of the P2 component in the product ranking.
To analyze the difference in the P2 component between the high-ranking product group and the low-ranking product group, we further conducted paired t-tests for the frontal, frontocentral, and central regions under these two different stimulus conditions. The results in Table 2 indicated that the mean P2 amplitude of the low-ranking group in the frontal region (M = 0.547, SE = 0.198) was significantly higher than that of the high-ranking group (M = 0.109, SE = 0.182), p = 0.007 < 0.01. In the frontocentral region, the mean P2 amplitude of the low-ranking group (M = 0.926, SE = 0.256) was significantly higher than that of the high-ranking group (M = 0.446, SE = 0.240), p = 0.021 < 0.05. In the central region, the P2 amplitude of the low-ranking group (M = 1.008, SE = 0.273) was higher than that of the high-ranking group (M = 0.581, SE = 0.253), p = 0.061 < 0.1, indicating a trend toward greater attentional allocation for low-ranking cues and supporting H2.
Table 2.
The paired t-test for mean P2 amplitude in the product ranking.
4.3.2. P3 Component
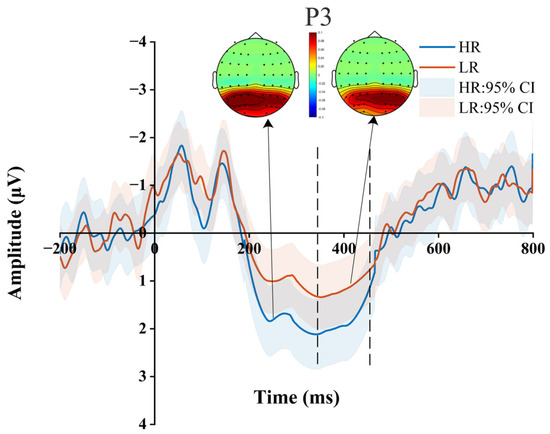
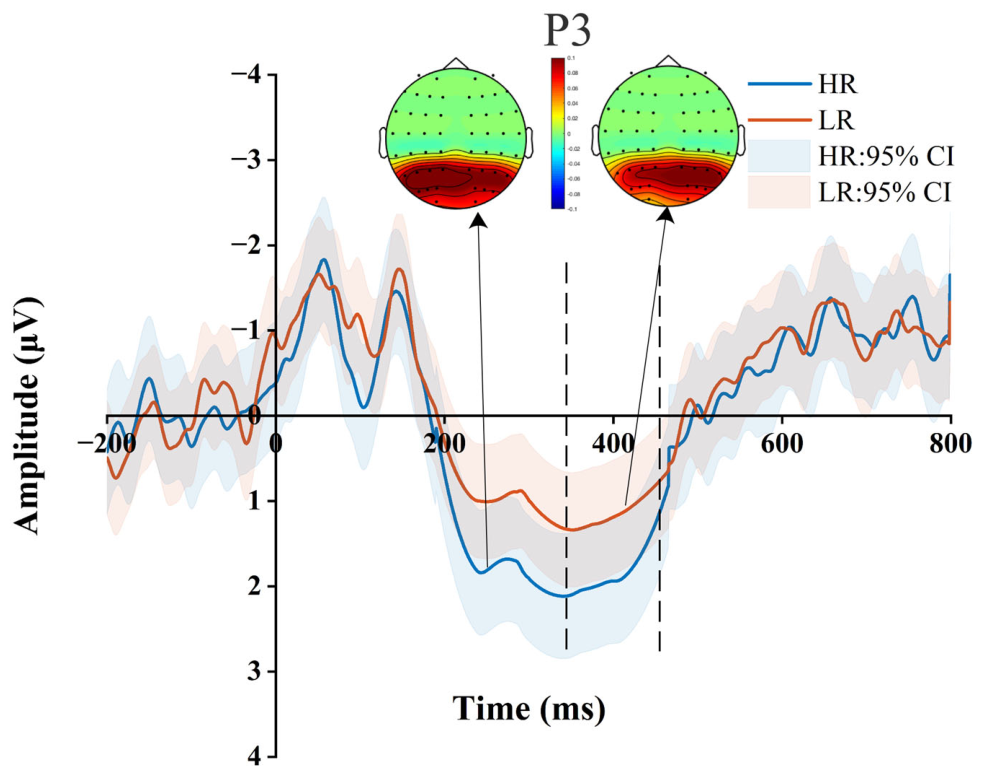
We present the ERP waveform at the representative electrode Oz for the P3 component in Figure 4 (due to space limitations, this study only plots the EEG waveform and topographic maps at the representative electrode Oz during participants’ processing of product online ranking stimuli). We conducted three repeated-measures ANOVAs of the mean ERP amplitude between 350 ms and 450 ms as follows: 2 (product ranking: high ranking, low ranking) × 9 (parietal: P7, P5, P3, P1, Pz, P2, P4, P6, P8); 2 (product ranking: high ranking, low ranking) × 7 (parieto-occipital: PO7, PO5, PO3, POz, PO4, PO6, PO8); 2 (product ranking: high ranking, low ranking) × 3 (occipital: O1, Oz, O2). The p-values of the ANOVAs were corrected using the Greenhouse-Geisser method. We corrected post hoc tests using the Benjamini–Hochberg (BH) method to address potential type I error inflation due to multiple comparisons [58,59]. The results in Table 3 showed that the main effect of stimulus type was marginally significant in the parietal region (F1, 49 = 3.119, p = 0.084, η2 = 0.060), but not significant in the parieto-occipital region (F1, 49 = 1.987, p = 0.165, η2 = 0.039) and the occipital region (F1, 49 = 1.279, p = 0.264, η2 = 0.025). The main effect of electrode was significant in the occipital region (F2, 98 = 6.199, p = 0.004, η2 = 0.112), but not significant in the parietal region (F8, 392 = 1.851, p = 0.131, η2 = 0.036) and the parieto-occipital region (F6, 294 = 0.756, p = 0.452, η2 = 0.015). The interaction effect between stimulus type and electrode was significant in the parietal region (F8, 392 = 7.607, p = 0.000, η2 = 0.134), the parieto-occipital region (F6, 294 = 7.658, p = 0.002, η2 = 0.135), and the occipital region (F2, 98 = 5.020, p = 0.010, η2 = 0.093).
Figure 4.
ERP waveforms and topographic maps of the P3 component.
Table 3.
Repeated ANOVAs of the P3 component in the product ranking.
To analyze the difference in the P3 component between the high-ranking product group and the low-ranking product group, we further conducted paired t-tests for the occipital region under these two different stimulus conditions. The results in Table 4 indicated that the mean P3 amplitude of the high-ranking group (M = 1.948, SE = 0.342) was higher than that of the low-ranking group (M = 1.393, SE = 0.355), p = 0.084 < 0.1, suggesting a trend-level enhancement of evaluative processing for high-ranking products, offering trend-level support for H3.
Table 4.
The paired t-test for mean P3 amplitude in the product ranking.
5. Discussion and Conclusions
This study reveals the neural mechanisms through which online rankings influence mobile consumers’ purchasing decisions through an ERP experiment. First, the behavioral results support H1 by showing that online rankings have a significant positive influence on mobile consumers’ purchase intentions. In fact, information cascade studies have already found the important impact of product rankings on online users’ decision-making [25,26,33]. The behavioral results of this study are consistent with existing literature, suggesting that consumers are also prone to cascade-like reliance on ranking cues in the mobile shopping context.
Additionally, the EEG results suggest that when product rankings are presented as decision aids, brain activity during mobile shopping decision-making may involve two core stages. In the initial stage, the presentation of ranking cues rapidly engages attentional resource allocation. Low-ranking cues elicited larger P2 amplitudes, indicating greater early attentional engagement with these cues, thereby supporting H2. Although an enhanced P2 is often interpreted as a negative attentional bias [44], there are alternative explanations that could also account for this effect. Specifically, low-ranking products may be perceived as novel or unexpected compared to participants’ typical expectations of higher-ranked items [25,26], potentially triggering heightened attention. Alternatively, the low-ranking cues may involve expectancy violation, where participants’ expectations of product popularity are disrupted, leading to increased processing of unexpected information [6,27]. Another possibility is that low-ranking cues are perceived as indicating higher risk, such as lower trustworthiness or quality, which would also contribute to a larger attentional response [63,64]. Post-experiment questionnaire data indicated that participants generally regarded low-ranking products as less favorable or trustworthy (76% of participants), which is broadly consistent with these interpretations. Nevertheless, given the limited construct specificity of the P2 component, we conservatively interpret this result as evidence that low-ranking cues captured earlier attention during mobile shopping decision-making.
In the subsequent decision-making stage, participants gradually form decision-making attitudes toward the products based on two distinct product online ranking cues [65]. This process is prominently reflected by the P3 component, which is widely recognized in the decision-making literature as an index of evaluative categorization, confidence, and choice certainty [46]. The P3 results provide trend-level support for H3. The enhanced P3 component may indicate that consumers engage in more thorough evaluative processing and decision confirmation when encountering positively ranked items. This neural pattern suggests increased confidence and trust in high-ranking products, reflecting a preference-consistent evaluation and supporting their purchase intentions [66]. In other words, while low-ranking products attract attention (P2), it is high-ranking products that consolidate decision-making through positive evaluation (P3), demonstrating a dynamic interplay between early attentional engagement and subsequent motivated decision processing. Compared with the P2 findings, the P3 effect is more exploratory and requires replication in future studies. Moreover, while the P3 component is widely studied in relation to decision confidence, other ERP components, such as the N2, which is often associated with conflict monitoring and cognitive control [67], could also provide valuable insights. In our study, we did not observe a prominent N2 component, which may be due to the nature of the experimental design, where participants were not placed under conditions that elicited significant decision-making conflicts. Future research could explore the potential role of N2 in contexts where consumers face conflicting information or uncertainty regarding product choices, providing a more comprehensive understanding of the decision-making process.
Taken together, these findings support the proposed S-O-R framework, in which online ranking cues appear to shape early attentional allocation, and the present data provide preliminary evidence that they may also influence later evaluative processing, ultimately contributing to purchase intentions. Behaviorally, these neural patterns align with observed purchase intentions, illustrating that consumers integrate ranking cues into their evaluation strategies. From a cognitive perspective, online rankings serve as heuristic signals, reducing uncertainty and facilitating rapid decision-making under information overload. This study provides process-level evidence consistent with information-cascade-like effects, suggesting that consumers may incorporate ranking cues into their decision-making under mobile shopping conditions characterized by uncertainty and constrained cognitive resources.
5.1. Theoretical Contributions
First, this study reveals the neural mechanisms through which online rankings influence mobile consumers’ purchase decisions, offering new insights into the intersection of behavioral research and cognitive neuroscience in the mobile environment. Our findings suggest that consumers’ responses to product rankings are not only shaped by heuristic shortcuts but also by underlying neural processes, indicating that decision-making involves a dynamic interplay between attentional orienting and motivated decision processing, which has been previously overlooked in traditional behavioral models. By linking P2 and P3 neural components to behavioral outcomes, we bridge the gap between neuroscientific findings and practical consumer decision-making theories.
Second, this study refines S-O-R explanations of ranking effects by decomposing the organismic (O) component into two temporally ordered and neurophysiologically observable stages. Specifically, ERP evidence suggests that ranking cues trigger an early attentional orienting stage (indexed by P2) and provide preliminary, trend-level evidence for a subsequent evaluative categorization/decision confidence stage (indexed by P3). This process-level account complements prior behavioral work by explaining how ranking-based social information is transformed into purchase responses in mobile shopping contexts.
Third, rather than treating information cascades as solely an aggregate behavioral pattern, our findings provide within-person process evidence consistent with a cascade-like reliance on ranking cues under uncertainty and constrained cognitive resources. This complements prior information cascade explanations by showing how aggregated social information embedded in online rankings can be rapidly incorporated into consumers’ attention and evaluation dynamics, ultimately shaping purchase intentions.
5.2. Practical Implications
The findings of this study provide several practical implications for designers of mobile shopping platforms and online retailers, particularly given the controlled laboratory setting and the simulated mobile shopping environment employed in this research. First, this study highlights the importance of online rankings as powerful decision-making aids in mobile e-commerce, consistent with prior findings on heuristic-based consumer behavior under uncertainty [3,10,33]. These insights reinforce the notion that ranking cues simplify decision-making by serving as heuristic signals, which is particularly relevant in mobile contexts characterized by information overload and constrained cognitive resources. In such cases, online retailers may consider whether and how ranking algorithms and ranking presentations align with consumer expectations, striking a balance between algorithm-driven rankings and consumer trust.
Second, this study demonstrates the potential application of neurophysiological methods, such as ERPs, in understanding consumer decision-making [15,16,38]. While traditional behavioral methods risk biases due to self-report measures [5,14], EEG data provide objective and quantitative insights into attentional allocation and evaluative categorization. Given that our experiment used a controlled laboratory setting and a simulated shopping interface, online retailers could integrate these findings in real-world contexts to verify ecological validity.
Third, the research framework and design concepts developed in this study have the potential for widespread application in the Chinese e-commerce market, providing valuable strategic references and insights for the construction and development of China’s e-commerce sector. The relevant EEG components identified in this study may provide preliminary reference indicators for future e-commerce research and platform evaluation, offering scientific quantitative metrics for decision-making. E-commerce marketers may draw on the research framework of this study when examining related management and marketing issues to better achieve their marketing goals.
5.3. Limitations and Future Research Directions
This study also has certain limitations. First, this study adopts search-based goods as the research objects. Future research could select experience-based goods as the research objects and compare the similarities and differences in the influence of online rankings on consumers’ purchase decision-making between these two types of goods, thereby providing a more detailed product segmentation basis for marketers to formulate marketing plans. In addition, we have clarified that platform familiarity was assessed as part of our control check. Nevertheless, future research could continue to explore this factor by including specific measures of platform familiarity and investigating its potential moderating role in decision-making processes across different platform types.
Second, in the current experimental design, no other decision cues (e.g., brand, price, product description, or user reviews) were present, so product ranking was the only informative signal available. This cue-isolated environment maximizes internal validity and highlights the causal influence of ranking, but it also likely amplifies the observed effect relative to more realistic shopping contexts, where multiple cues interact to guide choice. At the same time, because brand, price, and review information were intentionally omitted, the cue-isolated design likely amplified the salience of ranking information relative to real-world shopping environments in which multiple cues compete for attention. Future studies could introduce additional decision cues and test whether ranking effects remain robust when cues are present or in conflict (e.g., high rank but high price, or low rank but strong brand), improving ecological validity and understanding of the incremental contribution of ranking.
Third, several studies have confirmed the influence of culture on consumer behavior. Future research could focus on a more in-depth exploration of how the online ranking mechanism influences the purchase decision-making and behavioral patterns of mobile consumers from different countries across regions. In addition, although using undergraduate participants is common in ERP research for practical reasons, our sample of Chinese university students may not fully represent more experienced or demographically diverse consumer groups. Future research should use more diverse samples, including a broader range of age groups and shopping experiences, to assess whether the observed effects generalize to other demographic groups. In particular, because the P3 effect reached only trend-level significance, the interpretation of a later evaluative stage should be considered preliminary and requires replication in future studies with larger samples and complementary task designs.
Finally, while the experimental environment mimicked a real mobile shopping platform and ERP experimental controls were implemented to minimize extraneous variables, the simulated shopping environment may reduce the ecological validity of our findings. Future studies could enhance ecological validity by using field or online experiments that link decision-making to real-world outcomes, thereby providing a more accurate representation of consumer behavior in naturalistic settings.
Author Contributions
Conceptualization, Y.L. and Q.C.; methodology, Y.L.; validation, Y.L.; formal analysis, Y.L. and W.Z.; investigation, Y.L. and W.Z.; data curation, Y.L.; writing—original draft preparation, Y.L.; writing—review and editing, Y.L. and Q.C.; funding acquisition, Y.L. All authors have read and agreed to the published version of the manuscript.
Funding
This research was funded by Fujian Philosophy and Social Science Planning Project, grant number FJ2025MGCA047, and the Humanities and Social Science Research Project of Fuzhou University.
Institutional Review Board Statement
The study was conducted in accordance with the Declaration of Helsinki and approved by the Institutional Review Board of the School of Economics and Management, Fuzhou University (1 April 2024), for studies involving humans.
Informed Consent Statement
Informed consent was obtained from all subjects involved in the study. Written informed consent has been obtained from the participants to publish this paper.
Data Availability Statement
The raw data supporting the conclusions of this article will be made available by the authors on request.
Conflicts of Interest
The authors declare no conflicts of interest.
References
- Statista. Monthly Active Users of Taobao App in China 2020–2025. 2025. Available online: https://www.statista.com/statistics/1327377/china-taobao-monthly-active-users/ (accessed on 15 April 2026).
- Fortune Business Insights. Mobile Commerce Market Size, Share & Industry Analysis and Regional Forecast, 2026–2034. Available online: https://www.fortunebusinessinsights.com/m-commerce-market-111886#:~:text=The%20growing%20adoption%20of%20mobile%20payment%20solutions,in%20Brazil)%2C%20further%20accelerates%20mobile%20transaction%20volumes (accessed on 23 April 2026).
- Ali, M.; Amir, H. Understanding consumer herding behavior in online purchases and its implications for online retailers and marketers. Electron. Commer. Res. Appl. 2024, 64, 101356. [Google Scholar] [CrossRef]
- Behlau, I.; Vogrincic-Haselbacher, C.; Krueger, J.I.; Corcoran, K.; Lurger, B.; Athenstaedt, U. Enhancing decision quality through computer-based decision aids: How promotional interventions and Need for Cognition shape effectiveness in online consumer choices. Front. Psychol. 2025, 16, 1576319. [Google Scholar] [CrossRef]
- Cooley, D.; Parks-Yancy, R. The effect of social media on perceived information credibility and decision making. J. Internet Commer. 2019, 18, 249–269. [Google Scholar] [CrossRef]
- Liu, Q.; Huang, S.; Zhang, L. The influence of information cascades on online purchase behaviors of search and experience products. Electron. Commer. Res. 2016, 16, 553–580. [Google Scholar] [CrossRef]
- Zhang, C.; Wang, Z. Research on the Influence of Individual Decision Reversal under an Information Cascade Reversal Scenario. Front. Econ. Manag. 2026, 7, 156–170. [Google Scholar]
- Chu, L.Y.; Nazerzadeh, H.; Zhang, H. Position ranking and auctions for online marketplaces. Manag. Sci. 2020, 66, 3617–3634. [Google Scholar] [CrossRef]
- Tecău, A.S.; Maican, C.I.; Ciobanu, E.; Schiopu, C.; Sumedrea, S.; Chițu, I.B.; Lixăndroiu, R.C.; Brătucu, G. From Emotion to Action: How Framed Sustainability Messages Trigger Physiological Reactions and Influence Consumer Choices. Behav. Sci. 2025, 15, 1611. [Google Scholar] [CrossRef] [PubMed]
- Duan, W.; Gu, B.; Whinston, A.B. Informational cascades and software adoption on the internet: An empirical investigation. MIS Q. 2009, 33, 23–48. [Google Scholar] [CrossRef]
- Li, Y.; Liu, Q.; Wu, J. Unveiling the secrets of online consumer choice: A deep learning algorithmic approach to evaluate and predict purchase decisions through EEG responses. Inf. Process. Manag. 2024, 61, 103671. [Google Scholar] [CrossRef]
- Park, J.; Park, J.; Yoon, H.J. The interaction effects of information cascades, system recommendations and recommendations on software downloads. Online Inf. Rev. 2019, 43, 728–742. [Google Scholar] [CrossRef]
- Wang, Q.; Meng, L.; Liu, M.; Wang, Q.; Ma, Q. How do social-based cues influence consumers’ online purchase decisions? An event-related potential study. Electron. Commer. Res. 2016, 16, 1–26. [Google Scholar] [CrossRef]
- Balapour, A.; Riedl, R. Ecological validity in neurois research: Theory, evidence, and a roadmap for future studies. J. Assoc. Inf. Syst. 2025, 26, 9–65. [Google Scholar] [CrossRef]
- Chen, X.; Zeng, M. Multimodal modeling of emotion regulation in interactive art therapy: EEG and PANAS-based dynamic simulation. Front. Psychol. 2025, 16, 1665506. [Google Scholar] [CrossRef] [PubMed]
- Solnais, C.; Andreu-Perez, J.; Sánchez-Fernández, J.; Andréu-Abela, J. The contribution of neuroscience to consumer research: A conceptual framework and empirical review. J. Econ. Psychol. 2013, 36, 68–81. [Google Scholar] [CrossRef]
- Genevsky, A.; Yoon, C.; Knutson, B. When brain beats behavior: Neuroforecasting crowdfunding outcomes. J. Neurosci. 2017, 37, 8625–8634. [Google Scholar] [CrossRef] [PubMed]
- Bhukya, R.; Paul, J. Social influence research in consumer behavior: What we learned and what we need to learn?–A hybrid systematic literature review. J. Bus. Res. 2023, 162, 113870. [Google Scholar] [CrossRef]
- Lee, Y.J.; Hosanagar, K.; Tan, Y. Do I follow my friends or the crowd? Information cascades in online movie ratings. Manag. Sci. 2015, 61, 2241–2258. [Google Scholar] [CrossRef]
- Liu, Q.; Zhang, X.; Li, Y. The influence of information cascades on online reading behaviors of free and paid e-books. Libr. Inf. Sci. Res. 2020, 42, 101001. [Google Scholar] [CrossRef]
- Mehrabian, A.; Russell, J.A. An Approach to Environmental Psychology; The MIT Press: Cambridge, MA, USA, 1974. [Google Scholar]
- Zhu, P.; Miao, C.; Wang, Z.; Li, X. Informational cascade, regulatory focus and purchase intention in online flash shopping. Electron. Commer. Res. Appl. 2023, 62, 101343. [Google Scholar] [CrossRef]
- Gao, B.; Hu, N.; Bose, I. Follow the herd or be myself? An analysis of consistency in behavior of reviewers and helpfulness of their reviews. Decis. Support Syst. 2017, 95, 1–11. [Google Scholar] [CrossRef]
- Pooja, K.; Upadhyaya, P. What makes an online review credible? A systematic review of the literature and future research directions. Manag. Rev. Q. 2024, 74, 627–659. [Google Scholar]
- Hunold, M.; Kesler, R.; Laitenberger, U. Rankings of online travel agents, channel pricing, and consumer protection. Mark. Sci. 2020, 39, 92–116. [Google Scholar] [CrossRef]
- Li, X.; Wu, L. Herding and social media word-of-mouth. MIS Q. 2018, 42, 1331–1352. [Google Scholar] [CrossRef]
- Zhao, L.; Fu, B.; Bai, S. Understanding the influence of personalized recommendation on purchase intentions from a self-determination perspective: Contingent upon product categories. J. Theor. Appl. Electron. Commer. Res. 2025, 20, 32. [Google Scholar] [CrossRef]
- Zhang, K.; Chen, X. Herding in a P2P lending market: Rational inference OR irrational trust? Electron. Commer. Res. Appl. 2017, 23, 45–53. [Google Scholar] [CrossRef]
- Kim, J.; Kwon, O.; Lee, D.H. Social influence of hubs in information cascade processes. Manag. Decis. 2017, 55, 730–744. [Google Scholar] [CrossRef]
- Pramanik, S.; Wang, Q.; Danisch, M.; Guillaume, J.L.; Mitra, B. Modeling cascade formation in Twitter amidst mentions and retweets. Soc. Netw. Anal. Min. 2017, 7, 41. [Google Scholar] [CrossRef]
- Dewan, S.; Ho, Y.J.; Ramaprasad, J. Popularity or proximity: Characterizing the nature of social influence in an online music community. Inf. Syst. Res. 2017, 28, 117–136. [Google Scholar] [CrossRef]
- Pan, B.; Hembrooke, H.; Joachims, T.; Lorigo, L.; Gay, G.; Granka, L. In Google we trust: Users’ decisions on rank, position, and relevance. J. Comput.-Mediat. Commun. 2007, 12, 801–823. [Google Scholar] [CrossRef]
- Ursu, R.M. The power of rankings: Quantifying the effect of rankings on online consumer search and purchase decisions. Mark. Sci. 2018, 37, 530–552. [Google Scholar] [CrossRef]
- Lee, E.; Lee, B. Herding behavior in online P2P lending: An empirical investigation. Electron. Commer. Res. Appl. 2012, 11, 495–503. [Google Scholar] [CrossRef]
- Aggarwal, A.G.; Aggarwal, S.; Jindal, V. Ranking of hotels using customer reviews: An LDA—Picture fuzzy TOPSIS approach. Int. J. Syst. Assur. Eng. Manag. 2025, 16, 1885–1898. [Google Scholar] [CrossRef]
- Chen, Y.; Yao, S. Sequential search with refinement: Model and application with click-stream data. Manag. Sci. 2017, 63, 4345–4365. [Google Scholar] [CrossRef]
- De Los Santos, B.; Koulayev, S. Optimizing click-through in online rankings with endogenous search refinement. Mark. Sci. 2017, 36, 542–564. [Google Scholar] [CrossRef]
- Fabre, L.; Feutren, T. How Emotions Influence Cognitive Control: A Within-Subject Investigation. Behav. Sci. 2026, 16, 89. [Google Scholar] [CrossRef]
- Lieberman, M.D. Social cognitive neuroscience: A review of core processes. Annu. Rev. Psychol. 2007, 58, 259–289. [Google Scholar] [CrossRef] [PubMed]
- Goto, N.; Mushtaq, F.; Shee, D.; Lim, X.L.; Mortazavi, M.; Watabe, M.; Schaefer, A. Neural signals of selective attention are modulated by subjective preferences and buying decisions in a virtual shopping task. Biol. Psychol. 2017, 128, 11–20. [Google Scholar] [CrossRef] [PubMed]
- Dennis, T.A.; Chen, C.C. Neurophysiological mechanisms in the emotional modulation of attention: The interplay between threat sensitivity and attentional control. Biol. Psychol. 2007, 76, 1–10. [Google Scholar] [CrossRef] [PubMed]
- Yuan, J.; Zhang, Q.; Chen, A.; Li, H.; Wang, Q.; Zhuang, Z.; Jia, S. Are we sensitive to valence differences in emotionally negative stimuli? Electrophysiological evidence from an ERP study. Neuropsychologia 2007, 45, 2764–2771. [Google Scholar] [CrossRef] [PubMed]
- Zubair, M.; Iqbal, S.; Usman, S.M.; Awais, M.; Wang, R.; Wang, X. Message framing and self-conscious emotions help to understand pro-environment consumer purchase intention: An ERP study. Sci. Rep. 2020, 10, 18304. [Google Scholar] [CrossRef] [PubMed]
- Huang, Y.X.; Luo, Y.J. Temporal course of emotional negativity bias: An ERP study. Neurosci. Lett. 2006, 398, 91–96. [Google Scholar] [CrossRef] [PubMed]
- Kappenman, E.S.; Farrens, J.L.; Zhang, W.; Stewart, A.X.; Luck, S.J. ERP CORE: An open resource for human event-related potential research. NeuroImage 2021, 225, 117465. [Google Scholar] [CrossRef] [PubMed]
- Nieuwenhuis, S.; Aston-Jones, G.; Cohen, J.D. Decision making, the P3, and the locus coeruleus--norepinephrine system. Psychol. Bull. 2005, 131, 510. [Google Scholar] [CrossRef] [PubMed]
- Reed, C.L.; Siqi-Liu, A.; Lydic, K.; Lodge, M.; Chitre, A.; Denaro, C.; Petropoulos, A.; Joshi, J.; Bukach, C.M.; Couperus, J.W. Selective contributions of executive function ability to the P3. Int. J. Psychophysiol. 2022, 176, 54–61. [Google Scholar] [CrossRef] [PubMed]
- Cutmore, T.R.; Muckert, T.D. Event-related potentials can reveal differences between two decision-making groups. Biol. Psychol. 1998, 47, 159–179. [Google Scholar] [CrossRef] [PubMed]
- Ito, T.A.; Thompson, E.; Cacioppo, J.T. Tracking the timecourse of social perception: The effects of racial cues on event-related brain potentials. Personal. Soc. Psychol. Bull. 2004, 30, 1267–1280. [Google Scholar] [CrossRef]
- Ma, Q.; Wang, X.; Dai, S.; Shu, L. Event-related potential N270 correlates of brand extension. Neuroreport 2007, 18, 1031–1034. [Google Scholar] [CrossRef] [PubMed]
- Pizzagalli, D.A. Electroencephalography and High-Density Electrophysiological Source Localization. In Handbook of Psychophysiology, 3rd ed.; Cambridge University Press: Cambridge, MA, USA, 2007; Volume 3, pp. 56–84. [Google Scholar]
- Salinsky, M.C.; Spencer, D.C.; Oken, B.S.; Storzbach, D. Effects of oxcarbazepine and phenytoin on the EEG and cognition in healthy volunteers. Epilepsy Behav. 2004, 5, 894–902. [Google Scholar] [CrossRef] [PubMed]
- Delorme, A.; Makeig, S. EEGLAB: An open source toolbox for analysis of single-trial EEG dynamics including independent component analysis. J. Neurosci. Methods 2004, 134, 9–21. [Google Scholar] [CrossRef] [PubMed]
- Chen, J.; Wu, Y.; Tong, G.; Guan, X.; Zhou, X. ERP correlates of social conformity in a line judgment task. BMC Neurosci. 2012, 13, 1–10. [Google Scholar] [CrossRef]
- Makeig, S.; Onton, J. ERP features and EEG dynamics: An ICA perspective. In Oxford Handbook of Event-Related Potential Components; Oxford University Press: Oxford, United Kingdom, 2011; pp. 51–86. [Google Scholar]
- Makeig, S.; Westerfield, M.; Jung, T.P.; Enghoff, S.; Townsend, J.; Courchesne, E.; Sejnowski, T.J. Dynamic brain sources of visual evoked responses. Science 2002, 295, 690–694. [Google Scholar] [CrossRef] [PubMed]
- Mehta, J.; Jerger, S.; Jerger, J.; Martin, J. Electrophysiological correlates of word comprehension: Event-related potential (ERP) and independent component analysis (ICA). Int. J. Audiol. 2009, 48, 1–11. [Google Scholar] [CrossRef] [PubMed]
- Benjamini, Y.; Hochberg, Y. Controlling the false discovery rate: A practical and powerful approach to multiple testing. J. R. Stat. Soc. Ser. B Methodol. 1995, 57, 289–300. [Google Scholar] [CrossRef]
- Huang, Y.; Liu, Y.; Song, W.; Liu, Y.; Wang, X.; Han, J.; Ye, J.; Han, H.; Wang, L.; Li, J.; et al. Assessment of cognitive function with sleep spindle characteristics in adults with epilepsy. Neural Plast. 2023, 2023, 7768980. [Google Scholar] [CrossRef] [PubMed]
- Carpenter, S.K.; Pan, S.C.; Butler, A.C. The science of effective learning with spacing and retrieval practice. Nat. Rev. Psychol. 2022, 1, 496–511. [Google Scholar] [CrossRef]
- Huang, Z.T.; Liang, Y.S.; Weinberg, C.B.; Gorn, G.J. The sleepy consumer and variety seeking. J. Mark. Res. 2019, 56, 179–196. [Google Scholar] [CrossRef]
- Song, X.J.; Hu, J.J. Neurobiological basis of emergence from anesthesia. Trends Neurosci. 2024, 47, 355–366. [Google Scholar] [CrossRef] [PubMed]
- Blankespoor, E.; Hendricks, B.E.; Miller, G.S. Perceptions and price: Evidence from CEO presentations at IPO roadshows. J. Account. Res. 2017, 55, 275–327. [Google Scholar] [CrossRef]
- Linke, L.; Saribay, S.A.; Kleisner, K. Perceived trustworthiness is associated with position in a corporate hierarchy. Personal. Individ. Differ. 2016, 99, 22–27. [Google Scholar] [CrossRef]
- Loewenstein, G.F.; Weber, E.U.; Hsee, C.K.; Welch, N. Risk as feelings. Psychol. Bull. 2001, 127, 267. [Google Scholar] [CrossRef] [PubMed]
- Guo, F.; Ding, Y.; Wang, T.; Liu, W.; Jin, H. Applying event related potentials to evaluate user preferences toward smartphone form design. Int. J. Ind. Ergon. 2016, 54, 57–64. [Google Scholar] [CrossRef]
- Jin, J.; Yu, L.; Ma, Q. Neural basis of intrinsic motivation: Evidence from event-related potentials. Comput. Intell. Neurosci. 2015, 2015, 698725. [Google Scholar] [CrossRef] [PubMed]

Disclaimer/Publisher’s Note: The statements, opinions and data contained in all publications are solely those of the individual author(s) and contributor(s) and not of MDPI and/or the editor(s). MDPI and/or the editor(s) disclaim responsibility for any injury to people or property resulting from any ideas, methods, instructions or products referred to in the content. |
© 2026 by the authors. Licensee MDPI, Basel, Switzerland. This article is an open access article distributed under the terms and conditions of the Creative Commons Attribution (CC BY) license.