Abstract
The significant growth in e-commerce has brought intense competition to the business sector. Businesses seeking to stand out in this competition are evaluated by customers not only by the quality of the products they sell, but also by their performance on digital platforms. To measure this evaluation, this study analyzed the website performance of 25 e-commerce companies in Türkiye using Multi-Criteria Decision Making (MCDM) methods with eleven technical and user-oriented performance criteria. MAXC (Maximum Criterion) and Skewness Impact Through Distributional Evaluation (SITDE) methods were used to determine the criterion weights of the websites, while CORASO (COmpromise Ranking from Alternative SOlutions) was used to rank the alternatives. According to the results, “total number of visitors” had the highest weight, while “bounce rate” had the lowest weight. According to the CORASO method, the top three performing e-commerce sites were EC1, EC2, and EC3, while the bottom three performing sites were EC11, EC14, and EC20.
1. Introduction
Computerized transactions are replacing traditional face-to-face commercial methods. Companies may now conduct business internationally on a small budget thanks to e-commerce. Additionally, e-commerce has given creative and aspirational entrepreneurs new business opportunities [1]. With the rapid development and global spread of the internet, e-commerce has come to the forefront and has become more preferred due to the benefits it provides to both businesses and consumers [2]. Buyers and sellers who are geographically separated may connect on a single platform, which saves money and time for both parties [3]. Thanks to e-commerce, which makes it much easier to reach customers compared to traditional commerce, businesses can also more easily maintain their existing market share [4]. Furthermore, e-commerce has enabled enterprises to grow into international marketplaces, making it simpler to contact new customers [5,6].
Websites have become extremely important today. As the platform where e-commerce takes place, a website enables interaction with existing and potential customers. In addition to engaging with consumers, it raises brand exposure and boosts revenue. The effectiveness of a company’s website is closely related to its e-commerce performance [7]. Customers’ perceptions of a company are greatly influenced not just by how effectively it operates but also by how well its website functions. Platforms with excellent content and a quick User Interface (UI) receive far better feedback from users [8,9]. Companies must constantly monitor and enhance their web presence [10] in order to stay ahead of the competition. Websites that are user-friendly, quick to load, and simple to use are typically preferred by users [11].
The most frequently used metric for measuring user interaction with a website is Largest Contentful Paint (LCP). LCP is an important metric for evaluating a website’s loading performance and understanding how quickly users can access the page’s main content. This metric shows how long it takes to load the main section of a web page. This time should be less than 2.5 s for the best user experience [12]. Even millisecond delays in site loading times challenge the patience of today’s consumers. In fact, surprising evidence indicates that the risk of losing a client increases by 8.3% even with a 0.1-s wait [13]. Although e-commerce is a relatively new phenomenon, its rapid rise to the center of the global economy is fundamentally due to its ability to make the shopping process effortless and accessible [11].
Today, the success of digital platforms depends on more than just technical proficiency. Success also depends on ongoing monitoring initiatives that are influenced by user feedback [11]. Rather than simply collecting data, this monitoring provides an opportunity to track users’ journeys on digital platforms and examine the behaviors they exhibit while browsing [14,15].
A one-second delay in website loading can cause a 7% decrease in sales. Therefore, Speed Index (SI) is a very important metric in measuring website performance. But using this metric alone to assess success is inaccurate [16,17]. More than half of users abandon a website if its main content takes longer than three seconds to load [18]. This term is referred to as Bounce Rate (BR) and this metric is also very important for business sustainability [19].
The COVID-19 pandemic, which swept the world at the end of 2019, ignited a major surge in digital platforms. The way traditional commerce was conducted was altered by developments in 2020 and 2021, which significantly contributed to the expansion of e-commerce [20]. Even Small and Medium-sized Enterprises (SMEs) with no prior e-commerce expertise have been forced to digitize to stay competitive in an environment of intense competition due to people’s growing preference for e-commerce [21]. The development of more comprehensive performance evaluation criteria has been made possible by these advancements in the digital world, which have made earlier performance metrics insufficient.
The Largest Contentful Paint (LCP) and Speed Index (SI) are two of these measures that are commonly used nowadays to measure the effectiveness of digital platforms. Because these methods contain technical details, they serve as guides for evaluators in performance measurements [11]. These metrics, however, are insufficient for assessing user experience. When criteria that also measure user experience are included in the process, performance analysis becomes quite complex. Performance analysis becomes quite complicated when factors that include measuring user experience are incorporated into the process. Thus, Multi-Criteria Decision Making (MCDM) approaches are commonly employed to address this complicated structure [22]. These methods not only solve complex problems but also guide managers in their decision-making processes [23].
The selection of the MAXC, SITDE, and CORASO methods in this study was driven by both methodological and empirical considerations. Regarding the weighting stage, established objective methods such as Entropy, CRITIC, and MEREC are well-validated but carry specific limitations in the present context. The Entropy method assigns higher weights to criteria with greater dispersion regardless of the direction of that dispersion, which can produce counterintuitive results when criterion distributions are strongly skewed. CRITIC incorporates both standard deviation and inter-criterion correlation, but its reliance on Pearson correlation makes it sensitive to outliers and assumes approximate normality in the data. MEREC employs a logarithmic removal-effect logic that performs well under symmetric distributions but does not explicitly model asymmetry. In contrast, MAXC determines weights through the maximum deviation principle, capturing discriminatory power in a computationally transparent manner, while SITDE directly addresses distributional skewness by adjusting weights according to the asymmetry of each criterion’s distribution. Given that web traffic and technical performance indicators such as Total Visits and Total Blocking Time exhibit pronounced right-skewed distributions, the MAXC-SITDE combination is empirically more appropriate than the aforementioned alternatives for the present dataset. Integrating the two methods through a multiplicative aggregation formula further ensures that criteria with low discriminatory power under either lens receive appropriately low composite weights.
Regarding the ranking stage, TOPSIS ranks alternatives solely by their geometric distance from the ideal and anti-ideal solutions without incorporating a compromise mechanism, which makes it susceptible to rank reversal when alternatives are added or removed. VIKOR produces a compromise ranking but requires the specification of a strategy weight parameter () that introduces subjectivity into an otherwise objective framework. WASPAS combines weighted sum and weighted product models but does not explicitly reference a worst-case solution, limiting its ability to penalize consistently poor performers. CORASO addresses these shortcomings by simultaneously measuring each alternative’s proximity to the best and distance from the worst reference points through a compromise-based aggregation that does not require user-defined parameters beyond the decision matrix itself. This property makes CORASO methodologically self-contained and particularly suitable for objective, data-driven performance evaluations such as the present study.
This study contributes to the literature on evaluating the website performance of e-commerce companies in Türkiye both methodologically and theoretically. Previous studies have shown that the quality and performance indicators of e-commerce websites are mostly considered through limited dimensions such as usability, accessibility, design quality, or user experience [24,25]. However, the existing literature shows a limited number of studies integrating user traffic and interaction indicators with technical web performance indicators within the same analytical framework [11,22,26]. Accordingly, this study evaluates the website performance of 25 e-commerce companies operating in Türkiye, considering eleven criteria consisting of both technical performance and user-based indicators. Furthermore, the Maximum of Criterion (MAXC) and Skewness Impact Through Distributional Evaluation (SITDE) methods were used together for criterion weighting, and the COmpromise Ranking from Alternative Solutions (CORASO) method was preferred for ranking the e-commerce companies. In this respect, the study reveals the comparative performance of e-commerce companies while also providing an empirical framework for prioritizing the criteria that determine website performance in the digital competitive environment.
An examination of the existing MCDM-based website evaluation literature reveals two notable limitations. First, the majority of prior studies rely on conventional weighting methods such as AHP, TOPSIS, or VIKOR, which do not account for distributional asymmetry in criterion data, a particularly relevant concern given the skewed nature of web traffic and technical performance indicators. Second, no previous study has simultaneously integrated user traffic metrics and technical web performance indicators within a single analytical framework applied to Turkish e-commerce companies. The present study addresses both gaps by proposing a novel hybrid framework that combines MAXC, SITDE, and CORASO. MAXC determines criterion weights through the maximum deviation principle, offering a computationally efficient alternative to established methods. SITDE complements this by explicitly adjusting weights to reflect the skewness of each criterion’s distribution, thereby preventing asymmetric data from distorting the weighting process. CORASO then ranks the alternatives through a compromise-based mechanism that simultaneously references both the best and worst observed performance values, reducing the rank reversal risk documented in methods such as TOPSIS and VIKOR. To the best of the authors’ knowledge, this specific combination has not previously been applied to e-commerce website performance evaluation, constituting a methodological contribution that extends the literature for both MCDM and digital performance assessment.
2. Literature Review
2.1. Literature on Website Performance
With the rapid increase in digitalization, websites have become an important platform for businesses to communicate with their customers. Especially in banking, tourism, and e-commerce, websites which have reached a large user base directly affect a business’s corporate image and, consequently, their performance. For this reason, the content, technical performance, and customer experience aspects of websites have been the subject of numerous studies in the literature.
A significant portion of website performance evaluations have been conducted using a content analysis approach. Studies focusing particularly on businesses operating in the service sector have prioritized the analysis of business websites [27,28]. Bayram & Yaylı [27], who examined hotel websites in Türkiye using content analysis, evaluated the type and frequency of use of features found on the websites, while Dalgın & Karadağ [28] analyzed the websites of restaurants operating in Bodrum and Marmaris. While these studies highlight the importance of websites in terms of digital visibility in the service sector, they have addressed the impact of the criteria examined on business performance to a limited extent.
In order to measure the success of a website, many factors must be evaluated simultaneously. These criteria comprise a multi-dimensional structure including speed, usability, security, accessibility, technical infrastructure, and customer interaction. The desire to analyze this multi-dimensional structure has increased the use of MCDM methods in measuring website performance. Aydın & Kahraman [24] evaluated the websites of e-commerce companies using the Fuzzy AHP (Analytic Hierarchy Process) approach, allowing the inclusion of multiple decision-maker opinions in the model. Similarly, Cavlak [29] analyzed the preference for online shopping sites using the AHP method and concluded that reliability/privacy criteria are the most important factors in user preferences.
MCDM techniques have been expanded and applied in research in this area due to their growing effectiveness in evaluating website performance. The banking sector has become one of the leading actors in digitalization, leading to an increase in studies examining this area. Özdemir & Turna [30] examined the website performance of commercial banks using AHP, TOPSIS (Technique for Order of Preference by Similarity to Ideal Solution), and VIKOR methods, while Maruf & Özdemir [31] used SWARA (Stepwise Weight Assessment Ratio Analysis) and ARAS (Additive Ratio Assessment) methods. Both studies concluded that page speed is the most important criterion. Another sector experiencing intense digitalization is logistics. The website performance of businesses operating in this sector has also been the subject of studies. Özbek & Engür [32] evaluated the quality of websites of businesses operating in the logistics sector using the ARAS method and, based on the results of this study, revealed that the websites of businesses in this sector do not have a standard structure and that concrete criteria need to be determined in order to conduct an evaluation.
The e-commerce sector is gaining increasing interest from academic researchers in this field due to its high growth during the COVID-19 pandemic. Along with this increased interest, studies have been conducted that in-depth analyze the websites of e-commerce companies using both technical and user-centric criteria. Bulak et al. [33] evaluated the leading e-commerce sites in Türkiye in terms of traffic using AHP and TOPSIS methods based on user data. Similarly, Maruf [22] analyzed the performance of e-commerce sites in Türkiye using SWARA and WASPAS (Weighted Aggregated Sum Product Assessment) methods and determined that full load time and coefficient of performance criteria stood out. Kar et al. [26], on the other hand, used eight criteria to analyze the website performance of the most popular e-commerce businesses in Türkiye. The authors used the AHP approach to determine the criterion weights and the TOPSIS method to rank the alternatives. Similarly, Gupta et al. [11] emphasized that technical performance indicators such as Largest Contentful Paint, First Input Delay, and Cumulative Layout Shift are critically important for user experience and system efficiency in e-commerce applications.
Şahin & Sara [25] examined websites in the shopping sector using the VIKOR method in light of user experiences and concluded that user preferences are an important criterion for website performance. Li & Sun [3] evaluated the factors necessary for a successful B2C e-commerce website design using Fuzzy AHP and Grey-TOPSIS methods and concluded that service quality is the most important factor determining website performance. These studies show that user experience, in addition to technical indicators, is of great importance in measuring website performance.
MCDM’s success in measuring website performance has led to its widespread use in many sectors, from public services to sports clubs. Akgül [34] examined 112 websites integrated with the “E-Government” application used for citizenship procedures in Türkiye using content analysis and concluded that these sites needed improvement in usability and readability. Kara et al. [35] examined the website performance of football clubs in the Turkish Super League using SWARA and WASPAS methods and concluded that club performance was the most influential criterion on website performance. Yeşilkaya [36], on the other hand, evaluated the website performance of furniture businesses using AHP, TOPSIS, VIKOR, Fuzzy TOPSIS and Fuzzy VIKOR methods.
2.2. Methodological Literature on MCDM Approaches
MAXC (Maximum of Criterion) is a modern objective criteria-weighting method created by Gligorić et al. [37]. As a new method, MAXC represents an important area of research for testing different decision problems. Integrating the MAXC method with the TODIFFA (the total differential of alternative) approach, the authors examined the selection of deep learning platforms based on technical, operational, and economic criteria. The robustness analysis conducted in the study shows that the MAXC method has the ability to obtain reliable and stable results.
Aydın [38] evaluated financial and non-financial ESG performance using the MAXC method in the banking sector. In the study, which was conducted using data from a bank operating in Türkiye for the period 2012–2022, the MAXC method was used to objectively determine the criterion weights, and it was concluded that return on assets, return on equity, and the non-performing loan ratio stood out in terms of financial performance, while social participation, governance quality, and human resources stood out in the ESG dimension.
Puška et al. [39] developed CORASO (COmpromise Ranking from Alternative Solutions), a current ranking method for decision-making in fuzzy environments. First applied in the evaluation of 8 different drone alternatives, this method is used as a flexible, fuzzy-based ranking method in multi-criteria decision problems. A crisp (exact) version of the method was introduced a year later by Puška [40] and used in the selection of customer relationship management systems. Another study using the CORASO method was conducted by Tufan & Ulutaş [41]. The supplier selection problem of a dairy and dairy products company was analyzed using LODECI (LOgarithmic DEcision-making with Cross-entropy Information) and CORASO methods. In the study, where cost, quality, delivery, financial strength, and capacity criteria were evaluated, supplier coded “MSU2” was determined as the best alternative, while “MSU4” was the supplier with the lowest performance.
Asymmetry in criteria distributions can be disregarded by the majority of conventional criterion weighting techniques. However, the SITDE (Skewness impact through distributional evaluation) method developed by Gopisetty & Sama [42] allows calculations taking into account asymmetry in the criterion distribution. The authors aimed to produce more balanced and reliable criterion weights by considering the effect of skewed data distributions on the decision-making process. They tested the effectiveness of his method on the electric vehicle selection problem and emphasized that this method can improve decision quality, especially in datasets with asymmetric distributions. This method was used in Yalçın’s [43] study to determine the financial performance of firms, and in Kumar et al. [44] aimed to rank global banks according to their financial performance. Although it is a new method and has been used in limited studies, its use in different fields such as electric vehicles and financial performance shows that this method can provide solutions to a wide range of decision-making problems. However, there is still a need for research to test this method on different decision problems.
Website performance has been the subject of numerous studies, both in terms of methodology and the criteria considered. The criteria used to measure website performance are inherently multidimensional, and MCDM methods are quite suitable for analyzing these criteria. However, an examination of existing studies in the field reveals that traditional MCDM methods are often preferred, and the evaluation criteria are relatively superficial. Customer experience is an important factor that should not be disregarded, especially when analyzing the success of organizations, even if website performance is a technical subject. In this regard, the present study fills a gap in the literature by integrating technical and customer experience criteria, comparatively ranking alternative e-commerce businesses, and offering a systematic evaluation framework using current and new methods compared to traditional MCDM methods.
3. Methodology
The three methods employed in this study operate in a sequential and complementary fashion. In the first stage, the MAXC method identifies the relative importance of each criterion by measuring how far each alternative deviates from the maximum observed value: Criteria that produce greater variation across alternatives are assigned higher weights, as they carry more discriminatory power. In the second stage, the SITDE method refines these weights by incorporating the skewness of each criterion’s distribution, ensuring that asymmetrically distributed data do not distort the weighting process. Finally, the CORASO method uses the integrated weights to rank the alternatives by simultaneously measuring their proximity to the best and distance from the worst performance values. This sequential structure ensures both statistical robustness and methodological transparency.
This study uses criterion weighting (MAXC and SITDE) methods to analyze the performance of digital platforms of e-commerce companies and the CORASO method for ranking the companies. The data used in the study was obtained from the websites “similarweb.com” and “gtmetrix.com” in November 2025.
3.1. MAXC Method
The MAXC Method is a technique used to determine criterion weights in decision-making problems. It was introduced to the literature by [37]. The steps of the MAXC method are outlined below [37].
Step 1: Initially, a decision matrix is systematically arranged. The decision matrix is presented in the subsequent equation.
Step 2: Equation (2) is used to normalize this matrix.
Step 3: The maximum value for each criterion is computed as
Step 4: Distances are computed as
Step 5: Expected distance values are calculated as
Step 6: The weights of the criteria according to the MAXC method are computed as
3.2. SITDE Method
The SITDE method is an objective weighting technique that accounts for the coefficients of the skewness related to the attributes. The subsequent steps delineate this method [43].
Step 1: The decision matrix is constructed and presented in Equation (1).
Step 2: This decision matrix is standardized using Equations (7) and (8). Equation (7) is used for normalizing non-beneficial attributes, whereas Equation (8) is applied for normalizing beneficial attributes.
Equations (7) and (8) illustrate that is a non-beneficial attribute, while is a beneficial attribute.
Step 3: Equation (9) computes the skewness values () for the attributes.
In Equation (9), and represent the mean value and the standard deviation of attribute j, respectively.
Step 4: The normalized skewness for each attribute is computed as described below.
Step 5: The attribute weights () are determined in accordance with the SITDE methodology as outlined below.
The criteria weights derived from the MAXC technique and those from the SITDE approach are amalgamated using the subsequent equation [45]
The shown in Equation (12) indicates the integrated weight of criterion . Upon acquiring the integrated weights, the CORASO approach is employed to prioritize the alternatives.
3.3. CORASO Method
Firstly, the CORASO method, used by [39] to rank drones for use in agriculture and select the most suitable ones, was developed to offer decision-makers an innovative approach to ranking alternatives based on multiple evaluation criteria. It was developed to compare each alternative with the best or worst values for each criterion. To be the best alternative, the alternative must be as close as possible to the highest value and as far as possible from the lowest value. The method’s clarity and simplicity of application facilitate the decision-making process [39]. The steps of this method are as follows:
Step 1: Forming the decision matrix. The decision matrix is presented in Equation (1).
Step 2: Normalise the decision matrix.
Step 3: The integrated weights of the criteria and the normalized values of the alternatives are multiplied using the following equation.
Step 4: Calculation of total values.
Step 5: Calculation of deviations from alternative solutions.
Step 6: Determining the value of the CORASO method.
Finally, the option with the highest total score is considered the best option.
4. Application
4.1. Data and Criteria
The data used in this study was retrieved from two widely utilized web analytics platforms: similarweb.com and gtmetrix.com. Similarweb.com provided traffic-related indicators including global rank, country rank, total visits, visit duration, pages per visit, and bounce rate. These metrics are derived from a combination of internet service provider data, panel data, and web crawling, and are updated on a monthly basis. Gtmetrix.com supplied the technical performance indicators, namely Largest Contentful Paint, overall performance score, speed index, accessibility score, and total blocking time, which are measured through automated browser-based testing. It should be acknowledged, however, that both platforms have inherent limitations. Similarweb.com estimates traffic data through statistical modeling rather than direct measurement, which may introduce sampling bias, particularly for lower-traffic websites. Gtmetrix.com test results may vary depending on server load conditions and the geographic location of the test server at the time of measurement. These limitations are consistent with those reported in prior studies utilizing similar data sources and should be considered when interpreting the findings.
The data for November 2025 for the websites utilized in this study was supplied gratuitously by similarweb.com and gtmetrix.com. A total of twenty-five websites were selected. Eleven criteria believed to influence website performance were employed in the study. These criteria are global rank (GR), country rank (CR), total visits (TV), visit duration (VD), pages per visit (PPV), bounce rate (BR), Largest Contentful Paint (LCP), performance (P), speed index (SI), accessibility (AC) and total blocking time (TBT). Five of these criteria were deemed beneficial—TV, VD, PPV, P, and AC—whereas six were regarded as non-beneficial. Higher values for beneficial criteria indicate better performance, while lower values for non-beneficial criteria are perceived positively. GR and CR are considered non-beneficial because they are ranked indicators, with smaller values representing a stronger position among websites at both global and national levels. The BR value, indicating the exit rate from a website without meaningful interaction, has a negative connotation for higher values, and therefore this criterion is also considered non-beneficial in the study. The same logic applies to the SI, LCP, and TBT criteria, which are technical performance metrics considered non-beneficial in the study. LCP, which measures the time it takes for the main visible content of a page to load; SI, which shows how fast the page content becomes visually usable during loading; and TBT, which shows the time it takes for a page to respond to user input, are considered non-beneficial criteria because lower values indicate faster loading, higher responsiveness, and a smoother user experience. These criteria were therefore coded as non-beneficial criteria in the analysis. The non-beneficial criteria are as follows: GR, CR, BR, LCP, SI and TBT. Table 1 shows these criteria and their definitions.

Table 1.
Criteria and Their Definitions.
The study evaluated 25 E-Commerce companies. This sample consists of 25 widely recognized e-commerce sites in Türkiye that are complete and comparable across all 11 criteria identified in the analysis. Therefore, the sample does not represent an official ranking of the 25 most visited platforms in Türkiye, but rather a group of prominent e-commerce sites. The 25 e-commerce websites included in this study were selected through a purposive sampling procedure based on two objective criteria. First, only websites ranked among the top 500 in the SimilarWeb country ranking for Türkiye as of November 2025 were considered eligible, ensuring that the sample reflects the most visible and actively trafficked e-commerce platforms in the Turkish market. Second, data completeness was verified across all eleven criteria on both SimilarWeb and GTmetrix prior to final inclusion; any website for which one or more criterion values were unavailable or flagged as unreliable was excluded. Applying these two criteria yielded a final sample of 25 websites that are both representative of the active Turkish e-commerce landscape and analytically comparable in terms of data availability. The names and codes of these companies are presented in Table 2.
Table 2.
E-Commerce Companies and Codes.
Table 3 presents the decision matrix comprising 25 e-commerce companies (EC1–EC25) evaluated across 11 criteria. The raw data were collected from similarweb.com and gtmetrix.com for November 2025. As observed in the table, EC1 (trendyol.com) and EC2 (sahibinden.com) exhibit notably higher total visit values compared to the remaining alternatives, while companies such as EC25 (dolap.com) record considerably lower traffic figures. This initial overview suggests substantial performance heterogeneity among the evaluated companies.
Table 3.
The Decision Matrix.
4.2. Criteria Weighting Results
The criteria weights, as determined by the MAXC method, were derived by initially implementing the MAXC method. After this, the weights of the criteria were derived by implementing the steps of the SITDE approach. The criteria weights derived from these two methods are ultimately amalgamated using Equation (12). Table 4 presents the results of these methods together with the integrated weights.
Table 4.
The Results of MAXC and SITDE Methods.
Table 4 reports the criterion weights derived from the MAXC and SITDE methods, along with the integrated weights calculated using Equation (12). The results indicate that Total Visits (TV) carries the highest integrated weight (0.2827), followed by Total Blocking Time (TBT) (0.2205) and Speed Index (SI) (0.1292). Accessibility (AC), by contrast, received the lowest weight (0.01), suggesting that among the evaluated criteria, user traffic and technical loading performance are the most decisive factors in differentiating website performance.
4.3. Alternative Ranking Results
Following the acquisition of the integrated weights of the criteria, the CORASO approach is employed to assess e-commerce companies. As the first step of the CORASO method, the values in Table 3 are normalized by applying Equations (13) and (14). Table 5 presents the normalized values.
Table 5.
The Normalized Values.
Table 5 displays the normalized decision matrix obtained by applying Equations (13) and (14) to the raw data. Values range between 0 and 1, where 1 represents the best performance for a given criterion. EC1 achieves the maximum normalized value for the Total Visits criterion, while EC9 and EC22 reach the highest normalized scores for LCP. These normalized values form the basis for the subsequent weighted scoring procedure.
Equation (15) produces weighted normalized values. Table 6 presents the weighted normalized values.
Table 6.
The Weighted Normalized Values.
Table 6 presents the weighted normalized values obtained by multiplying each normalized value by the corresponding integrated criterion weight. The dominant influence of TV and TBT weights is clearly reflected here: EC1 attains the highest weighted score under TV (0.2827), while EC16 stands out with the highest weighted value under TBT (0.2205). These values are aggregated in the next step to compute the overall performance scores for each alternative.
Equation (16) determines the total values. Equations (17) and (18) determine deviations from alternative solutions. Equation (19) calculates the value of the CORASO method. Table 7 presents the results of the CORASO method.
Table 7.
The Results of CORASO Method.
Table 7 presents the final rankings of the 25 e-commerce companies based on the CORASO method. EC1 (trendyol.com) achieves the highest Qi value (0.6755), ranking first overall, while EC11 (migros.com.tr) records the lowest Qi value (−0.7132), placing last. Positive Qi values indicate alternatives that perform closer to the best solution, whereas negative values reflect alternatives that deviate substantially from optimal performance. The results reveal a clear performance stratification among the companies, with the top five positions occupied by EC1, EC2, EC3, EC5, and EC16.
4.4. Comparative Analysis and Sensitivity Analysis
To assess the reliability and consistency of the CORASO rankings, the results were benchmarked against five alternative MCDM methods, and a Monte Carlo-based sensitivity analysis was subsequently conducted. Table 8 presents the performance rankings of 25 e-commerce companies based on the CORASO method, along with results obtained using the COPRAS (COmplex PRoportional Assessment) developed by Zavadskas et al. [46], ARAS (Additive Ratio Assessment) developed by Zavadskas et al. [47], MARCOS (Measurement of alternatives and ranking according to COmpromise solution) developed by Stević et al. [48], CRADIS (compromise ranking of alternatives from distance to ideal solution) developed by Puška et al. [49], and ALPAS (The Alternative Prioritization and Assessment System) developed by Ulutaş et al. [50] methods for comparison purposes.
Table 8.
The Comparison of MCDM Methods.
Table 8 compares the rankings produced by the CORASO method with those obtained from five widely used MCDM methods: COPRAS, ARAS, MARCOS, CRADIS, and ALPAS. EC1 consistently occupies the first position across all six methods, while EC11 and EC14 are persistently ranked among the lowest performers.
However, the rankings of some companies have changed slightly depending on the methods used. The COPRAS method made bigger differences in the rankings of companies like EC7, EC22, and EC6 than other methods did. On the other hand, the fact that companies like EC11, EC14, and EC20 were consistently ranked lower across all methods suggests that weak alternatives were also consistently found. Overall, CORASO’s ability to give stable results at extreme values and its lack of excessive sensitivity to alternatives in the middle ranks show that the method can be used as a balanced and strong MCDM method for evaluating the performance of e-commerce companies.
In this study, there was also a sensitivity analysis. The Monte Carlo simulation was used to create fifty different scenarios for the weight of the criteria. The sensitivity analysis results are shown in Figure 1.
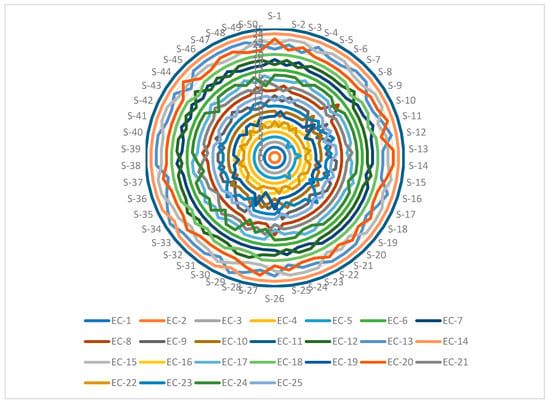
Figure 1.
The Results of the Sensitivity Analysis.
The sensitivity analysis results, which came from a Monte Carlo simulation, show that the CORASO algorithm’s ranks stay pretty much the same no matter how the weights are set. When looking at the ranking curves for each option (EC1–EC25) across a lot of different situations (S-1–S-50) in the diagram, it becomes clear that the rankings of businesses that are very high stay pretty steady. High-performing organizations like EC1, EC2, EC3, and EC4 showed very little change between scenarios and mostly kept their overall rating tiers. This study shows that the CORASO method is not very sensitive to random changes in criterion weights and that the results of the method keep their structure.
On the other hand, some companies that were rated in the middle have shown more volatility when it comes to scenarios. Still, these changes have not caused any big changes in the positions of the best and worst performing groups at the ends of the ranking. The fact that companies at the bottom of the ranking mostly stayed there throughout the scenarios suggests that the alternatives with poor performance were consistently identified. Overall, the Monte Carlo simulation-based sensitivity analysis strongly supports the CORASO method’s ability to produce reliable results even when there are uncertainties about the weights. It also shows that the CORASO method can be used as a reliable decision support tool for evaluating the performance of e-commerce companies.
5. Discussion and Conclusions
In this study, 25 Turkish e-commerce business websites are assessed using MCDM methods. MAXC and SITDE methods were used to evaluate criterion weights, and the CORASO method was used to rank the e-commerce companies. The study used a total of 11 criteria, including those for measuring the technical performance of websites and those for measuring user experience.
The analysis results show that the website performance of e-commerce companies in Türkiye is determined by different criteria. According to the CORASO method results, EC1 (trendyol.com), EC2 (sahibinden.com), and EC3 (hepsiburada.com) are the top three performing companies. The top three rankings of EC1, EC2, and EC3 can be attributed to their superior performance compared to competitors in the technical performance and user interaction indicators considered in the analysis. All three websites have lower, and therefore more positive, scores in the non-beneficial criteria of Largest Contentful Paint (LCP), Speed Index (SI), Total Blocking Time (TBT), and Bounce Rate (BR). However, they achieved higher performance than their competitors in the Performance (P), Accessibility (AC) and Pages per Visit (PPV) criteria, which are considered beneficial criteria and show user engagement patterns. Taken together, the higher rankings of EC1, EC2, and EC3 in the study can be attributed to faster page loading performance, lower latency, and more positive user behavior indicators.
A closer examination of the criterion-level data reveals how the three most influential criteria, namely Total Visits (TV), Total Blocking Time (TBT), and Speed Index (SI), shaped the final rankings. TV, which carried the highest integrated weight in the study, reflects the aggregate market reach of each platform. EC1 (trendyol.com) and EC2 (sahibinden.com) recorded substantially higher monthly visitor volumes than the rest of the sample, establishing a performance gap that no combination of technical scores alone could offset. This finding is specific to the present dataset and differs from prior Turkish e-commerce website evaluations such as Maruf [22] and Kar et al. [26], in which technical performance indicators carried the highest weights, suggesting that the dominant differentiating criterion may vary depending on the weighting methodology employed.
TBT, which carried the second-highest weight, measures the total duration during which the browser’s main thread is blocked and unable to respond to user input. Lower TBT values indicate a more responsive interface and a smoother interactive experience. The top-ranked websites consistently recorded TBT values below 100 ms, whereas several mid- and low-ranked platforms exceeded 300 ms, a threshold above which users typically perceive noticeable input lag. This criterion therefore acted as a secondary differentiator that separated technically optimized platforms from those with heavier JavaScript execution loads.
SI, which reflects the speed at which page content becomes visually complete during loading, further reinforced the rankings by penalizing websites with high rendering latency. Platforms ranked in the lower half of the sample recorded SI values exceeding 3 s, a range associated with substantially higher user abandonment rates. The convergence of high TV, low TBT, and low SI in the top-ranked websites illustrates that superior e-commerce website performance in the Turkish market is not attributable to any single dimension but rather to the simultaneous optimization of market reach, interactive responsiveness, and visual loading speed.
EC11 (migros.com.tr), EC14 (pttavm.com) and EC20 (koctas.com.tr) were the lowest-ranked businesses. High bounce rates and poor technical performance played a major role in the failure of these businesses’ e-commerce platforms. The study results once again demonstrate that measuring a website’s performance is a complex process and it cannot be done with just a few metrics. The government-funded website Pttavm.com and the online retailers koctas.com.tr and migros.com.tr, which have a typical retail approach, are at the bottom of the list. This ranking reveals that e-commerce and website performance are constantly changing, and businesses that can adapt to customer needs and evolving trends perform better.
This research makes a significant contribution to the relevant literature due to the methodologies employed and the criteria it uses, which are based on both technical and user experience. The findings of this study highlight the need to examine website performance not only through technical indicators but also through performance criteria that consider user experience. In this respect, our study is consistent with the work of Aydın & Kahraman [24], who concluded that measuring e-commerce website quality should be considered a multi-criteria decision problem. In addition, the results obtained in this study support Şahin & Sara’s [25] emphasis on user-centered evaluation and website usability. It also aligns with the findings of Gupta et al. [11] regarding technical metrics used to examine website performance. However, by taking into account both technical indicators and consumer satisfaction, our study goes beyond the existing approach in the literature.
The results are consistent with the study by Li & Sun [3], which argues that the success of e-commerce websites depends on multiple factors and therefore a multidimensional evaluation is necessary. In this study, a total of 11 criteria were used to measure website performance, incorporating both technical and user experience dimensions into the analysis, thus ensuring a more comprehensive performance measurement.
Finally, the findings of this study are consistent with the results of Kar et al. [26]. This study, which evaluates the website performance of e-commerce companies using the AHP-TOPSIS framework, supports the necessity of evaluating e-commerce website performance through a multidimensional decision-making structure. However, our current study differs from Kar et al. [26] by using a broader set of eleven criteria in total, employing secondary data instead of expert opinions, and applying hybrid MAXC-SITE-CORASO methods.
The results of this study contribute to the literature and offer practical implications for e-commerce managers, digital marketing teams, and website developers. The findings clearly demonstrate that measuring strong website performance solely through technical analysis or solely through user experience is insufficient. The higher rankings of trendyol.com, sahibinden.com, and hepsiburada.com show that competitive performance in e-commerce is possible through the combined contribution of technical efficiency, accessibility, and positive user interaction.
When evaluated for e-commerce managers, these findings can guide the identification of priority areas for resource allocation. Websites with high traffic but low technical scores need to prioritize improvements in page load speed, reduced latency, and increased accessibility to maintain their competitive position, rather than relying solely on market visibility. Similarly, companies with weak engagement indicators should invest in improving their website structure and product presentations to encourage higher user engagement. The relatively low rankings of migros.com.tr, pttavm.com, and koctas.com.tr demonstrate that an established retail presence, corporate support, or brand awareness may not always translate into superior digital performance. To sustain these advantages on digital platforms, they need to be supported by continuously improved online shopping experiences.
When the findings are evaluated for digital marketing teams, BR and TV criteria may be of significant importance. Designing the landing page, product content, and campaign messages to be eye-catching and relevant to the visitor profile can help reduce bounce rates, while engaging designs and clear, attractive campaign messages can also increase VD. Users who spend more time on the site may also explore different categories and exhibit additional product purchasing behavior.
Finally, when interpreting the results for website developers, paying attention to the LCP, SI, TBT, P, and AC technical indicators will undoubtedly improve website performance. Websites with high rankings in these criteria represent superior performance, meaning faster loading, shorter blocking times, and higher accessibility, contributing to a smoother user experience. Website developers can improve website performance by considering these indicators and optimizing display, minimizing code, and reducing the use of unnecessary scripts.
This study also introduces a new methodological approach to literature. Criterion weighting was performed using the MAXC and SITDE methods. Subsequently, alternatives were ranked using the CORASO method. This provides a systematic and holistic decision support mechanism. The use of the SITDE method allowed for the consideration of potential distribution differences in website performance data. However, our study has several limitations. The first limitation is that the study examines e-commerce companies in Türkiye and that the data is from November 2025. Future research could analyze the websites of internationally operating e-commerce companies in different countries using data from various time periods. This approach would facilitate obtaining more generalizable results in subsequent studies.
Secondly, the data used in the analysis was collected in November 2025. Since website performance is dynamic, the rankings reflect the positions of selected e-commerce websites over a specific period. Technical updates, seasonal campaigns, and changes in customer expectations all have the potential to impact website performance. Future research could examine changes in company rankings using long-term datasets to analyze website performance and minimize the impact of technical updates and seasonal campaigns.
Author Contributions
Conceptualization, E.Ö. and H.Ü.; methodology, A.U.; formal analysis, A.U.; investigation, E.Ö., A.U. and H.Ü.; writing—original draft preparation, E.Ö., A.U. and H.Ü.; writing—review and editing, E.Ö., A.U. and H.Ü.; project administration, E.Ö., A.U. and H.Ü. All authors have read and agreed to the published version of the manuscript.
Funding
This study was supported by the Scientific Research Projects Coordination Unit of İnönü University (Project No: 4885).
Institutional Review Board Statement
Not applicable.
Informed Consent Statement
Not applicable.
Data Availability Statement
The raw data supporting the conclusions of this article will be made available by the authors on request.
Conflicts of Interest
The authors declare no conflicts of interest.
References
- Elibol, H.; Kesici, B. Çağdaş işletmecilik açısından elektronik ticaret. Selçuk Üniversitesi Sos. Bilim. Enstitüsü Derg. 2004, 11, 303–329. [Google Scholar]
- Marangoz, M.; Yesildag, B.; Saltik, I.A. A Research on web and social network sites of e-commerce enterprises by content analysis method. J. Internet Appl. Manag. 2012, 3, 53–78. [Google Scholar] [CrossRef][Green Version]
- Li, R.; Sun, T. Assessing Factors for Designing a Successful B2C E-Commerce Website Using Fuzzy AHP and TOPSIS-Grey Methodology. Symmetry 2020, 12, 363. [Google Scholar] [CrossRef]
- Šaković Jovanović, J.; Vujadinović, R.; Mitreva, E.; Fragassa, C.; Vujović, A. The Relationship between E-Commerce and Firm Performance: The Mediating Role of Internet Sales Channels. Sustainability 2020, 12, 6993. [Google Scholar] [CrossRef]
- Gregory, G.D.; Ngo, L.V.; Karavdic, M. Developing e-commerce marketing capabilities and efficiencies for enhanced performance in business-to-business export ventures. Ind. Mark. Manag. 2019, 78, 146–157. [Google Scholar] [CrossRef]
- Huang, J.; Jiang, X.; Tang, Q. An e-commerce performance assessment model: Its development and an initial test on e-commerce applications in the retail sector of China. Inf. Manag. 2009, 46, 100–108. [Google Scholar] [CrossRef]
- Aziz, U.A.; Wibisono, A.; Nisafani, A.S. Measuring the quality of e-commerce websites using analytical hierarchy process. TELKOMNIKA Telecommun. Comput. Electron. Control 2019, 17, 1202. [Google Scholar] [CrossRef]
- Andry, J.F.; Loisa, J. The e-commerce potentıal for home-based busınesses: A case study. J. Ilm. FIFO 2016, 8, 139. [Google Scholar] [CrossRef]
- Başeğmez, H.; Özdemir, K. Website Performance Evaluation by Grey Relational Analysis: A Research on Companies in BIST Technology and Informatics Index. Acta Infologica 2023, 7, 47–58. [Google Scholar] [CrossRef]
- Vatansever, K.; Akgűl, Y. Performance evaluation of websites using entropy and grey relational analysis methods: The case of airline companies. Decis. Sci. Lett. 2018, 7, 119–130. [Google Scholar] [CrossRef]
- Gupta, S.; Khanna, P.; Kumar, S.; Pragya. E-commerce Website Performance Evaluation: Technology, Strategy and Metrics. Asian J. Res. Comput. Sci. 2024, 17, 114–125. [Google Scholar] [CrossRef]
- Stringam, B.; Gerdes, J. Service gap in hotel website load performance. Int. Hosp. Rev. 2019, 33, 16–29. [Google Scholar] [CrossRef]
- NitroPack. 13 Metrics to Measure Website Performance in 2026. Available online: https://nitropack.io/blog/website-performance-metrics/ (accessed on 16 February 2026).
- Guo, M.; Liao, X.; Liu, J.; Zhang, Q. Consumer preference analysis: A data-driven multiple criteria approach integrating online information. Omega 2020, 96, 102074. [Google Scholar] [CrossRef]
- Muralidhar, A.; Lakkanna, Y. From Clicks to Conversions: Analysis of Traffic Sources in E-Commerce. J. Media Manag. 2024, 6, 1–5. [Google Scholar] [CrossRef]
- ASMBL. E-Commerce Metrics for the Growing Retail Brand. Available online: https://www.asmbl.digital/blog/e-commerce-metrics-for-the-growing-retail-brand (accessed on 2 February 2026).
- Toolsteller. Website Loading Time Statistics (2026) Average Page Load Time and Bounce Rate. Available online: https://www.tooltester.com/en/blog/website-loading-time-statistics/ (accessed on 2 February 2026).
- Leibovitch, A. Website Traffic Benchmarks by Industry (2025). 2025. Available online: https://agencyanalytics.com/blog/website-traffic-benchmarks (accessed on 2 February 2026).
- Buck, A. Average Ecommerce Bounce Rate in 2026 (and How to Improve It); Mobiloud. Available online: https://www.mobiloud.com/blog/average-bounce-rate-for-ecommerce (accessed on 8 February 2026).
- Cano, J.A.; Londoño-Pineda, A.A.; Campo, E.A.; Fernández, S.A. Sustainable business models of e-marketplaces: An analysis from the consumer perspective. J. Open Innov. Technol. Mark. Complex. 2023, 9, 100121. [Google Scholar] [CrossRef]
- Fu, R.; Zheng, B.; Wen, J.; Xie, L. Research on commodity business value and customer value of e-commerce platforms: Based on consumer psychology and cognition. Front. Psychol. 2022, 13, 985537. [Google Scholar] [CrossRef] [PubMed]
- Maruf, M. Türkiye’de E- Ticaret Sitelerinin SWARA ve WASPAS Yöntemleri İle Web Sitesi Performansına Göre Sıralanması. TroyAcademy 2021, 6, 411–421. [Google Scholar] [CrossRef]
- Davidavičienė, V.; Markus, O.; Davidavičius, S. Identification of the Opportunities to Improve Customer’s Experience in E-Commerce. J. Logist. Inform. Serv. Sci. 2020, 7, 42–57. [Google Scholar] [CrossRef]
- Aydın, S.; Kahraman, C. Evaluation of E-commerce Website Quality Using Fuzzy Multi-criteria Decision Making Approach. IAENG Int. J. Comput. Sci. 2012, 39, 64–70. [Google Scholar]
- Şahin, Y.; Sara, D.M. E-Shopping Sites Preference Analysis with Multi-Criteria Decision-Making Methods. Bilişim Teknol. Derg. 2019, 12, 265–275. [Google Scholar] [CrossRef]
- Kar, R.; Gök, B.; Gökçen, H. E-ticaret firmalarinin web site performanslarinin çok kriterli karar verme teknikleriyle değerlendirmesi. Gazi J. Eng. Sci. 2023, 9, 388–401. [Google Scholar]
- Bayram, M.; Yaylı, A. Otel web sitelerinin içerik analizi yöntemiyle değerlendirilmesi. Elektron. Sos. Bilim. Derg. 2009, 8, 347–379. [Google Scholar]
- Dalgın, T.; Karadağ, L. Restoran işletmeleri web sitelerinin içerik analizi: Marmaris-Bodrum örneği. AİBÜ Sos. Bilim. Enstitüsü Derg. 2013, 2, 133–150. [Google Scholar] [CrossRef]
- Cavlak, E. Online Alişveriş Sitesi Tercihinde Etkili Olan Kriterlerin Belirlenmesine ve Önceliklendirilmesine Yönelik bir Karar Modeli. Master’s Thesis, Fen Bilimleri Enstitüsü, İstanbul, Türkiye, 2012. [Google Scholar]
- Özdemir, M.; Bilgin Turna, G. Website performances of commercial banks in Turkey. Dumlupınar Üniversitesi Sos. Bilim. Derg. 2020, 64, 38–52. [Google Scholar]
- Maruf, M.; Özdemir, K. Türkiye’deki Ticari Bankalara Ait Web Sitelerin Performanslarının SWARA ve ARAS Yöntemi İle Sıralanması. OPUS Uluslararası Toplum Araştırmaları Derg. 2021, 18, 1514–1537. [Google Scholar] [CrossRef]
- Özbek; Engür, M. Lojistik firma web sitelerinin ARAS yöntemi ile değerlendirilmesi. Int. New Issues Soc. Sci. 2017, 5, 105–118. [Google Scholar]
- Bulak, M.E.; Kozanoğlu, O.; Aydoğduoğlu, Ş.N.; Göçer, F.; Algül, R. E-Ticaret Sitelerinin Kullanılabilirliğinin AHP ve TOPSİS Yöntemleriyle Karşılaştırılması. Eur. J. Sci. Technol. 2021, 26, 493–509. [Google Scholar] [CrossRef]
- Akgül, Y. Evaluating the performance of websites from a public value, usability, and readability perspectives: A review of Turkish national government websites. Univers. Access Inf. Soc. 2024, 23, 975–990. [Google Scholar] [CrossRef]
- Kara, M.A.; Erdem, A.; Baş, E. Süper Lig Futbol Kulüplerinin Web Sitelerinin SWARA ve WASPAS Yöntemleri ile Web Sitesi Performansına Göre Sıralanması. Kahramanmaraş Sütçü İMam. Üniversitesi Sos. Bilim. Derg. 2023, 20, 615–627. [Google Scholar] [CrossRef]
- Yeşilkaya, M. Bulanık Çok Kriterli Yöntemlerin Karşılaştırılması: Mobilya İşletmelerinin Web Siteleri Örneği. Fırat Üniversitesi Mühendislik Bilim. Derg. 2025, 37, 125–150. [Google Scholar] [CrossRef]
- Gligorić, Z.; Görçün, Ö.F.; Gligorić, M.; Pamucar, D.; Simic, V.; Küçükönder, H. Evaluating the deep learning software tools for large-scale enterprises using a novel TODIFFA-MCDM framework. J. King Saud. Univ.-Comput. Inf. Sci. 2024, 36, 102079. [Google Scholar] [CrossRef]
- Aydin, Y. A Hybrid Multi-Criteria Decision-Making Model for Performance Assessment in the Banking Industry. Knowl. Decis. Syst. With Appl. 2025, 1, 234–256. [Google Scholar] [CrossRef]
- Puška, A.; Nedeljković, M.; Božanić, D.; Štilić, A.; Muhsen, Y.R. Evaluation of agricultural drones based on the COmpromise Ranking from Alternative SOlutions (CORASO) methodology. Eng. Rev. 2024, 44, 77–90. [Google Scholar] [CrossRef]
- Puška, A. Selection of CRM Systems Using Objective Criteria for the Needs of Small Companies. Int. J. Knowl. Innov. Stud. 2025, 3, 1–11. [Google Scholar] [CrossRef]
- Tufan, D.; Ulutaş, A. Supplier Selection in the Food Sector: An Integrated Approach Using LODECI and CORASO Methods. Spectr. Decis. Mak. Appl. 2026, 3, 40–51. [Google Scholar] [CrossRef]
- Gopisetty, Y.B.; Sama, H.R. Skewness impact through distributional evaluation (SITDE) method: A new method in multi-criteria decision making. J. Oper. Res. Soc. 2025, 76, 1204–1224. [Google Scholar] [CrossRef]
- Yalçın, G.C. SITDE ve AROMAN Tabanlı Çok Kriterli Karar Verme ile Gıda Sektöründe Finansal Performansın Ölçümü. Karadeniz Sos. Bilim. Derg. 2025, 17, 772–796. [Google Scholar] [CrossRef]
- Kumar, V.L.; Kamruddin, S.; S, V.K.K.; Kalvakolanu, S.; Nalluri, V.; Chang, J.-R. A Multi-Criteria Decision-Making Approach to Improve Criteria Ranking and Weighting: Integrating SITDE Weighting With PIV and RAM Techniques. Asian J. Interdiscip. Res. 2025, 8, 1–20. [Google Scholar] [CrossRef]
- Zavadskas, E.K.; Podvezko, V. Integrated Determination of Objective Criteria Weights in MCDM. Int. J. Inf. Technol. Decis. Mak. 2016, 15, 267–283. [Google Scholar] [CrossRef]
- Zavadskas, E.K.; Kaklauskas, A.; Peldschus, F.; Turskis, Z. Multi-Attribute Assessment of Road Design Solutions by Using the Copras Method. Balt. J. Road. Bridge Eng. 2007, 2, 195–203. [Google Scholar]
- Zavadskas, E.K.; Turskis, Z.; Vilutiene, T. Multiple criteria analysis of foundation instalment alternatives by applying Additive Ratio Assessment (ARAS) method. Arch. Civ. Mech. Eng. 2010, 10, 123–141. [Google Scholar] [CrossRef]
- Stević, Ž.; Pamučar, D.; Puška, A.; Chatterjee, P. Sustainable supplier selection in healthcare industries using a new MCDM method: Measurement of alternatives and ranking according to COmpromise solution (MARCOS). Comput. Ind. Eng. 2020, 140, 106231. [Google Scholar] [CrossRef]
- Puška, A.; Stević, Ž.; Pamučar, D. Evaluation and selection of healthcare waste incinerators using extended sustainability criteria and multi-criteria analysis methods. Environ. Dev. Sustain. 2022, 24, 11195–11225. [Google Scholar] [CrossRef] [PubMed]
- Ulutaş, A.; Topal, A.; Ecer, F. The Alternative Prioritization and Assessment System (ALPAS) Method for Environmental Performance Evaluation. Mathematics 2025, 13, 3333. [Google Scholar] [CrossRef]

Disclaimer/Publisher’s Note: The statements, opinions and data contained in all publications are solely those of the individual author(s) and contributor(s) and not of MDPI and/or the editor(s). MDPI and/or the editor(s) disclaim responsibility for any injury to people or property resulting from any ideas, methods, instructions or products referred to in the content. |
© 2026 by the authors. Licensee MDPI, Basel, Switzerland. This article is an open access article distributed under the terms and conditions of the Creative Commons Attribution (CC BY) license.