


Abstract
Tourism check-in photos on visual social commerce platforms such as RedNote profoundly shape potential consumer affective responses and their destination choices. Yet how color framing, the integrated configuration of hue, saturation, and brightness, is associated with potential consumer affect remains poorly understood, and no systematic assessment framework exists. This study develops a six-dimensional color framing assessment system (average hue warmth, hue variety, average saturation, high-saturation area ratio, average brightness, and contrast) spanning global aggregation and distributional composition across the HSB color model. With computer vision, the framework is applied to 10,136 images from 1515 highly engaged RedNote tourism check-in posts, while potential consumer affect is measured along positivity and polarity dimensions from 92,437 comments via sentiment analysis. An interpretable machine learning pipeline (XGBoost-SHAP) models affective outcomes, controlling for non-color visual features, textual features, and metadata. Other than metadata features, color framing predicts affective positivity and polarity and outweighs other visual form and content elements. We uncover predominantly nonlinear associations, including a positive cold-color association with positivity, the value of reduced hue variety, and positivity–polarity trade-offs across saturation and brightness dimensions. The findings offer actionable guidance for visual communication and destination marketing on visual social commerce platforms and establish a reusable interpretable AI methodology for potential-consumer-affect analytics for visual framing research.
1. Introduction
Visual social media and visual social commerce platforms such as RedNote (Xiaohongshu.com) have become primary sources of tourism information and travel decision-making for young generations, reshaping how they perceive and feel about destinations. Tourism check-in photos (images taken and shared by numerous tourists at iconic trending locations using identical camera positions and compositions [1]) evoke positive affective responses toward destinations, stimulate the desire to imitate and share check-in photos, and motivate potential consumers to visit the same locations, thereby propelling destination popularity [2]. User-generated visual content also shapes destination image and electronic word-of-mouth (eWOM) [3].
The influence of tourism check-in photos on visual social media is primarily achieved through the visual framing effect: media messages make certain attributes salient, leading potential consumers to interpret the presented object in a particular way [4]. From the perspective of frame theory, these attributes are devices of frames. In texts, frame devices are composed of textual symbols such as words and phrases; in images, frame devices are visual modalities [5], i.e., the degree of using specific visual representation techniques [6]. As noted in previous research, visual modalities influence potential consumer affect [7] and play an important role in persuasion [8,9].
Color has been proven to be one of the most powerful visual modalities for conveying meaning and associations [10], evoking resonance [11], and facilitating persuasion [8]. Color has also been shown to influence aesthetic evaluations and affective responses at the earliest stages of perception [12,13].
Within tourism check-in photos, objects, i.e., visual content elements, primarily shape potential consumers’ cognition toward destinations [14,15], whereas color as a visual form element shapes their affective responses [16,17]. Together, these visual content and form elements affect potential consumers’ attitudes and behaviors toward the tourism destination [18,19,20], shaping destination image, eWOM, and revisit intention [3,21]. Importantly, even when the location, camera position, and composition are fixed, different color framings can alter how content elements are presented, thereby yielding distinct affective associations. Creators post check-in photos essentially as a form of imitation and display aimed at gaining social media engagement: while keeping the visual content elements constant, they deliberately manipulate color and other visual form elements, thereby intentionally framing destinations through the salience of color attributes. Tourism check-in photos therefore constitute ideal material for studying color framing effects.
Prior research has examined the affective associations of individual color features in tourism photos in a scattered, exploratory manner. Pan et al. [22] noted that affective cues in visual materials are key to stimulating tourist associations, with color serving as the most intuitive carrier. Yu et al. [16] demonstrated that color plays a foundational framing role in destination image construction on Instagram, with different hue combinations directly shaping affective presuppositions. He et al. [23] found that minor adjustments to brightness in destination visual symbols enhance positive evaluations of destination image and brand. Chen et al. [24] showed that the combination of average hue warmth and saturation significantly influences viewers’ affective responses to cultural heritage tourism photos. Song et al. [21] further demonstrated that visual modification cues in destination photos, including tone enhancement (saturation and warm–cold tendency) and light–shadow atmosphere (brightness and lighting), shape trust and revisit intention, underscoring the relevance of color attributes for destination marketing.
However, previous studies suffer from two limitations. First, a systematic framework for comprehensively analyzing the color features in tourism photos has not been developed. Second, a fine-grained dimensional analysis of potential consumer affect has not been conducted. Most critically, none have investigated, from the theoretical perspective of visual framing, how the color framing of tourism check-in photos relates to potential consumer affective response on visual social media.
Addressing this gap entails three major challenges. First, no comprehensive system currently exists for analyzing the color framing of visual communication messages such as images. Second, on visual social media, tourism check-in photos are presented as posts combining a number of images with text; factors beyond color can produce confounding effects on affective responses, and these must be properly controlled. Third, the relationship between image color and potential consumer affect may exhibit nonlinear characteristics that traditional linear statistical paradigms struggle to capture and explain.
To meet these challenges, we adopt a computational social science [25] paradigm. We construct a systematic assessment framework (illustrated in Figure 1) and collect 1515 highly engaged tourism check-in photo posts comprising 10,136 images with 92,437 textual comments from RedNote as the multimodal dataset for mining and analysis. RedNote is well suited for this investigation: it is a visual social media platform centered on image–text content, making it a natural setting for color-focused visual framing research. As of April, 2026, it had reached 350 million monthly active users, over 70% of whom are aged 18–35, and it has become a primary entry point for young people seeking destination inspiration [26]. Users frequently travel to specific geographic coordinates to imitate the compositional angles of highly liked posts. Posts are densely aggregated under hashtags like “tourism photo spots”, with image–text content predominating and comment discussions being enthusiastic, providing rich data for empirical analysis of the affective associations of color framing.
Figure 1.
The proposed framework for assessing affective associations of color framing.
Our computational approach joins a growing body of research that mines consumer-generated visual content using computer vision and machine learning. Hartmann et al. [27] showed that the visual characteristics of consumer-posted brand selfies, quantified through machine learning analysis, systematically predict audience engagement, while Liu et al. [28] developed a computer vision “visual listening” approach that extracts brand image from user-generated social media images. Bülbül et al. [29] further linked social media marketing content to purchase intention across heterogeneous consumer decision-making styles, underscoring the commercial relevance of visual social media content. These studies establish the feasibility and substantive importance of automated visual content analysis. We extend this computational line of research by theorizing and empirically examining, within visual framing theory, how the six-dimensional color framing of tourism check-in photos relates to consumer affect in order to isolate the specific role of color framing.
Specifically, our assessment framework consists of four components:
(1) Dimensional affect measurement. Using sentiment analysis techniques in Natural Language Processing (NLP), we measure potential consumer affect expressed in comments along two dimensions: affective positivity and affective polarity. Affective positivity captures the positive–negative direction of subjective experience, operationalized as the mean sentiment orientation of user comments, with positive values indicating net positive affect and negative values indicating net negative affect. Affective polarity captures the extremity of the emotional response, operationalized as the mean absolute deviation of comment sentiment from the neutral point; higher polarity indicates more intense, polarized affective reactions, while values near zero indicate flat, neutral responses. Prior research indicates that affect identified from social media comments can effectively reflect tourists’ subjective responses to tourism content [30,31]. Together, comment-based positivity and polarity provide a complete measurement model of potential consumer affective responses to tourism check-in photos.
(2) Color framing assessment. Using computer vision (CV) techniques, we construct a six-dimensional analytical system for color framing of images, organized by two perspectives (global aggregation and distributional composition) across the three aspects of the Hue–Saturation–Brightness (HSB) color model [32]. The six-dimensional variables are: average hue warmth, hue variety, average saturation, high-saturation area ratio, average brightness, and contrast. Although numerous color models exist (RGB, CMYK, CIELab), HSB is the most aligned with human psychological perception and the most readily interpretable. The global aggregation summarizes the overall magnitude of each aspect, whereas the distributional composition captures how that aspect is distributed across the image; analyzing both for each of the three HSB aspects yields a measurement system that comprehensively covers color framing.
Hue denotes the category of color (magenta, orange, yellow, green, cyan, purple, etc.). Its global aggregation is captured by average hue warmth; its distributional composition, by hue variety. Saturation denotes color purity, ranging from vivid to gray. Its global aggregation is captured by average saturation; its distributional composition, by the high-saturation area ratio. Brightness denotes lightness or darkness. Its global aggregation is captured by average brightness; its distributional composition, by contrast.
Drawing on the corresponding specific theoretical analysis, the following hypotheses (H1a to H6b) on the predictive relationships between the six color framing dimensions and the two affective dimensions (positivity and polarity) are proposed. Each hypothesis concerns tourism check-in photos on visual social media.
Average hue warmth refers to the perceived average warmth of the color of an image. Color psychology has established that long-wavelength light (orange) is associated with warmth and short-wavelength light (blue) with coldness [33]. Regarding affective positivity, a number of studies find that warm hues are generally more strongly associated with positive affects [34]; warm hues can simulate the sense of security conveyed by natural light, eliciting comfort and pleasure [35], and this perceived warmth translates into positive attitudes and high evaluations on visual social media [36]. Although some work suggests the warm–cold effect on positivity may be nonlinear [37], warmer hues are broadly considered to convey positive signals. We therefore hypothesize:
H1a.
Average hue warmth positively predicts potential consumer affective positivity.
Regarding affective polarity, warm hues elicit more intense, extreme emotional reactions than cold hues [7]. From an evolutionary perspective, long-wavelength warm light, which is associated with survival-critical cues such as heat, sunlight, and blood, carries greater affective charge [37,38]. We therefore hypothesize:
H1b.
Average hue warmth positively predicts potential consumer affective polarity.
Hue variety measures the richness of independent hue categories and their distribution within an image, reflecting the complexity of hue information. Visual Fluency Theory holds that the more easily a visual stimulus can be processed, the higher the aesthetic pleasure [39]. Conversely, as hue variety increases, images tend to appear cluttered and visual integration becomes more difficult. Weijs et al. [40] noted that the relationship is not simply linear: beyond a moderate level, excessive complexity elicits negative evaluations. We therefore hypothesize:
H2a.
Hue variety has an inverted U-shaped nonlinear predictive relationship with potential consumer affective positivity.
Regarding affective polarity, Kanuri et al. [41] found that high color complexity, by providing richer information, captures attention and shifts processing from peripheral to central routes, thereby intensifying emotional reactions. We therefore hypothesize:
H2b.
Hue variety positively predicts potential consumer affective polarity.
Average saturation measures the overall color purity or vividness of an image. Ecological Valence Theory suggests that pure, vivid colors, which are associated with health and vitality in nature, elicit pleasure [7]. High saturation enhances perceived image quality and cognitive processing efficiency, and this perceptual fluency translates into visual pleasure [42]. We therefore hypothesize:
H3a.
Average saturation positively predicts potential consumer affective positivity.
For affective polarity, highly saturated colors represent high-intensity light-wave energy that directly intensifies the strength of emotional responses, producing more extreme reactions [7,37]. Gorn et al. [43] similarly found that high-saturation stimuli induce greater excitement, and on visual social media, higher-saturation images significantly intensify affective responses [44]. We therefore hypothesize:
H3b.
Average saturation positively predicts potential consumer affective polarity.
High-saturation area ratio refers to the proportion of pixels exceeding a saturation threshold relative to the total number of pixels in an image. Ecological Valence Theory indicates that large areas of vivid color induce pleasure [45], and in realistic images, larger areas of high-saturation color amplify perceptual enjoyment [42]. Camgöz et al. [46] found that high-saturation regions enhance preference by augmenting visual tension. We therefore hypothesize:
H4a.
High-saturation area ratio positively predicts potential consumer affective positivity.
For affective polarity, Visual Salience Theory holds that high-salience regions are preferentially captured by the visual system [47]. With moderate coverage, strong feature contrast effectively directs attention and intensifies emotional reactions [48]. However, Sensory Adaptation Theory predicts that when strong stimuli cover the entire image, visual fatigue and sensory overload produce inhibitory effects [49], causing polarity to decline beyond a threshold in a nonlinear fashion. We therefore hypothesize:
H4b.
High-saturation area ratio has an inverted U-shaped nonlinear predictive relationship with potential consumer affective polarity.
Average brightness measures overall image lightness. Brightness is one of the most stable predictors of affective pleasure: bright colors are almost always more pleasant than dim ones [7]. Brighter images receive more positive affective evaluations [50], while darker images are evaluated more negatively. This brightness–positivity association appears to be automatic and cross-culturally consistent [51], and on visual social media, high-brightness images significantly increase like rates [16]. We therefore hypothesize:
H5a.
Average brightness positively predicts potential consumer affective positivity.
For affective polarity, higher brightness implies greater light-energy input, intensifying the strength of emotional responses [37]; as brightness increases, retinal stimulation increases, shifting reactions toward more extreme states [52]. Higher-brightness images also significantly intensify affective responses on visual social media [44]. We therefore hypothesize:
H5b.
Average brightness positively predicts potential consumer affective polarity.
Contrast measures the magnitude of light–dark differences in an image. For affective positivity, aesthetic preference is negatively correlated with the metabolic cost of visual processing: the brain prefers visual objects with lower processing burden and gentler neuronal stimulation [53]. High-contrast images can cause excessive, desynchronized neuronal firing, leading to visual fatigue and even headaches. Moreover, high contrast intensifies pressure and tension in images, tending to induce negative affective evaluations [54]. We therefore hypothesize:
H6a.
Contrast negatively predicts potential consumer affective positivity.
For affective polarity, contrast represents a stimulus-intensity variable. High contrast enhances visual salience and attracts attention, but Optimum Stimulation Level Theory [55] predicts an inverted U-shaped relationship: moderate intensity elicits the most extreme emotional reactions, while both extremes reduce affective intensity. We therefore hypothesize:
H6b.
Contrast has an inverted U-shaped nonlinear predictive relationship with potential consumer affective polarity.
As shown above, previous studies have separately examined the associations of individual variables within the above six-dimensional color framing system with potential consumers’ affective positivity and polarity. However, no empirical research has yet comprehensively investigated this issue within the specific context of tourism check-in photos on visual social media.
(3) Control variable system. We establish a comprehensive control variable system encompassing non-color visual form elements (feature complexity and compositional complexity), visual content themes, post textual features, and post metadata, to control confounding influences.
A visual social media post contains not only images but also textual descriptions and metadata. Following Li and Xie [56], we control for: post caption length (word count), presence of punctuation marks in the caption (exclamation marks and question marks), posting time (to the hour of a day), author follower count, number of hashtags (#), number of mentions (@), and number of emojis. Beyond color form elements, each image contains content elements (visual themes) and other form elements. Visual themes are obtained by converting images to text descriptions using the Qwen-VL multimodal large language model [57] and performing topic modeling via BERTopic [58]. Image form features are divided into color features and visual complexity [59]. Visual complexity is further decomposed into feature complexity, which is the total perceptual detail in an image, and compositional complexity, which is the spatial distribution of image elements.
(4) XGBoost-SHAP model. We adopt interpretable machine learning [60] to capture and explain the nonlinear relationships between color framing and potential consumer affect. Prior research indicates that the relationships between the six color framing dimensions and potential consumer affect are likely nonlinear. Traditional statistical regression models are interpretable but poor at capturing nonlinearity; classic supervised machine learning algorithms excel at nonlinear fitting but produce black-box models. Interpretable machine learning bridges this gap: the XGBoost [61] algorithm first captures nonlinear relationships, and the SHAP (SHapley Additive exPlanations) [62] technique then performs post hoc deconstruction of the built model to explain the captured mechanisms, transforming the black box into a transparent white box. This XGBoost-SHAP paradigm has been widely adopted across disciplines for the interpretable analysis of nonlinear relationships.
The contributions of this study are five-fold across theory and practice. On the theoretical side:
- We provide quantitative empirical evidence on how color framing in tourism check-in photos is associated with potential consumer affective positivity and polarity on visual social media;
- We also extend visual framing theory by conceptualizing and operationalizing color framing with six dimensions across two perspectives (global aggregation and distributional composition) and three aspects (hue, saturation, and brightness);
- We establish a reusable methodology based on computer vision and interpretable machine learning for capturing and explaining the associations between color framing and potential consumer affect, including their predominantly nonlinear patterns.
On the practical side:
- Our findings help Destination Management Organizations (DMOs) and marketers understand potential consumers’ color preferences and their affective consequences;
- Our findings can also guide the optimization of visual content design for destination marketing, which can enhance potential consumer engagement, destination attractiveness, and brand image.
2. Methods
2.1. Data Source
We adopted the hashtag keyword searching and rule-based filtering strategy established in prior RedNote research [63,64,65,66,67]. The search keyword was “tourism photo spots”. Content under this hashtag typically features specific shooting angles or compositional positions, presenting high-quality, carefully designed tourism check-in photos with high value for visual affective communication research. Compared with hashtags such as “tourism check-in” or “tourism outfit”, which may include large volumes of person-centered images, “tourism photo spots” content focuses more on landscapes and scenery, making the extracted color features more representative of destinations’ visual social media representations.
To mitigate the information cocoon effects of RedNote’s personalized recommendation algorithm, we registered 10 brand-new accounts with no historical behavioral data and conducted parallel crawling simulating ordinary users’ search and view behavior. The initial collection retrieved 2785 candidate posts published between 1 November 2024 and 30 November 2025 via the web version of the platform. Posts were screened for a baseline level of engagement (likes ≥ 50, comments ≥ 10), excluding low-interaction, low-exposure content. Commercial advertisements, product reviews, and purely portrait selfies unrelated to tourism destinations were manually removed.
Comment data were collected using a popularity-priority strategy, crawling the most-liked comments per post with an upper limit of 100 comments per post (full retrieval for posts with fewer than 100). After preliminary cleaning and deduplication, validated potential consumer comments were obtained. The final multimodal dataset comprised 10,136 images with 92,437 textual comments in 1515 posts.
The data used in this study are publicly available, non-interventional, and fully anonymized, and were used strictly for non-commercial academic research. All collected content is publicly visible on RedNote and was retrieved through the platform’s ordinary search function, without accessing any private accounts. Data collection was conducted through automated, non-interventional observation that did not interfere with public behavior, and no user was interacted with or influenced. No personal information was collected or stored: images and texts like comments and captions were processed only at the aggregate feature level (e.g., color features, sentiment scores, and caption features), and the original images and texts were not retained. Likewise, no author information, including author identifiers, was stored. The only author-level variable retained is the natural logarithm of the follower count. No individual can therefore be identified from the dataset or from any result reported in the manuscript, and no user-generated content was redistributed, resold, or otherwise commercially exploited.
2.2. Variable Measurements
2.2.1. Independent Variables
The six-dimensional color framing variables were assessed using Python-based computer vision techniques.
Images were first standardized to the RedNote platform’s maximum display ratio of 3:4 (1080 × 1440 pixels), maintaining original aspect ratios with at least one edge touching the boundary. Because potential consumer browsing is a continuous, integrative visual process, all scaled image pixels within a given post were merged into a single global pixel set, and color framing dimensions were computed directly on this set.
(1) Average hue warmth. Following Valdez and Mehrabian [7], 30° (orange) on the hue circle was set as the absolute warm pole and 210° (blue) as the absolute cold pole. For each pixel i, its warmth value was computed as its angular distance from the cold pole on the hue circle:
where is the hue angle (in degrees) of pixel i; therefore ranges from 0 (the cold pole at ) to 180 (the warm pole at ). The mean warmth over all pixels was then normalized to the interval as the average hue warmth of images in a post:
where N is the total number of pixels in the merged global pixel set.
(2) Hue variety. Based on the Hue Count algorithm [68], the hue circle was divided into 20 equal-width intervals. The hue histogram of the global pixel set was computed, and the number of intervals whose pixel proportion exceeds a 5% threshold was counted as the value of hue variety:
where is the proportion of pixels falling into the k-th hue interval and is the indicator function, which equals 1 when the condition holds and 0 otherwise.
(3) Average saturation. Following Hasler and Suesstrunk [69], the arithmetic mean of the normalized saturation channel was computed for the global pixel set:
where is the saturation value of pixel i.
(4) High-saturation area ratio. Based on Kim and Lennon [70], who found that saturation above 70% constructs a more positive visual atmosphere, the threshold was set at 70. The proportion of pixels whose saturation exceeds this threshold relative to the total number of pixels was computed as the value of high-saturation area ratio:
where is the saturation value of pixel i on the 0–100 scale.
(5) Average brightness. The arithmetic mean of pixel brightness was computed for the global pixel set:
where is the brightness value of pixel i.
(6) Contrast. Following Itti and Koch [47], contrast was operationalized as the standard deviation of the brightness channel across the global pixel set:
where is the brightness value of pixel i and is the mean brightness defined in Equation (6).
2.2.2. Dependent Variables
Potential consumer affective responses were measured as the mean affective positivity and affective polarity of user comments per post.
Comments were preprocessed by performing Chinese word segmentation using the Jieba Python library [71]. Sentiment analysis was conducted using the SnowNLP Python library [72], yielding a sentiment orientation value in for each comment (1 = prototypically positive, 0 = prototypically negative). SnowNLP is well suited to sentiment analysis of tourism-related Chinese texts and has been widely adopted in tourism research [73,74,75,76]. Following Pang and Lee [77], these probability values were linearly transformed to for intuitive mapping of positive, negative, and neutral states. For the k-th comment under the i-th post with a raw SnowNLP score , the transformed single-comment sentiment score was computed as
where , with 1, 0, and corresponding to prototypically positive, neutral, and negative sentiment, respectively. The affective positivity of a post was then computed as the arithmetic mean of all its comments’ transformed sentiment scores:
where is the number of comments under the i-th post. approaching 1 indicates predominantly positive comments, approaching indicates predominantly negative comments, and approaching 0 indicates neutral comments. The affective polarity of a post was operationalized as the arithmetic mean of the absolute values of its comments’ transformed sentiment scores:
which characterizes the degree to which the overall comment sentiment deviates from the neutral point, regardless of direction. A higher indicates a more extreme, polarized affective response; a value near 0 indicates a flat, neutral affective response.
2.2.3. Control Variables
Beyond the independent variables of the six color framing dimensions, the control variables of visual form elements are visual complexity variables comprising feature complexity and compositional complexity. Feature complexity was measured following Peng et al. [59]: each image was proportionally scaled to fit within a pixel frame, i.e., scaled by the factor , where and denote the original width and height of the j-th image. The scaled images were then converted to JPEG format with the same configuration, and the mean file size across all images in a post was computed as the value for total perceptual detail (i.e., feature complexity) of that post:
where is the number of images in the i-th post.
Compositional complexity was measured following Peng and Jemmott [78]: the Canny edge detector extracted edge pixels, and the mean Euclidean distance between all pairs of edge points was computed. For the j-th scaled image with edge points, this mean distance is
where and are the coordinates of edge points a and b. This value was then standardized by the image diagonal length, and the mean across all images in a post was calculated as the value of compositional complexity (i.e., the spatial distribution of image elements):
where and denote the scaled width and height of the j-th image in the i-th post. Higher values indicate more dispersed visual focal points; lower values indicate more concentrated visual elements.
To isolate the confounding effects of visual content elements in photos, we followed Lokmanoglu and Walter [58]: the Qwen-VL multimodal large language model [57] converted sample images into textual descriptions, and BERTopic [58] performed topic modeling. Five visual content themes were identified (natural landscapes, portrait spots, still life details, travel tips, and night vibes). The number of images assigned to each theme within each post was tallied and then divided by the total number of images in that post, yielding the proportion of each theme (a content-composition measure) as control variables in the regression model.
Control variables pertaining to post text modality and metadata, including post caption word count, presence of punctuation marks in the caption (exclamation marks and question marks), posting time (Posting time is a circular variable (0–23 h). To avoid imposing an arbitrary linear ordering across the 23:00–00:00 boundary, it was encoded into its sine and cosine components, and , where h is the hour of posting.), author follower count, number of hashtags (#), number of mentions (@), and number of emojis, were directly extracted and cleaned from post metadata using a custom-developed Python (version 3.9.18) crawler. The number of images per post was included as a control variable to account for post length. Because the raw theme counts sum exactly to the number of images, the theme variables were first normalized to proportions (as described above), which removes this linear dependence and permits the number of images to be estimated as an independent covariate without multicollinearity.
2.3. Model Design
The unit of analysis was the individual visual social media post, encompassing its images, textual descriptions, and comments. All independent, dependent, and control variables were entered into an XGBoost regression model.
XGBoost is a gradient-boosted decision tree ensemble method with strong nonlinear modeling capacity, excelling at capturing complex nonlinear relationships and feature interactions [61].
Model hyperparameters were tuned on a random 70%/30% training–test split (seed 42). Within the training portion, a randomized search (RandomizedSearchCV) evaluated 200 candidate combinations using an inner five-fold cross-validation that minimized Root Mean Squared Error (), and early stopping (50 rounds) was applied on a further 20% validation subset to curb overfitting. The search space and the selected hyperparameters for the positivity and polarity models are summarized in Table 1. Final model performance was then evaluated by repeated 10 × 5-fold cross-validation. An ordinary least squares (OLS) regression estimated on the identical folds served as a linear benchmark, so that the incremental predictive value of the nonlinear XGBoost model could be assessed on the same out-of-sample data. For SHAP explanation, the final models were refit on an 80% training split and SHAP values were computed on the held-out 20% test split, thereby avoiding in-sample explanation. A common seed of 42 governed the data split, cross-validation fold assignment, and bootstrap resampling, whereas separate model seeds (218 for positivity, 288 for polarity) ensured reproducible tree construction. All analyses were implemented in Python 3.11.8 using XGBoost 3.2.0, scikit-learn 1.5.2, SHAP 0.51.0, and statsmodels 0.15.0.
Table 1.
XGBoost hyperparameter search space and selected values.
Interpretation of the trained XGBoost supervised machine learning model was implemented using the SHAP framework [62]. From a cooperative game theory perspective, the model’s prediction is treated as the total payoff, with features as players. A feature’s SHAP value equals its average marginal contribution across all possible feature coalitions, quantifying its contribution to the final prediction. Global feature importance was assessed by computing the mean absolute SHAP value for each feature across the entire dataset; higher values indicate greater weight in the model’s decision logic.
3. Results
3.1. Descriptive Statistical Analysis
Figure 2 illustrates the distributions of all measured variables in this study. The detailed descriptive analysis of the core variables is as follows.
Figure 2.
Kernel density estimation of all measured variables.
3.1.1. Descriptive Analysis on Independent Variables
As shown in Table 2, the six dimensions of color framing of tourism check-in photos exhibited the following characteristics:
Table 2.
Descriptive statistics for all measured variables.
Average hue warmth showed a skewed distribution with high dispersion (Median = 57.19, SIQR = 15.70), indicating a slightly warm overall tone consistent with social media potential consumers’ general preference for warm hues. The large Semi-InterQuartile Range (SIQR) reflects adequate coverage of diverse tourism scenarios, from cold-hued snowy mountains to warm-hued sunsets.
Hue variety followed a relatively balanced normal distribution (M = 12.37, SD = 2.69), suggesting that the images tend to select color-rich yet compositionally ordered content, avoiding both monotony and visual clutter.
Both average saturation and the high-saturation area ratio approximated normal distributions, indicating that creators prefer moderate saturation, which is sufficient for vividness while limiting strong-stimulus areas to avoid visual fatigue.
Average brightness (Median = 70.32, SIQR = 6.59) exhibited a pronounced negative skew, with the distribution shifted toward higher values. This indicates notably high overall brightness and a preference for well-lit visual expressions. Contrast was relatively balanced (M = 28.52, SD = 7.40), with a moderately high mean, suggesting that images maintained stable contrast to ensure clear layering alongside high brightness.
3.1.2. Descriptive Analysis on Dependent Variables
As shown in Table 2, the affective positivity of comments showed a pronounced negative skew (Median = 0.31, SIQR = 0.27), with a significant peak near the maximum (+1.0), indicating a strong positive tendency in potential consumer affective response. Affective polarity followed a normal distribution (M = 0.43, SD = 0.12), suggesting that the extremity of potential consumer emotional responses was concentrated around an intermediate level, with moderate and stable affective fluctuations.
3.1.3. Multicollinearity Assessment
As shown in Table 3, variance inflation factor (VIF) values for all independent and control variables were below 5, indicating no significant multicollinearity among the color features [79].
Table 3.
Variance inflation factor values of all independent and control variables.
3.2. Affective Associations of Color Framing
3.2.1. Model Fitting Performance
Under repeated 10 × 5-fold cross-validation, the XGBoost model achieved out-of-sample values of 0.276 ± 0.038 for affective positivity and 0.479 ± 0.039 for affective polarity, with corresponding values of 0.312 and 0.089 and values of 0.251 and 0.071 (Table 4). The linear OLS benchmark, estimated on the identical folds, attained values of 0.229 ± 0.045 and 0.441 ± 0.043, respectively. XGBoost thus modestly outperformed OLS for both outcomes (an incremental of roughly for positivity and for polarity), indicating that the nonlinear and interactive effects captured by the tree ensemble carry a small but consistent predictive signal beyond a purely linear specification. The model accounted for a markedly larger share of variance in polarity than in positivity, indicating that potential consumer affective polarity is more predictable from visual and textual post features than affective positivity.
Table 4.
Model fitting performance of the XGBoost and OLS models.
To complement the out-of-sample performance comparison, Table 5 reports the full-sample OLS coefficients with standard errors for both outcomes. Consistent with the SHAP-based interpretation, author follower count, caption word count, and posting time exhibit the largest linear coefficients, whereas the color framing variables show smaller linear coefficients; among them, hue variety and the high-saturation area ratio reach statistical significance, in line with their monotonic SHAP associations.
Table 5.
OLS regression coefficients with standard errors.
3.2.2. Incremental Predictive Contribution of Feature Groups
To disentangle the incremental predictive value of color framing from that of the other feature groups, rather than relying on feature importance rankings alone, we estimated a sequence of four nested XGBoost models on the identical cross-validation folds and computed the paired difference in out-of-sample () between adjacent specifications. The baseline model (a) contained only post metadata and text features; model (b) added the five visual content topic proportions; model (c) further added the two non-color visual form variables (feature and compositional complexity); and model (d) added the six color framing variables (the full model). Table 6 reports the out-of-sample of each specification together with the paired attributable to each successively added group.
Table 6.
Incremental predictive contribution of feature groups (nested models).
The ablation results show that the color framing variables were the only feature group to contribute a meaningful, consistent increment in out-of-sample predictive performance: adding them raised by for positivity and for polarity. In contrast, the visual content topic proportions and the non-color visual form variables contributed essentially nothing beyond the metadata and text baseline (their paired values were slightly negative and within sampling error of zero). This directly addresses the concern that SHAP importance rankings might not reflect genuine incremental value: color framing’s predictive contribution is real and not merely a ranking artifact, whereas the visual content and non-color form elements, although present in the model, add no incremental explanatory power once metadata and text are controlled.
3.2.3. Global Feature Importance Analysis
Figure 3 and Figure 4 integrate the SHAP global feature importance bar plots and the SHAP beeswarm summary plots for both the affective positivity and affective polarity XGBoost models. The bar plots rank features by global importance (mean absolute SHAP value), while the beeswarm plots display the relationship between individual feature values and model predictions (red = high values, blue = low values).
Figure 3.
SHAP global feature importance summary for affective positivity XGBoost models.
Figure 4.
SHAP global feature importance summary for affective polarity XGBoost models.
In both affect models, author follower count and caption word count dominated the global rankings, with posting time also ranking among the top predictors. High values (red) of these three operational variables were concentrated in the positive SHAP region, indicating that author influence, information richness, and specific time windows in a day stably and positively predict potential consumer affective positivity and polarity. Trending-related variables of posts are thus key predictors of potential consumer affect on visual social media.
The six color framing variables and two visual complexity variables, which are all visual form elements of images, had generally higher SHAP values than the image theme variables representing visual content elements. This indicates that visual form elements contribute more to model predictions of potential consumer affect than visual content elements in tourism check-in photos on visual social media. This ranking is corroborated at the level of incremental predictive value: the ablation analysis (Table 6) showed that the visual content topic proportions added no incremental beyond the metadata and text baseline, whereas the color framing variables contributed the only substantial and consistent increment.
Among the visual form elements of images, the two visual complexity variables ranked on average below the six color framing variables in both models, averaging sixth among all the eight visual form variables. Color framing thus contributes more to model predictions than other major visual form elements.
Within the six color framing dimensions of tourism check-in photos, affective associations differed across the three aspects of hue, saturation, and brightness:
For hue, the global aggregation measure (average hue warmth) ranked first in contribution to affective positivity within the color framing variables but had a weaker association with polarity. The distributional composition measure (hue variety) was strongly associated with both positivity and polarity.
For saturation, the global aggregation measure (average saturation) ranked first in contribution to affective polarity but had a weaker association with positivity. The distributional composition measure (high-saturation area ratio) was strongly associated with both positivity and polarity.
For brightness, the global aggregation measure (average brightness) ranked last among all eight visual form variables for polarity and second-to-last among the six color framing variables for positivity. The distributional composition measure (contrast) was strongly associated with both positivity and polarity.
In addition, hue variety exhibited a clear monotonic (negative) relationship with both affective positivity and polarity, and the high-saturation area ratio likewise displayed monotonic associations (positive with positivity, negative with polarity), whereas the remaining four color framing variables (average hue warmth, average saturation, average brightness, and contrast) displayed nonlinear relationships that were difficult to discern at the global feature importance level and required further investigation at the single-feature-dependence level of SHAP.
3.2.4. Single-Feature Dependence Analysis
To examine the precise association of each individual color framing variable with the dependent affective variables, we employed SHAP dependence plots overlaid with LOWESS (Locally Estimated Scatterplot Smoothing) trend curves and their 95% bootstrap confidence bands. Specifically, a LOWESS smoother with a smoothing span of 0.5 was fitted to the SHAP values across each feature’s range, and the 95% confidence band was estimated from 200 bootstrap resamples, allowing the association’s shape and statistical uncertainty to be assessed jointly.
To substantiate these nonlinear patterns formally rather than rely on visual inspection alone, we subjected each color framing variable to two complementary tests (Table 7). First, a quadratic term () tested for a U- or inverted-U reversal; a significant quadratic coefficient whose turning point (vertex) falls within the observed feature range provides formal evidence of a reversal, whereas a vertex outside the range indicates a monotonic association within the data. Second, a generalized additive model (GAM) with cubic B-splines was compared against a linear model by AIC as a global test of nonlinearity, in which a substantially lower GAM AIC favors a nonlinear specification (including monotonic but curved trends).
Table 7.
Formal nonlinearity diagnostics for the six color framing variables.
The formal tests broadly corroborate the LOWESS-based interpretations. Significant quadratic terms with in-range turning points confirmed the U-shaped positivity association of average hue warmth (vertex 54.22), the inverted-U polarity association of average hue warmth (vertex 82.13), the nonlinear associations of average saturation with both outcomes (vertices 52.82 and 28.21), the inverted-U positivity association of average brightness (vertex 90.69), the U-shaped polarity association of average brightness (vertex 55.18), and the nonlinear associations of contrast with both outcomes (vertices 40.06 and 29.35). For these cases, the GAM reduced AIC relative to the linear model, providing convergent evidence of nonlinearity. For the remaining associations, the turning point fell outside the observed range or, in the case of hue variety–positivity, the vertex lay at the extreme low end of the range, so that the relationship was monotonic rather than reversing within the data; in these cases the GAM generally reduced AIC as well, reflecting curvature (e.g., attenuation) of an otherwise monotonic trend.
(1) Average hue warmth. Figure 5 shows the SHAP dependence of potential consumer affect on average hue warmth. For affective positivity, the scatter distribution exhibited a U-shaped nonlinear pattern: SHAP values were high in both the extremely cold and extremely warm hue ranges, exhibiting a dip within the neutral range. H1a, which predicted a monotonically positive association, was therefore not supported. For affective polarity, the fitted line showed an inverted U-shaped nonlinear association, with the estimated turning point lying within the observed warmth range (Table 7); H1b, which predicted a positive association, was therefore not supported.
Figure 5.
SHAP dependence of affect on average hue warmth.
These results suggest that, for tourism check-in photos on visual social media, cold colors are also positively associated with affective positivity. However, warm colors remain necessary to simultaneously enhance both positivity and polarity.
(2) Hue variety. Figure 6 shows the SHAP dependence of potential consumer affect on hue variety. Because this variable is based on discrete hue-interval counts, scatter points formed discrete bands. For both affective positivity and polarity, the scatter displayed a monotonic negative association. H2a, which predicted an inverted U-shaped relationship with positivity, was not supported; nor was H2b, which predicted a positive relationship with polarity.
Figure 6.
SHAP dependence of affect on hue variety.
These results suggest that, in the context of tourism check-in photos on visual social media, fewer hue categories are associated with higher potential consumer affective positivity and polarity.
(3) Average saturation. Figure 7 shows the SHAP dependence of potential consumer affect on average saturation. For affective positivity, the average saturation showed a nonlinear negative relationship, so H3a, which predicted a positive association, was not supported; at higher saturation levels, the slope became essentially flat. For affective polarity, average saturation showed a nonlinear positive relationship, supporting H3b.
Figure 7.
SHAP dependence of affect on average saturation.
These results suggest that higher affective positivity is associated with lower average saturation, whereas higher affective polarity is associated with higher saturation. Simultaneously optimizing both dimensions involves a trade-off to find the optimal saturation level.
(4) High-saturation area ratio. Figure 8 shows the SHAP dependence of potential consumer affect on the high-saturation area ratio. For affective positivity, the high-saturation area ratio showed a monotonic positive relationship, supporting H4a. For affective polarity, it showed a monotonic negative relationship, so H4b, which predicted an inverted U-shaped relationship, was not supported.
Figure 8.
SHAP dependence of affect on high-saturation area ratio.
These results suggest that higher positivity is associated with a larger high-saturation area ratio, whereas higher polarity is associated with a smaller ratio. Simultaneously optimizing both dimensions again involves a trade-off to identify the optimal ratio.
(5) Average brightness. Figure 9 shows the SHAP dependence of potential consumer affect on average brightness. For affective positivity, average brightness exhibited an inverted U-shaped nonlinear relationship; H5a, which predicted a monotonically positive association, was only partially supported, as the association was positive up to a moderately high brightness and turned negative thereafter. For affective polarity, average brightness showed a U-shaped nonlinear association, with the estimated turning point lying within the observed brightness range (Table 7); H5b, which predicted a positive association, was therefore not supported.
Figure 9.
SHAP dependence of affect on average brightness.
Specifically, when average brightness reached a moderately high level, its association with positivity shifted from positive to negative, whereas the polarity association was U-shaped, reaching its minimum at an intermediate brightness and rising thereafter. This suggests that simultaneously optimizing both positivity and polarity is associated with adopting a moderately high brightness range, which captures the positivity peak while avoiding the intermediate-brightness trough in polarity.
(6) Contrast. Figure 10 shows the SHAP dependence of potential consumer affect on contrast. For affective positivity, contrast showed a nonlinear negative relationship, supporting H6a. For affective polarity, contrast exhibited an inverted U-shaped nonlinear relationship, supporting H6b.
Figure 10.
SHAP dependence of affect on contrast.
These results suggest that higher positivity is associated with lower contrast, whereas higher polarity is associated with moderate contrast. Simultaneously optimizing both dimensions involves a trade-off to identify the optimal contrast level.
3.2.5. Hypothesis Testing Summary
Table 8 summarizes the theoretical test of all twelve directional hypotheses. Overall, four hypotheses (H3b, H4a, H6a, and H6b) were fully supported, seven (H1a, H1b, H2a, H2b, H3a, H4b, and H5b) were not supported, and one (H5a) was partially supported. The polarity hypotheses did not fare better than the positivity hypotheses: two of the six polarity hypotheses were fully supported, compared with two of the six positivity hypotheses fully supported and one partially supported. This pattern indicates that the stimulus-intensity account, whereby stronger color stimulation intensifies emotional reactions, generalizes only partially to visual social media, whereas the pleasure-based accounts linking vivid or warm color to positive affect require substantial qualification in this context.
Table 8.
Hypothesis testing summary.
4. Conclusions and Discussion
This quantitative empirical study, grounded in a computational social science paradigm and supported by computer vision and interpretable machine learning, shows that the color framing of tourism check-in photos on visual social media is associated with potential consumer affective positivity and polarity. Based on our six-dimensional assessment system consisting of three aspects (hue, saturation, and brightness) × two perspectives (global aggregation and distributional composition), the key findings are summarized as follows.
For hue: Average hue warmth shows a nonlinear U-shaped association with affective positivity and a nonlinear inverted U-shaped association with affective polarity. Hue variety shows a monotonic negative association with both positivity and polarity.
For saturation: Average saturation shows a nonlinear negative association with positivity and a nonlinear positive association with polarity. High-saturation area ratio shows a monotonic positive association with positivity and a monotonic negative association with polarity.
For brightness: Average brightness shows a nonlinear inverted U-shaped association with positivity and a nonlinear U-shaped association with polarity. Contrast shows a nonlinear negative association with positivity and a nonlinear inverted U-shaped association with polarity.
From the perspective of visual framing theory, our results indicate that visual form elements are more strongly associated with potential consumer affect than visual content elements, and that their associations are relatively independent. Among visual form elements, color framing is more strongly associated with potential consumer affect than other major visual form elements, identifying it as the dominant visual predictor of potential consumer affect in tourism check-in photos on visual social media.
In terms of theoretical contributions, our empirical results of six-dimensional color framing associations lead to several revisions of prior findings.
Our findings of average hue warmth’s affective associations are broadly consistent with prior work (warm hues predict enhanced positivity and polarity), with one important distinction: we find that cold hues can also predict enhanced affective positivity. Recent research supports both observations. Jonauskaite and Mohr [80] found that warm hues consistently indicate positive, highly polarized states, while cool hues are associated with positive but moderate, low-polarity experiences. Febbraio et al. [81] demonstrated that red and blue at the two ends of the spectrum receive the highest pleasure ratings due to their associations with natural landscapes, while neutral hues rank lowest, which explains the U-shaped pattern we observed. For polarity, long-wavelength warm light, associated with survival-critical cues throughout evolution, elicits stronger, more extreme emotional reactions [38]; our results show this polarity advantage rising with hue warmth across most of the observed range before attenuating at the most extreme warm hues (Table 7), in line with evidence that warmer hues reliably signal more highly polarized affective states [80].
Our finding of a monotonic negative association of hue variety with both positivity and polarity diverges from all prior findings but finds plausible explanations in existing theory. For positivity, Visual Fluency Theory predicts that fewer hue combinations reduce processing difficulty and enhance aesthetic pleasure [39], and Schloss and Palmer [82] showed that increasing hue count weakens the overall harmony of images. For polarity, Li et al. [83] found that increasing hue complexity generates cumulative cognitive load and sensory fatigue: as hue variety grows, the prefrontal cortex expends progressively more neurotransmitters to sustain cognitive recognition, triggering a graded (rather than all-or-none) protective downregulation of emotional response intensity, which manifests as the monotonic decline in affective polarity we observed.
Our finding of a nonlinear negative association of average saturation with positivity and a nonlinear positive association with polarity is in contrast to prior findings of dual positive linear associations. The dissociation between positivity and polarity is interpretable: while higher-saturation stimulation triggers stronger emotional reactions [7], emotional intensity is not equivalent to aesthetic pleasure. Physiologically, color intensity drives cerebral blood-oxygen responses and visual discomfort in mobile high-brightness display contexts [84]. Cognitively, pleasure depends on the balance between color intensity and naturalness [42], and restrained color conveys greater authenticity and trustworthiness by avoiding a sense of unreality [85]. Consistent with this account, the negative association we observed is concentrated at the lower end of the saturation range and plateaus beyond a moderate level, indicating that the positivity advantage accrues from restrained, natural-looking color rather than from the mere absence of high saturation. From the perspective of Resource Matching Theory [86], higher average saturation drives visual stimulation toward cognitive processing capacity, producing strong emotional polarization alongside negative aesthetic evaluations due to sensory overload. Indiscriminately intensifying image color, while producing momentary visual impact, comes at the cost of aesthetic comfort and pleasure. The reversal from the positive linear associations reported in controlled settings [7] likely reflects the higher baseline saturation of commercial tourism photographs and the high-brightness mobile display context, where even moderate saturation approaches the comfort limit.
Our finding of a monotonic positive association of high-saturation area ratio with positivity (consistent with prior work) and a monotonic negative association with polarity (inconsistent with prior findings of an inverted U-shape) can be understood through multiple theoretical lenses. Ecological Valence Theory explains the positivity association: large areas of bright color induce pleasure [45], and high-saturation regions enhance preference through increased visual tension [46]. Visual Salience Theory explains the polarity decline: the human visual system allocates attention based on local differences [47]; as vivid coverage expands, local differences weaken, the image becomes homogeneous, and attentional focus becomes difficult. Sensory Adaptation Theory further predicts that prolonged exposure to large areas of high-intensity stimulation produces visual fatigue and sensory desensitization [49], weakening the intensity of affective responses. The absence of the ascending arm of the inverted U observed in prior work may reflect the salience-driven nature of this effect: even a small vivid region is sufficient to capture attention, so additional coverage adds redundancy and homogeneity rather than further polarity, yielding a monotonic decline instead of the inverted U.
Our findings of average brightness’s affective associations are broadly consistent with prior work (moderate brightness increases enhance positivity and polarity), with a key refinement: excessive brightness reduces positivity but not polarity. While moderate brightness strengthens warmth and positive evaluation [37,50], overexposure weakens shadow layers and spatial depth, introducing perceived distortion and de-realization that reduce authenticity and immersion [87]. Potential consumers facing overly bright images thus experience reduced positivity alongside negative aesthetic evaluations. For polarity, the association was instead U-shaped, dipping at an intermediate brightness and rising thereafter, broadly consistent with the view that greater light-energy input intensifies emotional reactions [38] without attenuation at extreme brightness.
Our findings of contrast’s affective associations are consistent with prior work: contrast nonlinearly and negatively predicts positivity and shows an inverted U-shaped relationship with polarity. Low-contrast images induce positive affective feedback by reducing the metabolic cost of visual processing [53], while high contrast induces visual stress and threat perception [88], leading to declines in aesthetic pleasure. High-contrast stimuli, associated in the human perceptual system with dangerous boundaries and abrupt environmental changes, trigger evolutionarily based alert mechanisms; the resulting sustained visual vigilance, while enhancing short-term attention, is accompanied by tension that reduces overall positivity [88]. For polarity, Berlyne’s Optimum Stimulation Level Theory [55] is supported: moderate contrast best intensifies emotional reactions, while both extremes lead to polarity decline. Extreme contrast triggers sensory defense due to visual stress and threat perception, causing a dual decline in both positivity and polarity [88].
Synthesizing across the above six dimensions of color framing associations, three broader insights emerge. First, compared with prior research, we identified more feature-level nonlinear relationships (for average hue warmth, average saturation, average brightness, and contrast), validating Ecological Valence Theory [7,45] and Optimum Stimulation Level Theory [55] (excessive positive stimulation can paradoxically produce negative effects). Second, we generated novel findings, including the positive effect of cold colors on positivity and the importance of reducing hue variety, suggesting that patterns identified in prior research may not necessarily apply within the triply novel context of visual social media as a new medium, tourism check-ins as a new scenario, and image color framing as a new modality. Third, we identified systematic trade-off tensions between color framing variables and the two affective dimensions in the saturation and brightness dimensions: tourism check-in photos must balance visual tension and stimulation against sensory comfort and pleasure.
In terms of practical implications, our quantitative empirical results provide actionable guidance for marketers and destination managers shaping tourism destination brand image on visual social media. Specifically, fine-tuned adjustments to color framing in the following six dimensions are associated with more favorable potential consumer affective positivity and polarity:
For average hue warmth, use warm colors to convey the high-positivity, high-polarity affective combination, e.g., a golden beach at sunset or a red-toned historic building facade as the main background.
For hue variety, reduce the number of hue categories, which was associated with higher positivity and polarity. For example, use an autumn maple forest photo composed solely of red, orange, and analogous hues rather than a scene mixing red, green, yellow, and other disparate hues.
For average saturation, strike a balance. Lower average saturation favors positivity, while higher average saturation favors polarity. A moderately saturated palette such as Morandi tones may approach the optimum.
For high-saturation area ratio, balance the opposing demands as well. A high-saturation figure placed as the visual focal point against a Morandi-toned background exemplifies this strategy.
For average brightness, adopt a moderately high brightness range to simultaneously enhance both positivity and polarity.
For contrast, reduce contrast to favor positivity while maintaining moderate contrast to favor polarity, which means pursuing moderate contrast fluctuations in relatively bright scenes, maintaining soft light–shadow transitions, and avoiding pitch-dark shadows or harsh glare.
There are two limitations of this study. First, the external validity of these findings in cross-platform and cross-cultural contexts requires further verification. Although RedNote has a massive user base and extensive tourism check-in content, it operates within a specific platform and cultural context; the affective associations of color framing may differ across platforms and cultures, warranting future empirical investigation. Second, our comment-based affect measurement cannot fully capture real-time affective responses. While behavioral comment data align with the natural interactive context of visual social media and avoid the pitfalls of self-report inaccuracy, textual comments are inherently lagged products of post-perceptual processing. They cannot fully reconstruct the intuitive psychological fluctuations and immediate physiological response at the moment of image viewing. Future research could employ physiological measures such as eye-tracking, heart rate monitoring, or skin conductance in experimental designs to capture real-time affective responses.
Author Contributions
Conceptualization, C.Z.; methodology, C.Z. and Y.L.; software, C.Z. and Y.L.; validation, C.Z. and S.L.; formal analysis, C.Z. and Y.L.; investigation, S.L.; resources, C.Z. and S.L.; data curation, Y.L.; writing—original draft preparation, C.Z. and Y.L.; writing—review and editing, C.Z. and S.L.; visualization, C.Z. and Y.L.; funding acquisition, C.Z. All authors have read and agreed to the published version of the manuscript.
Funding
This research was funded by the General Research Project of Ministry of Education (MOE) Foundation of China on Humanities and Social Sciences, grant number 25YJCZH395.
Data Availability Statement
De-identified data will be made available upon request.
Conflicts of Interest
The authors declare no conflicts of interest.
References
- Chen, Y.; Zhang, Z.; Jie, J.W.; Sun, H. What drives the tourist Daka? An empirical study based on the perspective of dual motivation. Asia Pac. J. Tour. Res. 2024, 29, 836–851. [Google Scholar] [CrossRef] [Scilit]
- Stylianou-Lambert, T. Tourists with Cameras: Reproducing or Producing? Ann. Tour. Res. 2012, 39, 1817–1838. [Google Scholar] [CrossRef] [Scilit]
- Hervás-Cortina, C.M.; Ruiz-Molina, M.E.; Gil-Saura, I.; Bordian, M. How Social Media Content Shapes Destination Image and eWOM: The Moderating Role of Personality in Lesser-Known Tourism Destinations. J. Theor. Appl. Electron. Commer. Res. 2026, 21, 164. [Google Scholar] [CrossRef] [Scilit]
- Chong, D.; Druckman, J.N. Framing Theory. Annu. Rev. Political Sci. 2007, 10, 103–126. [Google Scholar] [CrossRef] [Scilit]
- Rodriguez, L.; Dimitrova, D.V. The Levels of Visual Framing. J. Vis. Lit. 2011, 30, 48–65. [Google Scholar] [CrossRef] [Scilit]
- Kress, G.; van Leeuwen, T. Reading Images: The Grammar of Visual Design, 3rd ed.; Routledge: London, UK, 2020. [Google Scholar]
- Valdez, P.; Mehrabian, A. Effects of Color on Emotions. J. Exp. Psychol. Gen. 1994, 123, 394–409. [Google Scholar] [CrossRef] [PubMed]
- Garber, L.L.; Hyatt, E.M. Color as a Tool for Visual Persuasion. In Persuasive Imagery: A Consumer Response Perspective; Scott, L.M., Batra, R., Eds.; Lawrence Erlbaum Associates: Mahwah, NJ, USA, 2003; pp. 313–336. [Google Scholar]
- Gerend, M.A.; Sias, T. Message Framing and Color Priming: How Subtle Threat Cues Affect Persuasion. J. Exp. Soc. Psychol. 2009, 45, 999–1002. [Google Scholar] [CrossRef] [Scilit]
- Hine, T. The Total Package: The Secret History and Hidden Meanings of Boxes, Bottles, Cans, and Other Persuasive Containers; Little, Brown and Company: Boston, MA, USA, 1997. [Google Scholar]
- Hilbert, D.R. Color and Color Perception: A Study in Anthropocentric Realism; CSLI Publications: Stanford, CA, USA, 1987. [Google Scholar]
- Bo, Y.; Yu, J.; Zhang, K. Computational Aesthetics and Applications. Vis. Comput. Ind. Biomed. Art 2018, 1, 6. [Google Scholar] [CrossRef] [Scilit] [PubMed]
- Liu, J.; Lughofer, E.; Zeng, X.; Li, Z. The Power of Visual Texture in Aesthetic Perception: An Exploration of the Predictability of Perceived Aesthetic Emotions. Comput. Intell. Neurosci. 2018, 2018, 1812980. [Google Scholar] [CrossRef] [Scilit] [PubMed]
- Qian, L.; Guo, J.; Qiu, H.; Zheng, C.; Ren, L. Exploring destination image of dark tourism via analyzing user generated photos: A deep learning approach. Tour. Manag. Perspect. 2023, 48, 101147. [Google Scholar] [CrossRef] [Scilit]
- Wang, X.; Mou, N.; Zhu, S.; Yang, T.; Zhang, X.; Zhang, Y. How to perceive tourism destination image? A visual content analysis based on inbound tourists’ photos. J. Destin. Mark. Manag. 2024, 33, 100923. [Google Scholar] [CrossRef] [Scilit]
- Yu, C.E.; Xie, S.Y.; Wen, J. Coloring the Destination: The Role of Color Psychology on Instagram. Tour. Manag. 2020, 80, 104110. [Google Scholar] [CrossRef] [Scilit]
- Yu, J.; Egger, R. Color and engagement in touristic Instagram pictures: A machine learning approach. Ann. Tour. Res. 2021, 89, 103204. [Google Scholar] [CrossRef] [Scilit]
- Chen, C.F.; Tsai, D. How destination image and evaluative factors affect behavioral intentions? Tour. Manag. 2007, 28, 1115–1122. [Google Scholar] [CrossRef] [Scilit]
- Stylidis, D.; Shani, A.; Belhassen, Y. Testing an integrated destination image model across residents and tourists. Tour. Manag. 2017, 58, 184–195. [Google Scholar] [CrossRef] [Scilit]
- Afshardoost, M.; Eshaghi, M.S. Destination image and tourist behavioural intentions: A meta-analysis. Tour. Manag. 2020, 81, 104154. [Google Scholar] [CrossRef] [Scilit]
- Song, H.; Xiang, G.; Tang, Y.; Wei, J. How Does Visual Modification of Destination Photos on Social Media Influence Revisit Intention? A Double-Edged Mechanism of Trust Gain and Value Co-Destruction. J. Theor. Appl. Electron. Commer. Res. 2026, 21, 302. [Google Scholar] [CrossRef] [Scilit]
- Pan, S.; Lee, J.; Tsai, H. Travel Photos: Motivations, Image Dimensions, and Affective Qualities of Places. Tour. Manag. 2014, 40, 59–69. [Google Scholar] [CrossRef] [Scilit]
- He, Y.; Li, X.; Zhong, K. Small Changes Make a Big Difference: The Impact of Visual Symbol Color Lightness on Destination Image. J. Travel Res. 2024, 63, 1013–1028. [Google Scholar] [CrossRef] [Scilit]
- Chen, J.; Lai, I.K.W.; Wu, X. Using Colour in Photographs to Tell the Past of Cultural Heritage Sites and Attract Tourists to Future Visits: The Mediating Effect of Emotional Response. J. Hosp. Tour. Manag. 2025, 65, 101344. [Google Scholar] [CrossRef] [Scilit]
- Lazer, D.; Pentland, A.; Watts, D.; Aral, S.; Athey, S.; Contractor, N.; Freelon, D.; Gonzalez-Bailon, S.; King, G.; Margetts, H.; et al. Computational social science: Obstacles and opportunities. Science 2020, 369, 1060–1062. [Google Scholar] [CrossRef] [Scilit] [PubMed]
- He, Q. RedNote’s Monthly Active Users Have Exceeded 400 Million (Beijing Business Today). 2026. Available online: https://www.bbtnews.com.cn/2026/0527/594513.shtml (accessed on 1 August 2026).
- Hartmann, J.; Heitmann, M.; Schamp, C.; Netzer, O. The Power of Brand Selfies. J. Mark. Res. 2021, 58, 1159–1177. [Google Scholar] [CrossRef] [Scilit]
- Liu, L.; Dzyabura, D.; Mizik, N. Visual Listening In: Extracting Brand Image Portrayed on Social Media. Mark. Sci. 2020, 39, 669–686. [Google Scholar] [CrossRef] [Scilit]
- Bülbül, N.; Çayırağası, F.; Efendioğlu, I.H. SORCIS Model: Social Media Marketing Dimensions, Consumer Decision-Making Styles, and Purchase Intention. Merc. Neg. 2026, 27, 107–142. [Google Scholar] [CrossRef] [Scilit]
- González-Rodríguez, M.R.; Martínez-Torres, M.R.; Toral, S.L. Monitoring Travel-Related Information on Social Media through Sentiment Analysis. In Proceedings of the 7th IEEE/ACM International Conference on Utility and Cloud Computing (UCC 2014); IEEE Computer Society: Washington, DC, USA, 2014; pp. 636–641. [Google Scholar] [CrossRef] [Scilit]
- Paolanti, M.; Mancini, A.; Frontoni, E.; Felicetti, A.; Marinelli, L.; Marcheggiani, E.; Pierdicca, R. Tourism Destination Management Using Sentiment Analysis and Geo-Location Information: A Deep Learning Approach. Inf. Technol. Tour. 2021, 23, 241–264. [Google Scholar] [CrossRef] [Scilit]
- Smith, A.R. Color Gamut Transform Pairs. In Proceedings of the 5th Annual Conference on Computer Graphics and Interactive Techniques (SIGGRAPH 1978); ACM: New York, NY, USA, 1978; pp. 12–19. [Google Scholar] [CrossRef] [Scilit]
- Labrecque, L.I.; Patrick, V.M.; Milne, G.R. The Marketers’ Prismatic Palette: A Review of Color Research and Future Directions. Psychol. Mark. 2013, 30, 187–202. [Google Scholar] [CrossRef] [Scilit]
- Song, L.; Zhang, G.; Ma, L.; Silvennoinen, J.; Cong, F. Comparative Analysis of Color Emotional Perception in Art and Non-Art University Students: Hue, Saturation, and Brightness Effects in the Munsell Color System. BMC Psychol. 2025, 13, 650. [Google Scholar] [CrossRef] [Scilit] [PubMed]
- Phumchan, N.; Tuaycharoen, N. Effects of Illuminance and Correlated Colour Temperature on Emotional State and Perception of Thai Customers in Clothing Retail Stores. Asia-Pac. J. Sci. Technol. 2022, 27, 9. [Google Scholar] [CrossRef]
- Pilelienė, L.; Grigaliūnaitė, V. Colour Temperature in Advertising and Its Impact on Consumer Purchase Intentions. Oecon. Copernic. 2017, 8, 657–669. [Google Scholar] [CrossRef] [Scilit]
- Wilms, L.; Oberfeld, D. Color and Emotion: Effects of Hue, Saturation, and Brightness. Psychol. Res. 2018, 82, 896–914. [Google Scholar] [CrossRef] [Scilit] [PubMed]
- Elliot, A.J.; Maier, M.A. Color Psychology: Effects of Perceiving Color on Psychological Functioning in Humans. Annu. Rev. Psychol. 2014, 65, 95–120. [Google Scholar] [CrossRef] [Scilit] [PubMed]
- Reber, R.; Schwarz, N.; Winkielman, P. Processing Fluency and Aesthetic Pleasure: Is Beauty in the Perceiver’s Processing Experience? Personal. Soc. Psychol. Rev. 2004, 8, 364–382. [Google Scholar] [CrossRef] [Scilit] [PubMed]
- Weijs, M.L.; Jonauskaite, D.; Reutimann, R.; Mohr, C.; Lenggenhager, B. Effects of Environmental Colours in Virtual Reality: Physiological Arousal Affected by Lightness and Hue. R. Soc. Open Sci. 2023, 10, 230432. [Google Scholar] [CrossRef] [Scilit] [PubMed]
- Kanuri, V.K.; Hughes, C.; Hodges, B.T. Standing Out from the Crowd: When and Why Color Complexity in Social Media Images Increases User Engagement. Int. J. Res. Mark. 2024, 41, 174–193. [Google Scholar] [CrossRef] [Scilit]
- Lin, C.; Mottaghi, S.; Shams, L. The Effects of Color and Saturation on the Enjoyment of Real-Life Images. Psychon. Bull. Rev. 2024, 31, 361–372. [Google Scholar] [CrossRef] [Scilit] [PubMed]
- Gorn, G.J.; Chattopadhyay, A.; Yi, T.; Dahl, D.W. Effects of Color as an Executional Cue in Advertising: They’re in the Shade. Manag. Sci. 1997, 43, 1387–1400. [Google Scholar] [CrossRef] [Scilit]
- Bakhshi, S.; Shamma, D.A.; Kennedy, L.; Gilbert, E. Why We Filter Our Photos and How It Impacts Engagement. In Proceedings of the Ninth International AAAI Conference on Web and Social Media (ICWSM 2015); AAAI Press: Washington, DC, USA, 2015; pp. 12–21. [Google Scholar] [CrossRef] [Scilit]
- Piga, B.E.A.; Stancato, G.; Rainisio, N.; Boffi, M. How Do Nature-Based Solutions’ Color Tones Influence People’s Emotional Reaction? An Assessment via Virtual and Augmented Reality in a Participatory Process. Sustainability 2021, 13, 13388. [Google Scholar] [CrossRef] [Scilit]
- Camgöz, N.; Yener, C.; Güvenç, D. Effects of Hue, Saturation, and Brightness on Preference. Color Res. Appl. 2002, 27, 199–207. [Google Scholar] [CrossRef] [Scilit]
- Itti, L.; Koch, C. Computational Modelling of Visual Attention. Nat. Rev. Neurosci. 2001, 2, 194–203. [Google Scholar] [CrossRef] [Scilit] [PubMed]
- Fuller, S.; Carrasco, M. Exogenous Attention and Color Perception: Performance and Appearance of Saturation and Hue. Vis. Res. 2006, 46, 4032–4047. [Google Scholar] [CrossRef] [Scilit] [PubMed]
- Sharma, M.; Peng, Y. How Visual Aesthetics and Calorie Density Predict Food Image Popularity on Instagram: A Computer Vision Analysis. Health Commun. 2024, 39, 577–591. [Google Scholar] [CrossRef] [Scilit] [PubMed]
- Lakens, D.; Fockenberg, D.A.; Lemmens, K.P.H.; Ham, J.; Midden, C.J.H. Brightness Differences Influence the Evaluation of Affective Pictures. Cogn. Emot. 2013, 27, 1225–1246. [Google Scholar] [CrossRef] [Scilit] [PubMed]
- Specker, E.; Leder, H.; Rosenberg, R.; Hegelmaier, L.M.; Brinkmann, H.; Mikuni, J.; Kawabata, H. The Universal and Automatic Association between Brightness and Positivity. Acta Psychol. 2018, 186, 47–53. [Google Scholar] [CrossRef] [Scilit] [PubMed]
- Suk, H.J.; Irtel, H. Emotional Response to Color Across Media. Color Res. Appl. 2010, 35, 64–77. [Google Scholar] [CrossRef] [Scilit]
- Tang, Y.; Cunningham, W.A.; Walther, D.B. Less Is More: Aesthetic Liking Is Inversely Related to Metabolic Expense by the Visual System. PNAS Nexus 2025, 4, pgaf347. [Google Scholar] [CrossRef] [Scilit] [PubMed]
- Lu, Z.; Guo, B.; Boguslavsky, A.; Cappiello, M.; Zhang, W.; Meng, M. Distinct Effects of Contrast and Color on Subjective Rating of Fearfulness. Front. Psychol. 2015, 6, 1521. [Google Scholar] [CrossRef] [Scilit] [PubMed]
- Berlyne, D.E. Aesthetics and Psychobiology; Appleton-Century-Crofts: New York, NY, USA, 1971. [Google Scholar]
- Li, Y.; Xie, Y. Is a Picture Worth a Thousand Words? An Empirical Study of Image Content and Social Media Engagement. J. Mark. Res. 2020, 57, 1–19. [Google Scholar] [CrossRef] [Scilit]
- Bai, J.; Bai, S.; Yang, S.; Wang, S.; Tan, S.; Wang, P.; Lin, J.; Zhou, C.; Zhou, J. Qwen-VL: A Versatile Vision-Language Model for Understanding, Localization, Text Reading, and Beyond. arXiv 2023, arXiv:2308.12966. [Google Scholar] [CrossRef] [Scilit]
- Lokmanoglu, A.D.; Walter, D. Topic Modeling of Video and Image Data: A Visual Semantic Unsupervised Approach. Commun. Methods Meas. 2025, 19, 232–279. [Google Scholar] [CrossRef] [Scilit]
- Peng, Y.; Wen, T.J.; Yang, J. A Computer Vision Methodology to Predict Brand Personality from Image Features. J. Advert. 2024, 53, 626–638. [Google Scholar] [CrossRef] [Scilit]
- Molnar, C. Interpretable Machine Learning, 3rd ed.; Christoph Molnar: Munich, Germany, 2025. [Google Scholar]
- Chen, T.; Guestrin, C. XGBoost: A Scalable Tree Boosting System. In Proceedings of the 22nd ACM SIGKDD International Conference on Knowledge Discovery and Data Mining, San Francisco, CA, USA, 13–17 August 2016; KDD ’16. pp. 785–794. [Google Scholar] [CrossRef] [Scilit]
- Lundberg, S.M.; Lee, S.I. A Unified Approach to Interpreting Model Predictions. In Proceedings of the Advances in Neural Information Processing Systems 30 (NIPS 2017), Long Beach, CA, USA, 4–9 December 2017; pp. 4765–4774. [Google Scholar]
- Ding, R. Platformization and Re-creativity:A Network Agenda Setting Study of Multiple Subjects on RedNote. J. Mass Commun. Mon. 2025, 69–82. [Google Scholar] [CrossRef]
- Cai, Q.; Zhang, A. Traveling on RedNote: A Perspective on the Online Dissemination of Travel Guides. Mod. Commun. 2025, 47, 139–149. [Google Scholar] [CrossRef]
- Guo, J. The Discourse of ‘Beast of Burden’ (Niuma) on Xiaohongshu: A Critical Analysis of Digital Labor and Self-Deprecation. Discourse Context Media 2026, 73, 101047. [Google Scholar] [CrossRef] [Scilit]
- Gu, J. Reconstructing Divorce on Xiaohongshu: A Corpus-Assisted Critical Narrative Analysis. Soc. Semiot. 2026, 1–22. [Google Scholar] [CrossRef] [Scilit]
- Pu, Y.; Ma, R.; Li, J.; Wei, Y.; Pan, X.; Zhang, X. The Impact of Social Media Information Dissemination on Consumer Brand Perception. J. Organ. End User Comput. 2025, 37, 1–33. [Google Scholar] [CrossRef] [Scilit]
- Ke, Y.; Tang, X.; Jing, F. The Design of High-Level Features for Photo Quality Assessment. In Proceedings of the 2006 IEEE Computer Society Conference on Computer Vision and Pattern Recognition (CVPR 2006); IEEE: Piscataway, NJ, USA, 2006; Volume 1, pp. 419–426. [Google Scholar] [CrossRef] [Scilit]
- Hasler, D.; Süsstrunk, S.E. Measuring Colorfulness in Natural Images. SPIE Proc. 2003, 5007, 87–95. [Google Scholar] [CrossRef] [Scilit]
- Kim, H.; Lennon, S.J. E-atmosphere, Emotional, Cognitive, and Behavioral Responses. J. Fash. Mark. Manag. 2010, 14, 412–428. [Google Scholar] [CrossRef] [Scilit]
- Sun, J. Jieba Chinese Word Segmentation. 2026. Available online: https://github.com/fxsjy/jieba (accessed on 1 August 2026).
- Wang, R. SnowNLP: Python Library for Processing Chinese Text. Version 0.12.3. 2026. Available online: https://github.com/isnowfy/snownlp (accessed on 1 August 2026).
- Yan, P.; Yu, C.; Zhang, C.; Shi, H.; Wang, S. From pixels to perceptions: Analyzing rural tourism image diffusion through Douyin-style short videos. Asia Pac. J. Mark. Logist. 2026. [Google Scholar] [CrossRef] [Scilit]
- He, M.; Zhang, R. Research on audience perception and influence mechanism of museums based on network text analysis: A case study of the Chinese Language Museum. Digit. Scholarsh. Humanit. 2026, 41, 1352–1364. [Google Scholar] [CrossRef] [Scilit]
- Huang, S.; Lu, X.; Lu, J.; Zhang, J. Mining the Tourism Destination Image and Analyzing Influence Mechanisms. ISPRS Int. J. -Geo-Inf. 2026, 15, 74. [Google Scholar] [CrossRef] [Scilit]
- Wang, H.; Ke, Z.; Huang, B.; Li, G.; Gu, K.; Xu, X.; Chu, Y. Differentiated Drivers of Tourist Sentiment in Wellness Tourism Destinations: A User-Generated Content (UGC)-Based Analysis of Spatial-Temporal Patterns. Sustainability 2026, 18, 3037. [Google Scholar] [CrossRef] [Scilit]
- Pang, B.; Lee, L. Opinion Mining and Sentiment Analysis; Now Publishers: Boston, MA, USA, 2008. [Google Scholar]
- Peng, Y.; Jemmott, J.B. Feast for the Eyes: Effects of Food Perceptions and Computer Vision Features on Food Photo Popularity. Int. J. Commun. 2018, 12, 313–336. [Google Scholar]
- Hair, J.F.; Black, W.C.; Babin, B.J.; Anderson, R.E.; Tatham, R.L. Multivariate Data Analysis, 7th ed.; Prentice Hall: Upper Saddle River, NJ, USA, 2010. [Google Scholar]
- Jonauskaite, D.; Mohr, C. Do We Feel Colours? A Systematic Review of 128 Years of Psychological Research Linking Colours and Emotions. Psychon. Bull. Rev. 2025, 32, 1457–1486. [Google Scholar] [CrossRef] [Scilit] [PubMed]
- Febbraio, F.; Collina, S.; Lepida, C.; Kourtesis, P. Colour Perception in Immersive Virtual Reality: Emotional and Physiological Responses to Fifteen Munsell Hues. Virtual Worlds 2025, 4, 45. [Google Scholar] [CrossRef] [Scilit]
- Schloss, K.B.; Palmer, S.E. Aesthetic Response to Color Combinations: Preference, Harmony, and Similarity. Atten. Percept. Psychophys. 2011, 73, 551–571. [Google Scholar] [CrossRef] [Scilit] [PubMed]
- Li, Q.; Ting, G.; Kikuno, Y.; Yokosawa, K. The Influence of Increasing Color Variety on Numerosity Estimation and Counting. Psychon. Bull. Rev. 2025, 32, 1391–1401. [Google Scholar] [CrossRef] [Scilit] [PubMed]
- Shi, Y.; Tu, Y.; Wang, L.; Zhu, N.; Zhang, D. How Visual Discomfort Is Affected by Colour Saturation: A fNIRS Study. IEEE Photonics J. 2022, 14, 1–7. [Google Scholar] [CrossRef] [Scilit]
- Pichierri, M.; Pino, G. Less Saturated, More Eco-Friendly: Color Saturation and Consumer Perception of Product Sustainability. Psychol. Mark. 2023, 40, 1830–1849. [Google Scholar] [CrossRef] [Scilit]
- Meyers-Levy, J.; Peracchio, L.A. Understanding the Effects of Color: How the Correspondence between Available and Required Resources Affects Attitudes. J. Consum. Res. 1995, 22, 121–138. [Google Scholar] [CrossRef] [Scilit] [PubMed]
- Wang, X.; Wang, Z.; Qian, X.; Qiao, H. Impact of Luminous Environment on Visual Attention and Emotional Response in Screen-Based Immersive Narrative Spaces: An Experimental Study. Buildings 2026, 16, 696. [Google Scholar] [CrossRef] [Scilit]
- Hedger, N.; Adams, W.J.; Garner, M. Fearful Faces Have a Sensory Advantage in the Competition for Awareness. J. Exp. Psychol. Hum. Percept. Perform. 2015, 41, 1748–1757. [Google Scholar] [CrossRef] [Scilit] [PubMed]
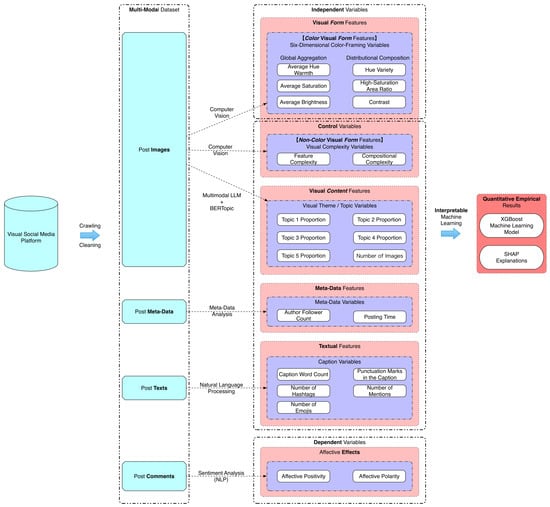
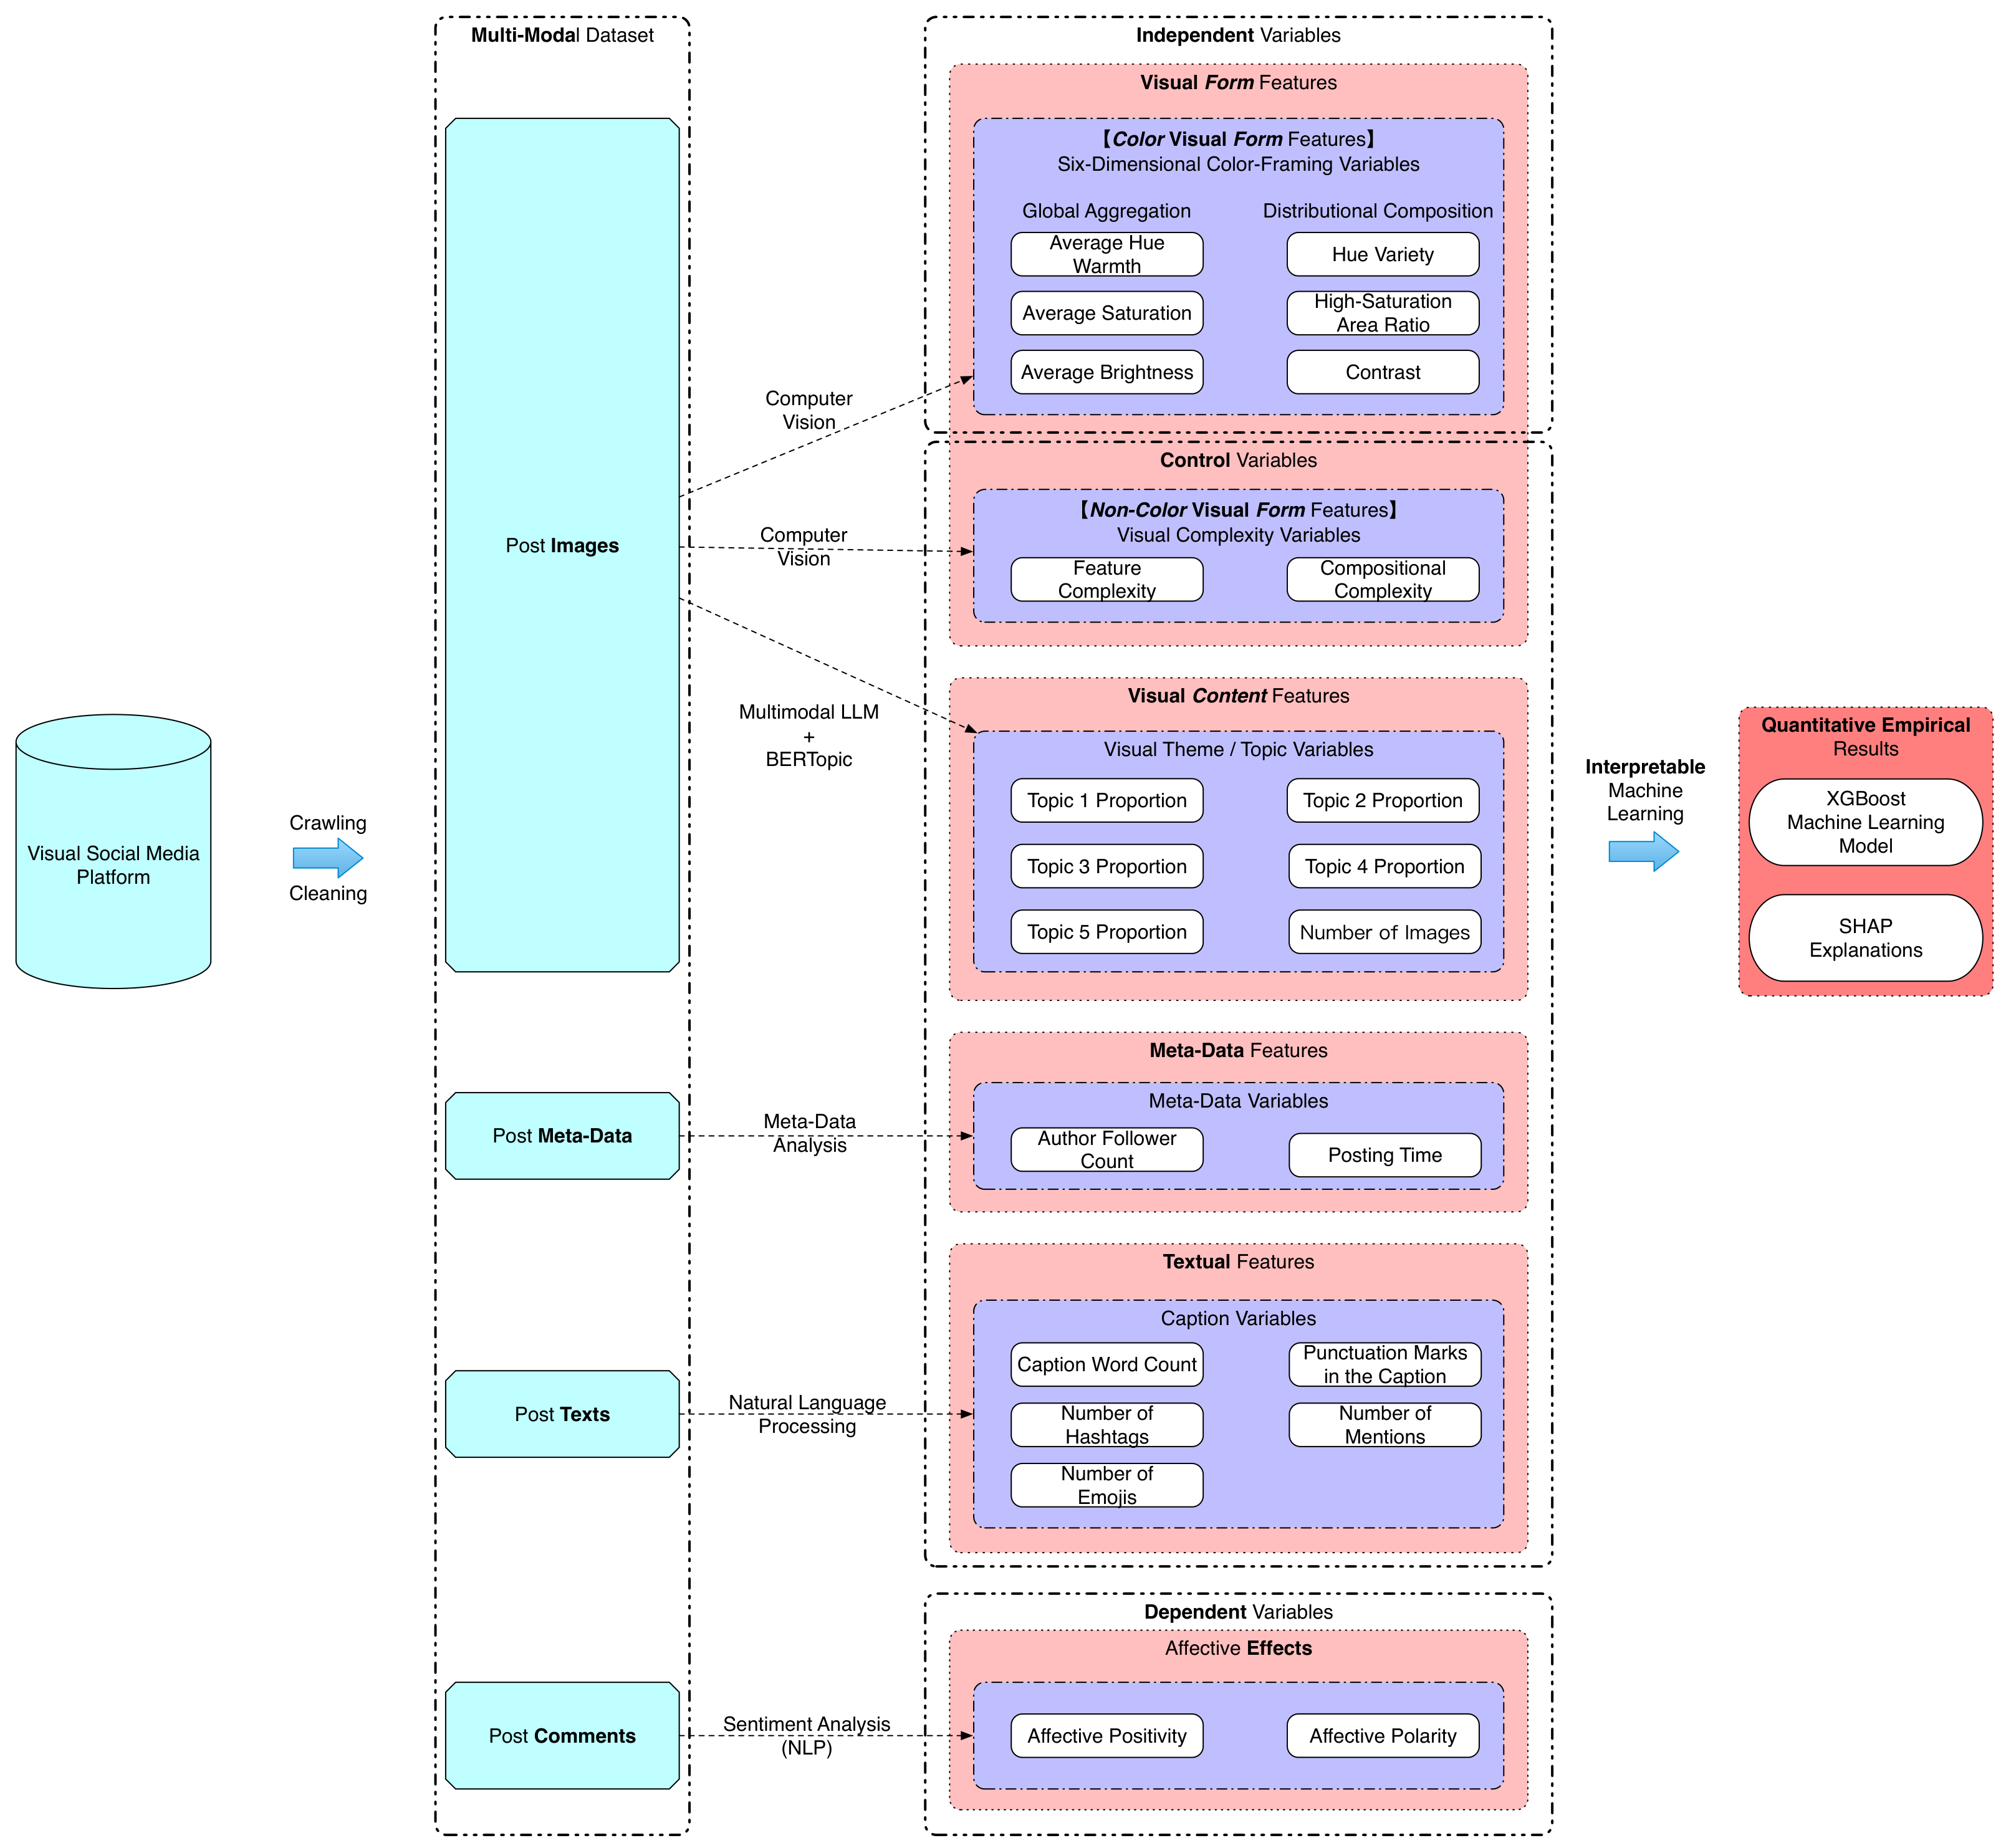
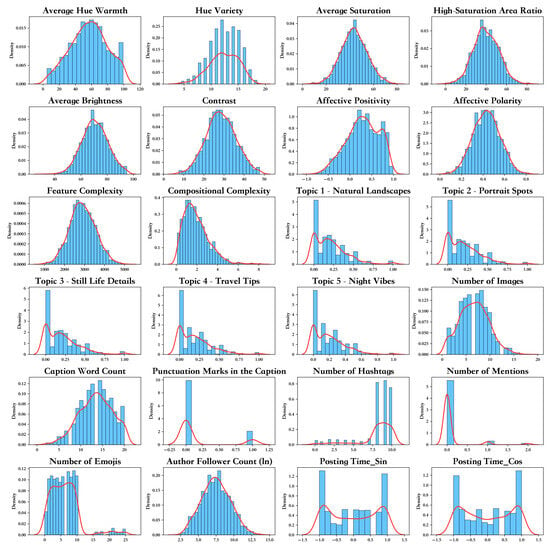
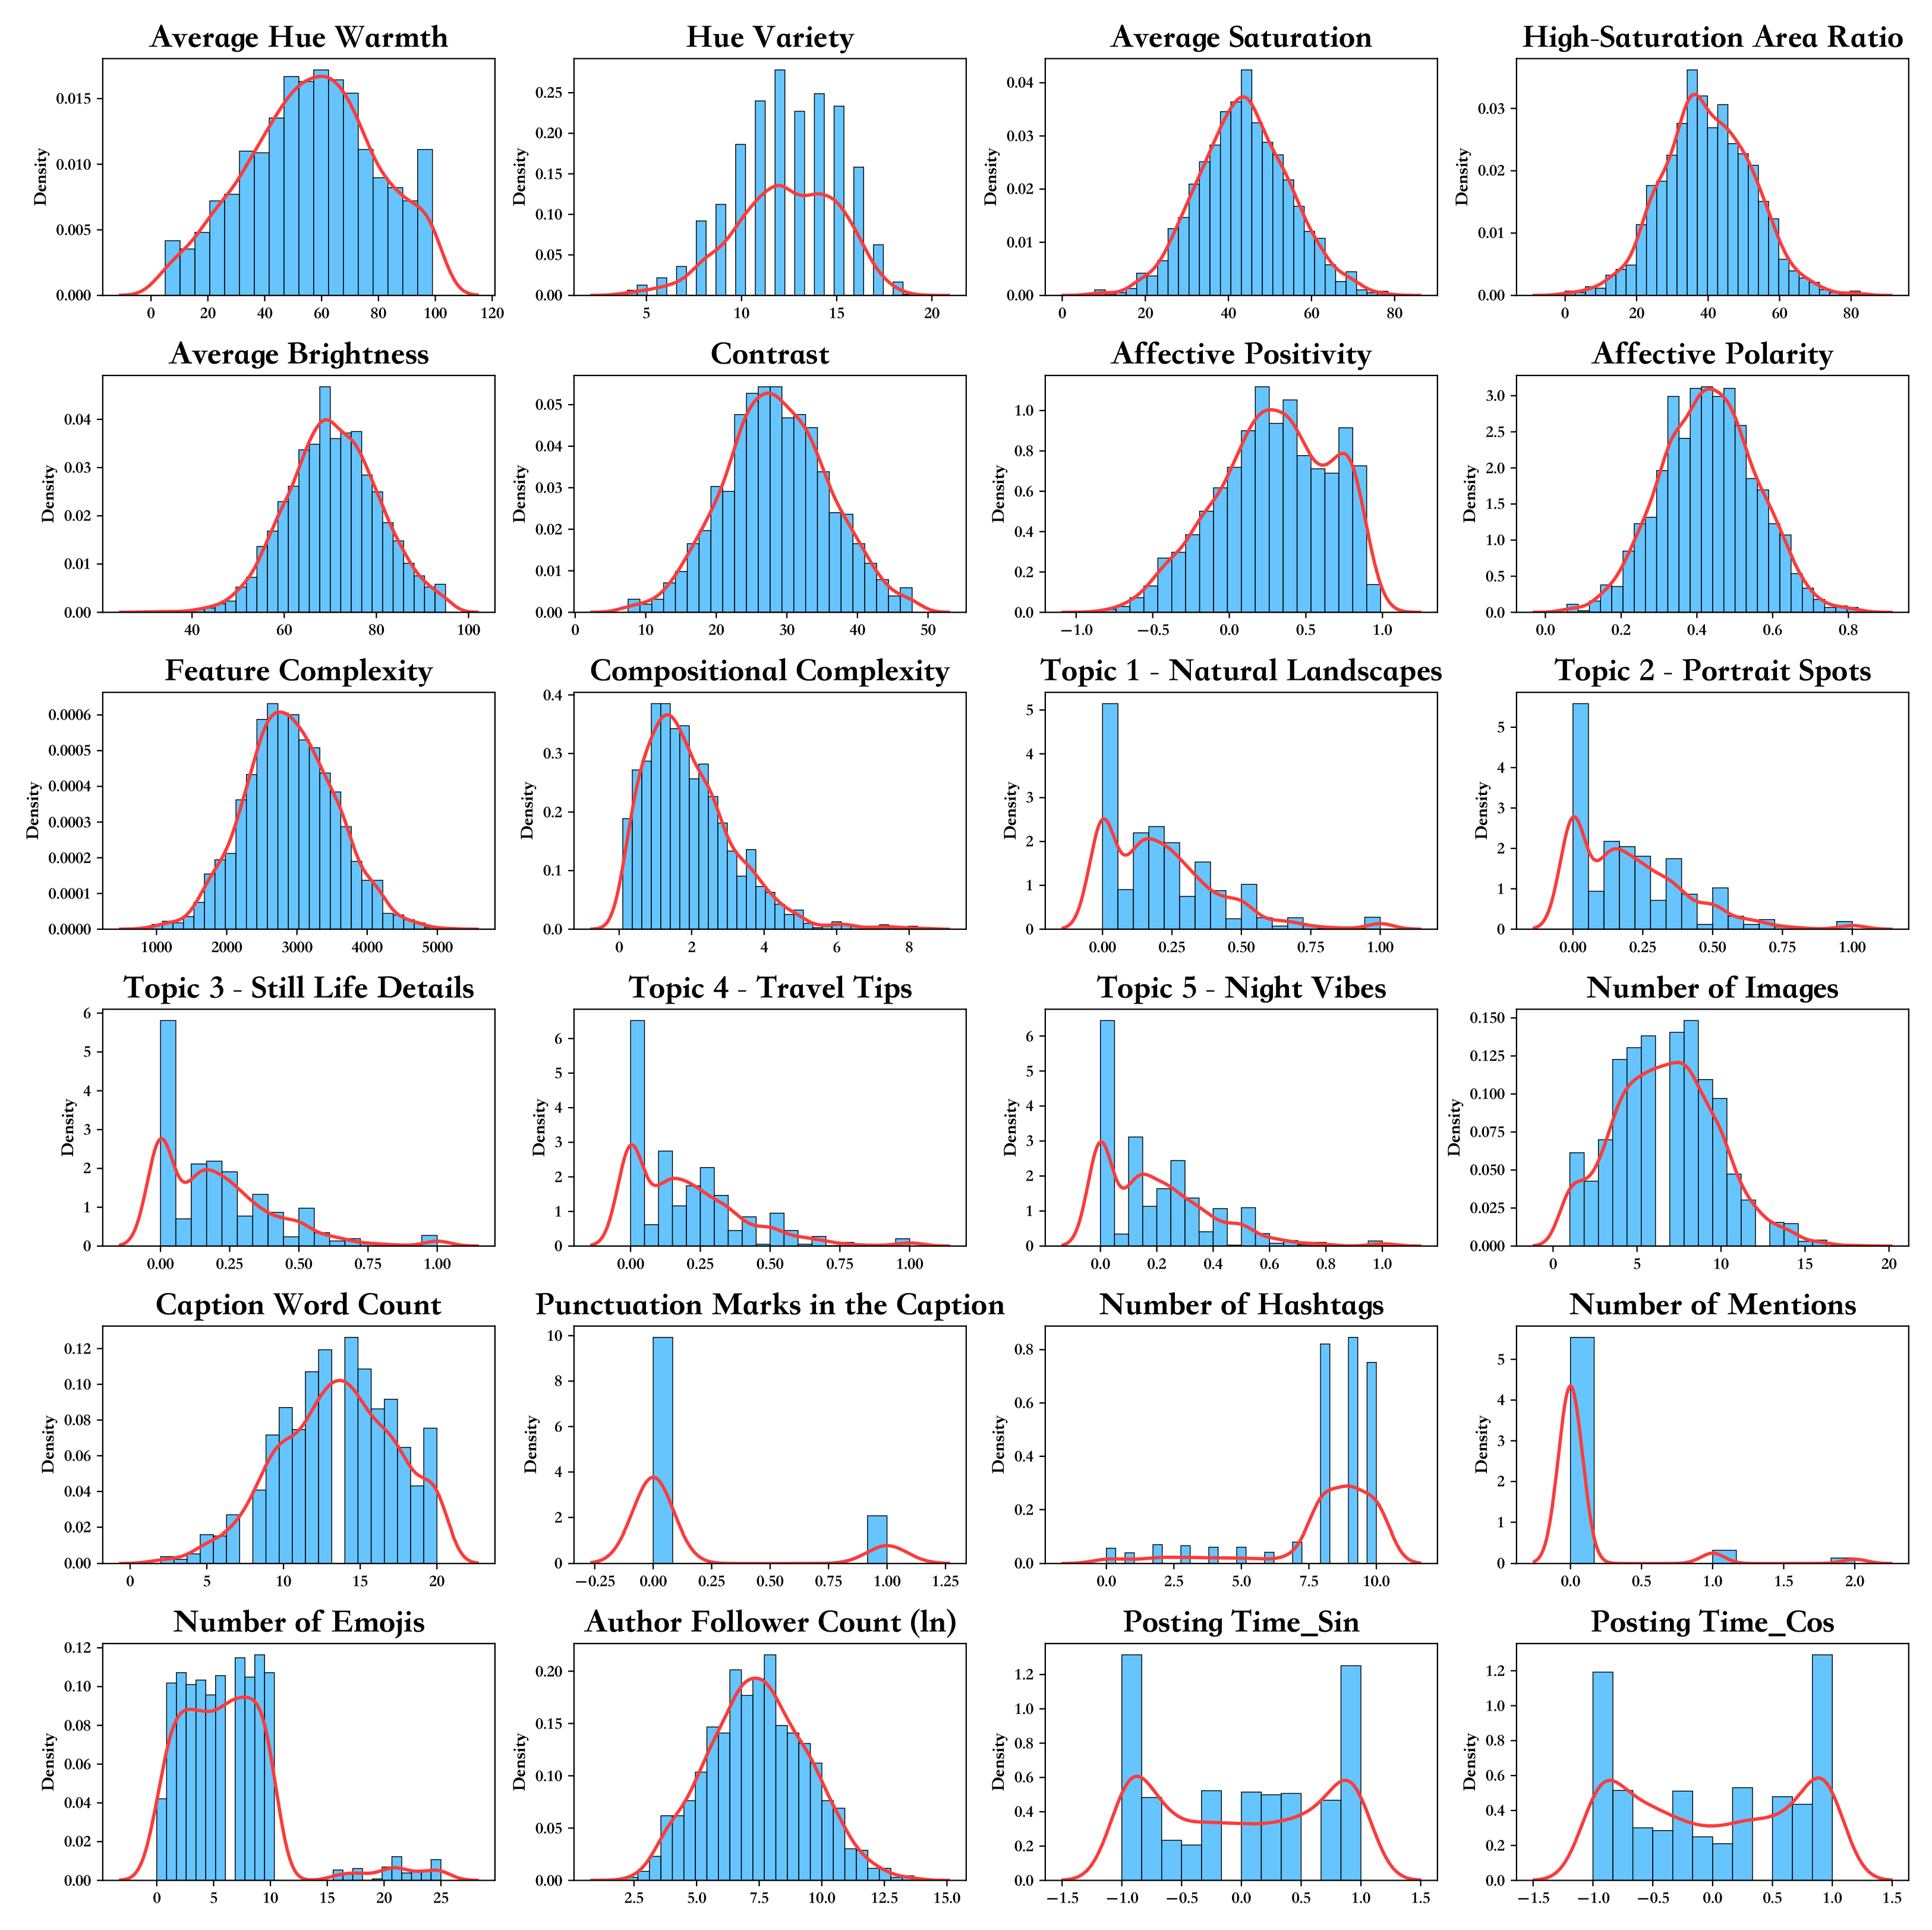
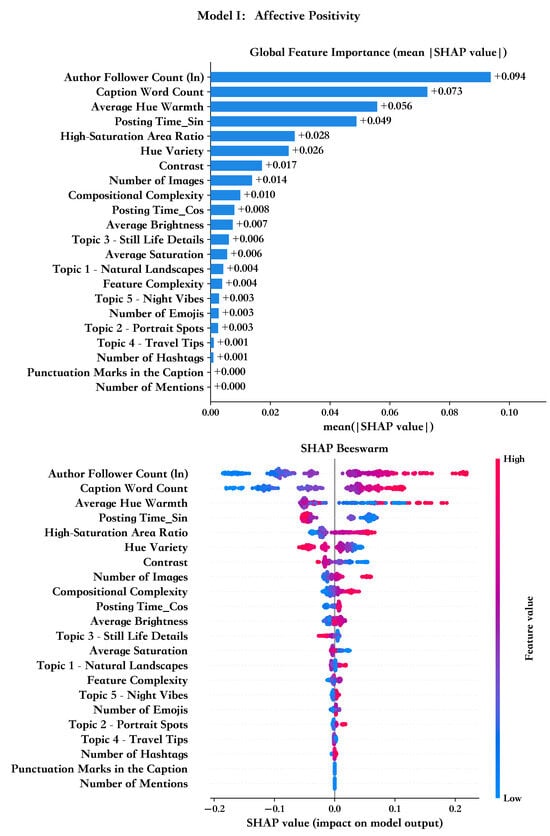
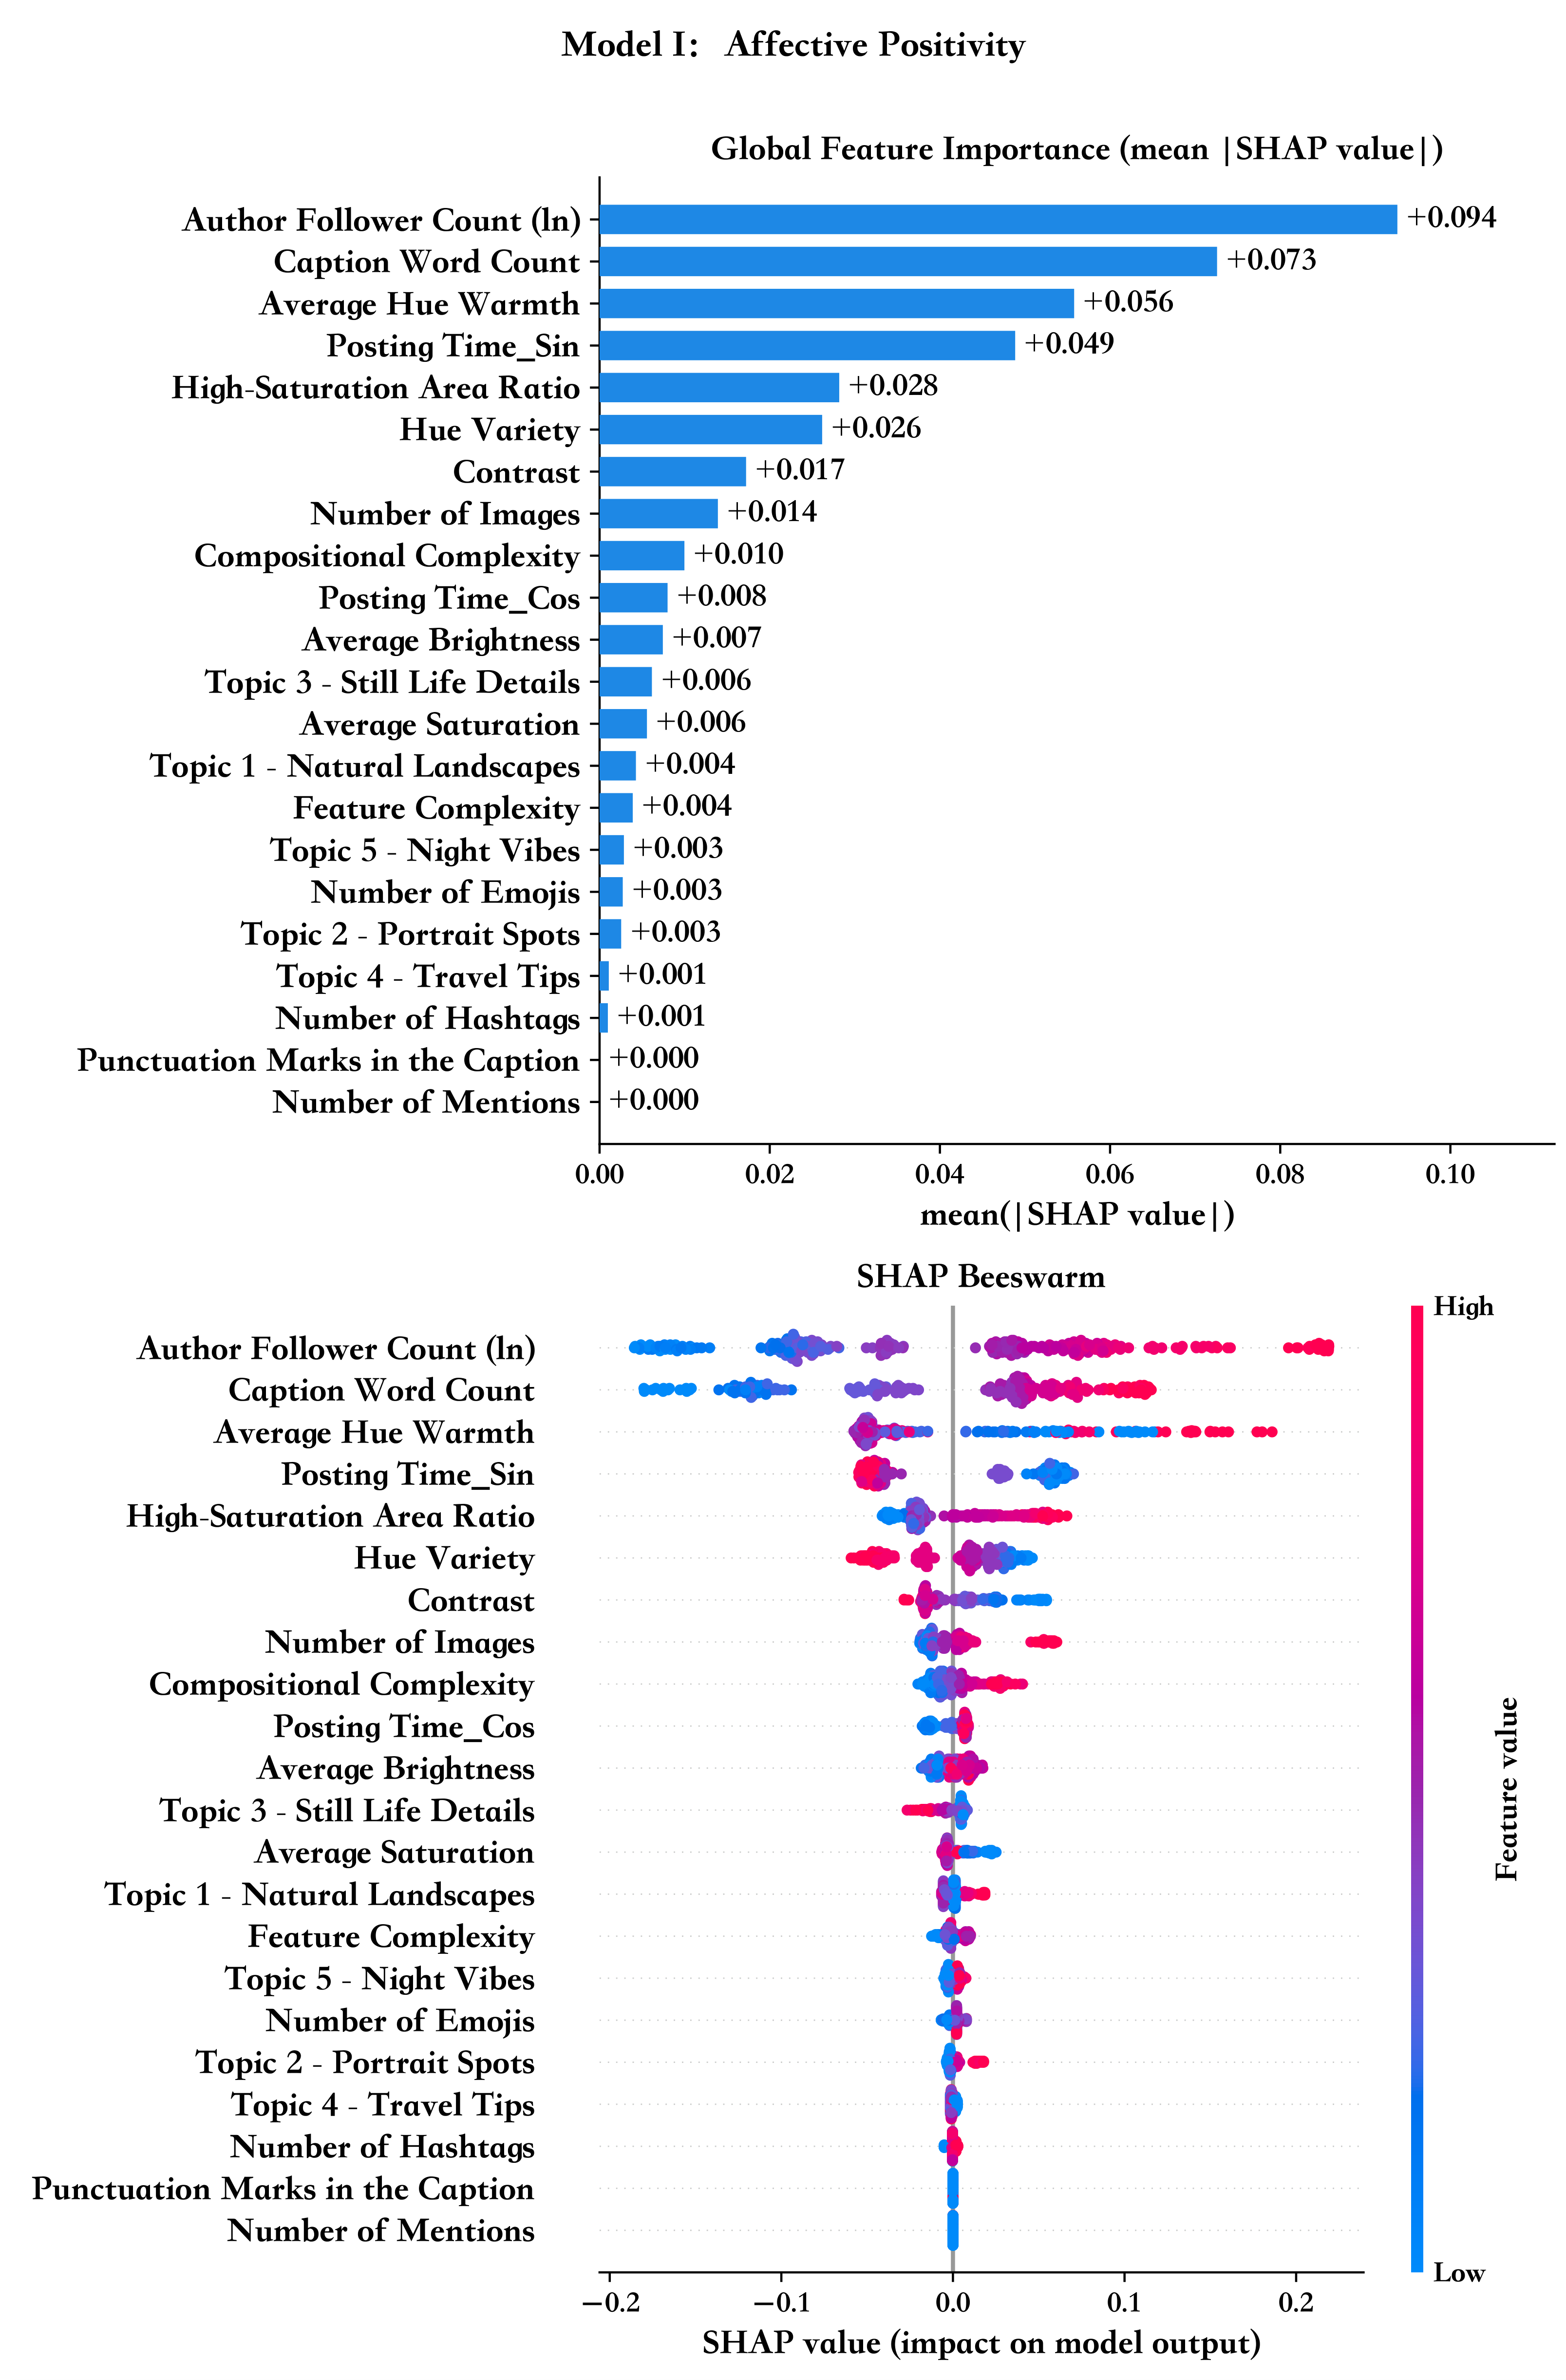
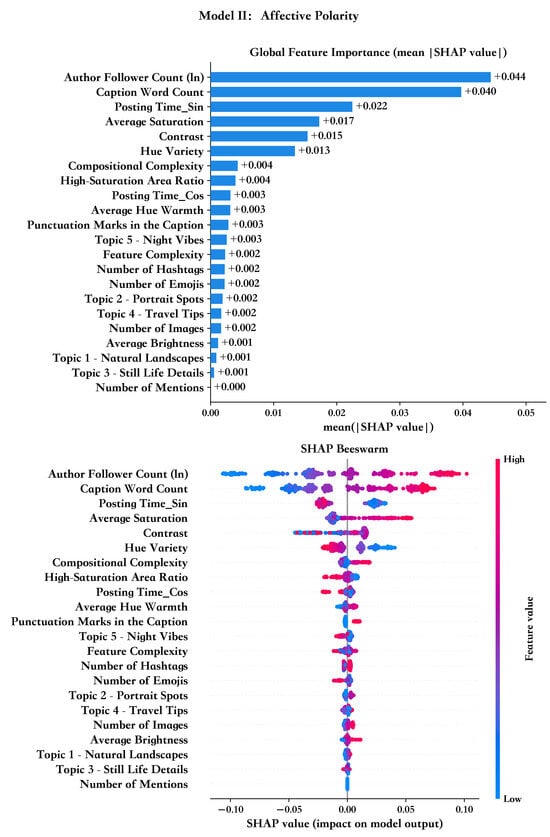
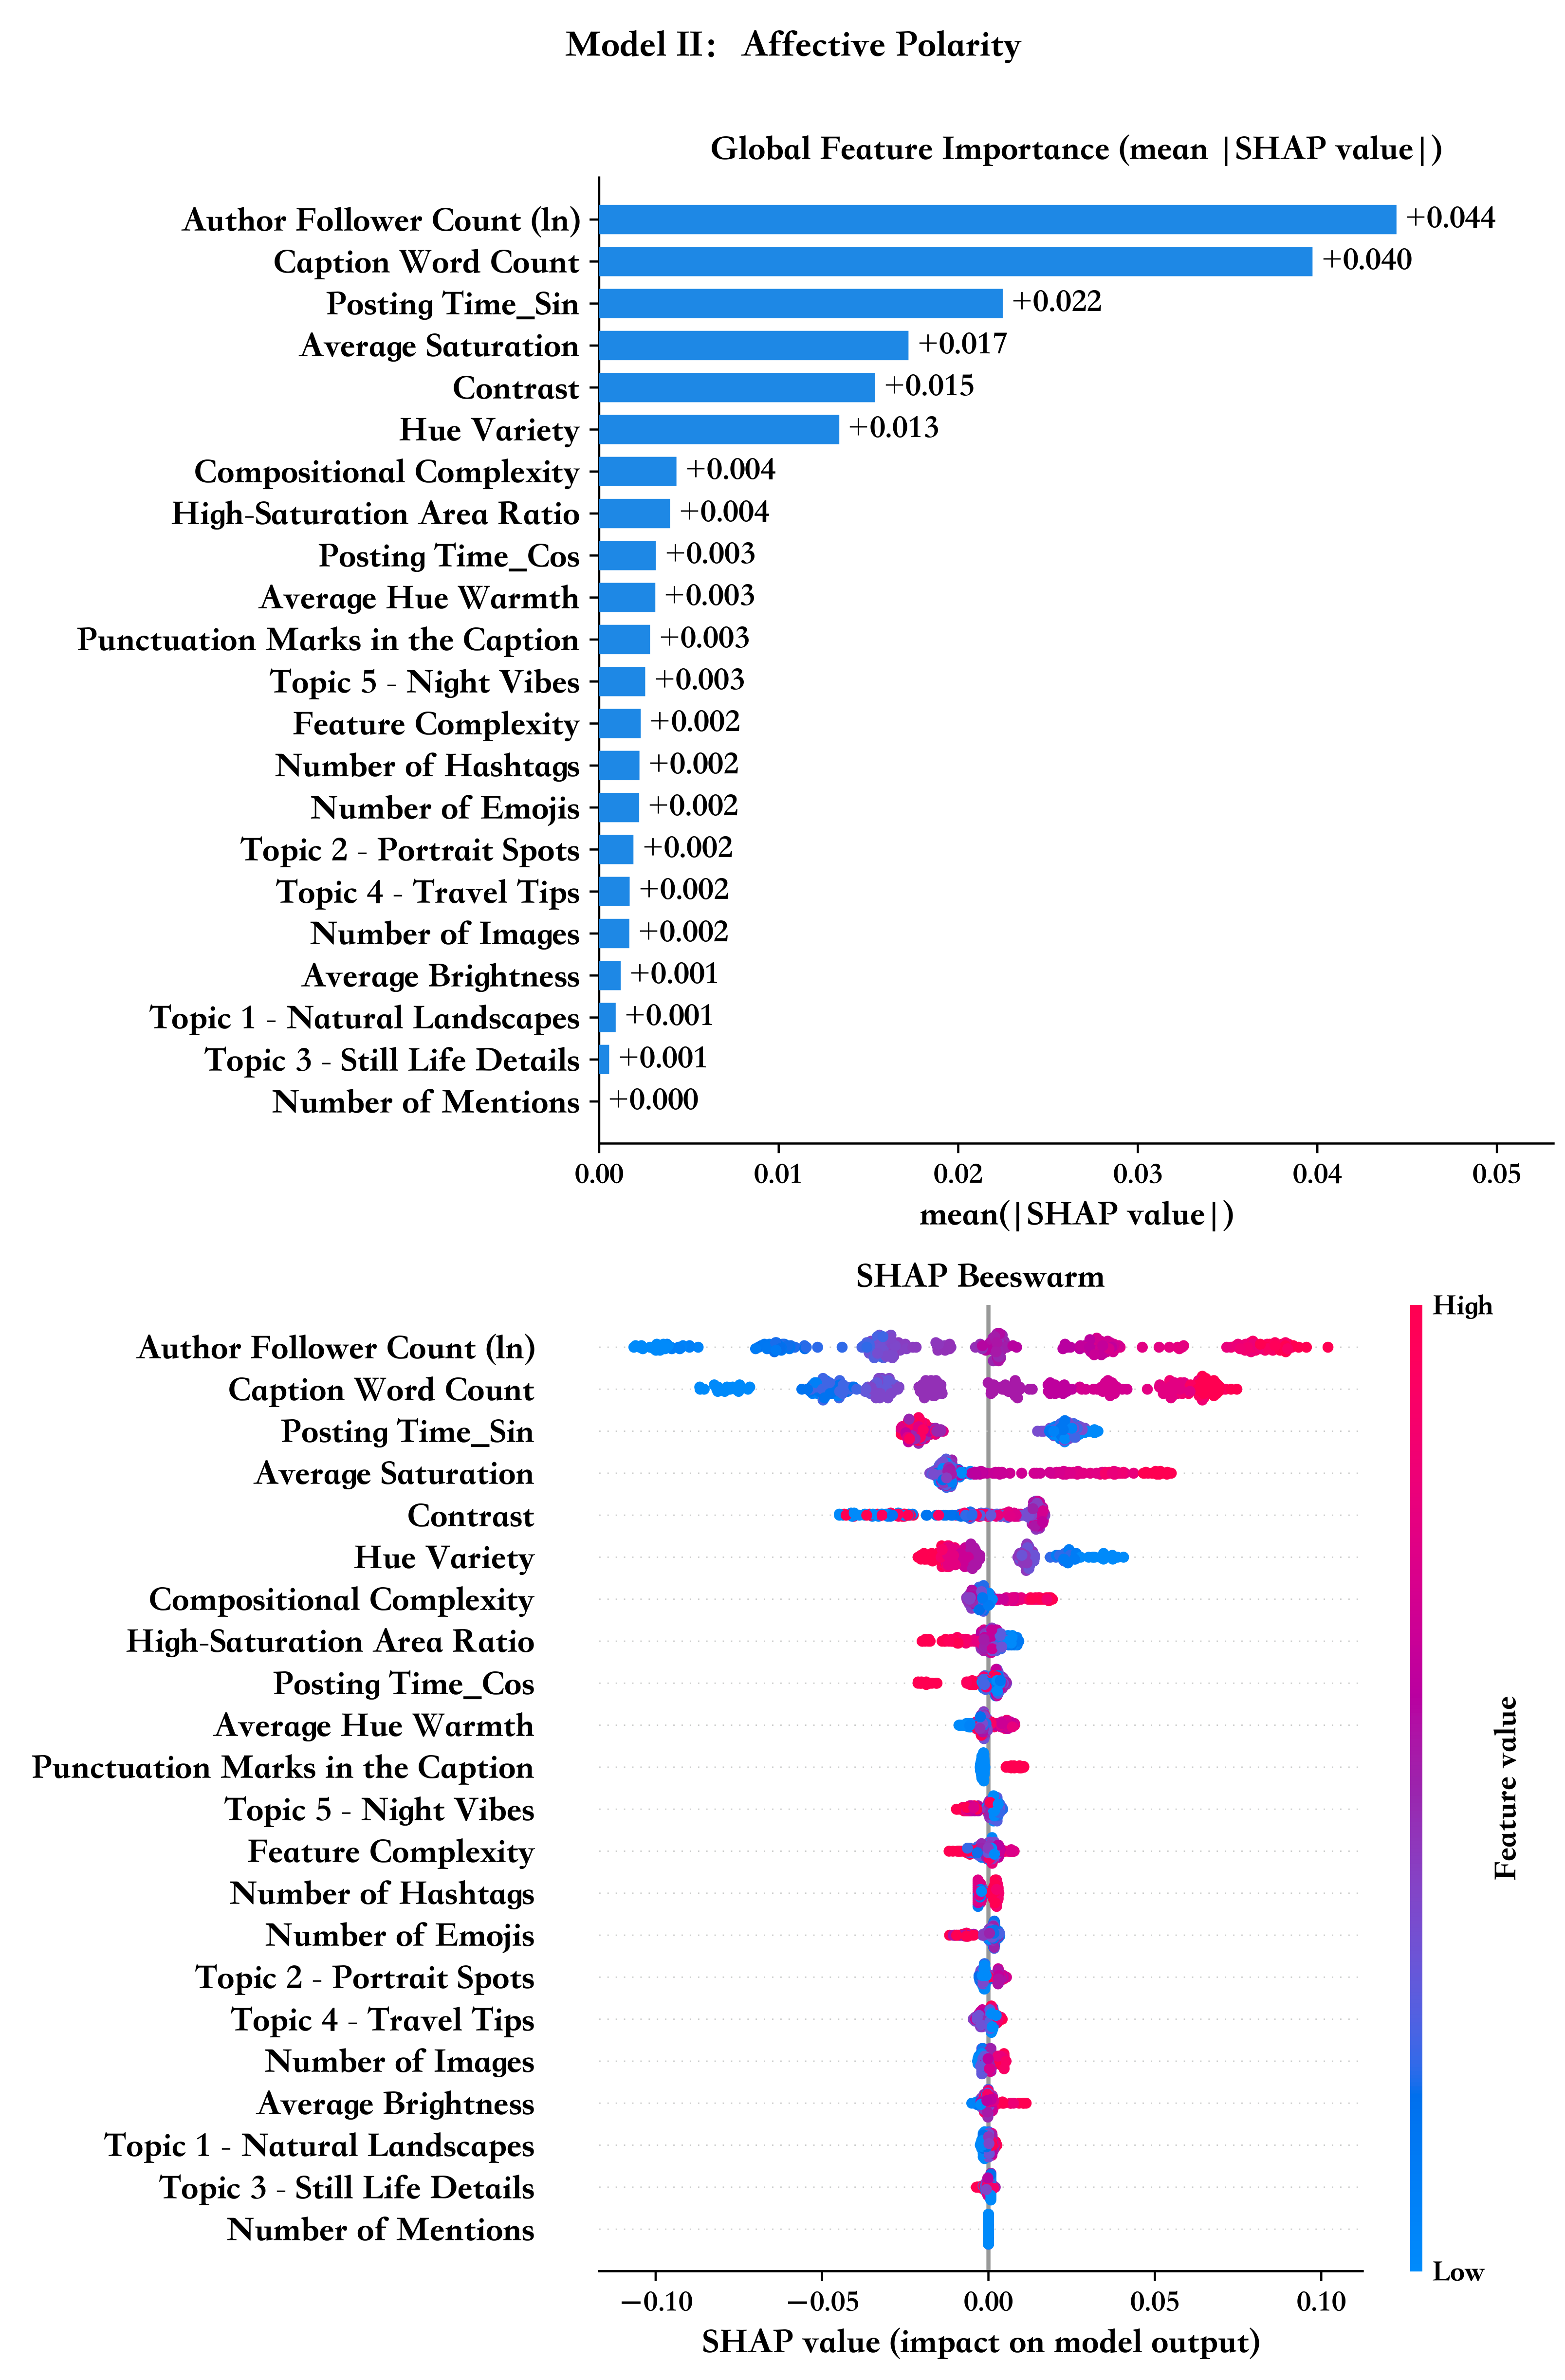
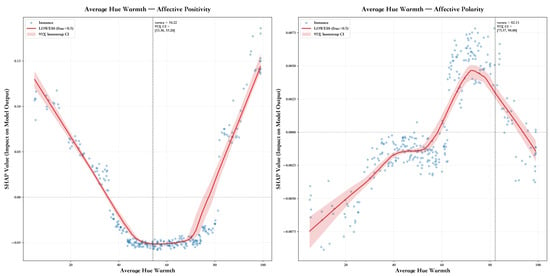
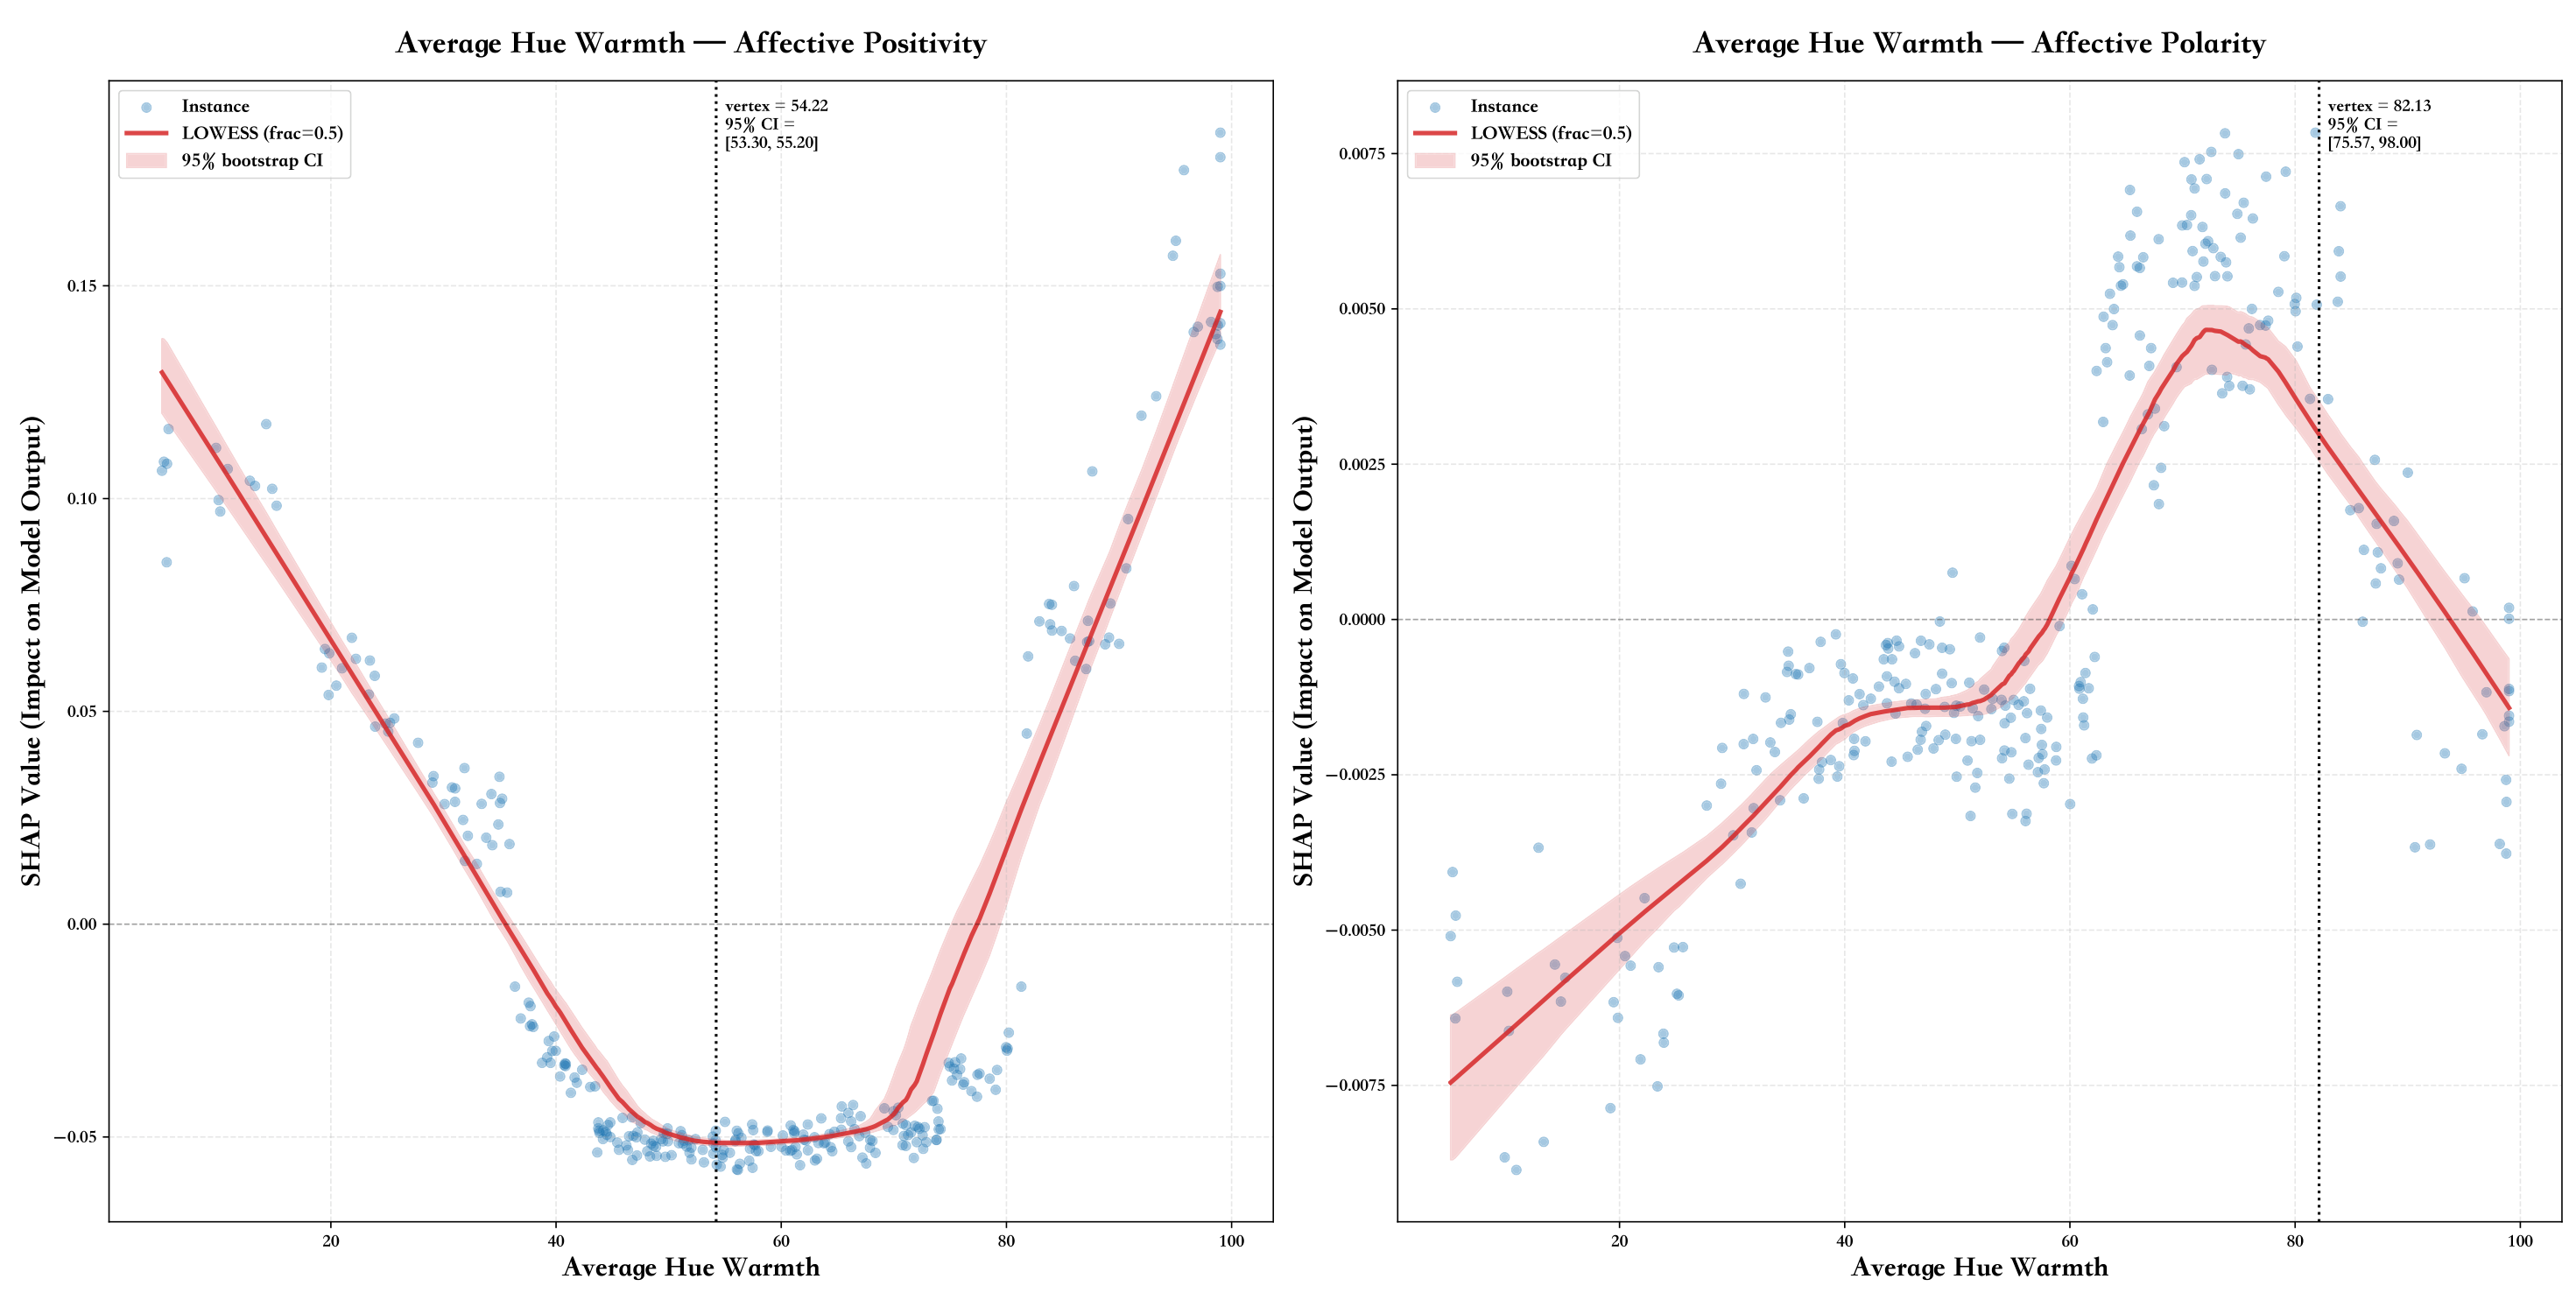
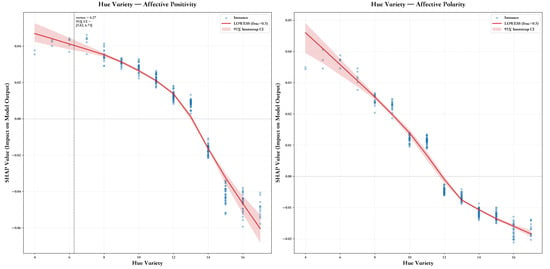
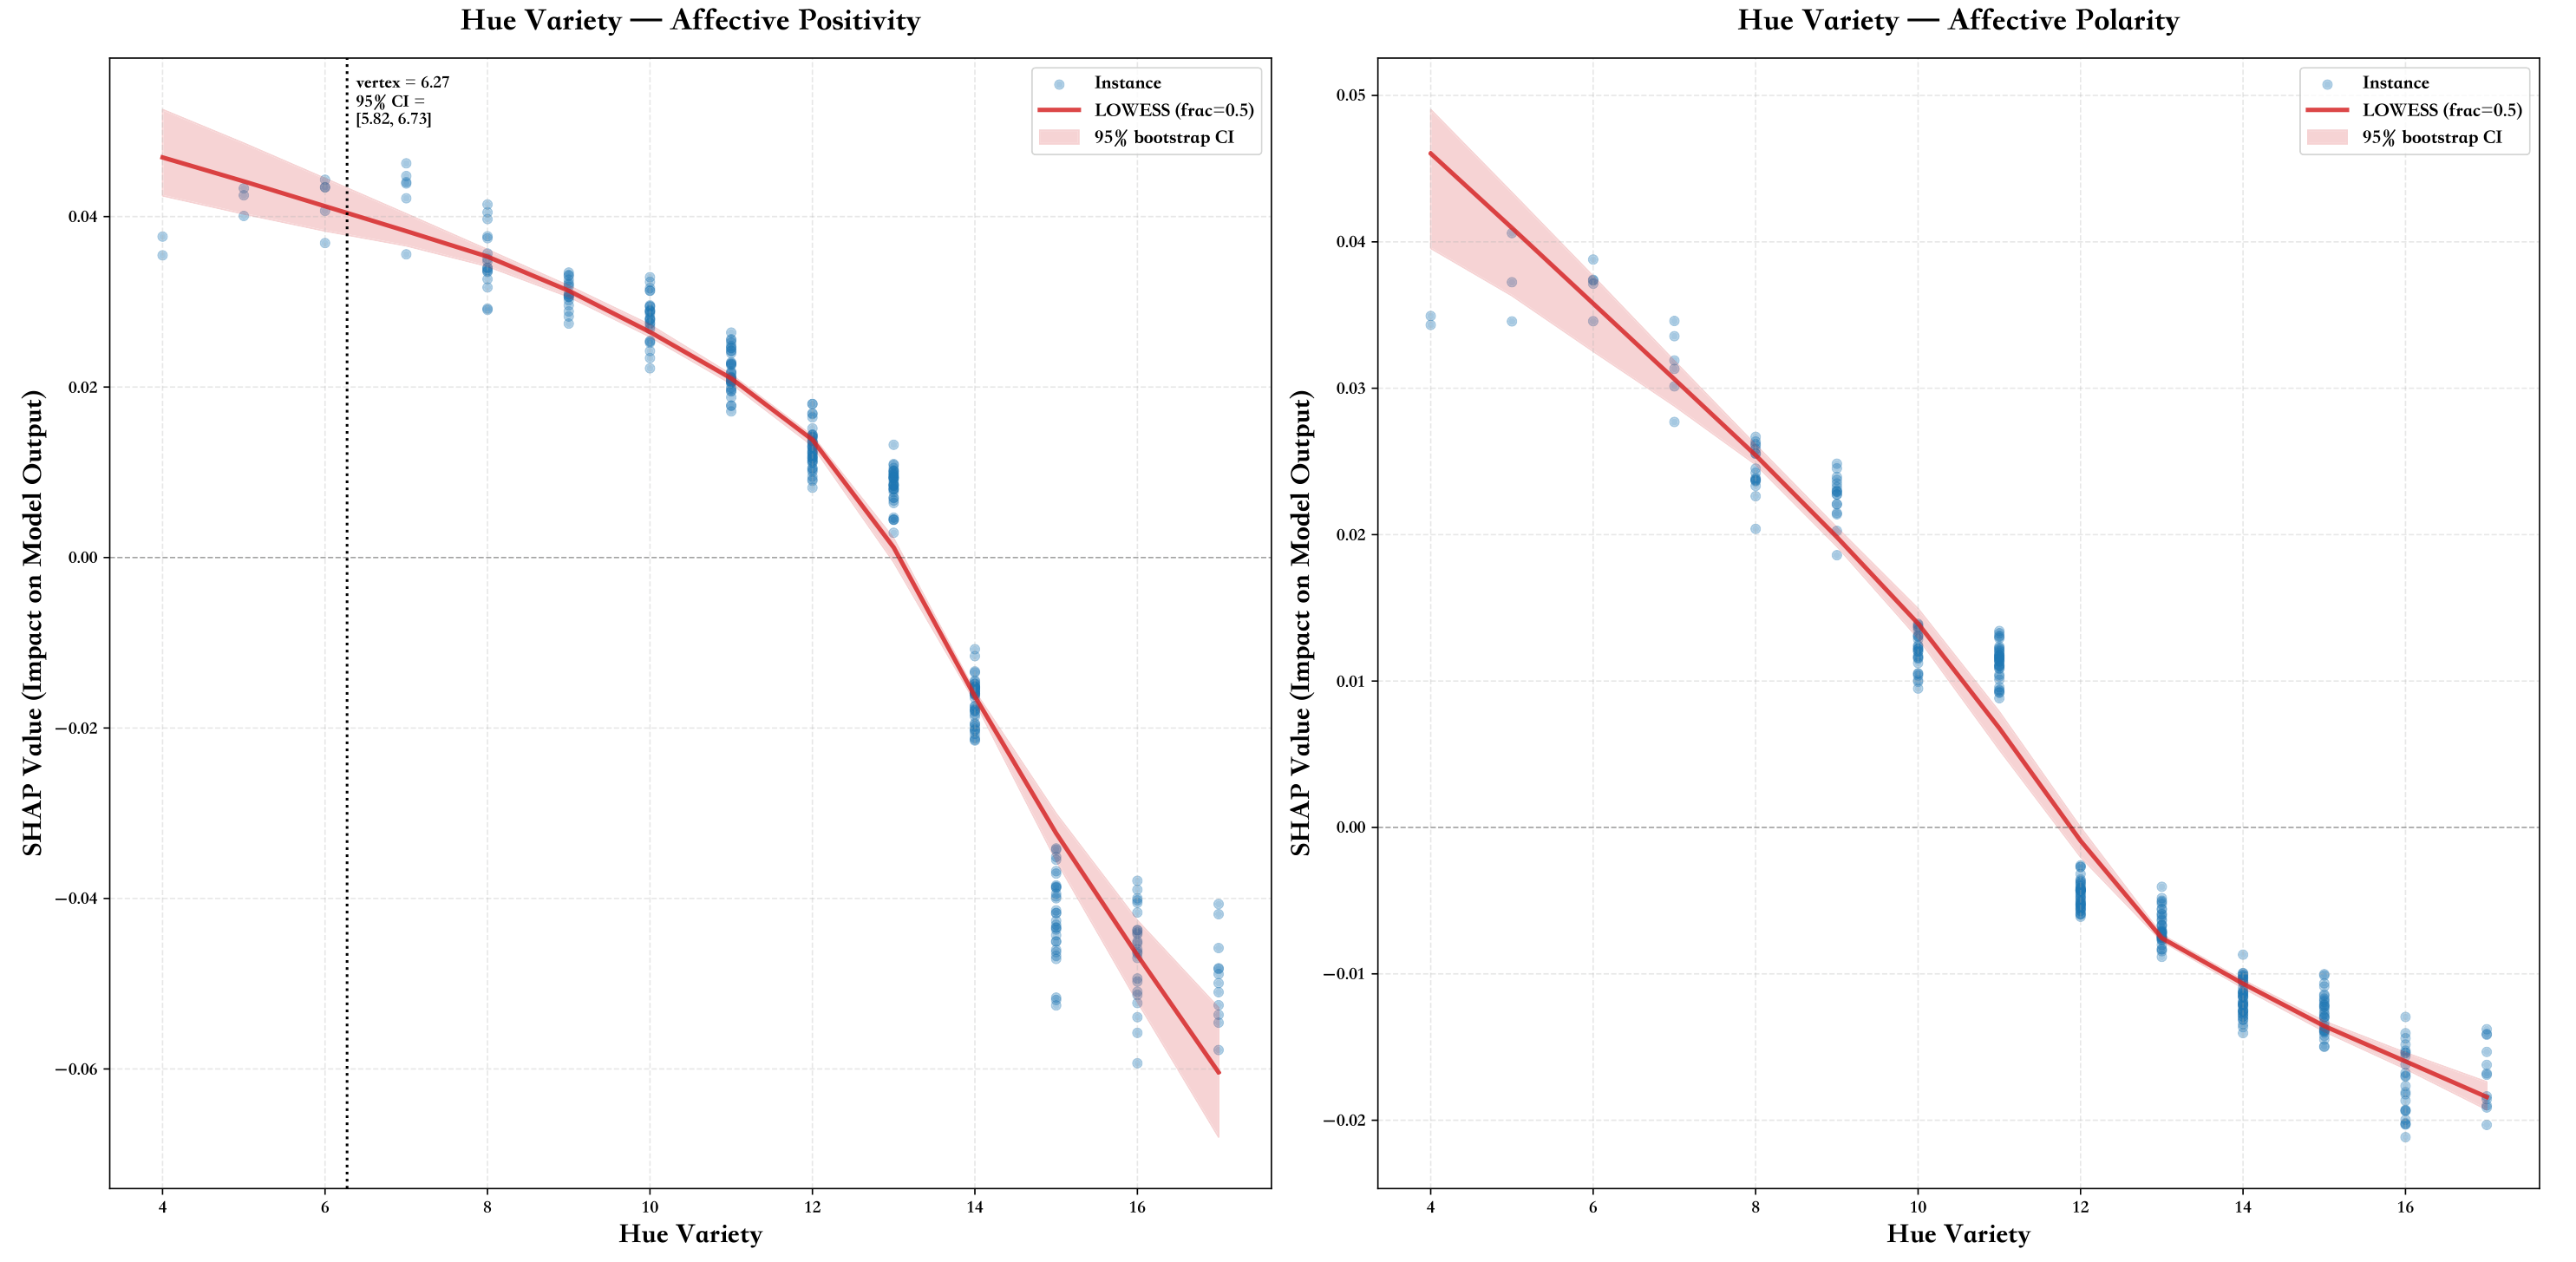
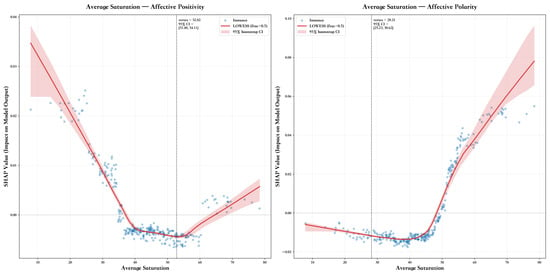
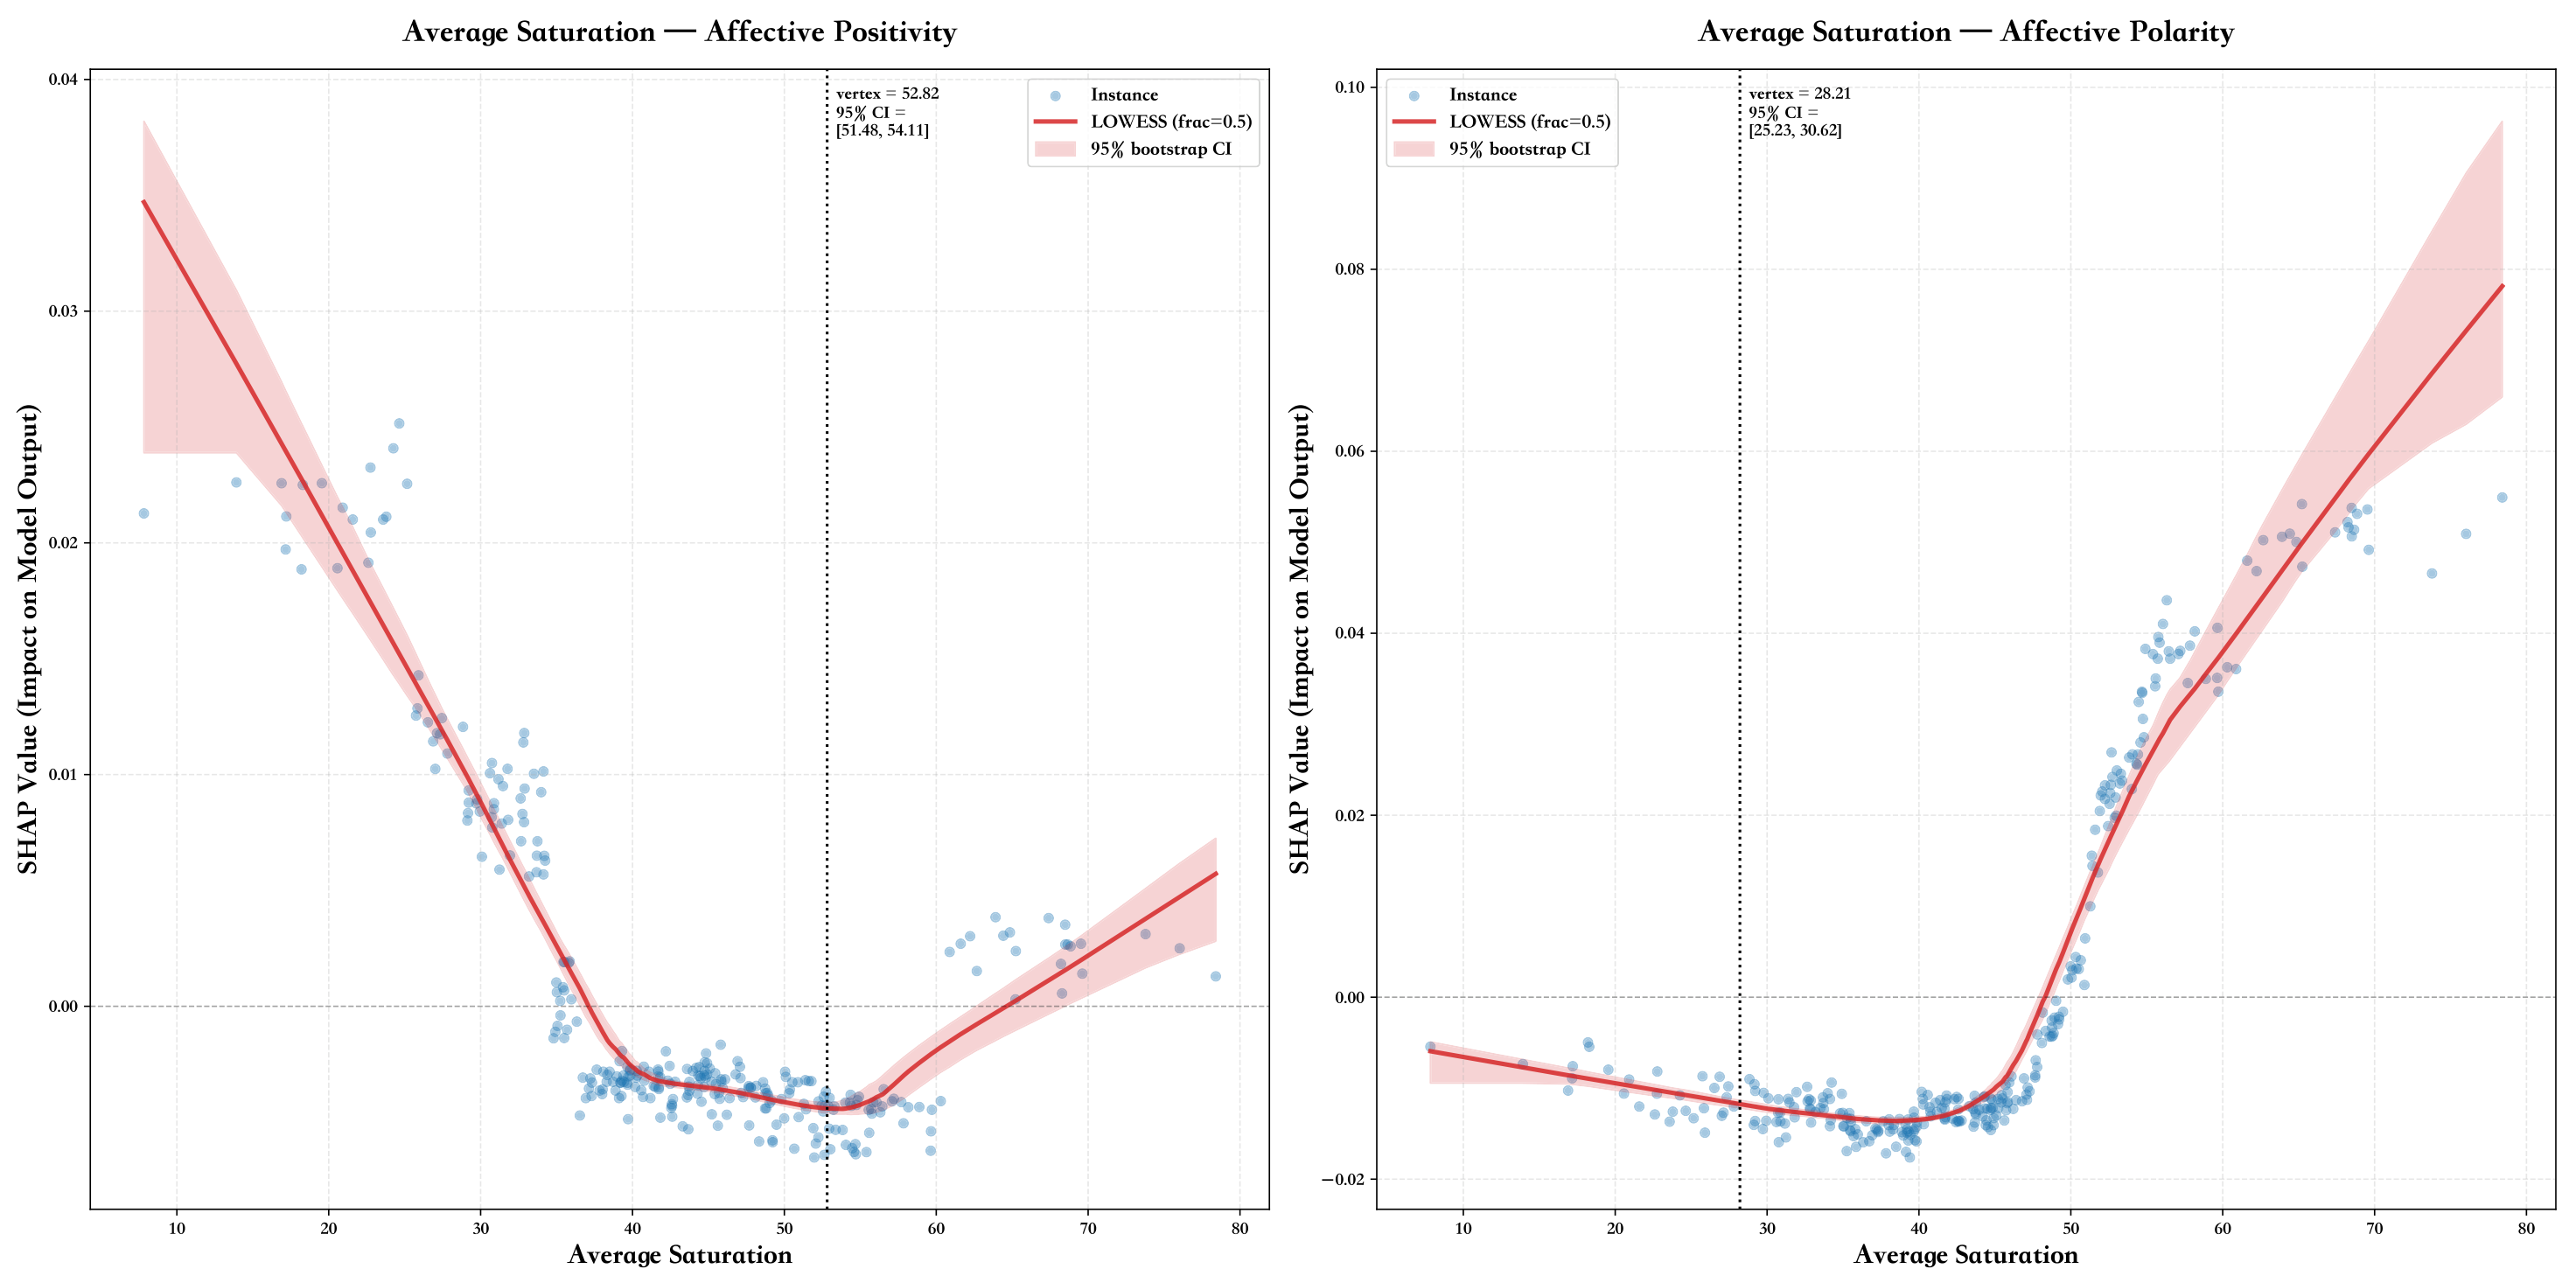
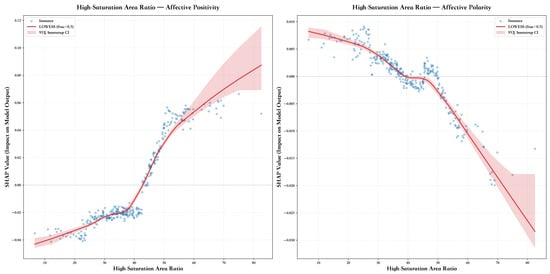
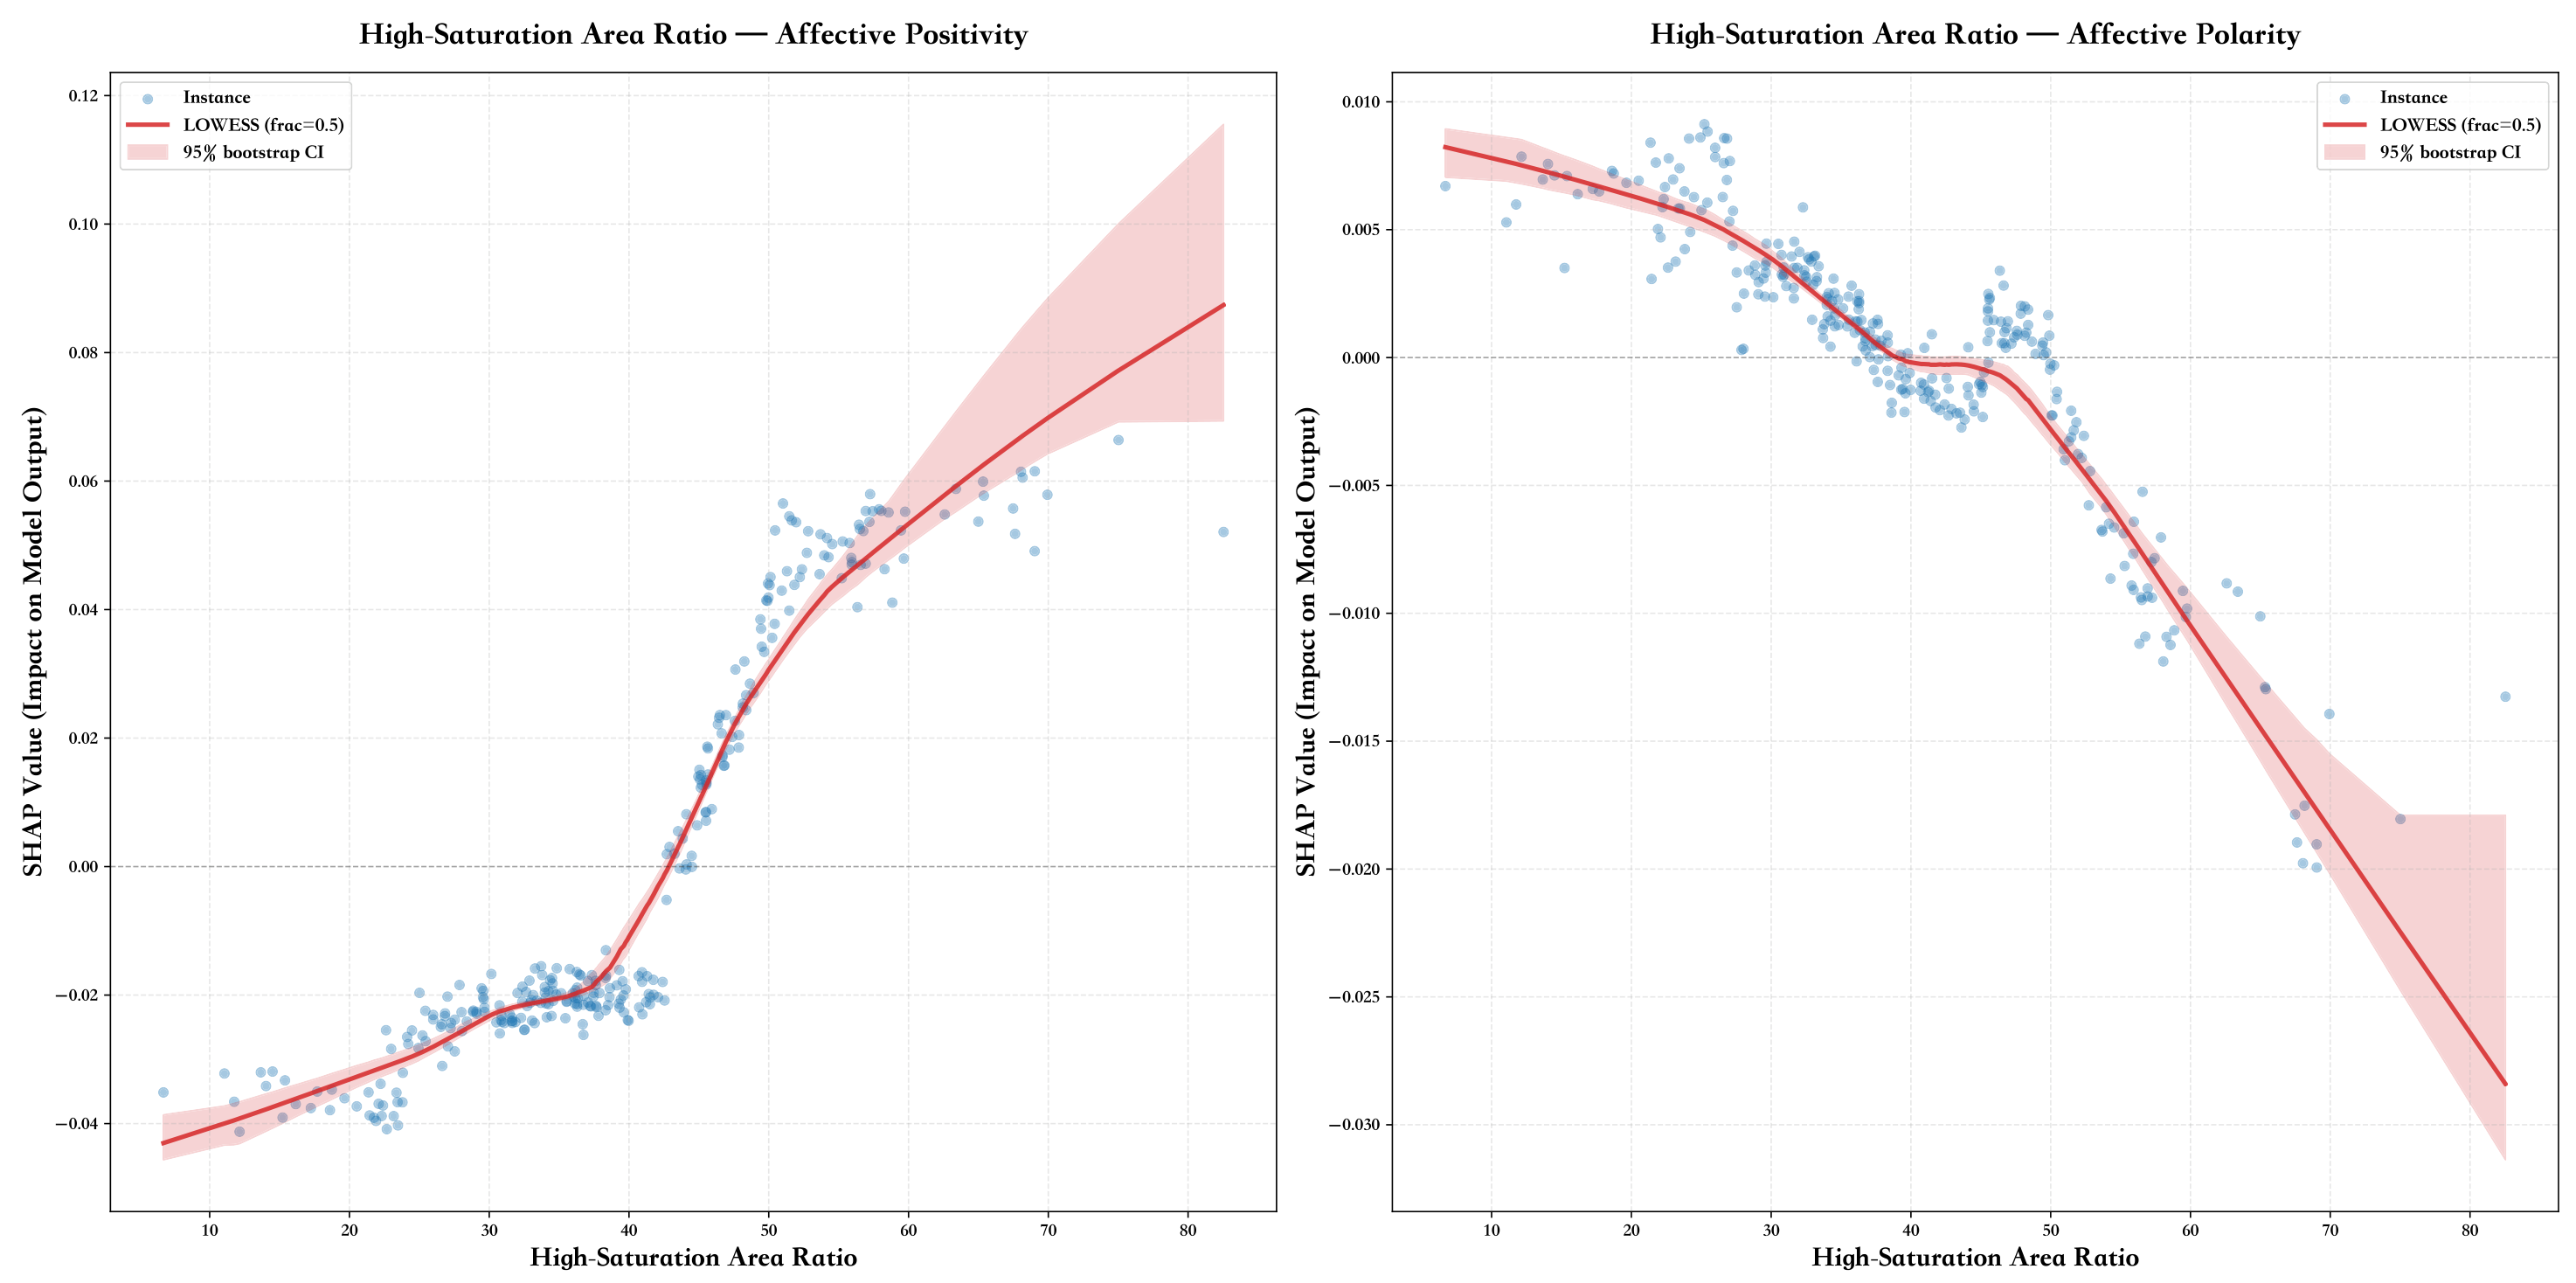
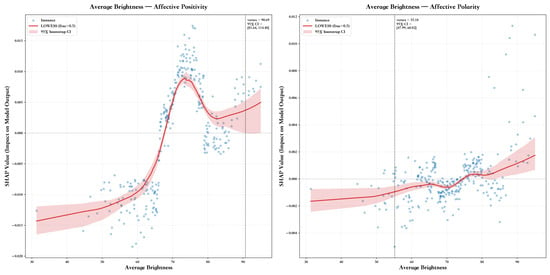
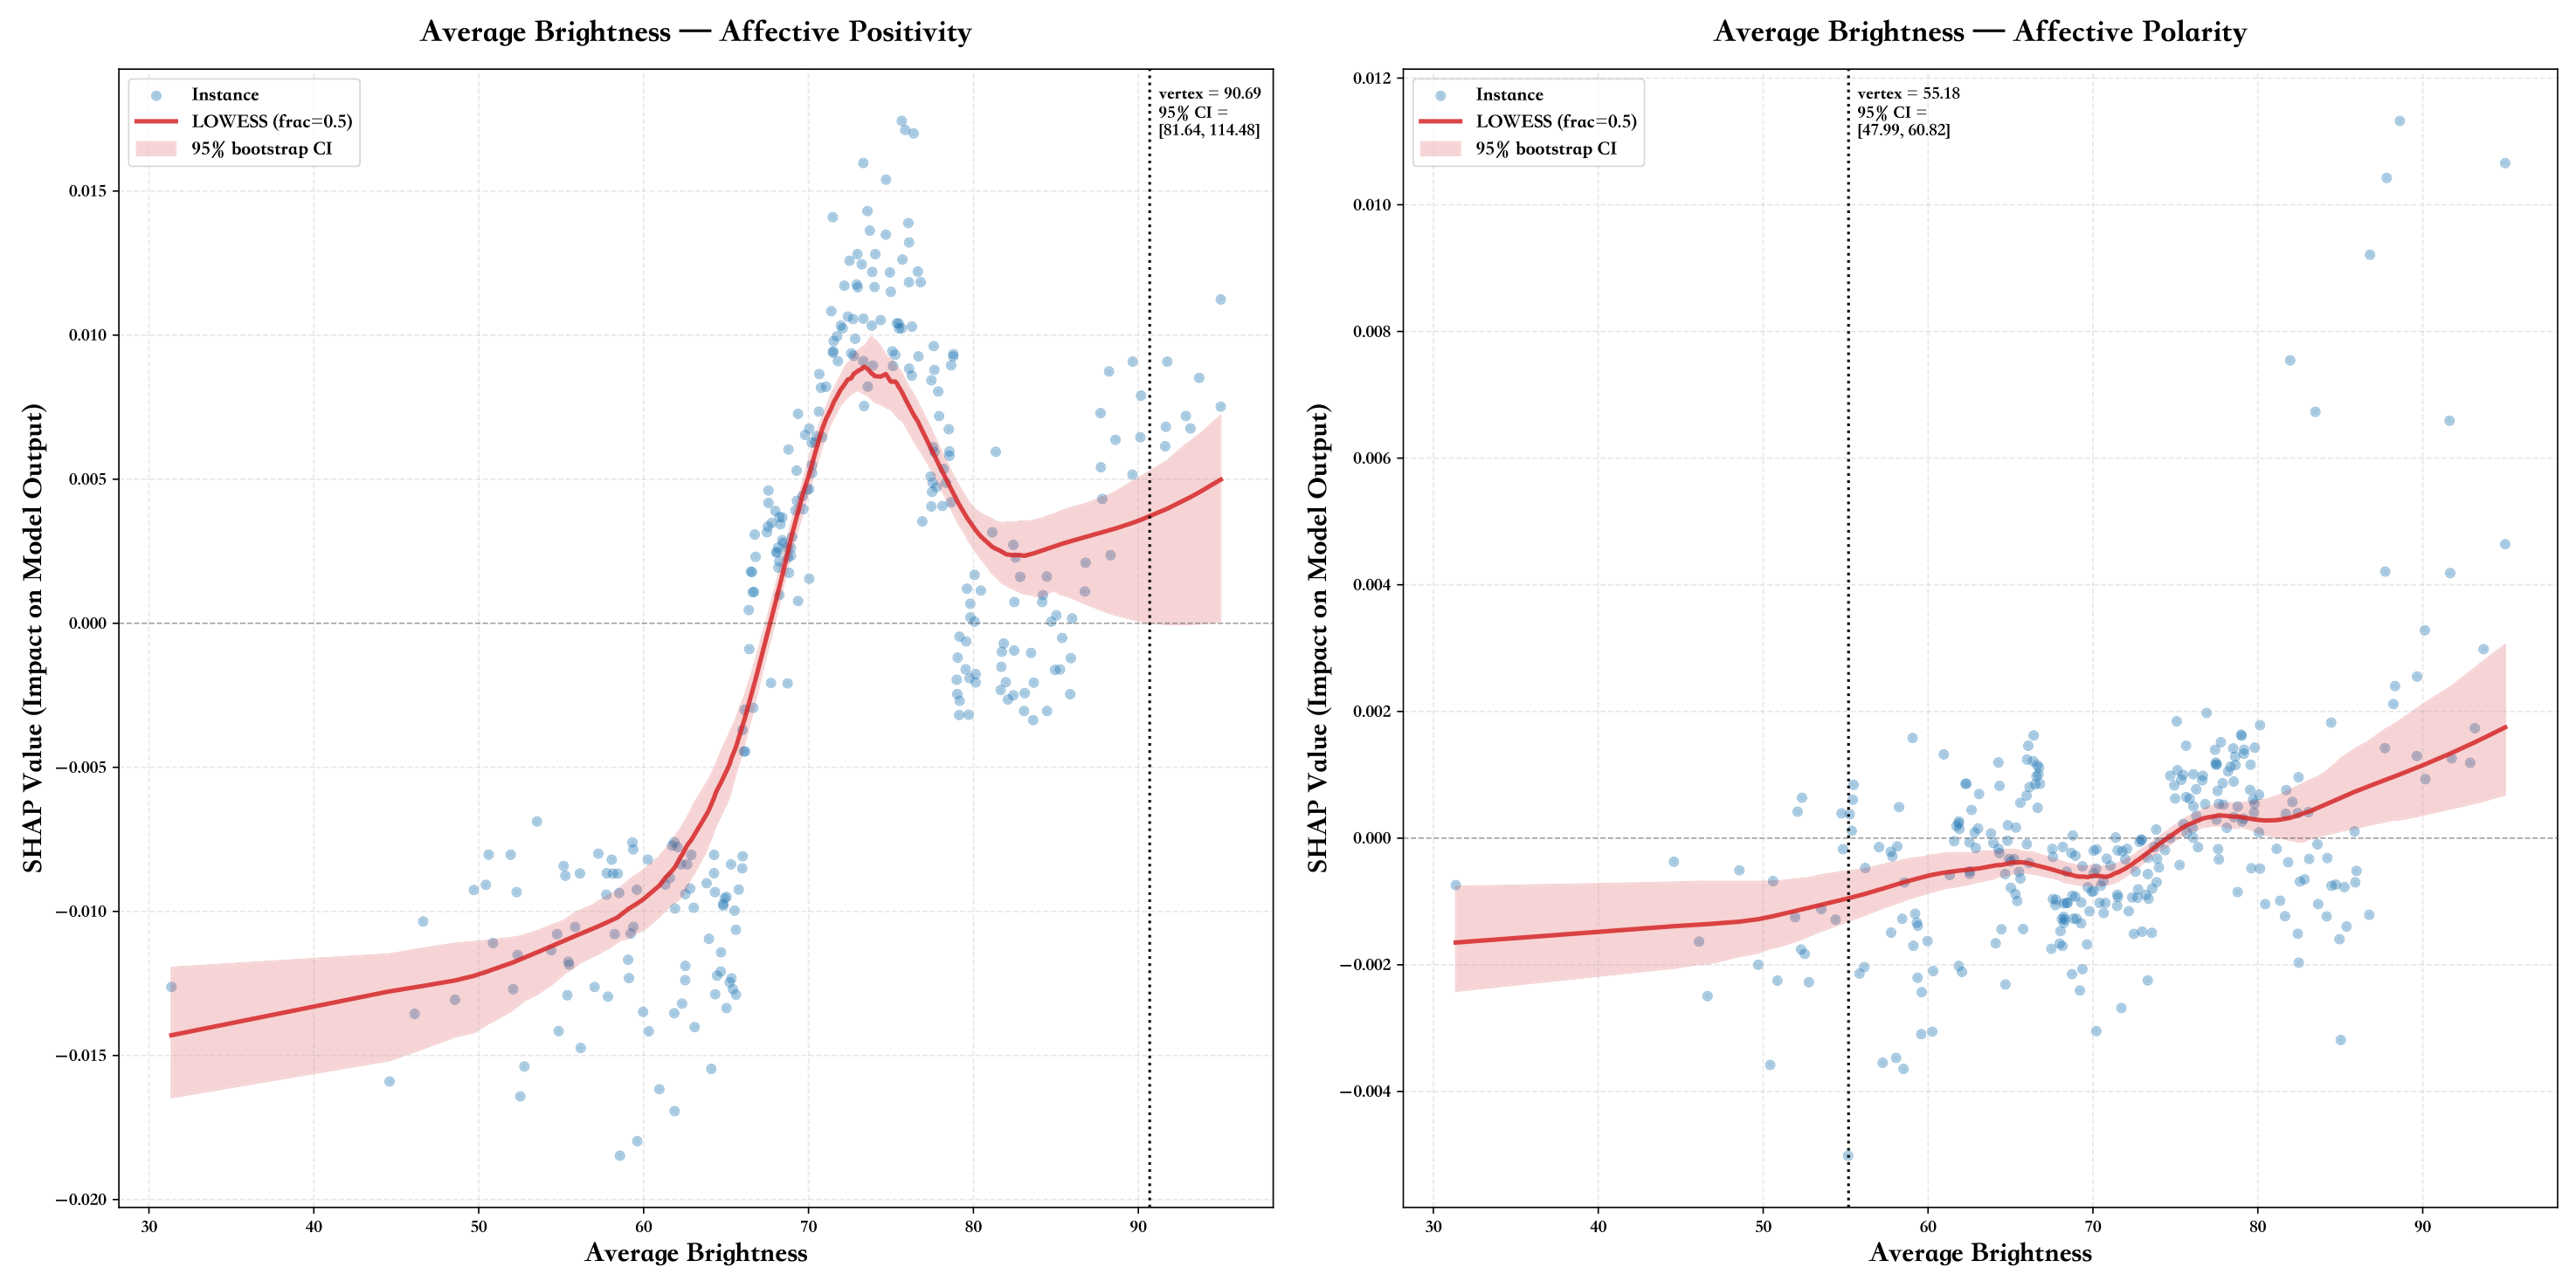
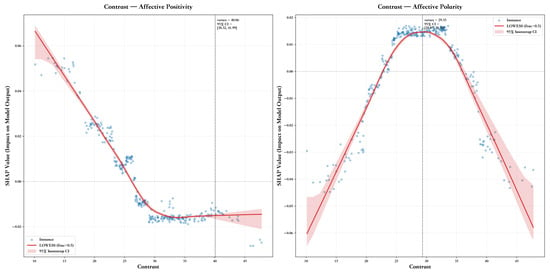
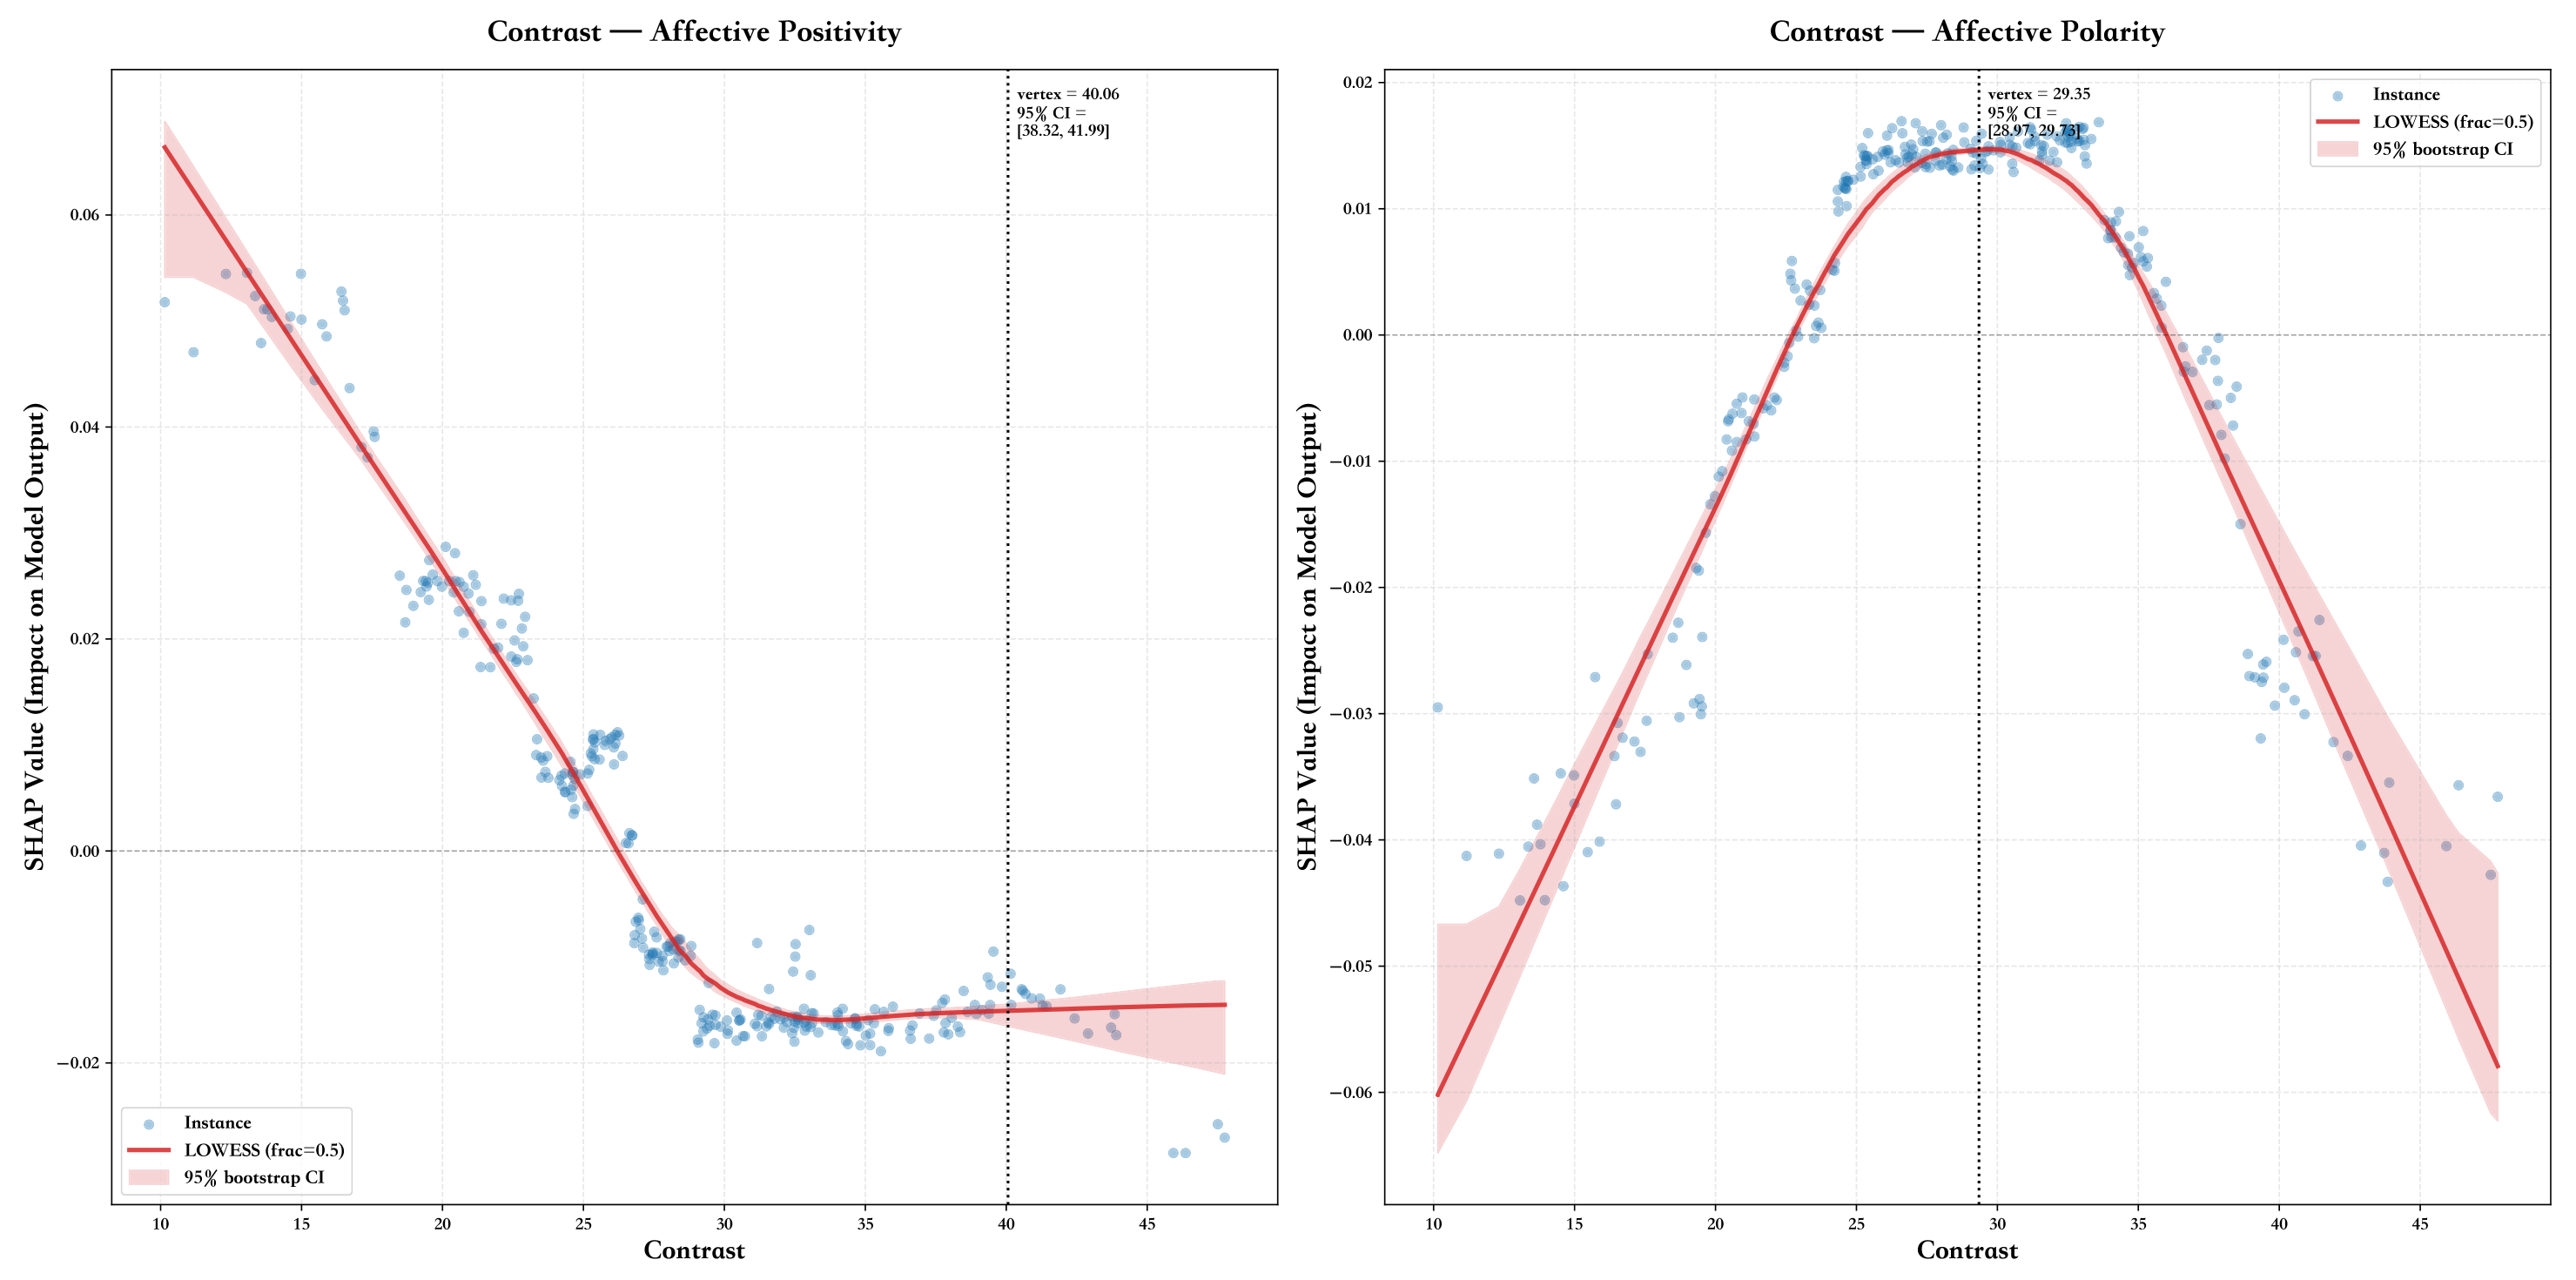

Disclaimer/Publisher’s Note: The statements, opinions and data contained in all publications are solely those of the individual author(s) and contributor(s) and not of MDPI and/or the editor(s). MDPI and/or the editor(s) disclaim responsibility for any injury to people or property resulting from any ideas, methods, instructions or products referred to in the content. |
© 2026 by the authors. Licensee MDPI, Basel, Switzerland. This article is an open access article distributed under the terms and conditions of the Creative Commons Attribution (CC BY) license.