


Abstract
Multi-country platforms can share interaction data across their stores. Past studies report average gains, not what transfers. This study separates product popularity from co-interaction patterns, using XMarket ratings from 68 Amazon country–category stores, full-catalog ranking, and tuned closed-form recommenders. Duplicated variant reviews, which inflate accuracy, are merged. Foreign co-interaction patterns agree with local ones beyond a degree-preserving null. They lose less cross-country agreement than popularity in 95% of store pairs (difference scale) and 90% (chance-corrected scale), but only partly for one popularity-adjusted measure. In retrospective splits, pooling foreign data into stores with complete local data gives item-based models a small gain (mean +0.017 normalized discounted cumulative gain, NDCG@10, over a median of 0.105). Validation-tuned weighting does not improve it. Under a calendar cutoff, the estimate, +0.006 [−0.008, +0.014], is inconclusive (weakly positive at earlier cutoffs). With scarce local pattern data, foreign data close a median of 0.55–0.71 of the accuracy gap retrospectively. Under the calendar cutoff, they close 0.60 [0.22, 0.80] to 0.79 [0.34, 1.14] (less with more local data). With only user histories missing, they close almost none. Launched products gain only retrospectively. Exploratory tests link geographic distance to one popularity measure, not to transfer gains.
1. Introduction
Global e-commerce platforms run separate stores in many countries, and these stores list many of the same products. A platform can therefore borrow user–product interaction data from one country’s store to help another. XMarket, a public Amazon dataset, records ratings and reviews in several such stores, which share product identifiers [1]. Cross-market studies report that borrowing data from other countries raises average accuracy [1,2,3,4,5]. These studies report the gain of a model trained on pooled markets, not which kind of knowledge in the borrowed data transfers. Borrowed data also have a cost: they can make the local model worse, an effect known as negative transfer [6,7,8], which cross-market work has started to address [3].
Interaction data carry two kinds of knowledge that may behave differently across borders (Figure 1). The first is which products receive many interactions in a market (product popularity), and the second is which products are rated or reviewed by the same users (co-interaction patterns). Demand and consumer responses differ between markets [9,10], which suggests that popularity may be local. Co-review associations, in contrast, may partly reflect how products are used together, although they do not show that products were bought together. This study addresses the following research questions (RQs):
Figure 1.
Illustrative example of cross-market transfer (not real data). Panels show (a) a data-rich store (Germany) and a data-poor store (Mexico) with the same products, (b) differing most-reviewed products, (c) largely shared co-interaction links, and (d) the cable that German co-interaction patterns, unlike German most-reviewed products, suggest for a Mexican phone-case reviewer.
- RQ1.
- What kind of knowledge in interaction data carries over from one country’s store to another: product popularity or co-interaction patterns?
- RQ2.
- Does adding foreign data help a store that already has complete local data, and which users gain?
- RQ3.
- When part of the local knowledge is missing (co-interaction patterns, user histories, or products new to the store), which gaps can foreign data fill?
- RQ4.
- Does cultural, language, or geographic closeness between two countries predict how well their data transfer?
For RQ1, this study compares how much popularity agreement and co-interaction agreement are lost across countries, relative to a local split-half benchmark and a degree-preserving null. For RQ2, it tests equally weighted direct pooling of foreign data into stores with complete local data on the full catalog, broken down by user history. It compares this pooling with validation-tuned weighting, greedy source selection, and a published market-aware model [2]. For RQ3, a scarcity test and a product-launch test show which missing local knowledge foreign data can replace. For RQ4, the study tests whether country closeness predicts transfer. In XMarket, popularity agrees poorly across countries, whereas co-interaction patterns agree beyond chance and lose less agreement than popularity in 95% of target–donor pairs on the difference scale. This comparison holds on several scales but not on every measure. In retrospective splits, foreign data give the item-based models a small, consistent gain in stores with complete local data (mean +0.017 in normalized discounted cumulative gain, NDCG@10). The calendar-cutoff estimate (+0.006 [−0.008, +0.014]) is inconclusive, and at two earlier cutoffs it is +0.010. Foreign data still close 0.60–0.79 of the gap left by scarce local patterns under this cutoff (0.55–0.71 retrospectively). Launched products gain only in retrospective simulations. Reviews duplicated across product variants—which, to the author’s knowledge, earlier XMarket evaluations have not reported—inflate local accuracy and launch gains several-fold if kept, so this study merges them. In exploratory tests, geographically distant countries agree less on one popularity measure, but no measure of country closeness predicts the transfer gain.
2. Related Work
2.1. Cross-Market and Cross-Domain Recommendation
Cross-market recommendation borrows interactions from different country stores to improve a target store. FOREC pre-trains a model on pooled markets, adapts it with meta-learning [11], and forks a model for each market, beating target-only training on average [1]. Bhargav et al. added a learned market embedding to neural collaborative filtering models trained on all markets jointly [2]. Hu et al. propose Bert4XMR, a Transformer with market embeddings that is pre-trained on all markets and fine-tuned on the target market [3]. Other work uses transferable attention [4] or tunes market prompts on a frozen backbone [5]. These studies report the average gain of the combined model, not which part of the borrowed data produces it.
Large general-purpose recommenders increasingly learn from several domains at once, through text-to-text generation [12], language models [13,14], shared item embeddings [15], or generative retrieval at scale [16,17]. These models do not separate popularity from co-interaction knowledge and are not tested on transfer between country stores.
Evaluation choices also shape the gains that studies report. The XMarket protocol ranks each held-out interaction against 99 sampled products [1]. Sampled metrics are inconsistent with full-catalog metrics and can reverse the order of two models [18,19,20]. Reported cross-market gains may therefore overstate what a platform would see when ranking its whole catalog. Moreover, many reported improvements in recommendation shrink once baselines are tuned carefully. Reproducibility studies find that well-tuned simple baselines match or beat many newer models [21,22,23].
Borrowed data can also make the target model worse. Surveys of transfer learning and cross-domain recommendation document this negative transfer [6,7,8,24,25]. Recommender studies limit negative transfer in two main ways: DisenCDR separates preferences shared across domains from domain-specific ones [26]. Song et al. estimate the transferability of each source before borrowing from it [27], and Hu et al. target negative transfer between markets [3].
2.2. Localization and International Marketing
Whether to share interaction data across country stores mirrors the marketing debate on standardizing versus adapting an offer across countries. In 1921 standardization decisions by 207 e-commerce firms in 68 host countries, institutional distance shaped how far firms standardized their online offers [28]. Reviews of cross-border e-commerce list the cultural, institutional, and logistic factors that separate markets [29]. Demand also differs between markets. Quan and Williams estimate large demand differences across geographic markets and show that ignoring these differences overstates the gains from online product variety [9]. The same online cue can also work differently for consumers in different countries. Ratings affect American and Chinese buyers through different routes [10], and cultural values moderate live-streaming impulse buying in China and the United States [30].
Cultural distance is the standard proxy for how similar two countries are, and it is usually measured with Hofstede’s dimensions and the Kogut–Singh index [31,32,33]. Shared language and geographic distance still affect cross-border online trade, although distance matters less online than offline [34,35]. Country-level differences in taste also matter for recommendation. For example, country-specific departures from global listening habits improve music recommendation [36].
2.3. Economics of Data
More data improve prediction, but with diminishing returns. At a large online retailer, forecast accuracy for a product improves with a longer sales history at a falling rate, whereas adding more products helps little [37]. The value of extra data also depends on what these data add to the data a firm already holds. In web search, result quality rises with query-level data, and user-level data complement query-level data [38]. Economic models of data sharing, however, do not distinguish how much a record is worth outside the market where it was collected. Jones and Tonetti model data as nonrival and argue that sharing raises welfare [39], but they do not compare a foreign record with a local one.
Many governments also restrict where data may be stored or sent. A review by the Organisation for Economic Co-operation and Development (OECD) documents the spread of data-localization measures and separates privacy-driven transfer conditions from full localization [40]. Such restrictions have measurable costs. Across countries, stricter data policies lower the productivity of downstream firms in data-reliant sectors [41].
Across these bodies of literature, no study separates popularity from co-interaction knowledge in cross-market transfer, tests when the transferable part helps, or checks whether country distance predicts it. The cross-market studies above do not relate transfer to country distance [1,2,3,4,5]. The marketing and data-economics studies, in turn, do not test the transfer of interaction data for recommendation.
3. Dataset
This study uses XMarket, a public collection of Amazon ratings and reviews from several country stores [1] (Official XMarket webpage: https://xmrec.github.io/ (accessed on 28 October 2026)). The inputs are the per-market, per-category files ratings_<market>_<category>.txt.gz (reviewer ID, Amazon Standard Identification Number (ASIN), star rating, and review date). Every rating from 1 to 5 stars is treated as a positive implicit interaction. Interactions are therefore proxies for consumption or preference, not verified purchases, and review dates are not purchase dates. With 4–5-star ratings only, results are similar (patterns lose less agreement in 93% of 338 pairs and the median ItemKNN pooling gain is +0.016, Supplementary Section S24). Product relations are inferred only from products rated by the same user in the same store, without product metadata. Such co-review associations do not show that products were bought together. After preprocessing, the data cover seven countries (markets), namely CA (Canada), DE (Germany), FR (France), IN (India), JP (Japan), MX (Mexico), and the UK (United Kingdom), and 14 product categories. Not every country lists every category, so the data form 68 market–category contexts (Figure 2). A context is one country–category store, written as country plus category (e.g., UK Books), and it has its own users , products , and interactions . Contexts differ widely in size: under the random split, the median context has 2143 training interactions (range 622 to 950,521) and 374 products.
Figure 2.
XMarket interactions per market and category. Panels show (a) raw interactions and (b) interactions after duplicate removal, variant merging, and adaptive k-core (hatched: dropped, blank: no raw file), with totals per market (contexts kept) on the right.
Amazon shows one review under all variant ASINs (color, size, and edition) of a product. A store can therefore contain the same review under several ASINs, as documented for earlier Amazon data [42] (https://cseweb.ucsd.edu/~jmcauley/datasets.html#amazon_reviews (accessed on 30 October 2026)). Review texts and product metadata confirm this duplication in XMarket. Some products have reviewer sets that nearly coincide (at least three shared reviewers and a Jaccard index of at least 0.8). These products share identical review texts for 99.5% of their common reviewers (Supplementary Table S12). The share is 12.5% for two different products that a single reviewer rated on the same day with the same rating. Earlier XMarket protocols keep these copies [1,2], which can make a test interaction a copy of a training interaction. In the launch test, such copies affect a median of 48% of a store’s launched-item test interactions (Supplementary Table S12). This study merges the copies, uniting the links found in any store of a category. Each family of linked products becomes one product with one identifier in every market (3036 families of 7293 ASINs, with 8.2% of the deduplicated interactions removed). The links are inferred from the complete observation period of each store, for every split. Section 5.5 reports the results with the copies kept, as in the previous version of this study.
Repeated records of a user and a product, including records merged within a variant family, are collapsed into one interaction that keeps the earliest review date. Preprocessing then applies an adaptive core filter to each store’s full interaction history, before any split. The filter keeps only users and products with at least k interactions. It starts at and lowers k one step at a time, down to , until the store keeps at least 800 interactions and 40 products. This procedure gives 18 stores at , 6 at , 14 at , and 30 at . Section 5.5 checks whether results depend on k. The 30 market–category files that stay below either threshold at are dropped, including all Digital Music files. Of 12.38 M raw interactions in 98 files, 2.08 M interactions in 68 contexts remain (Figure 2). The median context keeps 8.6% of its deduplicated interactions (range 0.7–38.5%, Supplementary Table S2), so the benchmark is smaller and more selected than a production catalog. In what follows, “full catalog” means the complete catalog of this filtered benchmark. Likewise, “complete local data” means all local training interactions of a store in the benchmark, not a store that has reached data maturity. Section 5.5 examines a lighter filter.
Each user’s interactions are split 80/10/10 into training, validation, and test sets, once at random and once by review date (the per-user chronological split). A user with n interactions receives training and validation interactions (round half to even). These counts are capped, reducing the validation share first, so that every user with more than one interaction keeps at least one test interaction. Users with 2–7 interactions thus receive no validation interaction, and date ties keep the file order. Both per-user splits are retrospective because neither later local interactions nor foreign interactions are filtered by date and the core filter sees each store’s full history. This study therefore adds a calendar split, which is prospective for model fitting but not for product identities. Per category, all markets share two cutoffs, and , at the 80th and 90th percentiles of review dates (e.g., Books: 15 April 2018 and 23 May 2019, with all dates in Supplementary Table S10). Training data, local and foreign, are the interactions before . Validation covers , and testing covers the interactions from onward. The core filter (on products only, as users are not filtered) and the catalog (apart from launched products, Section 4.4) use only pre-cutoff data. Product identities do not, because the variant families are inferred from the complete observation period. Post-cutoff interactions thus help identify them, so the calendar analysis uses retrospectively constructed product identities. Models are fitted once on the training data, and a user is scored from all of their training interactions (65 contexts with a donor). Validation interactions are used for tuning only, and test users are scored with the training-only fit. Users and products first observed after cannot be scored. In the median context, they account for 95% and 1.5% of the post-cutoff local interactions, so only 3% of these interactions enter validation or testing. The calendar split therefore also evaluates a different population. In the median context, it has 91 test users (1391 in the random split) with a median of one training interaction (two). These users are scored a median of 852 days after their last training interaction (Supplementary Table S10). Its lower local-only accuracy reflects population differences and chronology. With the copies kept, this accuracy also reflects duplicated reviews, which share a date and so inflate only the per-user splits. After merging, 0.2% of a median store’s test interactions keep a candidate copy (Table S12). Test users are capped at a fixed random sample of 20,000 per context, and the same sample is used in every experimental arm.
Products are matched across countries only by their XMarket product identifier, the Amazon ASIN [1], with each merged variant family under one identifier. On the raw files, no ASIN occurs in more than one category. Apart from the merge, the only identifier transformation is a market prefix on user keys, so users are keyed per store and only product-level knowledge can cross borders. Raw reviewer IDs are not entirely disjoint, however, because 26,465 of them occur in several markets. Removing them changes the results little (mean ItemKNN pooling gain +0.0197 instead of +0.0167). Product overlap is also partial: in the median target–donor pair, 37% of local training interactions involve products that the foreign store also lists. The foreign data for a store are all same-category interactions from the other countries that list it, up to six, giving 340 target–donor pairs. CDs and Vinyl is kept only in CA, and Grocery and Industrial and Scientific are kept only in the UK (Figure 2b). Hence, 65 of the 68 contexts have a foreign donor.
4. Methodology
4.1. Measuring What Travels (RQ1)
RQ1 asks how far a foreign store agrees with a local store on popularity and on co-interaction patterns (Supplementary Figure S1). Each local store is paired with each foreign store in the same category, and the pair is compared only on the products both stores list. All 340 target–donor pairs are used and share at least 10 products (median 100, minimum 20). The largest pair, CA/UK Books, shares 5571. To give local and foreign data the same reference, the local users are split at random into halves A and B, with half A as the reference. Local agreement L compares half of B with A, and foreign agreement F compares all foreign data with A. Results are averaged over three random splits. In 20% of pairs, the foreign data are smaller than half of B. The comparison is therefore repeated after reducing both half of B and the foreign data to the smaller of the two volumes (two-sided matching, 10 draws of whole users).
Let be the number of users who interacted with product i and the number who interacted with both . Popularity agreement is the Spearman correlation of and the overlap of the top-10 lists. Pattern agreement is the cosine between the vectors of two samples, with each unordered product pair counted once and the diagonal excluded. Pattern agreement is also measured as the overlap of each product’s five nearest neighbors by (5-NN overlap), averaged over products with at least five neighbors in both samples. A degree-preserving null model randomizes the foreign data by curveball trades [43,44]. In each round, all users are paired at random, and each pair exchanges the products that only one of them holds. This exchange keeps every product’s and user’s interaction count (checked in every draw) but breaks product associations. The null uses 100 trades per user and 10 draws. In the largest donor matrices, agreement with the original matrix keeps falling up to about 50 trades per user. Hence, five trades per user did not completely randomize these matrices (Supplementary Section S5). The two Books matrices were too large to check. The null’s agreement with half of A is the chance level c of a pattern measure. Because the null keeps every product’s count, its popularity agreement equals F. For popularity, c is therefore the agreement of an unrelated ranking, namely 0 for rank correlation and for top-10 overlap with n shared products. A pattern measure is undefined for a sample without co-interactions (zero-norm vector) or without products that have five neighbors. Such draws are skipped, and a pair without a valid draw is left out for that measure. Popularity-adjusted variants use (positive pointwise mutual information, PPMI) and (residual), with N users. Instead of ratios, which are sensitive to small denominators, the main outcomes are , the excess , and the paired difference within each pair. Ratios at a minimum local agreement of 0.05–0.20 serve as a check. Medians over pairs are reported with cluster-bootstrap intervals (Section 4.6).
The accuracy experiments for RQ2–RQ4 use four recommenders and a random ranker as a chance control. The most-popular recommender (MostPop) ranks products by interaction count and so uses only popularity. The item-based models, namely item-based k-nearest neighbors (ItemKNN) [45,46] and Embarrassingly Shallow Autoencoders (EASE) [47], score products from item-to-item similarity or regression. These models therefore use which products co-occur in user histories. User-based k-nearest neighbors (UserKNN) [48] is the user-based model. Item similarities also depend on popularity, so the models do not cleanly isolate the two kinds of knowledge. A null pool tests this dependence (Section 4.2). All of the models are closed form, which removes optimization noise but not the variability from splits, subsamples, launch sets, and test users (Section 4.6). Each model picks its hyperparameters from a small grid (Table A1) by NDCG@10 on the validation set, and tuning is done separately in every arm. Four contexts with a donor have no validation users on the per-user splits (DE and UK Automotive, FR Sports and Outdoors, and IN Office Products). These contexts use the first grid setting in every arm, and at every other setting, their ItemKNN and EASE pooling gains stay positive.
4.2. Borrowing Foreign Data with Complete Local Data (RQ2)
For RQ2, all training interactions of the same-category foreign stores join the local ones, and models are tested on local users only. The transfer effect for a target context is
where is the NDCG@10 on the local test set of . A negative value marks negative transfer. Local and foreign interactions are merged into one training matrix with equal weight. RQ2 thus tests equally weighted direct pooling into MostPop, ItemKNN, EASE, and UserKNN. Two baselines adapt foreign data on validation. The first scales foreign users’ rows by , tuned with the hyperparameters ( is local only, and Supplementary Section S5 gives the effective weights). The second selects donor countries greedily while validation NDCG@10 improves. A null pool replaces each donor’s data by curveball randomizations (as in RQ1, with 10 draws, each tuned like the other arms, and results averaged). By a rule fixed in advance, co-interaction patterns are supported if the 95% interval of the mean of the pool minus the null pool lies above zero. This comparison shows whether the co-interaction structure contributes beyond the marginal counts that the null pool preserves. Whether pooling beats a well-tuned local model is the separate comparison of Equation (1). As a published cross-market method, this study runs Market-Aware Generalized Matrix Factorization (MA-GMF) [2] against generalized matrix factorization (GMF) controls with identical architecture and tuning. These controls include a local GMF given as many gradient updates as pooled GMF, and the comparison covers 51 contexts (Books and Movies and TV are excluded by a pre-set compute rule). Methods that transfer through pre-training, meta-learning, or prompt tuning, such as FOREC and DCMPT [1,5], are not run here (Section 6.4).
Gains are also broken down by how many local training interactions a user has. Per-user differences in NDCG@10 are grouped into 1, 2, 3–4, and 5+ interactions. Buckets with fewer than 20 users are dropped, and differences are averaged within each context. The short-history advantage, gain(1–2) − gain(3+) per context, is called supported only if the cluster-bootstrap interval of its mean excludes zero. This pre-specified rule replaces the Wilcoxon test, which treated contexts as independent.
4.3. Scarcity Experiment (RQ3)
Local training data perform two tasks: they teach the model co-interaction patterns, and they describe each user at scoring time. Item-based models learn product-to-product scores from all training interactions and then score each user from that user’s own past interactions [45,47]. The scarcity experiment separates the two tasks. Each context receives three random draws of 10% of its local training interactions (5, 25, and 50%: Supplementary Table S5b). In the pattern-scarce arm, only this subsample is used to learn patterns, whereas user histories stay complete. The history-scarce arm does the reverse. The both-scarce arm uses the same subsample for both tasks, so all three arms remove the same interactions. Foreign data are added to model fitting only, and hyperparameters are retuned in every arm. A user with an empty scoring history receives the same arbitrary catalog order with and without foreign data, so a zero gain for such users is built into the design. This study therefore stratifies users by 0, 1, and 2+ retained interactions and tests a popularity fallback for empty histories. In the main fallback comparison, both arms use local popularity, so only the model changes. Pooled and validation-weighted popularity (local plus times foreign popularity, with tuned as in RQ2) are examined separately. For UserKNN, neighbors are the users of the fitting matrix (local plus foreign), and similarity uses the target’s scoring history only. The share of the gap closed,
shows how much of the lost accuracy foreign data recover. Contexts with a gap of at most 0.01 are dropped from G, whereas absolute gains cover all completed contexts. The history-scarce arm serves as a control. Users are keyed per store (Section 3), so foreign data can change the learned patterns but not a local user’s history. The runs cover ItemKNN, EASE, and UserKNN on the random split, ItemKNN on the chronological split, and ItemKNN and EASE on the calendar split.
4.4. Product-Launch Experiment (RQ3)
XMarket has no listing or availability dates, so in every split, the launch test is a conditional simulation with an assumed launch catalog, not an evaluation of genuinely new products. To simulate product launches, this study selects a random 30% of the products that have local training interactions and also appear in the training data of another market. The selection does not consult the test set. All local training and validation interactions of these products are hidden, and three launch sets are drawn per context. In the calendar split, launched products are products outside the pre-cutoff local catalog that have foreign pre-cutoff interactions (one set per context). The store is assumed to know which products it launches. Launched products are identified by a local interaction after the first cutoff and added to the candidate catalog, so this test uses post-cutoff information on candidates. Of these products, 89% had raw local interactions before the cutoff that the core filter removed (median 7 among them). These products are reported separately from products without any raw local interaction before the cutoff. Users whose test interactions include a launched product are evaluated, and the change in NDCG@10 over all test users is also reported. Launched products have no local interactions left, so the local-only score is near zero by design. The random ranker on the same launch set is therefore the reference point, on a common context set for all models. Zero-feedback tuning uses validation interactions with non-launched products only, whereas validation-feedback tuning also uses the hidden ones. Launched-item NDCG@10 is undefined without test users of launched products, so the main analysis evaluates a launch set only if at least 10 such users exist. This rule skips none of the 195 random-split launch sets but 21 of the 65 calendar contexts with a donor. Calendar inclusion therefore depends on later test counts (Supplementary Tables S6 and S7). Therefore, thresholds of 1, 5, and 20 users are also reported. At a threshold of 1, the overall change covers every launch set with an evaluable user (Supplementary Table S11).
4.5. Country Closeness (RQ4)
Country closeness is measured in three ways. Cultural distance is the Kogut–Singh index over the six Hofstede dimensions, using the official 2015 scores [31,32], with variances over the seven study countries. Language closeness records whether two countries share an official language, and geographic distance is the great-circle distance between their capitals (inputs in Supplementary Table S4). Each measure is related to two kinds of outcome, namely the agreement difference of RQ1 for each of its four measures and a single-donor transfer gain. For the gain, ItemKNN is trained on local data plus the same-category data of one foreign country at a time, using the random split with hyperparameters retuned on validation data. The gain enters the analysis for the 340 pairs of RQ1. Outcomes are centered within each target context, so a target with one donor contributes zero. The centered outcomes are then averaged to the 42 ordered country pairs, each over its own incomplete set of categories. Centering removes differences between target stores, so the test asks whether a target’s closer donors do better than its other donors, not whether close countries transfer well in absolute terms. Because country pairs cover different categories, a pair’s average also contains category-specific transfer. The averaged outcomes are then tested against all 5040 relabelings of the seven countries in the distance matrix with an exact permutation test, so outcomes keep their categories. The 15 resulting tests use a Bonferroni threshold of . Because D needs no denominator, no pair is excluded for a small local agreement. Ratios are kept as a sensitivity check (pairs with non-positive local agreement are excluded, Supplementary Section S24). Seven countries form only 21 unordered pairs, so these tests have low power. A non-significant result therefore means no evidence of a link, not evidence of no link or of no practical value.
4.6. Evaluation and Statistics
Each model ranks the whole product catalog of the local store, not a sampled candidate set, which avoids the bias of sampled metrics (Section 2.1). Products the user interacted with in training or validation are removed from the ranking, and ties go to the lower product index. NDCG@10 is the main metric, and Recall@10 is the second, with :
where is the product ranked at position j for user u, and is the set of the user’s test interactions. NDCG@10 caps the ideal ranking at products, whereas Recall@10 divides by all of the user’s test interactions. Both metrics are computed per user and averaged over users. In the launch experiment, holds only the user’s test interactions with launched products.
Intervals are 95% two-way cluster-bootstrap intervals with 2000 draws that resample countries and categories independently. Each draw reweights the completed results, and no model is refitted. Repeated splits, subsamples, and launch sets are averaged first. A pairwise result for target country m, donor country d, and category c (RQ1 agreement and single-donor gains) has weight , where w counts how often a country or category was drawn. One country draw serves both roles, so both transfer directions share it. A pooled-donor result (RQ2 and RQ3) is a context-level result for target m and category c with weight . Because the targets of one category share donor data, Supplementary Table S16 also gives a one-way category bootstrap. This bootstrap ignores country clustering, so its intervals, which are similar or narrower, are a sensitivity check and not a confirmation of the two-way intervals. With seven country clusters, coverage may fall below 95%, so intervals that barely exclude zero are weak evidence. Leave-one-out checks remove one country’s or category’s reported outcomes from the summary. They do not remove that country’s or category’s donor data or refit models, and an unchanged sign does not establish coverage. Across three split seeds, the mean ItemKNN pooling gain has a standard deviation (SD) of 0.0022 (Supplementary Table S5b). Supplementary Table S5c reports how much each context’s result varies across scarcity subsamples, launch sets, and split seeds. The test-user cap binds only in UK Books and UK Movies and TV, so elsewhere every test user is evaluated. A change above 0.01 NDCG@10 (1.0–3.5 extra top-10 hits per 100 users with one test item) is called practically relevant, separately from interval-based inference. Better/worse (B/W) counts at 0.005 and 0.02 give the same conclusions. Not every context enters every experiment. Supplementary Table S3 gives the inclusion, exclusion reasons, and completed repetitions per experiment, and Supplementary Table S6 gives them per context. Country-level tests use the exact permutation test of Section 4.5.
For null results, the minimum detectable effect (MDE), the bootstrap standard error, describes approximate power (80% power at a two-sided 5% level, Supplementary Table S18). It is not a confidence bound, so statements about effect sizes rest on the confidence intervals. Under the calendar cutoff, the approximate MDE is 0.016 for the mean ItemKNN pooling gain and 0.009 for the launched-item lift. With seven country clusters, these approximations are optimistic. The 10 headline comparisons of the Abstract and Conclusions also receive Bonferroni-adjusted 99.5% intervals. Every comparison that excludes zero at 95% also does so at 99.5% (Supplementary Table S18a). The study was not pre-registered, and Supplementary Table S22 lists which version added each analysis and the rules fixed before results were seen.
5. Results
5.1. RQ1: Popularity Agrees Less Across Countries than Co-Interaction Patterns
Foreign popularity is a weak guide to local popularity, judged by the agreement between two halves of the local users (Table 1). For rank correlation, foreign agreement is 0.21, compared with 0.64 locally (, 95% confidence interval (CI) [−0.51, −0.29]), also at matched volume. Foreign co-interaction patterns carry over much better. Cosine is 0.25 both locally and across countries ( [−0.02, +0.04], and −0.03 [−0.06, −0.02] at matched volume), and it exceeds the degree-preserving null by +0.13 [+0.08, +0.23]. Pattern agreement is low in absolute terms because half of a small store’s users share few co-interactions. The benchmark for foreign data is therefore the local split-half agreement, not an absolute level.
Table 1.
Cross-market agreement on shared products, compared with local split-half agreement.
Two claims should be kept apart. The first claim is that relational information transfers. On all four pattern measures, foreign agreement exceeds the degree-preserving null (cosine +0.13, 5-NN +0.10, PPMI +0.10, and residual +0.14, with all intervals above zero). The second claim, that relational information transfers better than popularity, compares measures with different ranges and sensitivities, so this study tests the claim on several scales. On the difference scale, patterns lose less agreement than popularity in 95% [88, 100] of the 339 pairs for cosine compared with rank correlation (91% at matched volume, Figure 3). Patterns also lose less in all 286 pairs for neighbor compared with top-10 overlap, and the median paired difference is positive in 61 of 65 target contexts. The chance-corrected scale measures the share of the local above-chance agreement that the foreign data reproduce. Because c is a degree-preserving null for patterns but an unrelated ranking for popularity, this scale is not completely comparable across measures either. On this scale, patterns retain more in 90% [79, 99] of the 267 pairs with (median difference +0.58 [+0.38, +0.86]). This scale needs a denominator, but for thresholds from 0 to 0.30, which exclude 34 to 302 pairs, the share stays between 86% and 91%. Every interval of the median also lies above zero (Supplementary Table S9). For neighbor compared with top-10 overlap, the share is 88–96%, with all intervals above zero as well. On the ratio scale , the shares are 96–97% and 98% (Supplementary Table S9). The popularity-adjusted PPMI agrees (94%), whereas the residual measure agrees only partly (81% [67, 92], and chance-corrected 63% [46, 77], with a median of +0.09 [−0.01, +0.20], Section 6.1). The advantage of patterns over popularity thus holds on every scale compared in this study for three of four pattern measures, but it is not scale-free. This advantage does not depend on sparsity. For cosine compared with rank correlation, patterns lose less agreement in 81–100% of pairs within every quartile of local density and every band of shared products. The medians lie between +0.15 and +0.50, with all intervals above zero (Supplementary Table S8). Nor is the advantage limited to mainstream shared products. It holds among the locally more popular half (99% of pairs), and among products listed in at least five (99%) or at most three markets (85%, Supplementary Table S17). In the less popular half, local popularity does not agree between the two local halves either, so that stratum is uninformative. Top-10 overlap is a coarse measure on small catalogs (chance is 0.10 in the median pair but up to 0.50), so rank correlation has more weight. If recommenders behave like these measures, borrowing patterns should help them and borrowing popularity should not, as RQ2 and RQ3 test.
Figure 3.
Cross-country agreement of popularity and co-interaction patterns. Panels show (a) and per measure (median, 95% CI) and (b) local compared with foreign agreement for 340 target–donor pairs, with the line marking .
5.2. RQ2: With Complete Local Data, Pooling Gives the Item-Based Models Small Gains
Adding foreign data with equal weight hurts the popularity recommender (Table 2). MostPop loses more than 0.01 NDCG@10 in 52 of 65 contexts on the random split and in 44 of 65 on the chronological split, and it gains in none. Its mean change is −0.035 [−0.055, −0.020], whereas the pattern-based models gain a little. The median gain is +0.013 for both ItemKNN and EASE, whose median local-only scores are 0.105 and 0.128 (the random ranker scores 0.010). Their mean gains are +0.017 [+0.008, +0.028] and +0.017 [+0.008, +0.029], about 16% and 13% of the median local score. These figures are ratios of two summary statistics (mean gain divided by median local score), not mean or median within-store percentage improvements. The chronological split gives similar means: −0.030 for MostPop, +0.016 for ItemKNN, +0.014 for EASE, and +0.002 for UserKNN (Supplementary Figure S4).
Table 2.
Adding all same-category foreign data with complete local data (NDCG@10).
Most stores gain or stay level with the pattern-based models. ItemKNN improves by more than 0.01 in 36 contexts and worsens in 3, and EASE does so in 40 and 1. UserKNN shows no reliable gain (mean +0.009 [−0.001, +0.022], with 25 contexts better and 11 worse). Weighting and greedy selection avoid most losses (MostPop still loses in 12 and 15 contexts, and UserKNN in 4) but give up part of the gain. Paired with equal pooling in the same store, weighting changes the mean gain by −0.004 [−0.009, +0.001] for ItemKNN and −0.005 [−0.010, −0.001] for EASE. Greedy selection changes it by −0.006 and −0.008, both with intervals below zero (Supplementary Table S16). The validation sets of these baselines are small, however (median 15 users). Validation users also have longer histories than test users (median seven compared with two training interactions, Supplementary Table S20). This comparison therefore shows only that validation-based adaptation did not help here. Gains vary by category (Supplementary Table S19). All seven Books stores gain or stay level with ItemKNN (+0.001 to +0.070), whereas Electronics is mixed (−0.012 to +0.024). The largest gains, in DE Automotive (+0.071) and FR Books (+0.070), occur in stores with a weak local model, and DE Automotive has no validation users.
Pooling could help the item-based models through foreign popularity alone. A null pool that keeps only product popularity and user activity, however, lowers their accuracy (ItemKNN mean −0.015 [−0.027, −0.005]). Real foreign data exceed this null pool by +0.032 [+0.017, +0.050] for ItemKNN and +0.034 [+0.018, +0.055] for EASE (10 draws, median draw-to-draw SD 0.002–0.004). By the pre-set rule, co-interaction patterns are therefore supported. This result is evidence that the co-interaction structure contributes to the pooling gain beyond the preserved marginal counts (product popularity and user activity). That pooling beats a well-tuned local model is shown by the separate comparison above. On the 51 contexts in the MA-GMF comparison (Books and Movies and TV excluded), equal pooling changes ItemKNN by a median of +0.012 [+0.002, +0.024] (28 contexts better and 3 worse). Equal pooling changes EASE by +0.011 [+0.005, +0.022], as on all contexts (Supplementary Table S16). MA-GMF shows no detectable gain over pooled GMF (median +0.0005 [−0.004, +0.010]), and neither beats local GMF once local GMF receives as many gradient updates. Pooled GMF scores below update-matched local GMF in 37 of 51 contexts, and MA-GMF scores below local ItemKNN (median −0.037 [−0.062, −0.017], Supplementary Table S5a). Given its small tuning budget (Appendix A), this finding concerns the MA-GMF implementation of this study, not market-aware models in general. Under the calendar cutoff, no ItemKNN or EASE pooling arm has a mean gain distinguishable from zero (ItemKNN +0.006 [−0.008, +0.014]). This estimate is uncertain. Its interval lies below the retrospective mean of +0.017, but with seven country clusters, coverage may fall below 95% (Section 4.6). The calendar split also evaluates a different population (Section 3), so the two estimates are not directly comparable. At two earlier cutoffs (60th/70th and 70th/80th percentiles), the mean ItemKNN gain is +0.010 [+0.001, +0.026] and +0.010 [+0.001, +0.021], intervals that barely exclude zero, on 56 and 62 contexts. Only 56% of contexts keep their sign across the three origins (Supplementary Table S23). The adaptive arms gain +0.004 to +0.007 on average, 3 of 4 with intervals just above zero. UserKNN pooling lowers accuracy (−0.013 [−0.026, −0.002], Supplementary Table S5b).
Across stores, users with short histories gain the most (Supplementary Table S15 and Figure S2). The median ItemKNN gain is +0.020 with one past interaction and +0.002 with five or more, and the EASE gains are +0.018 and +0.003. Within stores, however, the short-history advantage is not supported. Users with 1–2 interactions gain more in 20 of 42 contexts (mean d ItemKNN −0.0002 [−0.011, +0.012], EASE +0.003 [−0.008, +0.014]).
5.3. RQ3: Foreign Data Largely Replace Missing Patterns; Launch Gains Are Retrospective
Foreign data substitute for much of the missing pattern knowledge, but not for missing user histories (Table 3 and Figure 4). When local pattern data are scarce, the median share of the gap closed is 0.71 with ItemKNN (95% CI [0.44, 1.11]). The share is 0.68 with EASE, 0.55 with UserKNN, and 0.69 with ItemKNN on the chronological split. Foreign data close at most 0.03 of the gap when only user histories are scarce, and 0.08–0.10 when both are scarce, as in a new market. The median absolute gain shrinks as more local data are kept (ItemKNN: +0.058 at 5% to +0.027 at 50%), whereas the share of the gap closed stays near 0.7. At 10%, 77% of test users keep no scoring history and 21% keep one, so the small history effect mainly reflects users without history. Users with one retained interaction gain a median of +0.012 [+0.002, +0.027]. A local popularity fallback for empty histories raises the history-scarce local-only score from 0.026 to 0.082 (Supplementary Table S13). With this fallback in both arms, foreign data still add almost nothing (mean +0.004 [+0.002, +0.007], by construction the same gain as without a fallback). Pooled popularity as the fallback lowers accuracy (−0.024 [−0.041, −0.011]). The same ordering holds under the calendar cutoff, with a median gain of +0.024 under pattern scarcity. ItemKNN and EASE close a median of 0.79 [0.34, 1.14] and 0.60 [0.22, 0.80] of the gap. When 50% of the local data are kept, the medians are 0.48 and 0.37, with intervals including zero (Supplementary Table S5b).
Table 3.
Value of foreign data when 10% of local training interactions are kept.
Figure 4.
Scarce local knowledge. Panels show (a) the gain and (b) the share of the gap closed by retention level and arm (lines: ItemKNN, random split, and markers: other models and splits), and (c) the gain by retained history (0, 1, 2+) at 10%.
The gap closed varies widely between stores (Supplementary Section S24). With ItemKNN, the gap closed is positive in all 65 contexts and exceeds 1 in 20 of them. In those cases, 10% of local data plus foreign data beat all local data. There, ItemKNN with all local data scores only 0.04–0.23, and the ratio is unstable.
The launch benefit is small and limited to retrospective simulations (Table 4 and Figure 5). In the per-user splits, with zero local feedback, foreign data lift ItemKNN to a median NDCG@10 of 0.045 on launched products, compared with 0.012 for chance. The difference is +0.032 [+0.014, +0.062], with ItemKNN above chance in 52 of 63 contexts, compared with three without foreign data. Overall NDCG@10 rises by +0.016. Validation feedback changes the ItemKNN and EASE medians by at most 0.004. Foreign popularity helps launched products only slightly (MostPop +0.012 above chance) and lowers overall accuracy (−0.022). The lift does not depend on the 10-user threshold (ItemKNN, random split, 65 contexts: +0.032 at 1 to 20 users, Supplementary Table S11). Removing every reviewer found in more than one market changes the per-context ItemKNN lift by a median of +0.005 [−0.004, +0.011]. With the duplicated variant reviews kept, the lift would be +0.269 because a launched product’s reviews stay visible under its sibling ASINs (Section 5.5). Under the calendar cutoff, the lift is not detectable (+0.000 [−0.003, +0.005], with 6 of the 41 contexts common to all models above chance and an MDE of the mean lift of 0.009). The lift remains undetectable with a one-user threshold (65 contexts, +0.000 [+0.000, +0.003], overall change +0.004 [−0.000, +0.010]). It is also undetectable for products without raw local interactions before the cutoff (42 contexts, mostly without hits for either the model or chance). This test, however, contains almost no information because chance and the models score near zero. Repetition noise is small compared with differences between stores (Supplementary Table S5c). The median within-context SD is 0.002, compared with 0.048 between contexts, for the ItemKNN scarcity gain, and 0.012, compared with 0.045, for the launch lift.
Table 4.
Product launch (zero local feedback): NDCG@10 on launched products, difference from chance, and change in overall NDCG@10.
Figure 5.
Product launch: launched-item NDCG@10 minus chance per context, local only compared with foreign data added (zero-feedback tuning). Columns show the random (), chronological (), and calendar () splits, the common context sets of Supplementary Section S1.
5.4. RQ4 (Exploratory): Distant Countries Agree Less on Popularity; No Link to Transfer
This analysis is exploratory. With seven countries, a test at the Bonferroni level detects only correlations of –0.63 (Supplementary Table S21). One of the 15 tests passes the threshold of 0.0033 (Table 5 and Supplementary Figure S3): the farther apart two countries’ capitals are, the more popularity agreement is lost (, ). Four more tests reach nominal significance, all on agreement, namely popularity with cultural distance, top-10 and 5-NN overlap with geographic distance, and 5-NN with cultural distance. Co-interaction cosine, the measure that transfers best, is not related to any distance. For the single-donor gain, the correlations are (), (), and (). With the ratio outcome (pairs with ), no test reaches nominal significance, so the popularity–distance link depends on the scale. Geographic and cultural distance are correlated across these countries, so the results do not identify which distance matters. Non-significant results also do not show that country characteristics lack value for choosing donors.
Table 5.
Country distances compared with cross-market agreement and single-donor transfer: correlation r (exact permutation p).
5.5. Robustness: Duplicated Reviews, Filtering, and Store Size
Keeping the reviews duplicated across product variants, as the previous version of this study did, mainly inflates absolute accuracy and the launch test (Supplementary Table S12). Local-only ItemKNN then scores a median of 0.565 instead of 0.105 because a test interaction is often a copy of a training interaction under a sibling ASIN. The retrospective launch lift rises from +0.032 to +0.269. Paired on the 64 contexts present in both data versions, merging lowers the per-context ItemKNN lift by a median of 0.199 [0.069, 0.393]. RQ1 is unaffected (patterns lose less agreement in 96% of 324 pairs). Pooling gains become less consistent: the mean ItemKNN gain is +0.025 [+0.002, +0.072], with 28 stores better and 10 worse. On the 65 contexts of the main data, this gain is +0.009 [−0.003, +0.022]. Removing every reviewer ID found in more than one market changes little (mean ItemKNN pooling gain +0.020 instead of +0.017, and launch lift +0.033 instead of +0.032).
The core filter is heavy (Section 3), and pooling gains are larger in the stores that the filter had to relax to . The ItemKNN median is +0.023 in these stores, compared with +0.005 at (Spearman [−0.71, +0.11], Supplementary Table S19). These stores are the smaller ones. A lighter filter keeps every user with at least two interactions and applies no product threshold. This filter raises the interactions of the 68 stores from 2.08 M to 5.17 M and their median catalog from 374 to 1268 products (Supplementary Table S14). Patterns still lose less agreement than popularity (94% of 334 common pairs, with six large Books pairs excluded for exceeding the memory limit). Pooling becomes slightly more useful (mean ItemKNN gain +0.022 [+0.012, +0.036], with 41 stores better and none worse, and EASE +0.017). Under the lighter filter, the stores that the main filter set to still gain (median +0.011), and those set to gain more (+0.021). The link with k therefore seems to reflect store size more than the filter level. The gain is also weakly lower in stores with more local training data (Spearman for ItemKNN). None of these correlations have an interval excluding zero, and the correlated store characteristics cannot be separated.
6. Discussion
6.1. Theoretical Implications
In XMarket, which products receive most interactions agrees poorly between countries. Which products are reviewed together, in contrast, carries over beyond a degree-preserving null on every pattern measure (Table 1). That patterns carry over better than popularity is a comparison across measures with different scales. This comparison holds on the difference, ratio, and chance-corrected scales, with the duplicated reviews merged or kept, and within the informative strata of the shared products. The residual measure, however, supports the comparison only partly (81% of pairs on the difference scale, and an interval including zero on the chance-corrected scale). Residual co-occurrence, , is unscaled, so its agreement is dominated by popular products. This agreement tracks the popularity loss across pairs (Spearman 0.62, compared with 0.41 for cosine). Sparsity does not explain this behavior (75–88% of pairs in every density quartile, Supplementary Section S24). Removing marginal frequencies in this way leaves a quantity that behaves partly like popularity, which is a limit of the two-way distinction. The residual measure still exceeds the null ( [+0.11, +0.22]). This finding fits documented demand differences between markets [9] and suggests a finer answer to the standardize-or-adapt question in international e-commerce [28]. Popularity rankings may be adapted to each country, whereas product relationships may be shared (Table 1 and Table 3).
The value of a foreign record depends on which kind of local knowledge is missing. Foreign data recover a large share of a pattern gap, little of a new-market gap, and almost none of a history gap (Table 3). The last result shows that the tested models cannot personalize users without a local history because users are keyed per store. This result does not show that foreign information cannot help cold users, which designs with shared users or learned priors could test. With complete local data, equally weighted pooling gives the item-based models a small, consistent, retrospective gain. The mean gain equals about 13–16% of the median local score, a ratio of two summary statistics. The null pool indicates that the co-interaction structure contributes to this gain beyond preserved marginal counts. Under calendar cutoffs, the gain is inconclusive at the main origin and similar in size at two earlier origins. A store with complete local data may already hold much of the pattern knowledge that foreign data would add (not tested directly). The gain also tends to be larger in small stores. The result extends evidence that the value of extra data depends on the data a firm already holds [37,38].
Country distance measures, standard in international business [33], predict cross-border online trade [34,35]. In this exploratory analysis, geographic distance is associated with weaker popularity agreement, a link that passes the Bonferroni threshold on the difference scale but not on the ratio scale. No distance measure, however, predicts the transfer gain (Table 5). These measures thus give no reliable support for choosing which foreign stores to borrow from.
With full-catalog ranking and tuned simple models, the average benefit of foreign data for stores with complete local data is small (Table 2), including for the MA-GMF implementation of this study. Earlier cross-market studies report pooling gains when ranking each test interaction against 99 sampled products [1] (Section 2.1). This study did not rerun that protocol or most of those methods, so the results are not directly comparable. The duplicated variant reviews found here may also affect those evaluations because a test item can be a copy of a training item.
6.2. Managerial Implications
In offline ranking accuracy, not sales, and in simulated scarcity, platforms can benefit from foreign co-interaction data when a local store lacks co-interaction data but has user histories. This benefit also appears under a calendar cutoff. When both kinds of local data are scarce, as in a new market, the gain is small (Table 3). For stores with complete local data, the tested pooling approach produced modest retrospective gains (+0.017 NDCG@10). Under the calendar cutoff, the estimate is uncertain (+0.006 [−0.008, +0.014]). That analysis has only seven country clusters and evaluates a different population. Pooling should therefore be evaluated within each deployment setting—for example, per store or category (Supplementary Table S19). Evidence for product launches is limited to retrospective simulations with small lifts (Table 4). Platforms should not rank local products by foreign most-reviewed lists: foreign popularity agrees poorly with local popularity (Table 1), and pooling it into MostPop lowers accuracy in most stores (Table 2).
Foreign data cannot supply local users’ histories, so collecting local data remains necessary (Section 5.3). Offline evaluations on review data should merge variant listings that share reviews, which otherwise inflate local accuracy about fivefold and launch gains about eightfold here (Section 5.5).
6.3. Policy Implications
Data-localization measures are spreading [40] and have been linked to lower productivity in data-reliant sectors [41]. This study measures offline recommendation accuracy only, not economic costs, sales, welfare, or productivity. Within that scope, it suggests a hypothesis for future work. Rules that keep interaction data inside national borders may cost stores with complete local data some offline accuracy under equally weighted pooling into simple models. The cost may be larger with a lighter filter (Table 2 and Section 5.5) and for stores whose local co-interaction data are scarce (Table 3).
6.4. Limitations and Future Work
This study uses one dataset from one platform with seven countries and tests only simple closed-form models, and its interactions are reviews, not purchases. Of the published cross-market methods, only MA-GMF was run. The others transfer through pre-training, meta-learning, attention, or prompt tuning [1,3,4,5] and were tuned and evaluated against 99 sampled negatives. Re-implementing and tuning these methods faithfully for full-catalog ranking on all contexts was beyond this study. These methods, and transferability-based source weighting [27], may gain more with complete local data. The RQ2 conclusion therefore covers only equally weighted direct pooling into the tested models and the two validation-based baselines, which were tuned on small validation sets. The scarcity and launch experiments hide interactions rather than observe real new stores or launches. The launch catalog is assumed, and under the calendar cutoff, it is identified with post-cutoff information. The variant families that define product identities are also inferred from the complete observation period, including post-cutoff interactions. Inferring them from pre-cutoff data only is left for future work. The main calendar analysis uses one cutoff pair, and two earlier origins (60th/70th and 70th/80th percentiles) are reported as a check (Supplementary Table S23). The calendar population is small and unusual (a median of 91 test users with one training interaction), so its estimates are uncertain. The variant rule is a heuristic verified with review texts and may miss variants or merge distinct products. Seven country clusters may make intervals too narrow. RQ1 compares stores only on the products both stores list. In the per-user splits, the core filter uses each store’s full history. The filtered benchmark (median 374 products, 8.6% of deduplicated interactions kept) is smaller and more select than a production catalog. A lighter filter on all stores gave similar conclusions, but the long tail of large catalogs remains untested. The country-closeness tests are exploratory and have low power. The study was not pre-registered, and several analyses were added during review (Supplementary Table S22). Future work should test neural and language-model recommenders [13,14], more countries, transaction data and real launches, and source-specific transferability [27].
7. Conclusions
This study asked what knowledge in interaction data transfers between the country stores of an e-commerce platform, and when it helps. In XMarket and for the tested models, popularity agrees poorly across countries, whereas co-interaction patterns carry over beyond chance and lose less agreement than popularity on the scales compared. The residual co-occurrence measure, however, supports this comparison only partly. When local pattern data are scarce, foreign patterns close a substantial part of the accuracy gap. Foreign patterns also do so under a calendar cutoff, which comes closest to the intended prediction setting, although its product identities use the full observation period. For stores with complete local data, equally weighted pooling gives the item-based models a small, consistent gain in retrospective splits. The calendar-cutoff estimate, by contrast, is inconclusive (+0.006 [−0.008, +0.014], and +0.010 at two earlier cutoffs). Validation-tuned weighting or donor selection avoids most per-store losses without raising the average gain. Launched products gain only in retrospective simulations. Foreign data cannot replace the interaction histories of local users for the tested models. Country closeness, examined in exploratory tests, gave no guide as to which foreign stores to borrow from. Reviews that Amazon duplicates across product variants inflate offline accuracy and launch gains several-fold if kept, so evaluations on such data should merge them.
Supplementary Materials
The following supporting information can be downloaded at https://www.mdpi.com/article/10.3390/jtaer21110416/s1, Table S1: Product launch per context, random split; Table S2: Dataset accounting for the 68 retained contexts; Table S3: Experiment accounting: included contexts, exclusions by reason and completed repetitions, per experiment; Table S4: Inputs of the country-distance analysis; Table S5a: Null-pool ablation and Market-Aware GMF (random split, NDCG@10); Table S5b: Further robustness checks cited in the main text; Table S5c: Variability across repetitions; Table S6: Per-context experiment accounting; Table S7: RQ1 diagnostics and launch skips; Table S8: RQ1 paired comparison by sparsity; Table S9: Chance-corrected and ratio-scale paired comparison (RQ1) by minimum denominator (all foreign data); Table S10: Calendar split: cutoffs and accounting against the retrospective random split; Table S11: Product launch: robustness (zero-feedback tuning, NDCG@10); Table S12: Reviews duplicated across product variants: verification of the merge and its effect on the results; Table S13: Scarcity experiment (, random split): popularity fallback for users with an empty scoring history; Table S14: Light filter on all categories: every user with at least two interactions kept, no product threshold (variants merged); Table S15: Gain from foreign data by number of past local interactions (random split, NDCG@10); Table S16: RQ2: adaptive baselines paired with equal pooling, the MA-GMF context subset, and a category bootstrap; Table S17: RQ1 within strata of the shared products, and by the share of local data on shared products (cosine vs rank correlation); Table S18: Minimum detectable effects (MDE) and Bonferroni-adjusted intervals; Table S19: Pooling gain (RQ2, random split) by store characteristics and by category; Table S20: Validation sets of the per-user random split; Table S21: RQ1 undefined measures and RQ4 detectable correlations; Table S22: Analysis path: which analyses entered in which version, and which rules were fixed in advance; Table S23: Calendar split at three cutoff origins: pooling gain (pool − local NDCG@10); Section S24: Further results cited in the main text; Figure S1: Measuring what travels (RQ1); Figure S2: Gain by user history length; Figure S3: Country closeness and transfer; Figure S4: Complete local data; further per-context results: code repository.
Funding
This research received no external funding.
Institutional Review Board Statement
Not applicable.
Informed Consent Statement
Not applicable.
Data Availability Statement
The XMarket dataset analyzed in this study is publicly available at https://xmrec.github.io/ [1]. Code, preprocessing and identity scripts, split rules, seeds, configurations, exclusions, and per-run outputs are at https://github.com/basmakdd/xmarket-transfer-code (accessed on 4 November 2026) (archived on Zenodo as release v1.3, which matches this version: https://doi.org/10.5281/zenodo.23918515).
Acknowledgments
During the preparation of this manuscript, the author used a generative AI assistant (Claude Opus 5.5, Anthropic) for paraphrasing and proofreading of the text and for help with writing and checking analysis code. The author has reviewed and edited the output, verified the code and its results, and takes full responsibility for the content of this publication.
Conflicts of Interest
The author declares no conflicts of interest.
Appendix A. Hyperparameter Grids
Table A1.
Hyperparameter grids, where the first value is the default when no validation users exist.
All GMF variants share one implementation (PyTorch 2.14.1, CPU) and differ only in their training data and the market embedding. A user and a product are embedded in 32 dimensions (initialized from ), and GMF scores . MA-GMF multiplies the product embedding by a learned market embedding, , with initialized to ones, so it starts from pooled GMF [2]. Training minimizes binary cross-entropy with four negatives per positive, sampled uniformly from the catalog of the positive’s own country store and redrawn every epoch, using Adam with a batch size of 1024. Each configuration of the grid trains for up to 30 epochs, and full-catalog validation NDCG@10 after every epoch selects the configuration and epoch (patience 3). Stores without validation users use the first configuration after 10 epochs. Local GMF uses local data only, whereas pooled GMF and MA-GMF use local plus all same-category foreign data. The update-matched local GMF receives as many gradient updates per epoch as pooled GMF. A compute rule fixed in advance excluded two categories: a category is skipped if one pooled epoch takes over 15 s, which held for Books and Movies and TV.
References
- Bonab, H.; Aliannejadi, M.; Vardasbi, A.; Kanoulas, E.; Allan, J. Cross-market product recommendation. In Proceedings of the 30th ACM International Conference on Information and Knowledge Management, Online, 1–5 November 2021; ACM: New York, NY, USA, 2021; pp. 110–119. [Google Scholar] [CrossRef] [Scilit]
- Bhargav, S.; Aliannejadi, M.; Kanoulas, E. Market-Aware Models for Efficient Cross-Market Recommendation. In Proceedings of the Advances in Information Retrieval—45th European Conference on Information Retrieval, ECIR 2023, Dublin, Ireland, 2–6 April 2023, Proceedings, Part I; Kamps, J., Goeuriot, L., Crestani, F., Maistro, M., Joho, H., Davis, B., Gurrin, C., Kruschwitz, U., Caputo, A., Eds.; Lecture Notes in Computer Science; Springer: Cham, Switzerland, 2023; Volume 13980, pp. 134–149. [Google Scholar] [CrossRef] [Scilit]
- Hu, Z.; Nakagawa, S.; Cai, S.M.; Ren, F.; Deng, J. Enhancing cross-market recommendations by addressing negative transfer and leveraging item co-occurrences. Inf. Syst. 2024, 124, 102388. [Google Scholar] [CrossRef] [Scilit]
- Wang, C.; Fan, Z.; Yang, L.; Yang, M.; Liu, X.; Liu, Z.; Yu, P.S. Pre-Training with Transferable Attention for Addressing Market Shifts in Cross-Market Sequential Recommendation. In Proceedings of the 30th ACM SIGKDD Conference on Knowledge Discovery and Data Mining, Barcelona, Spain, 25–29 August 2024; ACM: New York, NY, USA, 2024; pp. 2970–2979. [Google Scholar] [CrossRef] [Scilit]
- Zhang, L.; Lu, W.; Zhang, H.; Wen, E.; Liang, Z.; Wang, J. Breaking Down Market Barriers: Distilled Prompt-Tuning Approach for Cross-Market Recommendation. In Proceedings of the AAAI Conference on Artificial Intelligence, Singapore, 20–27 January 2026; Volume 40, pp. 28274–28282. [Google Scholar] [CrossRef] [Scilit]
- Pan, S.J.; Yang, Q. A survey on transfer learning. IEEE Trans. Knowl. Data Eng. 2010, 22, 1345–1359. [Google Scholar] [CrossRef] [Scilit]
- Zhang, W.; Deng, L.; Zhang, L.; Wu, D. A survey on negative transfer. IEEE/CAA J. Autom. Sin. 2023, 10, 305–329. [Google Scholar] [CrossRef] [Scilit]
- Zang, T.; Zhu, Y.; Liu, H.; Zhang, R.; Yu, J. A survey on cross-domain recommendation: Taxonomies, methods, and future directions. ACM Trans. Inf. Syst. 2023, 41, 1–39. [Google Scholar] [CrossRef] [Scilit]
- Quan, T.W.; Williams, K.R. Product variety, across-market demand heterogeneity, and the value of online retail. RAND J. Econ. 2018, 49, 877–913. [Google Scholar] [CrossRef] [Scilit]
- Ju, M.; Yoo, D. Culture and self-congruity in online product ratings: Exploring a dual perspective on emotional differences in the pleasure and pain of consumption. J. Theor. Appl. Electron. Commer. Res. 2024, 19, 3443–3460. [Google Scholar] [CrossRef] [Scilit]
- Finn, C.; Abbeel, P.; Levine, S. Model-agnostic meta-learning for fast adaptation of deep networks. In Proceedings of the 34th International Conference on Machine Learning, Sydney, Australia, 6–11 August 2017; Volume 70, pp. 1126–1135. [Google Scholar]
- Geng, S.; Liu, S.; Fu, Z.; Ge, Y.; Zhang, Y. Recommendation as language processing (RLP): A unified pretrain, personalized prompt and predict paradigm (P5). In Proceedings of the 16th ACM Conference on Recommender Systems, Seattle, WA, USA, 18–23 September 2022; ACM: New York, NY, USA, 2022; pp. 299–315. [Google Scholar] [CrossRef] [Scilit]
- Tang, Z.; Huan, Z.; Li, Z.; Zhang, X.; Hu, J.; Fu, C.; Zhou, J.; Zou, L.; Li, C. One Model for All: Large Language Models Are Domain-Agnostic Recommendation Systems. ACM Trans. Inf. Syst. 2025, 43, 1–27. [Google Scholar] [CrossRef] [Scilit]
- Zhao, Z.; Fan, W.; Li, J.; Liu, Y.; Mei, X.; Wang, Y.; Wen, Z.; Wang, F.; Zhao, X.; Tang, J.; et al. Recommender Systems in the Era of Large Language Models (LLMs). IEEE Trans. Knowl. Data Eng. 2024, 36, 6889–6907. [Google Scholar] [CrossRef] [Scilit]
- Dai, B.; Du, Z.; Zhu, J.; Xu, J.; Zou, D.; Dai, Q.; Dong, Z.; Zhang, R.; Zheng, H.T. UniEmbedding: Learning universal multi-modal multi-domain item embeddings via user-view contrastive learning. In Proceedings of the 33rd ACM International Conference on Information and Knowledge Management, Boise, ID, USA, 21–25 October 2024; ACM: New York, NY, USA, 2024; pp. 4446–4453. [Google Scholar] [CrossRef] [Scilit]
- Rajput, S.; Mehta, N.; Singh, A.; Keshavan, R.H.; Vu, T.; Heldt, L.; Hong, L.; Tay, Y.; Tran, V.Q.; Samost, J.; et al. Recommender Systems with Generative Retrieval. In Proceedings of the Advances in Neural Information Processing Systems, New Orleans, LA, USA, 10–16 December 2023; Volume 36, pp. 10299–10315. [Google Scholar]
- Zhai, J.; Liao, L.; Liu, X.; Wang, Y.; Li, R.; Cao, X.; Gao, L.; Gong, Z.; Gu, F.; He, J.; et al. Actions Speak Louder than Words: Trillion-Parameter Sequential Transducers for Generative Recommendations. In Proceedings of the 41st International Conference on Machine Learning, Vienna, Austria, 21–27 July 2024; Volume 235, pp. 58484–58509. [Google Scholar]
- Krichene, W.; Rendle, S. On sampled metrics for item recommendation. In Proceedings of the 26th ACM SIGKDD International Conference on Knowledge Discovery and Data Mining, Virtual Event, 23–27 August 2020; ACM: New York, NY, USA, 2020; pp. 1748–1757. [Google Scholar] [CrossRef] [Scilit]
- Krichene, W.; Rendle, S. On sampled metrics for item recommendation. Commun. ACM 2022, 65, 75–83. [Google Scholar] [CrossRef] [Scilit]
- Dallmann, A.; Zoller, D.; Hotho, A. A case study on sampling strategies for evaluating neural sequential item recommendation models. In Proceedings of the 15th ACM Conference on Recommender Systems, Amsterdam, The Netherlands, 27 September–1 October 2021; ACM: New York, NY, USA, 2021; pp. 505–514. [Google Scholar] [CrossRef] [Scilit]
- Ferrari Dacrema, M.; Cremonesi, P.; Jannach, D. Are we really making much progress? A worrying analysis of recent neural recommendation approaches. In Proceedings of the 13th ACM Conference on Recommender Systems, Copenhagen, Denmark, 16–20 September 2019; ACM: New York, NY, USA, 2019; pp. 101–109. [Google Scholar] [CrossRef] [Scilit]
- Rendle, S.; Krichene, W.; Zhang, L.; Anderson, J. Neural collaborative filtering vs. matrix factorization revisited. In Proceedings of the 14th ACM Conference on Recommender Systems, Online, 22–26 September 2020; ACM: New York, NY, USA, 2020; pp. 240–248. [Google Scholar] [CrossRef] [Scilit]
- Sun, Z.; Yu, D.; Fang, H.; Yang, J.; Qu, X.; Zhang, J.; Geng, C. Are we evaluating rigorously? Benchmarking recommendation for reproducible evaluation and fair comparison. In Proceedings of the 14th ACM Conference on Recommender Systems, Online, 22–26 September 2020; ACM: New York, NY, USA, 2020; pp. 23–32. [Google Scholar] [CrossRef] [Scilit]
- Wang, Z.; Dai, Z.; Póczos, B.; Carbonell, J. Characterizing and avoiding negative transfer. In Proceedings of the IEEE/CVF Conference on Computer Vision and Pattern Recognition, Long Beach, CA, USA, 15–20 June 2019; pp. 11285–11294. [Google Scholar] [CrossRef] [Scilit]
- Zhu, F.; Wang, Y.; Chen, C.; Zhou, J.; Li, L.; Liu, G. Cross-domain recommendation: Challenges, progress, and prospects. In Proceedings of the 30th International Joint Conference on Artificial Intelligence, Virtual, 19–26 August 2021; pp. 4721–4728. [Google Scholar] [CrossRef] [Scilit]
- Cao, J.; Lin, X.; Cong, X.; Ya, J.; Liu, T.; Wang, B. DisenCDR: Learning disentangled representations for cross-domain recommendation. In Proceedings of the 45th International ACM SIGIR Conference on Research and Development in Information Retrieval, Madrid, Spain, 11–15 July 2022; ACM: New York, NY, USA, 2022; pp. 267–277. [Google Scholar] [CrossRef] [Scilit]
- Song, Z.; Zhang, W.; Deng, L.; Zhang, J.; Wu, Z.; Bian, K.; Cui, B. Mitigating negative transfer in cross-domain recommendation via knowledge transferability enhancement. In Proceedings of the 30th ACM SIGKDD Conference on Knowledge Discovery and Data Mining, Barcelona, Spain, 25–29 August 2024; ACM: New York, NY, USA, 2024; pp. 2745–2754. [Google Scholar] [CrossRef] [Scilit]
- Schuetz, A.; Swoboda, B. Institutional Distances and International E-Commerce Firms’ Standardization of Online Offers and Services. J. Int. Mark. 2026, 34, 5–26. [Google Scholar] [CrossRef] [Scilit]
- Chen, J.; Lan, Y.C.; Chang, Y.W. Consumer behaviour in cross-border e-commerce: Systematic literature review and future research agenda. Int. J. Consum. Stud. 2023, 47, 2609–2669. [Google Scholar] [CrossRef] [Scilit]
- Wang, P.; Li, Y.; Chapa, S.; Jing, Z. Consumer and cultural values affecting live streaming impulse buying behavior: A cross-cultural study between China and the United States. J. Theor. Appl. Electron. Commer. Res. 2026, 21, 109. [Google Scholar] [CrossRef] [Scilit]
- Hofstede, G. Dimensionalizing cultures: The Hofstede model in context. Online Read. Psychol. Cult. 2011, 2, 8. [Google Scholar] [CrossRef] [Scilit]
- Kogut, B.; Singh, H. The effect of national culture on the choice of entry mode. J. Int. Bus. Stud. 1988, 19, 411–432. [Google Scholar] [CrossRef] [Scilit]
- Beugelsdijk, S.; Kostova, T.; Roth, K. An overview of Hofstede-inspired country-level culture research in international business since 2006. J. Int. Bus. Stud. 2017, 48, 30–47. [Google Scholar] [CrossRef] [Scilit]
- Gomez-Herrera, E.; Martens, B.; Turlea, G. The drivers and impediments for cross-border e-commerce in the EU. Inf. Econ. Policy 2014, 28, 83–96. [Google Scholar] [CrossRef] [Scilit]
- Lendle, A.; Olarreaga, M.; Schropp, S.; Vézina, P.L. There goes gravity: eBay and the death of distance. Econ. J. 2016, 126, 406–441. [Google Scholar] [CrossRef] [Scilit]
- Bauer, C.; Schedl, M. Global and country-specific mainstreaminess measures: Definitions, analysis, and usage for improving personalized music recommendation systems. PLoS ONE 2019, 14, e0217389. [Google Scholar] [CrossRef] [Scilit]
- Bajari, P.; Chernozhukov, V.; Hortaçsu, A.; Suzuki, J. The impact of big data on firm performance: An empirical investigation. AEA Pap. Proc. 2019, 109, 33–37. [Google Scholar] [CrossRef] [Scilit]
- Schaefer, M.; Sapi, G. Complementarities in learning from data: Insights from general search. Inf. Econ. Policy 2023, 65, 101063. [Google Scholar] [CrossRef] [Scilit]
- Jones, C.I.; Tonetti, C. Nonrivalry and the economics of data. Am. Econ. Rev. 2020, 110, 2819–2858. [Google Scholar] [CrossRef] [Scilit]
- Svantesson, D. Data Localisation Trends and Challenges: Considerations for the Review of the Privacy Guidelines; OECD Digital Economy Papers 301; OECD Publishing: Paris, France, 2020. [Google Scholar] [CrossRef]
- Ferracane, M.F.; Kren, J.; van der Marel, E. Do Data Policy Restrictions Impact the Productivity Performance of Firms and Industries? Rev. Int. Econ. 2020, 28, 676–722. [Google Scholar] [CrossRef] [Scilit]
- McAuley, J.; Targett, C.; Shi, Q.; van den Hengel, A. Image-Based Recommendations on Styles and Substitutes. In Proceedings of the 38th International ACM SIGIR Conference on Research and Development in Information Retrieval, Santiago, Chile, 9–13 August 2015; ACM: New York, NY, USA, 2015; pp. 43–52. [Google Scholar] [CrossRef] [Scilit]
- Strona, G.; Nappo, D.; Boccacci, F.; Fattorini, S.; San-Miguel-Ayanz, J. A fast and unbiased procedure to randomize ecological binary matrices with fixed row and column totals. Nat. Commun. 2014, 5, 4114. [Google Scholar] [CrossRef] [Scilit]
- Carstens, C.J.; Berger, A.; Strona, G. A unifying framework for fast randomization of ecological networks with fixed (node) degrees. MethodsX 2018, 5, 773–780. [Google Scholar] [CrossRef] [Scilit]
- Sarwar, B.; Karypis, G.; Konstan, J.; Riedl, J. Item-based collaborative filtering recommendation algorithms. In Proceedings of the 10th International Conference on World Wide Web, Hong Kong, China, 1–5 May 2001; ACM: New York, NY, USA, 2001; pp. 285–295. [Google Scholar] [CrossRef] [Scilit]
- Deshpande, M.; Karypis, G. Item-based top-N recommendation algorithms. ACM Trans. Inf. Syst. 2004, 22, 143–177. [Google Scholar] [CrossRef] [Scilit]
- Steck, H. Embarrassingly Shallow Autoencoders for Sparse Data. In Proceedings of the WWW’19: World Wide Web Conference, San Francisco, CA, USA, 13–17 May 2019; ACM: New York, NY, USA, 2019; pp. 3251–3257. [Google Scholar] [CrossRef] [Scilit]
- Herlocker, J.L.; Konstan, J.A.; Borchers, A.; Riedl, J. An Algorithmic Framework for Performing Collaborative Filtering. In Proceedings of the 22nd Annual International ACM SIGIR Conference on Research and Development in Information Retrieval, Berkeley, CA, USA, 15–19 August 1999; ACM: New York, NY, USA, 1999; pp. 230–237. [Google Scholar] [CrossRef] [Scilit]
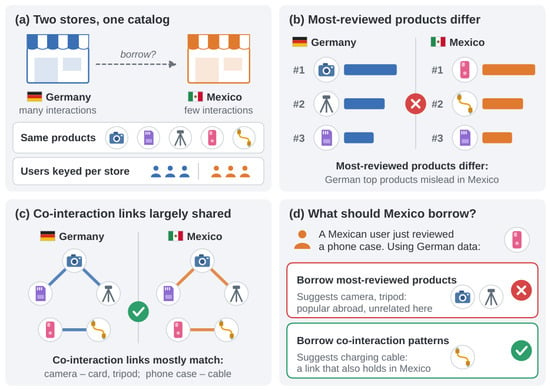
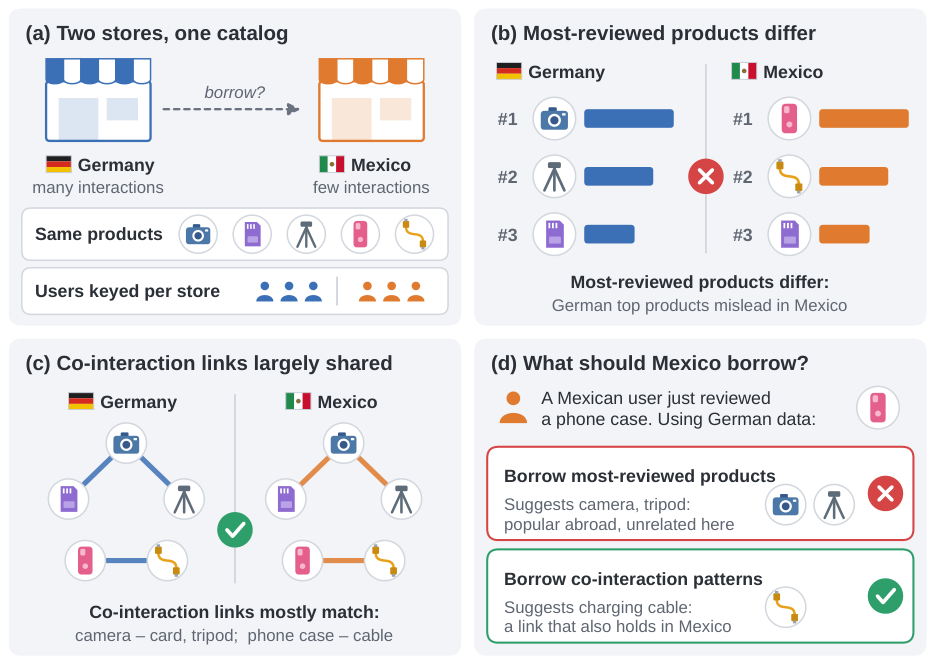
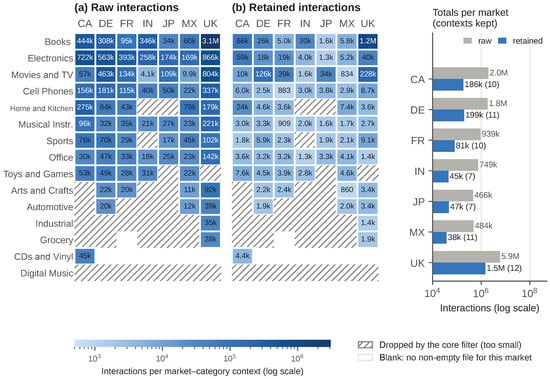
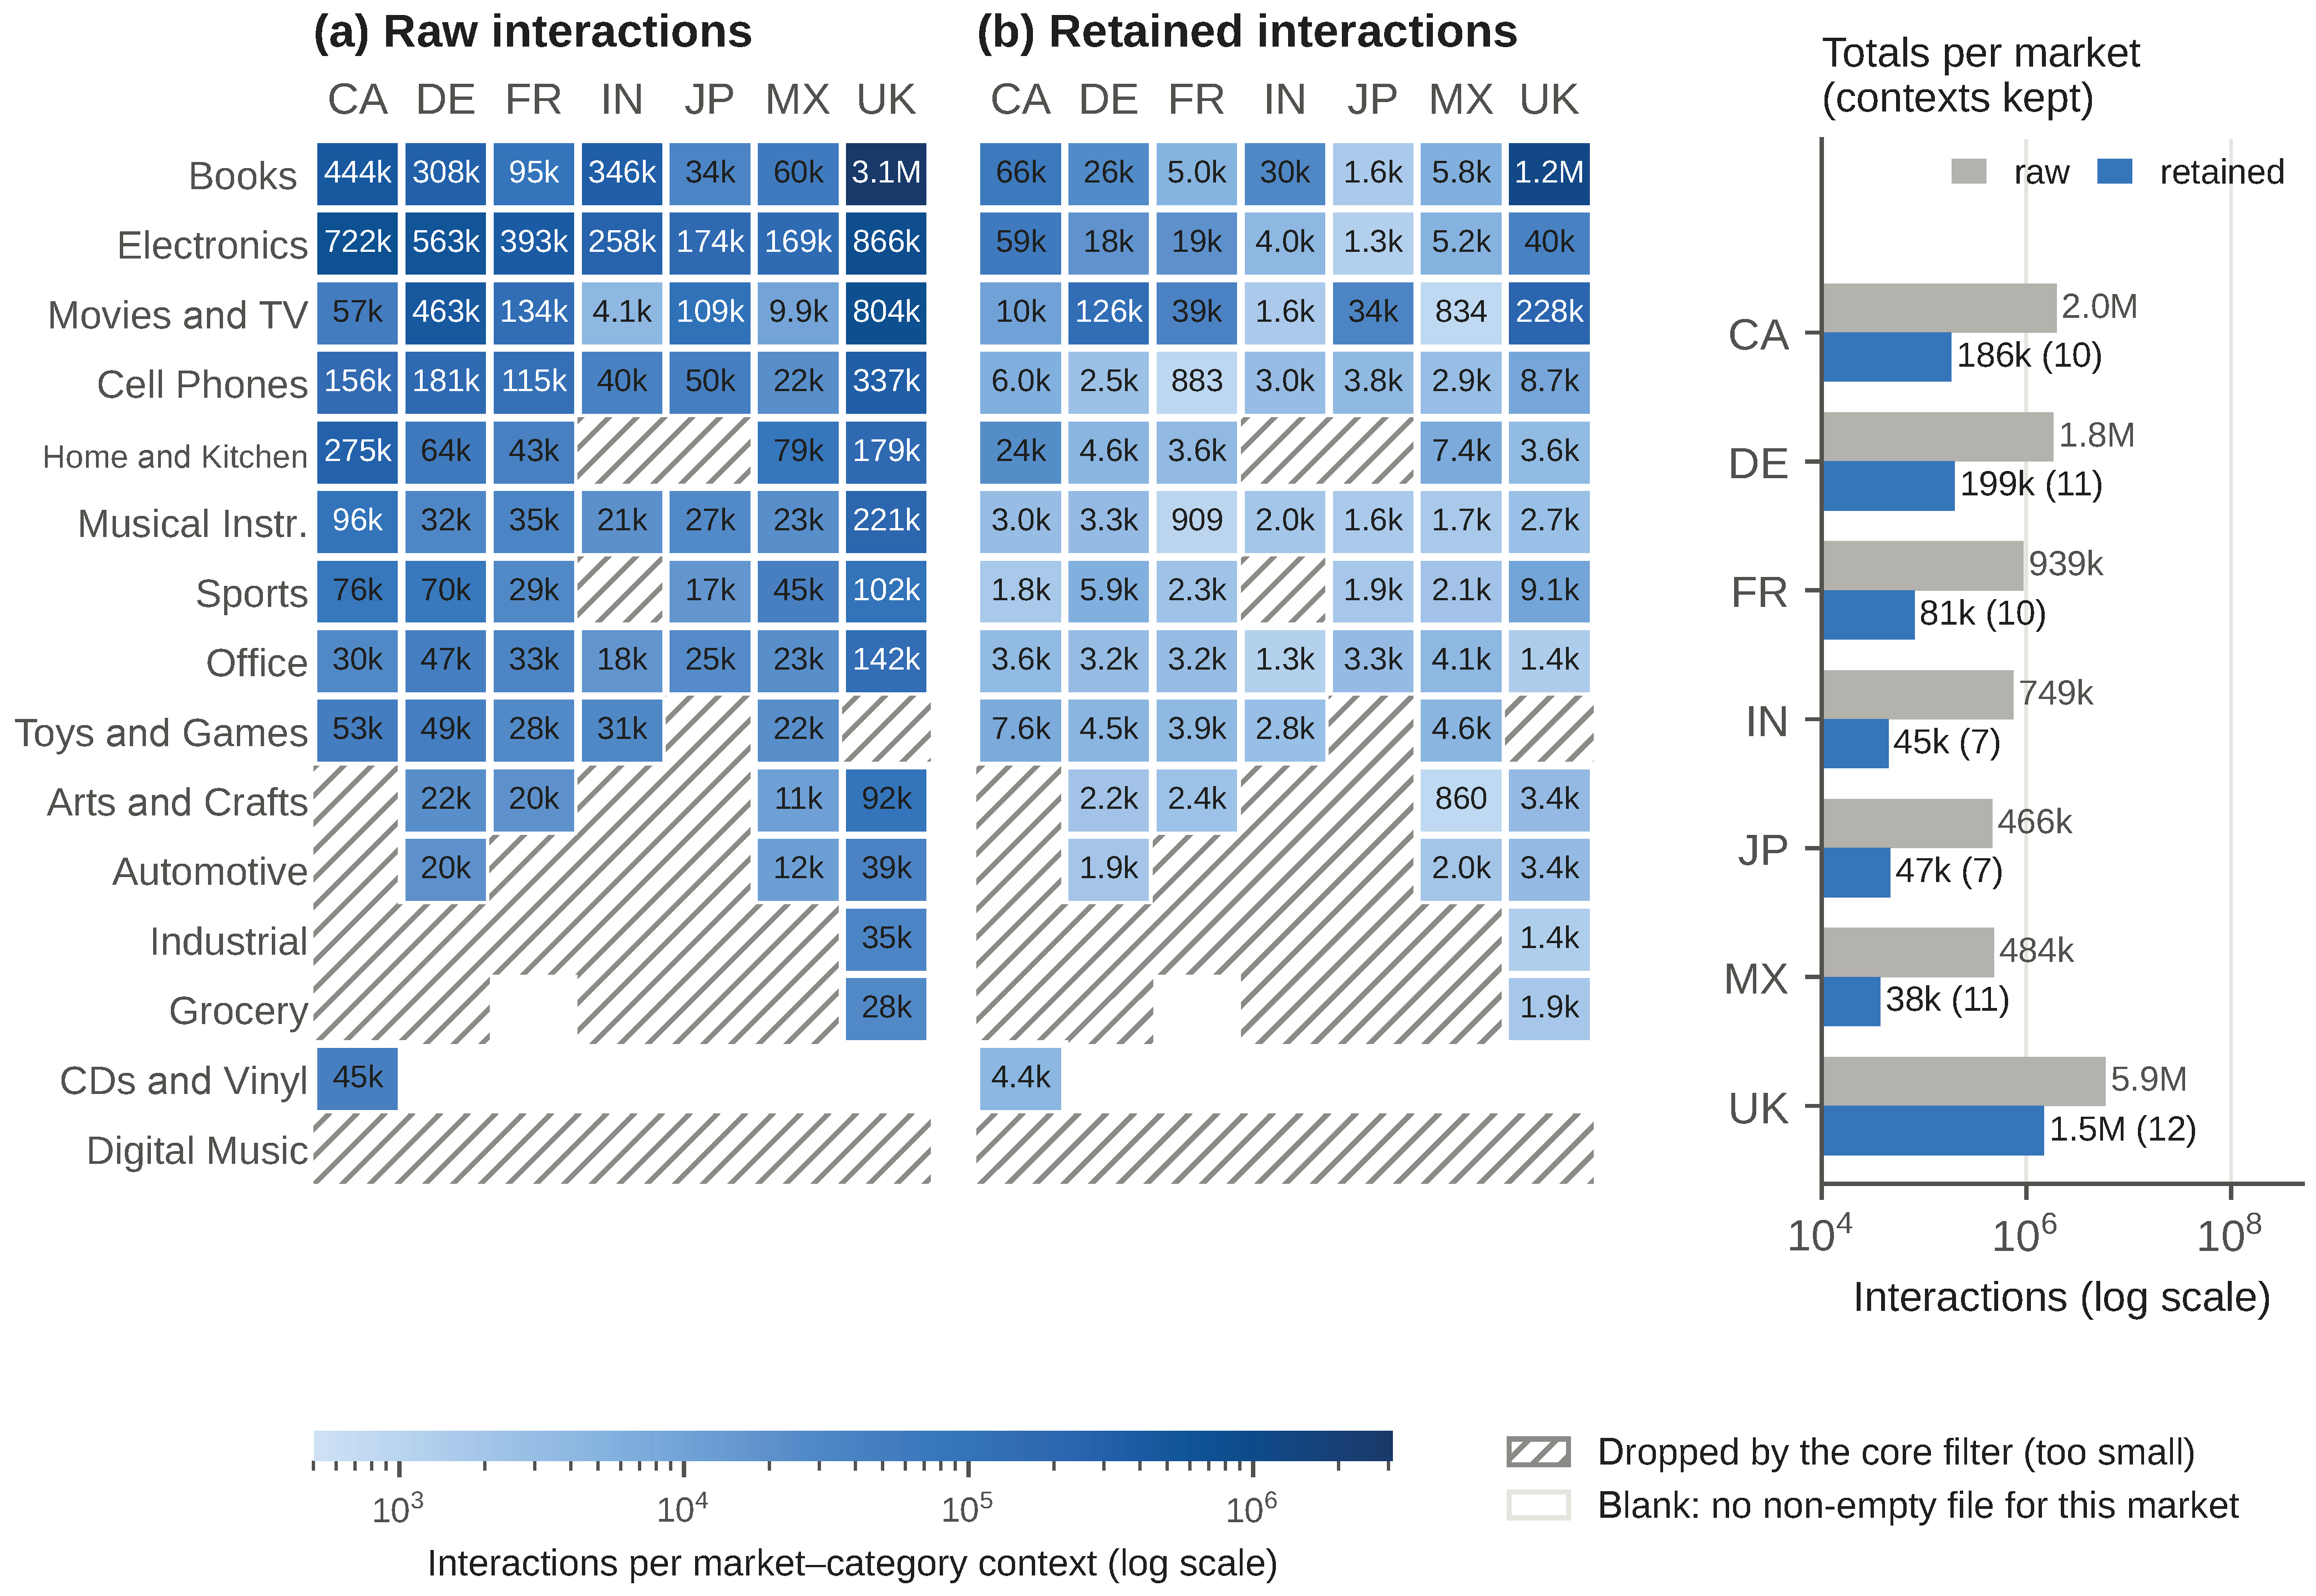
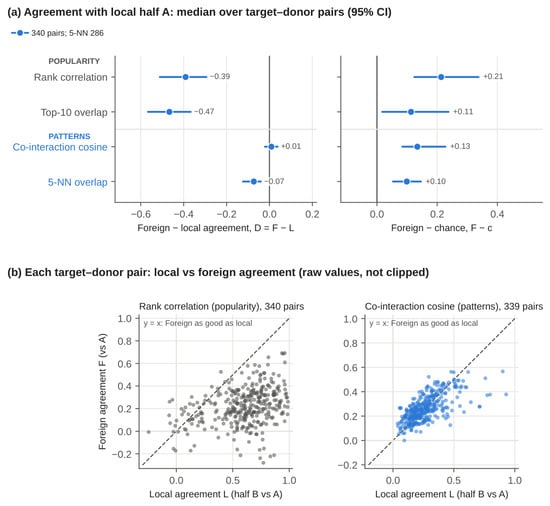
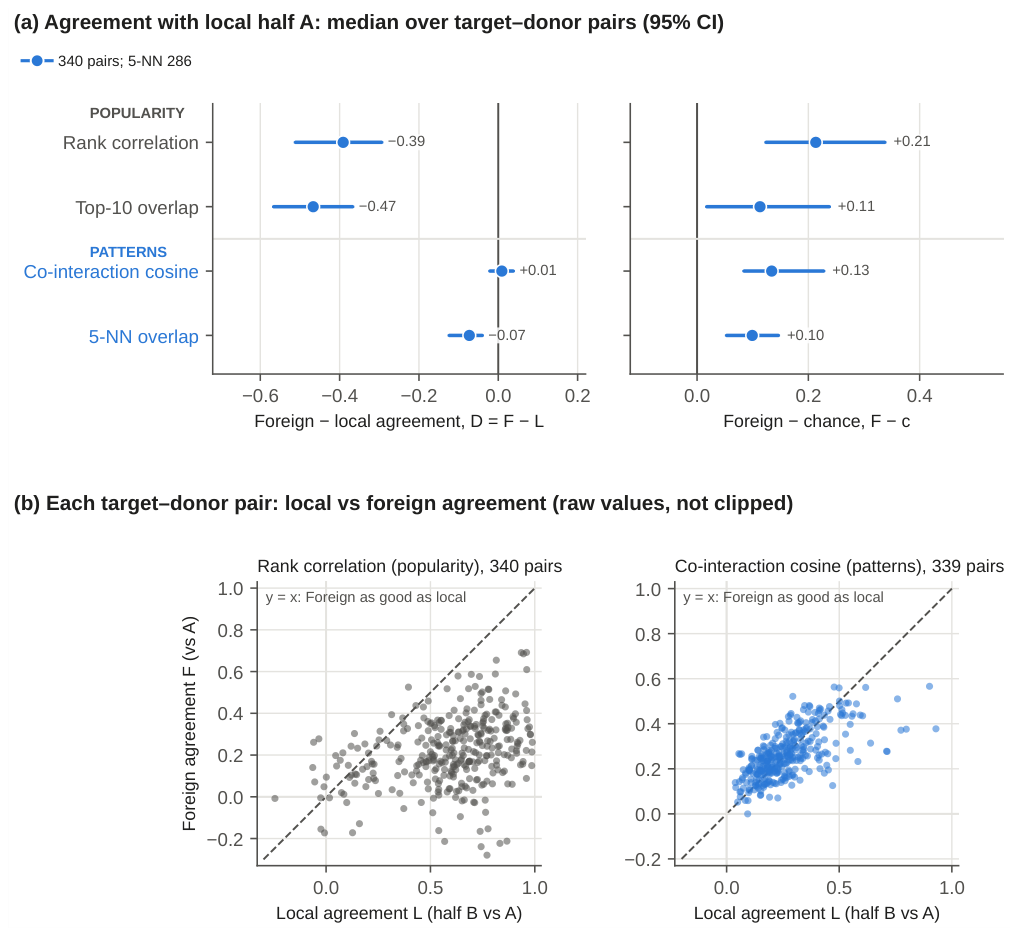
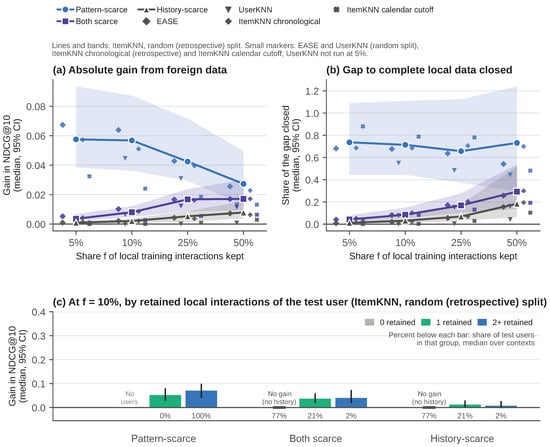
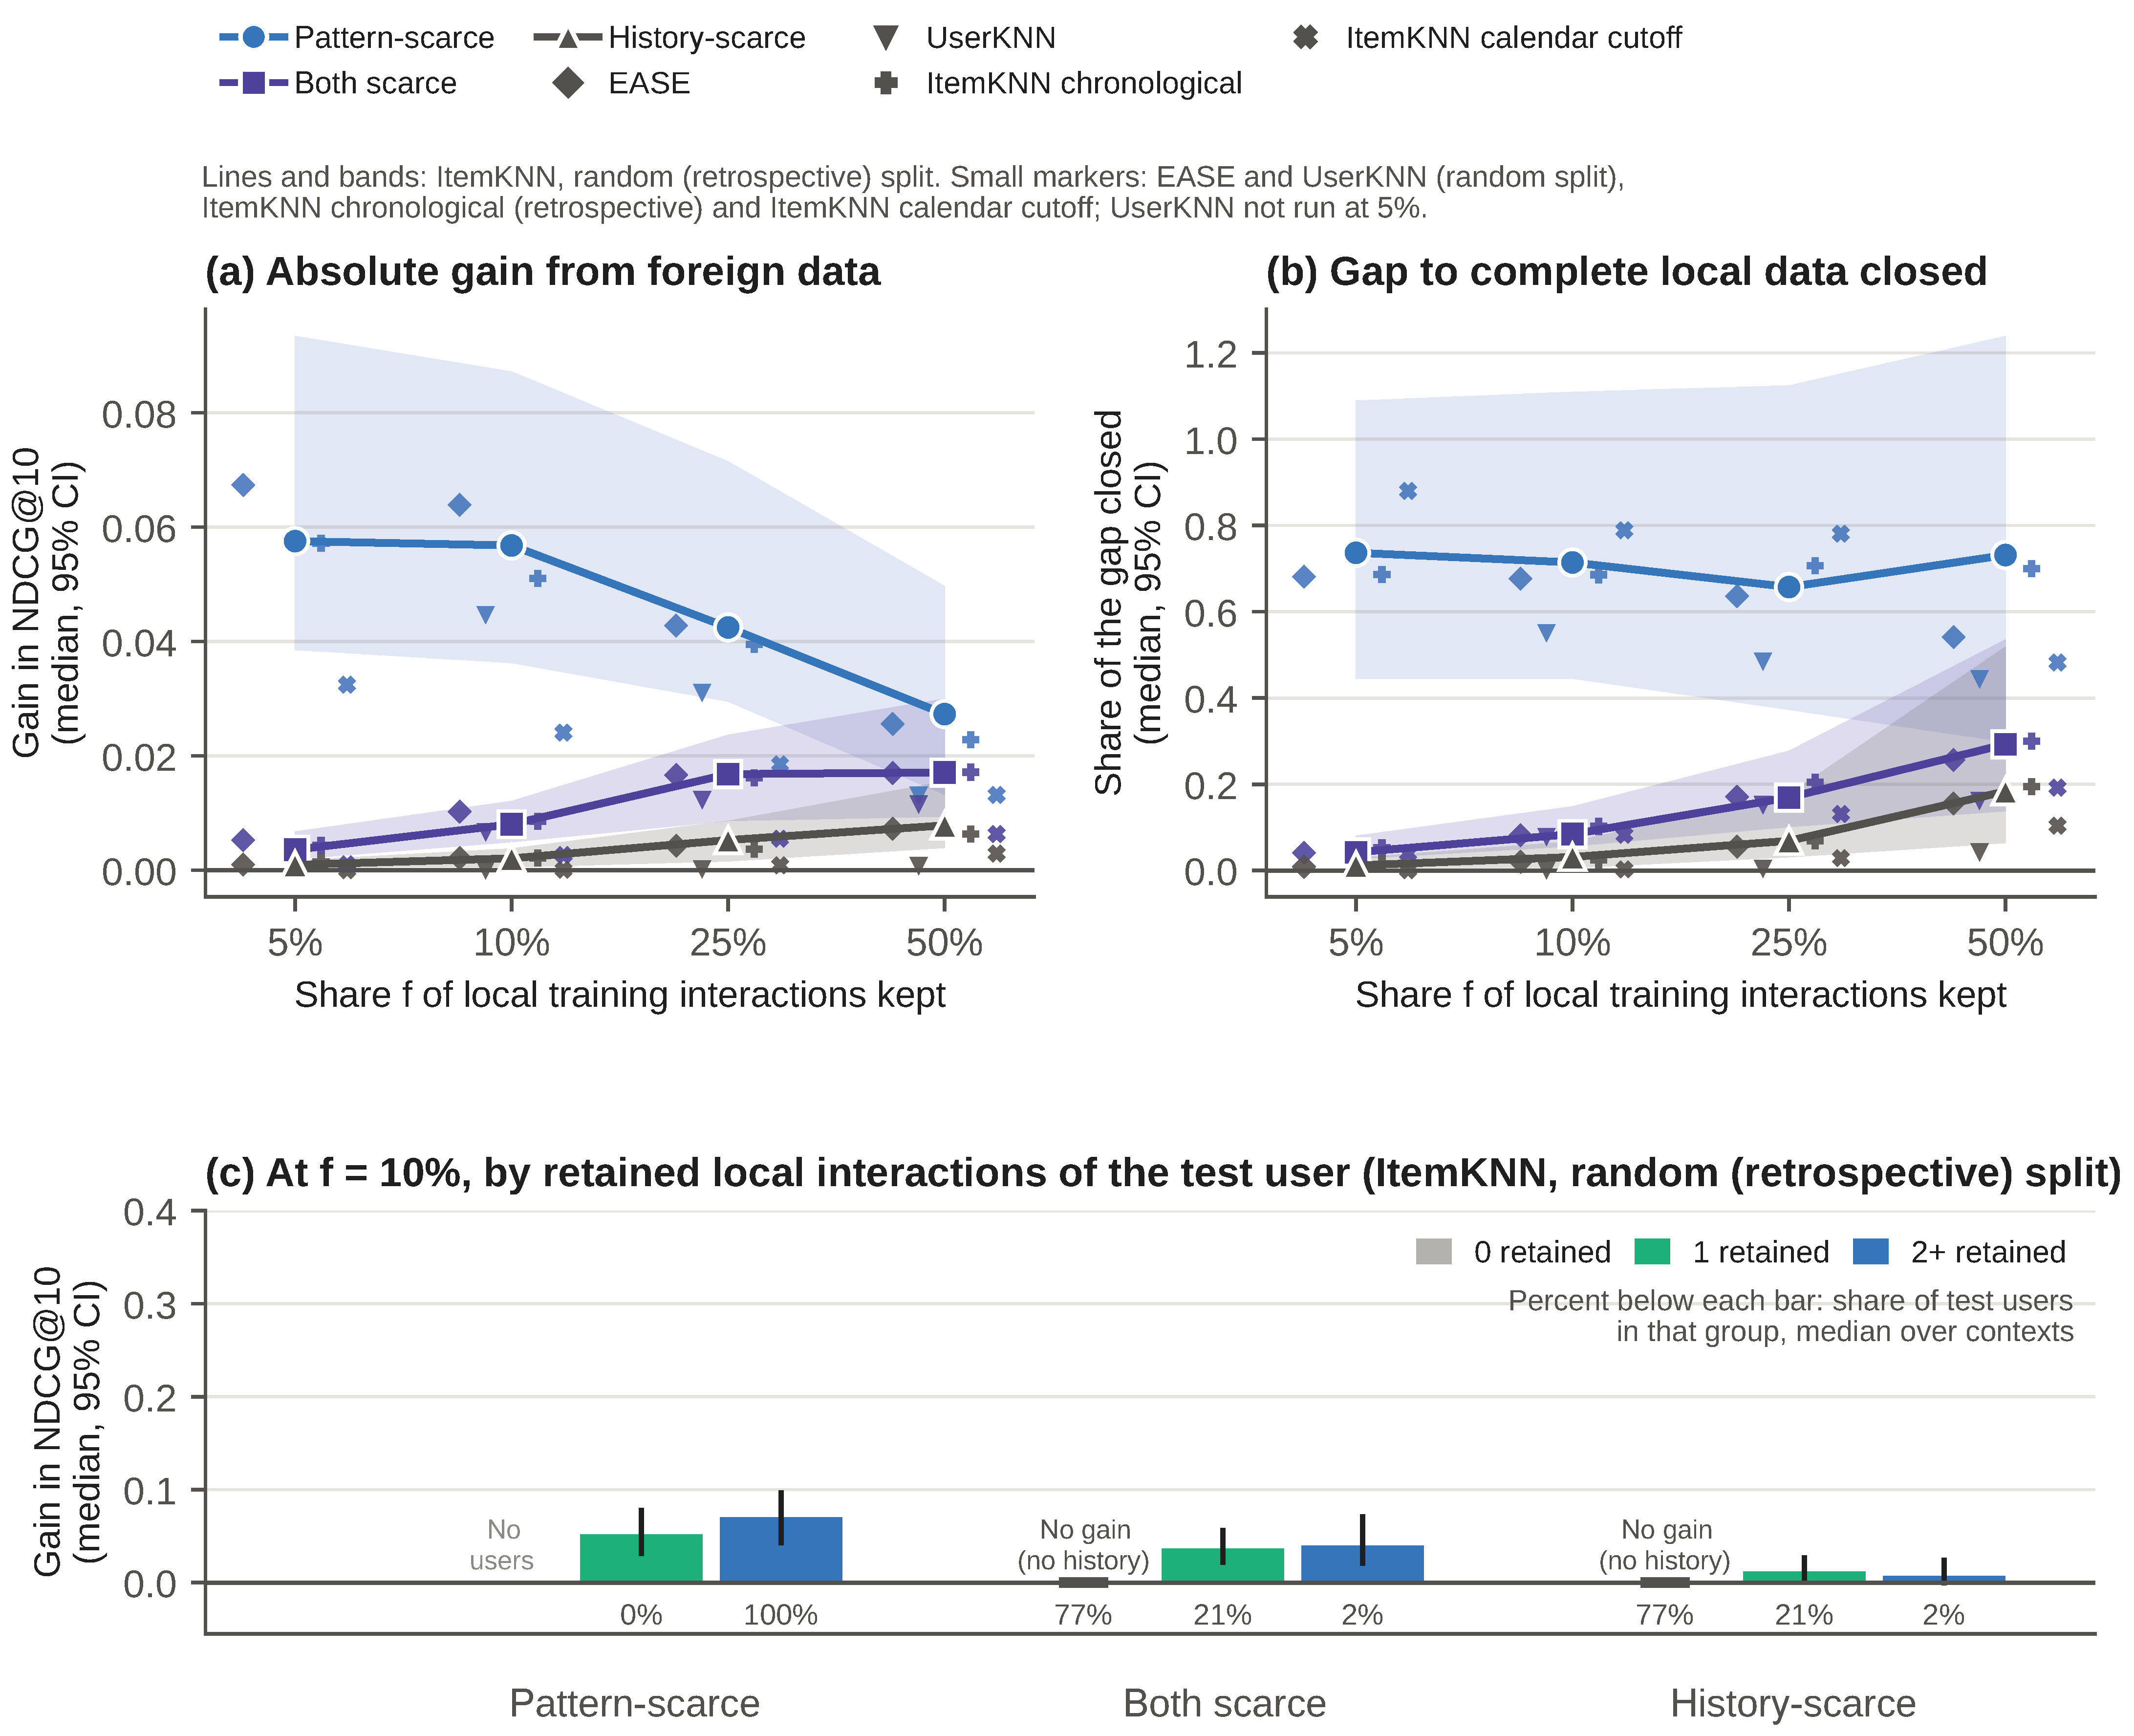
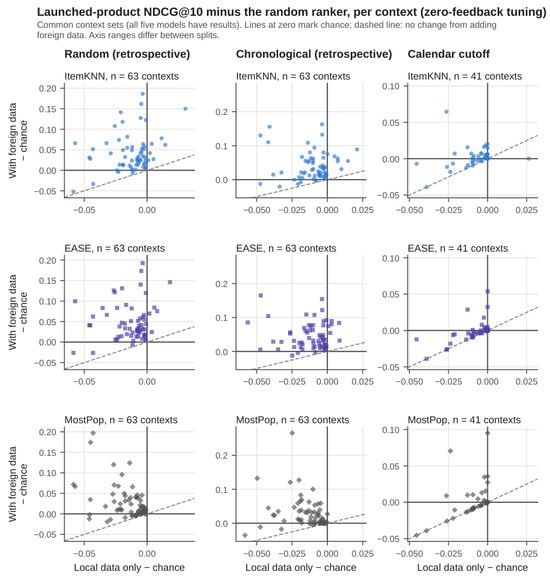
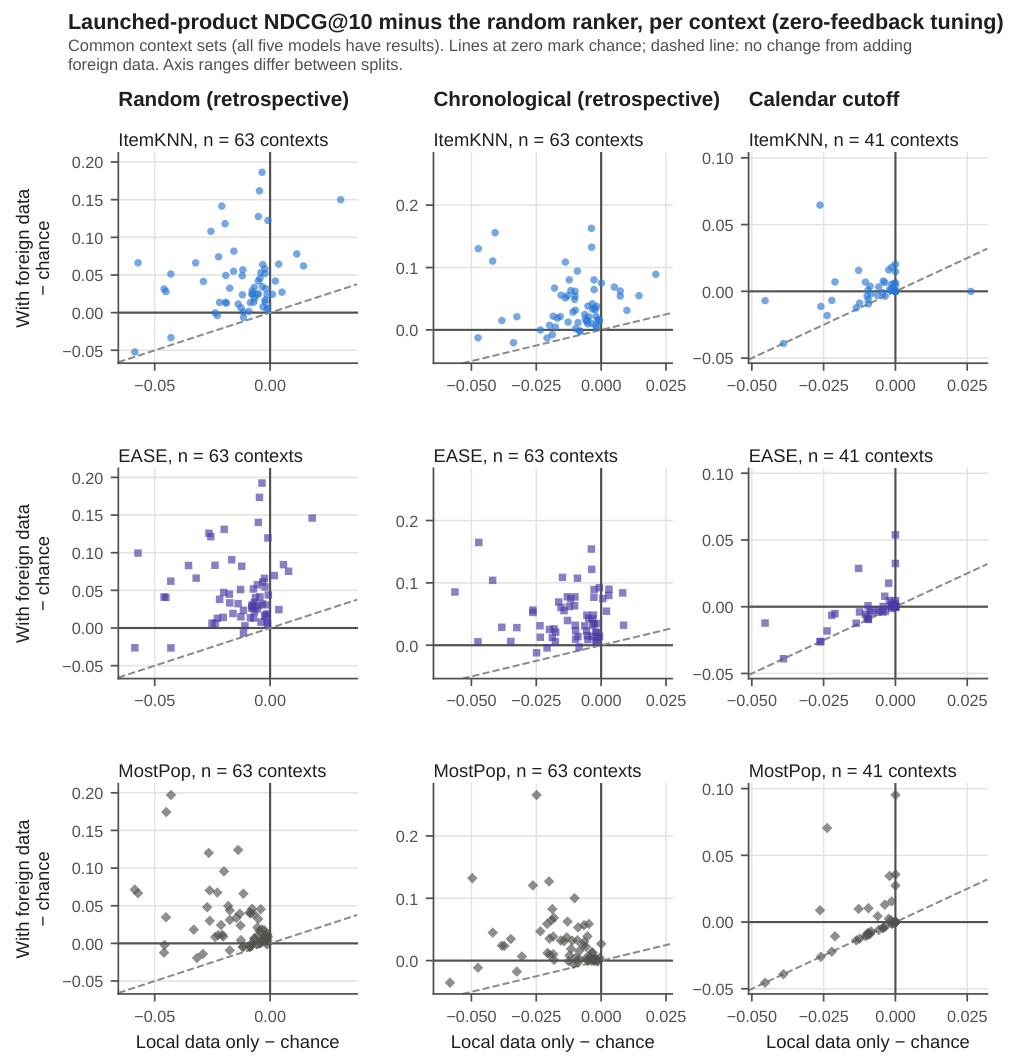

Disclaimer/Publisher’s Note: The statements, opinions and data contained in all publications are solely those of the individual author(s) and contributor(s) and not of MDPI and/or the editor(s). MDPI and/or the editor(s) disclaim responsibility for any injury to people or property resulting from any ideas, methods, instructions or products referred to in the content. |
© 2026 by the author. Licensee MDPI, Basel, Switzerland. This article is an open access article distributed under the terms and conditions of the Creative Commons Attribution (CC BY) license.