Caffeine in the Diet: Country-Level Consumption and Guidelines


Abstract
1. Introduction
2. Material and Methods
2.1. Data Collection Strategy for Dietary Caffeine Guidelines
2.2. Data Resource for Dietary Caffeine Consumption
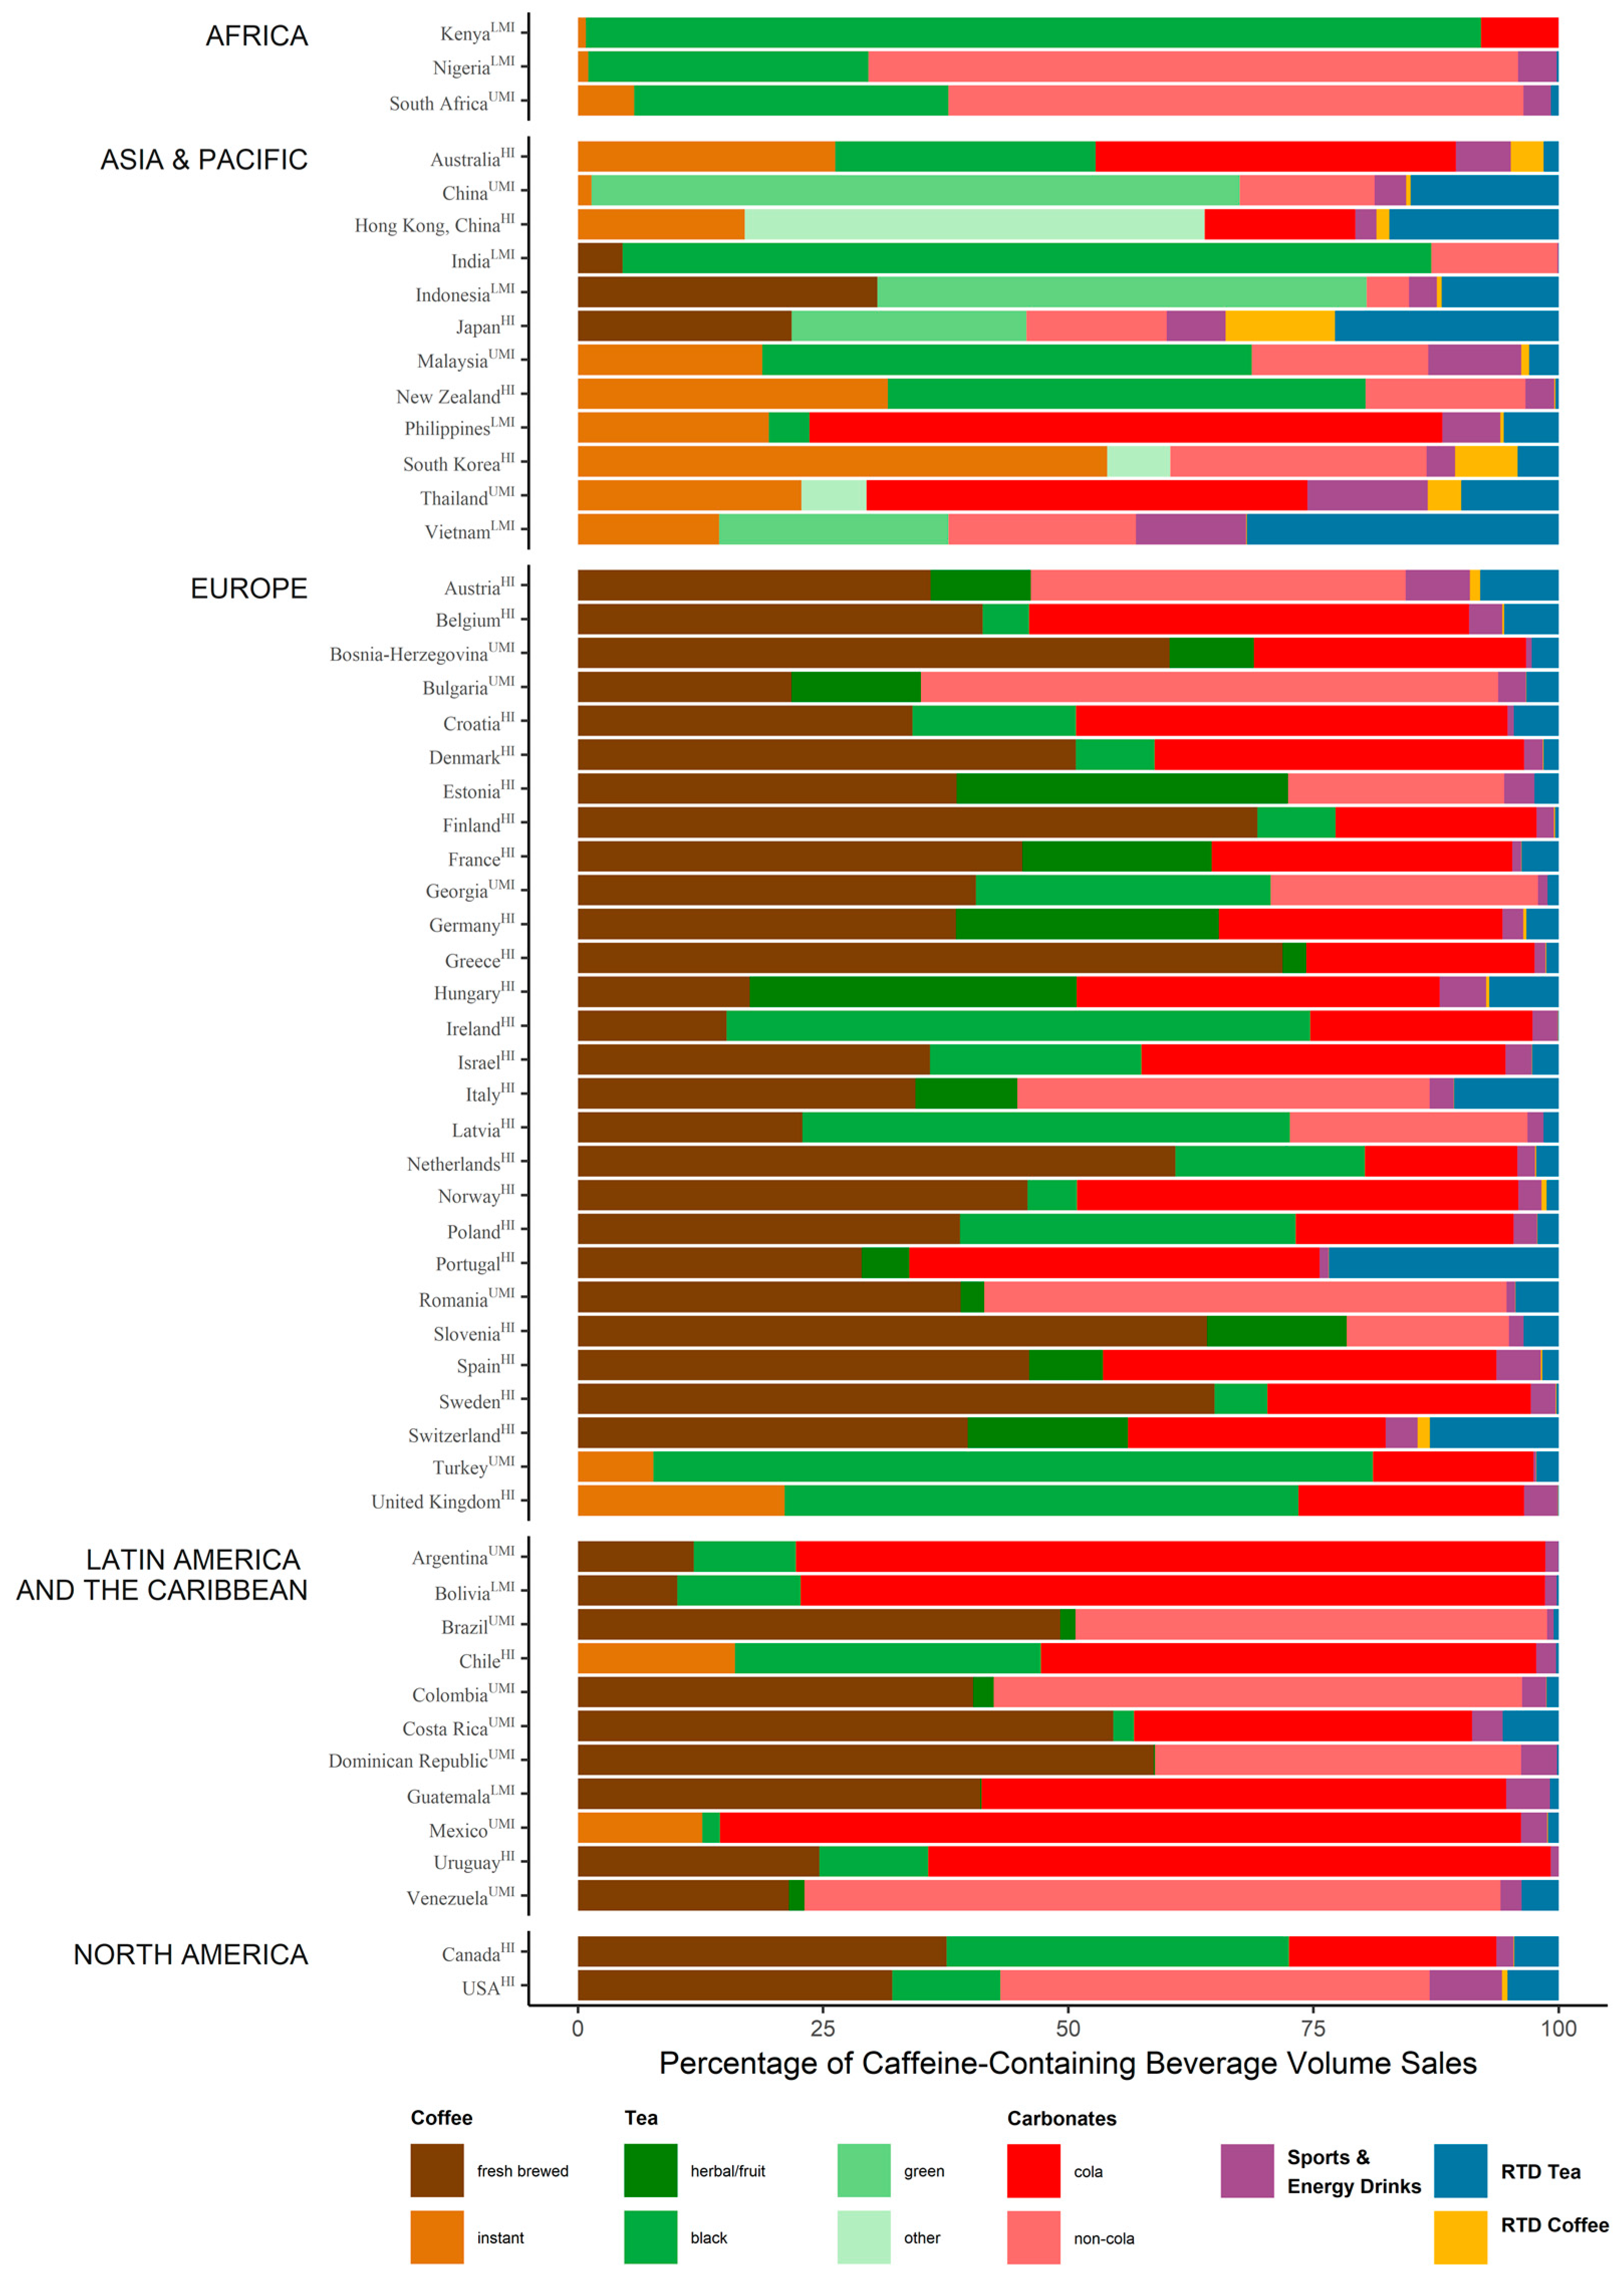
3. Results
3.1. Africa
3.2. Asia and the Pacific
3.3. Near East
3.4. Europe
3.5. Latin America and the Caribbean
3.6. North America
4. Discussion and Conclusions
Supplementary Materials
Author Contributions
Funding
Acknowledgments
Conflicts of Interest
References
- Fredholm, B.B.; Battig, K.; Holmen, J.; Nehlig, A.; Zvartau, E.E. Actions of caffeine in the brain with special reference to factors that contribute to its widespread use. Pharmacol. Rev. 1999, 51, 83–133. [Google Scholar] [PubMed]
- Zucconi, S.; Volpato, C.; Adinolfi, F.; Gandini, E.; Gentile, E.; Loi, A.; Fioriti, L. Gathering consumption data on specific consumer groups of energy drinks. EFSA Support. Publ. 2013, 10, 394E. [Google Scholar] [CrossRef]
- Wikoff, D.; Welsh, B.T.; Henderson, R.; Brorby, G.P.; Britt, J.; Myers, E.; Goldberger, J.; Lieberman, H.R.; O’Brien, C.; Peck, J. Systematic review of the potential adverse effects of caffeine consumption in healthy adults, pregnant women, adolescents, and children. Food Chem. Toxicol. 2017, 109, 585–648. [Google Scholar] [CrossRef] [PubMed]
- Nawrot, P.; Jordan, S.; Eastwood, J.; Rostein, J.; Hugenholtz, A.; Feeley, M. Effects of caffeine on human health. Food Addit. Contam. 2003, 20, 1–30. [Google Scholar] [CrossRef] [PubMed]
- EFSA Panel on Dietetic Products Nutrition and Allergies. Scientific opinion on the safety of caffeine. EFSA J. 2015, 13, 4102. [Google Scholar]
- Poole, R.; Kennedy, O.J.; Roderick, P.; Fallowfield, J.A.; Hayes, P.C.; Parkes, J. Coffee consumption and health: Umbrella review of meta-analyses of multiple health outcomes. BMJ 2017, 359, j5024. [Google Scholar] [CrossRef] [PubMed]
- Higgins, J.P.; Babu, K.; Deuster, P.A.; Shearer, J. Energy drinks: A contemporary issues paper. Curr. Sports Med. Rep. 2018, 17, 65–72. [Google Scholar] [CrossRef] [PubMed]
- Breda, J.J.; Whiting, S.H.; Encarnação, R.; Norberg, S.; Jones, R.; Reinap, M.; Jewell, J. Energy drink consumption in Europe: A review of the risks, adverse health effects, and policy options to respond. Front. Public Health 2014, 2, 134. [Google Scholar] [CrossRef] [PubMed]
- Vuong, Q.V. Epidemiological evidence linking tea consumption to human health: A review. Crit. Rev. Food Sci. Nutr. 2014, 54, 523–536. [Google Scholar] [CrossRef] [PubMed]
- Hayat, K.; Iqbal, H.; Malik, U.; Bilal, U.; Mushtaq, S. Tea and its consumption: Benefits and risks. Crit. Rev. Food Sci. Nutr. 2015, 55, 939–954. [Google Scholar] [CrossRef] [PubMed]
- Ruanpeng, D.; Thongprayoon, C.; Cheungpasitporn, W.; Harindhanavudhi, T. Sugar and artificially sweetened beverages linked to obesity: A systematic review and meta-analysis. QJM Int. J. Med. 2017, 110, 513–520. [Google Scholar] [CrossRef] [PubMed]
- Heck, C.I.; de Mejia, E.G. Yerba mate tea (ilex paraguariensis): A comprehensive review on chemistry, health implications, and technological considerations. J. Food Sci. 2007, 72, R138–R151. [Google Scholar] [CrossRef] [PubMed]
- Spiller, M.A. The chemical components of coffee. In Caffeine; Spiller, G.A., Ed.; CRC: Boca Raton, FL, USA, 1998; pp. 97–161. [Google Scholar]
- Mitchell, D.C.; Hockenberry, J.; Teplansky, R.; Hartman, T.J. Assessing dietary exposure to caffeine from beverages in the US population using brand-specific versus category-specific caffeine values. Food Chem. Toxicol. 2015, 80, 247–252. [Google Scholar] [CrossRef] [PubMed]
- Da Silveira, T.F.F.; Meinhart, A.D.; de Souza, T.C.L.; Cunha, E.C.E.; de Moraes, M.R.; Godoy, H.T. Chlorogenic acids and flavonoid extraction during the preparation of yerba mate based beverages. Food Res. Int. 2017, 102, 348–354. [Google Scholar] [CrossRef] [PubMed]
- McLellan, T.M.; Lieberman, H.R. Do energy drinks contain active components other than caffeine? Nutr. Rev. 2012, 70, 730–744. [Google Scholar] [CrossRef] [PubMed]
- Food and Agriculture Organization of the United Nations. Food-Based Dietary Guidelines. Available online: http://www.fao.org/nutrition/education/food-dietary-guidelines/background/en/ (accessed on 1 August 2018).
- Mitchell, D.C.; Knight, C.A.; Hockenberry, J.; Teplansky, R.; Hartman, T.J. Beverage caffeine intakes in the US. Food Chem. Toxicol. 2013, 63, 136–142. [Google Scholar] [CrossRef] [PubMed]
- World Bank. World Bank Country and Lending Groups: Country Classification 2017. Available online: https://datahelpdesk.worldbank.org/knowledgebase/articles/906519 (accessed on 1 September 2018).
- Hawkes, C.; Jewell, J.; Allen, K. A food policy package for healthy diets and the prevention of obesity and diet-related non-communicable diseases: The nourishing framework. Obes. Rev. 2013, 14, 159–168. [Google Scholar] [CrossRef] [PubMed]
- WCRF International Nourishing Framework. Available online: https://www.wcrf.org/int/policy/nourishing-database (accessed on 1 October 2018).
- Euromonitor Euromonitor International. Available online: https://www.euromonitor.com/ (accessed on 1 September 2018).
- Matijasevich, A.; Barros, F.C.; Santos, I.S.; Yemini, A. Maternal caffeine consumption and fetal death: A case–control study in Uruguay. Paediatr. Perinat. Epidemiol. 2006, 20, 100–109. [Google Scholar] [CrossRef] [PubMed]
- Ronco, A.L.; Stefani, E.; Mendoza, B.; Deneo-Pellegrini, H.; Vazquez, A.; Abbona, E. Mate intake and risk of breast cancer in Uruguay: A case-control study. Asian Pac. J. Cancer Prev. 2016, 17, 1453–1461. [Google Scholar] [CrossRef] [PubMed]
- Millen, B.; Lichtenstein, A.; Abrams, S. Scientific Report of the 2015 Dietary Guidelines Advisory Committee; US Department of Agriculture: Washington, DC, USA, 2015.
- Petracco, M. Technology 4: Beverage preparation: Brewing trends for the new millennium. In COFFEE Recent Developments; Blackwell Science Ltd.: London, UK, 2001. [Google Scholar]
- Panagiotakos, D.B.; Lionis, C.; Zeimbekis, A.; Makri, K.; Bountziouka, V.; Economou, M.; Vlachou, I.; Micheli, M.; Tsakountakis, N.; Metallinos, G.; et al. Long-term, moderate coffee consumption is associated with lower prevalence of diabetes mellitus among elderly non-tea drinkers from the Mediterranean islands (Medis study). Rev. Diabet. Stud. 2007, 4, 105–111. [Google Scholar] [CrossRef] [PubMed]
- Lopez-Garcia, E.; Guallar-Castillon, P.; Leon-Munoz, L.; Graciani, A.; Rodriguez-Artalejo, F. Coffee consumption and health-related quality of life. Clin. Nutr. 2014, 33, 143–149. [Google Scholar] [CrossRef] [PubMed]
- Sanchez, J.M. Methylxanthine content in commonly consumed foods in Spain and determination of its intake during consumption. Foods 2017, 6, 109. [Google Scholar] [CrossRef] [PubMed]
- D’Amicis, A.; Scaccini, C.; Tomassi, G.; Anaclerio, M.; Stornelli, R.; Bernini, A. Italian style brewed coffee: Effect on serum cholesterol in young men. Int. J. Epidemiol. 1996, 25, 513–520. [Google Scholar] [CrossRef] [PubMed]
- Ferraroni, M.; Tavani, A.; Decarli, A.; Franceschi, S.; Parpinel, M.; Negri, E.; La Vecchia, C. Reproducibility and validity of coffee and tea consumption in Italy. Eur. J. Clin. Nutr. 2004, 58, 674. [Google Scholar] [CrossRef] [PubMed]
- Leurs, L.J.; Schouten, L.J.; Goldbohm, R.A.; van den Brandt, P.A. Total fluid and specific beverage intake and mortality due to IHD and stroke in The Netherlands Cohort study. Br. J. Nutr. 2010, 104, 1212–1221. [Google Scholar] [CrossRef] [PubMed]
- Gavrilyuk, O.; Braaten, T.; Skeie, G.; Weiderpass, E.; Dumeaux, V.; Lund, E. High coffee consumption and different brewing methods in relation to postmenopausal endometrial cancer risk in the Norwegian women and cancer study: A population-based prospective study. BMC Women’s Health 2014, 14, 48. [Google Scholar] [CrossRef] [PubMed]
- Lof, M.; Sandin, S.; Yin, L.; Adami, H.O.; Weiderpass, E. Prospective study of coffee consumption and all-cause, cancer, and cardiovascular mortality in Swedish women. Eur. J. Epidemiol. 2015, 30, 1027–1034. [Google Scholar] [CrossRef] [PubMed]
- Sousa, A.G.; da Costa, T.H. Usual coffee intake in Brazil: Results from the national dietary survey 2008–9. Br. J. Nutr. 2015, 113, 1615–1620. [Google Scholar] [CrossRef] [PubMed]
- Miranda, A.M.; Steluti, J.; Goulart, A.C.; Bensenor, I.M.; Lotufo, P.A.; Marchioni, D.M. Coffee consumption and coronary artery calcium score: Cross-sectional results of Elsa-Brasil (Brazilian longitudinal study of adult health). J. Am. Heart Assoc. 2018, 7, e007155. [Google Scholar] [CrossRef] [PubMed]
- Bezerra, I.N.; Goldman, J.; Rhodes, D.G.; Hoy, M.K.; Moura Souza, A.; Chester, D.N.; Martin, C.L.; Sebastian, R.S.; Ahuja, J.K.; Sichieri, R.; et al. Difference in adult food group intake by sex and age groups comparing Brazil and United States nationwide surveys. Nutr. J. 2014, 13, 74. [Google Scholar] [CrossRef] [PubMed]
- Beresniak, A.; Duru, G.; Berger, G.; Bremond-Gignac, D. Relationships between black tea consumption and key health indicators in the world: An ecological study. BMJ Open 2012, 2, e000648. [Google Scholar] [CrossRef] [PubMed]
- Grigg, D. The worlds of tea and coffee: Patterns of consumption. GeoJournal 2002, 57, 283–294. [Google Scholar] [CrossRef]
- Astill, C.; Birch, M.R.; Dacombe, C.; Humphrey, P.G.; Martin, P.T. Factors affecting the caffeine and polyphenol contents of black and green tea infusions. J. Agric. Food Chem. 2001, 49, 5340–5347. [Google Scholar] [CrossRef] [PubMed]
- Derossi, A.; Ricci, I.; Caporizzi, R.; Fiore, A.; Severini, C. How grinding level and brewing method (Espresso, American, Turkish) could affect the antioxidant activity and bioactive compounds in a coffee cup. J. Sci. Food Agric. 2018, 98, 3198–3207. [Google Scholar] [CrossRef] [PubMed]
- Paulsen, M.M.; Myhre, J.B.; Andersen, L.F. Beverage consumption patterns among Norwegian adults. Nutrients 2016, 8, 561. [Google Scholar] [CrossRef] [PubMed]
- Pereira, R.A.; Souza, A.M.; Duffey, K.J.; Sichieri, R.; Popkin, B.M. Beverage consumption in Brazil: Results from the first national dietary survey. Public Health Nutr. 2015, 18, 1164–1172. [Google Scholar] [CrossRef] [PubMed]
- Landais, E.; Moskal, A.; Mullee, A.; Nicolas, G.; Gunter, M.J.; Huybrechts, I.; Overvad, K.; Roswall, N.; Affret, A.; Fagherazzi, G. Coffee and tea consumption and the contribution of their added ingredients to total energy and nutrient intakes in 10 European countries: Benchmark data from the late 1990s. Nutrients 2018, 10, 725. [Google Scholar] [CrossRef] [PubMed]
- Yamada, H.; Kawado, M.; Aoyama, N.; Hashimoto, S.; Suzuki, K.; Wakai, K.; Suzuki, S.; Watanabe, Y.; Tamakoshi, A. Coffee consumption and risk of colorectal cancer: The Japan collaborative cohort study. J. Epidemiol. 2014, 24, 370–378. [Google Scholar] [CrossRef] [PubMed]
- Mesirow, M.S.; Welsh, J.A. Changing beverage consumption patterns have resulted in fewer liquid calories in the diets of US children: National health and nutrition examination survey 2001–2010. J. Acad. Nutr. Diet. 2015, 115, 559–566.e4. [Google Scholar] [CrossRef] [PubMed]
- Storey, M.L.; Forshee, R.A.; Anderson, P.A. Beverage consumption in the US population. J. Am. Diet. Assoc. 2006, 106, 1992–2000. [Google Scholar] [CrossRef] [PubMed]
- Loftfield, E.; Freedman, N.D.; Dodd, K.W.; Vogtmann, E.; Xiao, Q.; Sinha, R.; Graubard, B.I. Coffee drinking is widespread in the United States, but usual intake varies by key demographic and lifestyle factors-3. J. Nutr. 2016, 146, 1762–1768. [Google Scholar] [CrossRef] [PubMed]
- Rybak, M.E.; Sternberg, M.R.; Pao, C.-I.; Ahluwalia, N.; Pfeiffer, C.M. Urine excretion of caffeine and select caffeine metabolites is common in the US population and associated with caffeine intake-4. J. Nutr. 2015, 145, 766–774. [Google Scholar] [CrossRef] [PubMed]
- Nergiz-Unal, R.; Akal Yildiz, E.; Samur, G.; Besler, H.T.; Rakicioglu, N. Trends in fluid consumption and beverage choices among adults reveal preferences for Ayran and black tea in central Turkey. Nutr. Diet. 2017, 74, 74–81. [Google Scholar] [CrossRef] [PubMed]
- Pena, A.; Lino, C.; Silveira, M.I. Survey of caffeine levels in retail beverages in Portugal. Food Addit. Contam. 2005, 22, 91–96. [Google Scholar] [CrossRef] [PubMed]
- Martins, A.; Ferreira, C.; Sousa, D.; Costa, S. Consumption patterns of energy drinks in Portuguese adolescents from a city in northern Portugal. Acta Med. Port. 2018, 31, 207–212. [Google Scholar] [CrossRef] [PubMed]
- Andrade, J.; Andrade, J. Food-Based Dietary Guidelines: An Overview. Washington: Integrating Gender and Nutrition within Agricultural Extension Services and USAID, 2016. Available online: https://www.agrilinks.org/sites/default/files/resource/files/ING%20TN%20(2016_10%20)%20Food%20Based%20Dietary%20Guideline%20-%20Overview%20(Andrade,%20Andrade).pdf (accessed on 1 August 2018).
- World Health Organization. Regional Consultation on Food-Based Dietary Guidelines for Countries in the South-East Asia Region, 6–9 December 2010, New Delhi, India; World Health Organization: New Delhi, India, 2010. [Google Scholar]
- Bangladesh Institue of Research and Rehabilitation in Diabetes, Endocrine and Metabolic Disorders. Dietary Guidelines for Bangladesh; Bangladesh Institue of Research and Rehabilitation in Diabetes, Endocrine and Metabolic Disorders: Dhaka, Bangladesh, 2013. [Google Scholar]
- Nutrition Division Federaal Ministry of Health; World Health Organization. Food-Based Dietary Guideline for Nigeria; Federal Ministry of Health: Abuja, Nigeria, 2006.
- Vorster, H.H.; Badham, J.; Venter, C. An introduction to the revised food-based dietary guidelines for South Africa. S. Afr. J. Clin. Nutr. 2013, 26, S5–S12. [Google Scholar]
- German Ministry of Food Agriculture and Consumer Protection; Food and Agriculture Organization of the United Nations. Sierra Leone Food Based Dietary Guideline for Healthy Eating. 2016. Available online: https://afro.who.int/publications/sierra-leone-food-based-dietary-guidelines-healthy-eating-2016 (accessed on 1 August 2018).
- Harika, R.; Faber, M.; Samuel, F.; Kimiywe, J.; Mulugeta, A.; Eilander, A. Micronutrient status and dietary intake of iron, vitamin a, iodine, folate and zinc in women of reproductive age and pregnant women in Ethiopia, Kenya, Nigeria and South Africa: A systematic review of data from 2005 to 2015. Nutrients 2017, 9, 1096. [Google Scholar] [CrossRef] [PubMed]
- National Institute of Nutrition. Dietary Guidelines for Indians; National Institute of Nutrition: Hyderabad, India, 2011. [Google Scholar]
- Goshtaei, M.; Ravaghi, H.; Sari, A.A.; Abdollahi, Z. Nutrition policy process challenges in Iran. Electron. Phys. 2016, 8, 1865. [Google Scholar] [CrossRef] [PubMed]
- Hwalla, N.; Nasreddine, L.; Farhat Jarrar, S. The Food-Based Dietary Guideline Manual for Promoting Healthy Eating in the Lebanese Adult Population. The Faculty of Agricultural and Food Sciences, American University of Beirut, Lebanese National Council for Scientific Research (CNRS), Ministry of Public Health, 2013. Available online: www.aub.edu.lb/fafs/nfsc/Documents/LR-e-FBDG-EN-III.pdf (accessed on 14 July 2015).
- Fonseca, V.M. Aspects of the Brazilian nutritional situation. Cienc. Saude Colet. 2014, 19, 1328–1329. [Google Scholar]
- Ministry of Health of Brazil. Dietary Guidelines for the Brazilian Population; Ministry of Health of Brazil: Brasília, Brazil, 2015.
- Vorster, H.H.; Kruger, A.; Margetts, B.M. The nutrition transition in Africa: Can it be steered into a more positive direction? Nutrients 2011, 3, 429–441. [Google Scholar] [CrossRef] [PubMed]
- National Health and Medical Research Council. Australian Dietary Guidelines Summary; National Health and Medical Research Council: Canberra, Australia, 2013.
- Kromhout, D.; Spaaij, C.; De Goede, J.; Weggemans, R. The 2015 Dutch food-based dietary guidelines. Eur. J. Clin. Nutr. 2016, 70, 869. [Google Scholar] [CrossRef] [PubMed]
- Nwankwo, B.O.; Brieger, W.R. Exclusive breastfeeding is undermined by use of other liquids in rural Southwestern Nigeria. J. Trop. Pediatr. 2002, 48, 109–112. [Google Scholar] [CrossRef] [PubMed]
- Tympa-Psirropoulou, E.; Vagenas, C.; Psirropoulos, D.; Dafni, O.; Matala, A.; Skopouli, F. Nutritional risk factors for iron-deficiency Anaemia in children 12–24 months old in the area of Thessalia in Greece. Int. J. Food Sci. Nutr. 2005, 56, 1–12. [Google Scholar] [CrossRef] [PubMed]
- Urkin, J.; Adam, D.; Weitzman, D.; Gazala, E.; Chamni, S.; Kapelushnik, J. Indices of iron deficiency and Anaemia in Bedouin and Jewish toddlers in southern Israel. Acta Paediatr. 2007, 96, 857–860. [Google Scholar] [CrossRef] [PubMed]
- González-Castell, D.; González de Cosío, T.; Rodríguez-Ramírez, S.; Escobar-Zaragoza, L. Early consumption of liquids different to breast milk in Mexican infants under 1 year: Results of the probabilistic national health and nutrition survey 2012. Nutr. Hosp. 2016, 33, 9. [Google Scholar] [PubMed]
- Mennella, J.A.; Turnbull, B.; Ziegler, P.J.; Martinez, H. Infant feeding practices and early flavor experiences in Mexican infants: An intra-cultural study. J. Am. Diet. Assoc. 2005, 105, 908–915. [Google Scholar] [CrossRef] [PubMed]
- Rachidi, S.; Awada, S.; Al-Hajje, A.; Bawab, W.; Zein, S.; Saleh, N.; Salameh, P. Risky substance exposure during pregnancy: A pilot study from Lebanese mothers. Drug Healthc. Patient Saf. 2013, 5, 123. [Google Scholar] [PubMed]
- Bailey, H.D.; Lacour, B.; Guerrini-Rousseau, L.; Bertozzi, A.-I.; Leblond, P.; Faure-Conter, C.; Pellier, I.; Freycon, C.; Doz, F.; Puget, S. Parental smoking, maternal alcohol, coffee and tea consumption and the risk of childhood brain tumours: The ESTELLE and ESCALE studies (SFCE, France). Cancer Causes Control 2017, 28, 719–732. [Google Scholar] [CrossRef] [PubMed]
- Da Mota Santana, J.; Alves de Oliveira Queiroz, V.; Monteiro Brito, S.; Barbosa Dos Santos, D.; Marlucia Oliveira Assis, A. Food consumption patterns during pregnancy: A longitudinal study in a region of the north east of Brazil. Nutr. Hosp. 2015, 32, 130–138. [Google Scholar] [PubMed]
- Tollånes, M.C.; Strandberg-Larsen, K.; Eichelberger, K.Y.; Moster, D.; Lie, R.T.; Brantsæter, A.L.; Meltzer, H.M.; Stoltenberg, C.; Wilcox, A.J. Intake of caffeinated soft drinks before and during pregnancy, but not total caffeine intake, is associated with increased cerebral palsy risk in the Norwegian mother and child cohort study–3. J. Nutr. 2016, 146, 1701–1706. [Google Scholar] [CrossRef] [PubMed]
- Peacock, A.; Hutchinson, D.; Wilson, J.; McCormack, C.; Bruno, R.; Olsson, C.A.; Allsop, S.; Elliott, E.; Burns, L.; Mattick, R.P. Adherence to the caffeine intake guideline during pregnancy and birth outcomes: A prospective cohort study. Nutrients 2018, 10, 319. [Google Scholar] [CrossRef] [PubMed]
- Rosenfeld, L.S.; Mihalov, J.J.; Carlson, S.J.; Mattia, A. Regulatory status of caffeine in the United States. Nutr. Rev. 2014, 72, 23–33. [Google Scholar] [CrossRef] [PubMed]
- Guelinckx, I.; Ferreira-Pêgo, C.; Moreno, L.A.; Kavouras, S.A.; Gandy, J.; Martinez, H.; Bardosono, S.; Abdollahi, M.; Nasseri, E.; Jarosz, A. Intake of water and different beverages in adults across 13 countries. Eur. J. Nutr. 2015, 54, 45–55. [Google Scholar] [CrossRef] [PubMed]
- Özen, A.; Bibiloni, M.D.M.; Pons, A.; Tur, J. Fluid intake from beverages across age groups: A systematic review. J. Hum. Nutr. Diet. 2015, 28, 417–442. [Google Scholar] [CrossRef] [PubMed]
- Platania, A.; Castiglione, D.; Sinatra, D.; Urso, M.D.; Marranzano, M. Fluid intake and beverage consumption description and their association with dietary vitamins and antioxidant compounds in Italian adults from the Mediterranean healthy eating, aging and lifestyles (meal) study. Antioxidants 2018, 7, 56. [Google Scholar] [CrossRef] [PubMed]
- De Stefani, E.; Boffetta, P.; Ronco, A.L.; Deneo-Pellegrini, H.; Acosta, G.; Mendilaharsu, M. Dietary patterns and risk of bladder cancer: A factor analysis in Uruguay. Cancer Causes Control 2008, 19, 1243. [Google Scholar] [CrossRef] [PubMed]
- Ahmad Fuzi, S.F.; Koller, D.; Bruggraber, S.; Pereira, D.I.; Dainty, J.R.; Mushtaq, S. A 1-h time interval between a meal containing iron and consumption of tea attenuates the inhibitory effects on iron absorption: A controlled trial in a cohort of healthy UK women using a stable iron isotope. Am. J. Clin. Nutr. 2017, 106, 1413–1421. [Google Scholar] [CrossRef] [PubMed]
- Hurrell, R.F.; Reddy, M.; Cook, J.D. Inhibition of non-haem iron absorption in man by polyphenolic-containing beverages. Br. J. Nutr. 1999, 81, 289–295. [Google Scholar] [PubMed]
- Thankachan, P.; Walczyk, T.; Muthayya, S.; Kurpad, A.V.; Hurrell, R.F. Iron absorption in young Indian women: The interaction of iron status with the influence of tea and ascorbic acid. Am. J. Clin. Nutr. 2008, 87, 881–886. [Google Scholar] [CrossRef] [PubMed]
- Nelson, M.; Poulter, J. Impact of tea drinking on iron status in the UK: A review. J. Hum. Nutr. Diet. 2004, 17, 43–54. [Google Scholar] [CrossRef] [PubMed]
- Savolainen, H. Tannin content of tea and coffee. J. Appl. Toxicol. 1992, 12, 191–192. [Google Scholar] [CrossRef] [PubMed]
- Hu, F.B.; Malik, V.S. Sugar-sweetened beverages and risk of obesity and type 2 diabetes: Epidemiologic evidence. Physiol. Behav. 2010, 100, 47–54. [Google Scholar] [CrossRef] [PubMed]
- International Coffee Organization. Coffee in China; International Coffee Organization: Milan, Italy, 2014. [Google Scholar]
- Amarra, M.S.V.; Khor, G.L.; Chan, P. Intake of added sugar in Malaysia: A review. Asia Pac. J. Clin. Nutr. 2016, 25, 227–240. [Google Scholar] [PubMed]
- Saw, W.; Shanita, S.N.; Zahara, B.; Tuti, N.; Poh, B.K. Dietary intake assessment in adults and its association with weight status and dental caries. Pak. J. Nutr. 2012, 11, 1066. [Google Scholar]
- Je, Y.; Jeong, S.; Park, T. Coffee consumption patterns in Korean adults: The Korean national health and nutrition examination survey (2001–2011). Asia Pac. J. Clin. Nutr. 2014, 23, 691–702. [Google Scholar] [PubMed]
- Guallar-Castillon, P.; Munoz-Pareja, M.; Aguilera, M.T.; Leon-Munoz, L.M.; Rodriguez-Artalejo, F. Food sources of sodium, saturated fat and added sugar in the Spanish hypertensive and diabetic population. Atherosclerosis 2013, 229, 198–205. [Google Scholar] [CrossRef] [PubMed]
- Gunes, A.; Dahl, M.L. Variation in cyp1a2 activity and its clinical implications: Influence of environmental factors and genetic polymorphisms. Pharmacogenomics 2008, 9, 625–637. [Google Scholar] [CrossRef] [PubMed]
- Cornelis, M.C.; Kacprowski, T.; Menni, C.; Gustafsson, S.; Pivin, E.; Adamski, J.; Artati, A.; Eap, C.B.; Ehret, G.; Friedrich, N. Genome-wide association study of caffeine metabolites provides new insights to caffeine metabolism and dietary caffeine-consumption behavior. Hum. Mol. Genet. 2016, 25, 5472–5482. [Google Scholar] [CrossRef] [PubMed]
- Food Standards Australia New Zealand. Australia New Zealand Food Standards Code Standard 2.6.4 Formulated Caffeinated Beverages; Food Standards Australia New Zealand: Kingston, Australia, 2014.
- Thomson, B.; Schiess, S. Risk profile: Caffeine in Energy Drinks and Energy Shots. Institute of Environmental Science & Research Limited, April 2010. Available online: https://www.foodsafety.govt.nz/elibrary/industry/Risk_Profile_Caffeine-Science_Research.pdf (accessed on 1 September 2018).
- Higgins, J.P.; Tuttle, T.D.; Higgins, C.L. Energy beverages: Content and safety. Mayo Clin. Proc. 2010, 85, 1033–1041. [Google Scholar] [CrossRef] [PubMed]
- Hungarian National Institute for Health Development (NIHD). Impact Assessment of the Public Health Product Tax; NIHD: Budapest, Hungary, 2013. [Google Scholar]
- Australian Food News. Lithuania Ban on Energy Drink Sales to under 18s Comes in with Broader Restrictions and Warnings. Available online: http://www.ausfoodnews.com.au/2014/11/05/lithuania-ban-on-energy-drink-sales-to-under-18s-comes-in-with-broader-restrictions-and-warnings.html (accessed on 1 September 2018).
- Food and Drug Administration US Department of Health and Human Services. Update on Caffeinated Alcoholic Beverages; US Food and Drug Administration: Silver Spring, MD, USA, 2010.
- Attwood, A.S. Caffeinated alcohol beverages: A public health concern. Alcohol Alcohol. 2012, 47, 370–371. [Google Scholar] [CrossRef] [PubMed]
- Popkin, B.M.; Hawkes, C. Sweetening of the global diet, particularly beverages: Patterns, trends, and policy responses. Lancet Diabetes Endocrinol. 2016, 4, 174–186. [Google Scholar] [CrossRef]
- Caro, J.C.; Smith-Taillie, L.; Ng, S.W.; Popkin, B. Designing a food tax to impact food-related non-communicable diseases: The case of Chile. Food Policy 2017, 71, 86–100. [Google Scholar] [CrossRef] [PubMed]
- Lachenmeier, D.W.; Winkler, G. Caffeine content labeling: A prudent public health policy? J. Caffeine Res. 2013, 3, 154–155. [Google Scholar] [CrossRef]
- Kole, J.; Barnhill, A. Caffeine content labeling: A missed opportunity for promoting personal and public health. J. Caffeine Res. 2013, 3, 108–113. [Google Scholar] [CrossRef] [PubMed]
- Stuckler, D.; McKee, M.; Ebrahim, S.; Basu, S. Manufacturing epidemics: The role of global producers in increased consumption of unhealthy commodities including processed foods, alcohol, and tobacco. PLoS Med. 2012, 9, e1001235. [Google Scholar] [CrossRef] [PubMed]
- Pomerleau, J.; Lock, K.; McKee, M. Discrepancies between ecological and individual data on fruit and vegetable consumption in fifteen countries. Br. J. Nutr. 2003, 89, 827–834. [Google Scholar] [CrossRef] [PubMed]


| Country Publication Date | FAO key Messages and Published Guidelines [Other Resources and Personal Communication] |
|---|---|
| AFRICA | |
| Benin LI 2015 | Drink carbonated drinks and sugar-sweetened beverages in moderation. These kinds of drinks only provide sugar and can promote obesity and diabetes. |
| Nigeria LMI 2001 | Adults, elderly, pregnant, breast-feeding: Avoid coffee and tea during meals since these beverages hinder iron absorption. Diabetics: avoid coffee if hypertensive. |
| Seychelles HI 2006 | Consume sugar, sugary foods, and sugary drinks in minimal amounts. |
| Sierra Leone LI 2016 | Use sugars and foods and drinks made with sugar in moderation. Limit intake of beverages such as coffee and alcohol. Taken in excess, these will contribute to too much phosphorous, which depletes calcium levels. |
| South Africa UMI 2012 | Use sugar and foods and drinks high in sugar sparingly. Avoid giving tea, coffee, and sugary drinks and high-sugar, high-fat salty snacks to baby/child (6–36 months). Low nutrient-dense liquid and energy-dense sugar-sweetened, high-fat, and salty snacks exacerbate poor nutrient intake and displace nutrient-dense food in the diet. Tea and coffee have low nutrient content and polyphenols that inhibit iron bioavailability. Drink lots of clean, safe water including drinking water and other foods/beverages that contain water. Biological availability of water depends on the presence of various ingredients in foods and beverages (i.e., salt and carbohydrates accelerate water absorption; caffeine and alcohol have diuretic effects). Research has shown that the consumption of caffeinated beverages, such as tea and coffee, can add to the daily water balance in individuals who are used to ingesting these beverages. Acute increases in urine output only occur in individuals who are not accustomed to regular consumption of caffeinated beverages. |
| ASIA and the PACIFIC | |
| Afghanistan LI 2015 | Reduce sugar intake and avoid sweet carbonated beverages. |
| Australia HI 2013 | Drink plenty of water: Tea and coffee provide water, although they are not suitable for young children and large quantities can have unwanted stimulant effects in some people. Consumption of drinks with added sugars, such as soft drinks and cordials, fruit drinks, vitamin waters, and energy and sports drinks can increase the risk of excessive weight gain in both children and adults. Limit intake of foods and drinks containing added sugars such as confectionary, sugar-sweetened soft drinks and cordials, fruit drinks, vitamin waters, and energy and sports drinks. |
| Bangladesh LMI 2013 | Consume less sugar, sweets, or sweetened drinks. Drink coconut water and fresh fruit juices instead of carbonated drinks. Pregnancy and lactation: Iron supplements are poorly absorbed when they are taken with beverages such as coffee or tea or simultaneously with calcium supplements. They should be taken after a meal, preferably after breakfast or after lunch. |
| China UMI 2016 | For lactating women, overconsumption of coffee should be avoided. Consumption of sugar-sweetened beverages should be limited in all age groups. |
| Fiji UMI 2013 | Drinks like tea and coffee are diuretics, which make you produce more urine than usual. Therefore, if you drink lots of tea and coffee, you still need to drink plenty of water. Fizzy and sugary drinks are also not a good way to get your fluid. The high sugar content can cause unwanted weight gain or take the place of more nutritious foods in your diet. |
| India LMI 2011 | Lactating women: Excess intake of beverages containing caffeine like coffee and tea adversely affect fetal growth, and hence, should be avoided. Since drugs (antibiotics, caffeine, hormones, and alcohol) are secreted into the breast-milk and could prove harmful to the breast-fed infant, caution should be exercised by the lactating mother while taking medicines. Drink plenty of water and take beverages in moderation: Tea and coffee are popular beverages. They are known to relieve mental and muscular fatigue. This characteristic stimulating effect is due to their caffeine content. Caffeine stimulates the central nervous system and induces physiological dependence. Generally, low doses (20–200 mg) of caffeine produce mild positive effects like a feeling of well-being, alertness, and being energetic. Higher doses (>200 mg) can produce negative effects like nervousness and anxiety, especially in people who do not usually consume caffeine-containing beverages. Therefore, moderation in tea and coffee consumption is advised so that caffeine intake does not exceed the tolerable limits. Tannin is also present in tea and coffee and is known to interfere with iron absorption. Hence, tea and coffee should be avoided at least for one hour before and after meals. Excess consumption of coffee is known to increase blood pressure and cause abnormalities in heartbeat. In addition, an association between coffee consumption and elevated levels of total and low-density lipoprotein (LDL) cholesterol (“bad” cholesterol), triglycerides, and heart disease has been demonstrated. Therefore, individuals with heart disease need to restrict coffee consumption. Also, those who experience adverse effects from caffeine should stop drinking coffee. Besides caffeine, tea contains theobromine and theophylline. These are known to relax coronary arteries and thereby promote circulation. Tea also contains flavonoids and other antioxidant polyphenols, which are known to reduce the risk for coronary heart disease and stomach cancer. However, as a result of its caffeine content, excess tea consumption is deleterious to health. Decaffeinated coffee and tea are being marketed to obviate the adverse effects of caffeine. |
| Indonesia LMI 2014 | One should limit consumption of overripe fruits and sugary juice drinks to control blood glucose. It should be noted that other food containing simple carbohydrate (flour, bread, soy sauce), sweet fruits, juice, soda drinks, etc., also contain sugar. Caffeine, if consumed by pregnant women, has a diuretic and stimulant effect. Thus, pregnant women may experience increased urination which may lead to dehydration, and increase in blood pressure and heart rate if their coffee intake is not controlled. Other sources of caffeine are chocolate, tea, and energy supplement drinks. In addition to caffeine, coffee also contains a substance that may inhibit iron absorption. Caffeine consumption in pregnant women may affect fetus growth and development, since the metabolism is not fully developed. The National Institute of Health USA (1993) recommends safe caffeine consumption for pregnant women as 150–250 mg/day or two cups of coffee/day. Thus, it is recommended for pregnant women “to be wise in consuming coffee, limit your intake within safe range, i.e., 2 cups of coffee/day or avoid at all, as there is no nutrition content in the coffee.” Children should not regularly drink sweet or soda drinks as they have high sugar contents. For daily liquid consumption, it is recommended for children to drink 1200–1500 mL water/day. Breastmilk may contain caffeine from the coffee consumed by nursing women. This may have unfavorable effects on babies since their metabolism are not fully developed to digest caffeine. Caffeine consumption in nursing women may be related with low production of breastmilk. Based on research in Harvard University, safe consumption of caffeine in nursing women is 300 mg/day or three cups of coffee/day. Based on research in Mayo Clinic Rochester Minnesota USA, consumption exceeding 300 mg/day will lower iron content in breastmilk by 30% compared to nursing women who do not take caffeine. |
| Japan HI 2010 | Drink plenty of water and tea. Moderate consumption of highly processed snacks, confectionary, and sugar-sweetened beverages. |
| Malaysia UMI 2010 | Consume foods and beverages low in sugar. Caffeine is naturally present in coffee, tea, and chocolate, and added to colas and other beverages. It has long been thought that consumption of caffeinated beverages, because of the diuretic effect of caffeine on reabsorption of water in the kidney, can lead to loss of body water. However, available data are inconsistent. Caffeine-containing beverages did not increase 24 h urine volume in healthy, free-living men when compared with other types of beverages for instance water, energy-containing beverages, or theobromine-containing beverages. In aggregate, available data suggest that higher doses of caffeine (above 180 mg per day) have been shown to increase urinary output, perhaps transiently, and that this diuretic effect occurs within a short time period. Hence, unless additional evidence becomes available indicating cumulative total water deficits in individuals with habitual intakes of significant amounts of caffeine, caffeinated beverages appear to contribute to the daily total water intake similar to that contributed by non-caffeinated beverages (Food and Nutrition Board, 2004). |
| Nepal LI 2012 | Consume less sugar, sweets, and sweetened drinks. |
| New Zealand HI 2008–2013 | 0–2 years Coffee, tea, other caffeine-containing drinks, smart or energy drinks, herbal teas, and alcohol are unsuitable for infants and toddlers. Caffeine is a central nervous system stimulant, which can cause irritability and restlessness. Tea is not recommended because its tannin content inhibits the absorption of iron from the gut. This impact was confirmed by a New Zealand study that observed a significant association between tea drinking in infants and the presence of an iron deficiency. Herbal teas can have adverse effects on infants and toddlers, so are not recommended. 2–18 years Children and young people should limit their intake of foods and drinks containing caffeine. Caffeine is a psychoactive stimulant drug that acts on the central nervous system, alters brain function, acts as a diuretic, and elevates blood pressure and metabolic rate. Acute adverse effects from caffeine that have been identified include anxiety, headaches, insomnia, irritation of the gastrointestinal tract, nausea, and depression. Long-term adverse effects from caffeine are not clear. Children may be more sensitive to adverse effects of caffeine than other groups in the population. An upper exposure of 2.5 mg/kg of body weight per day has been suggested as a cautious toxicological limit on which to base risk assessment for children, on the grounds of limited evidence. Energy drinks and energy shots contain large amounts of caffeine, a psychoactive stimulant drug, and often large amounts of sugar. They are not recommended for children and young people. Coffee and tea are not recommended for children less than 13 years of age. If drinking tea and coffee, it is recommended young people (13–18 years) limit their intake to one to two cups per day. They should avoid drinking tea at meal times, as this drink contains tannins and polyphenols, which can inhibit the absorption of nutrients, such as iron. Pregnant and breast feeding Caffeine is a mild central nervous system stimulant, present in chocolate and beverages such as coffee, tea, energy drinks, and cola. Caffeine readily crosses the placenta to the fetus and has also been found to stimulate metabolic rate. Many over-the-counter medications, such as cold and allergy tablets, headache medications, diuretics, and stimulants, also contain some caffeine. High doses of caffeine in pregnancy have been associated with increased risk of congenital abnormalities, pregnancy loss, low birth weight, and behavioral problems. Decaffeinated coffee appears to have no effect on birth weight. The effects of caffeine may be synergistic with those of smoking and alcohol. Caffeine is transferred into breast milk. The infant metabolizes and excretes caffeine slowly. High caffeine load in breast milk may lead to irritability and poor sleeping patterns and, occasionally, increased bowel activity. The benefits of breastfeeding outweigh any risks associated with the presence of caffeine in breast milk, however. Consuming caffeine-containing beverages immediately after the baby has fed will limit the amount of caffeine in the next feed. The UK Food Standards Agency advises pregnant women to limit their intake of caffeine to 300 mg per day. Breastfeeding women should consider their caffeine intake if the infant is irritable or wakeful. Older people Although there is some evidence that a high caffeine intake is a risk factor for fracture frequency or bone loss, there is also evidence to the contrary. High intakes of caffeine do increase urinary calcium excretion. Several large cohort studies have reported small but significant increases in either fracture frequency or bone loss associated with increased caffeine intake. Other studies have found no such association. Moderate caffeine intake is not associated with increased bone loss, and so a prudent recommendation would be for adequate dietary calcium intake together with moderate caffeine consumption in older adults. A “moderate” level of caffeine intake seems likely to be 300 mg or less of caffeine, which is equivalent to approximately: one large long black, three cappuccinos, four cups of plunger coffee, or six cups of tea. Adults Make plain water your first choice over other drinks; black tea and coffee are also popular and there is some evidence that both can provide benefits for health such as antioxidative properties. Tea and coffee both contain caffeine (a stimulant) and tea contains tannins, which lower the amount of iron that the gut absorbs. Therefore, the Ministry of Health recommends drinking only moderate amounts of tea and coffee. |
| Republic of Korea HI 2010 | Pregnant mothers should minimize coffee, black tea, soda, and chocolate. Young children should minimize the consumption of crackers/cookies, carbonated beverages, and fast food. Young adolescents should minimize instant and fast foods and carbonated beverages and should avoid junk food. |
| Sri Lanka LMI 2011 | Consume less sugar, sweets, or sweetened drinks. Tea without milk and sugar will have certain advantages as they have some antioxidants that will help to improve health. However, it is advisable to avoid tea or coffee closer to a main meal, as it will reduce iron absorption. |
| Thailand UMI 2008–2010 | Most food eaten on a daily basis as a main dish or dessert contain sugar. We also take additional sugar from soft drinks, candy, toffee, jelly, syrup, and sugar added to tea, coffee, and other beverages. Therefore, we often add excessive amounts of energy to our regular diet. Children who eat sugary foods often have a lower appetite and are prone to tooth decay. Thus, sugary foods should be limited in their diets. |
| Vietnam LMI 2013 | Increase physical activity, maintain an appropriate weight, abstain from smoking, and limit your consumption of alcoholic/soft drinks and sweets. |
| NEAR EAST | |
| Iran UMI 2015 | Reduce your consumption of sugar, sweet foods and beverages, and soft drinks. During the day drink water and unsweetened beverages frequently. |
| Lebanon UMI 2013 | Limit intake of sugar, especially added sugar from sweetened foods and beverages. Avoid drinking tea, coffee, and caffeine-containing carbonated beverages with meals, as food components in these beverages may decrease the absorption of iron in food. The consumption of the below food components can increase the urinary loss of calcium Salt (in excessive amounts) Caffeine (in amounts coming from more than three to four cups of coffee per day). Water is the preferred fluid to fulfill the body’s daily fluid needs and is followed (in decreasing order) by: tea and coffee, low-fat and fat-free milk, non-sugar sweetened beverages that contain some nutritional benefits (such as fruit and vegetable juices), sugar-sweetened and nutrient-poor beverages (such as sweetened fruit juices and soft drinks). Although tea and coffee contain a good amount of water, these fluids contain caffeine, which increases urine excretion. As such, these fluids lead to a loss of water from the body if consumed in high amounts. Consumption of sugar-sweetened beverages has been linked to overweight, obesity, type 2 diabetes, and dental caries. Since fluid-derived energy is an important consideration in weight gain, drinking water should be the preferred beverage for hydration purposes. |
| Qatar HI 2015 | Limit sweetened food and beverages. Be aware of the amounts of sugar in hot and cold coffee beverages served in cafes. Avoid sweetened drinks such as soda, energy drinks, fruit drinks, vitamin waters, and sports drinks. Allow 30 min after meals before drinking tea to allow for absorption of iron from foods. |
| EUROPE | |
| Albania UMI 2008 | Infants in their first year of life Iron absorption is decreased with drinking tea and coffee Adults Consume 1–2 liters of beverages per day choosing those with no sugar added but potable water, mineral water, and fruit or plant teas. Take limited quantities of beverages containing caffeine (coffee, black or green tea, etc.). Women breastfeeding Avoid alcoholic beverages and products which contain caffeine. Women in menopause It is important to stay away from the alcoholic beverages, coffee, and spicy food because those influence in worsening the warmth. Children 2–3 years old Consume at least three glasses of sugarless juices (water, mineral water, original plant tea, fresh watered juicy fruits, no sugar added, etc.) per day. The beverages should not contain caffeine or alcohol. Children 4–6 years old Consume at least three to four glasses of sugarless juices per day. The beverages should not contain caffeine like teas or cola. Teenagers 13–18 years old Consume at least five to six glasses of sugarless juices per day. The beverages should not contain caffeine like teas or cola and alcohol. |
| Austria HI 2010 | Non-alcoholic beverages: Drink at least 1.5 liters of fluid, preferably low-energy drinks in the form of water, mineral water, unsweetened fruit or herbal teas, or diluted fruit and vegetable juices. A daily moderate consumption of coffee, black tea (three to four cups) and other caffeinated beverages is acceptable. Processed foods high in fat, sugar, and salt: Some processed foods (such as sweets, pastries, fast food products, snacks, and soft drinks) are high in fat, sugar, and salt and are less desirable nutritionally. They should be consumed sparingly—a maximum of one small serving a day. There is no objection about the daily moderate consumption of coffee, black tea (three to four cups) and other caffeinated drinks. Is coffee a liquid robber? In “normal” quantities (up to four cups/day) it is not. |
| Belgium HI 2005 | Drink at least 1.5 liters of water every day (water, coffee, tea, etc.). Pregnant women Avoid alcohol, tobacco, and large amounts of tea and coffee. 3 to 12 years Water is preferred over other beverages since the latter often contain a lot of sugar. 13 to 18 years Water, tea, or coffee are components of a “good breakfast.” 60 and older Water, (weak) coffee, and tea are encouraged at each meal and throughout the day to maintain hydration. “Food for brain”: tea and coffee are sources of antioxidants. |
| Bulgaria UMI 2006 | Limit the consumption of sugar, sweets, and confectionery, and avoid sugar-containing soft drinks. The high intake of sugar and sugar-containing foods and beverages leads to being overweight and obesity, which themselves increase the risk for hypertension, cardiovascular diseases, and type 2 diabetes. Try to drink tea or coffee without sugar. Prefer honey or brown sugar for sweetening. |
| Croatia HI 2002 | Black coffee can reduce calcium absorption. |
| Cyprus HI 2007 | Reduce the consumption of sugar, preferring appropriate beverages and foods with reduced or no sugar. |
| Denmark HI 2013 | Maximum amount of caffeine for an adult/day is 400 mg. Caffeine for children and youngsters is discouraged. Pregnant and breastfeeding women are encouraged to minimize their intake of caffeine. Furthermore, they are discouraged from drinking any energy drinks. |
| Estonia HI 2006 | Limit the consumption of sweets and soft drinks. |
| Finland HI 2014 | Decrease consumption of soft drinks and sweet juices. You should avoid having sugary drinks regularly, as they are associated with obesity and the risk of developing type 2 diabetes. A high intake of sugary drinks also affects your dental health. |
| France HI 2011 | Limit the consumption of sugar and foods high in sugar (soft drinks, candies, chocolate, pastries, desserts, etc.) Beverages: To quench your thirst, water is the only essential drink. You should drink at least a liter and a half a day, during and between meals, as it is or in the form of hot drinks (tea, herbal tea, coffee). If you are fond of soft drinks or sweet drinks, try to content yourself with one drink a day or only two or three at a party. The sugar contained in these drinks does not decrease your appetite and makes you easily gain weight. Consume sugary drinks with moderation. Instead, choose fruit juices without added sugar. If you drink a lot of soft drinks, and do not manage to replace with water, drink light versions to reduce your sugar intake. In tea or herbal teas, a little spoon of honey is always better than a cube of sugar. For children, it is best to regularly offer tap water, spring water, or mineral water (flat or carbonated), with plant extracts and sugar-free; plain or flavored milk with cocoa, vanilla, orange blossom, or syrup (fruit based concentrates); or pure fruit juice (no added sugar) or a squeezed fruit juice. |
| Georgia UMI 2005 | Do not drink tea while eating plant meals rich in iron (e.g., vegetables, legumes), because tea limits the availability of non-heme iron. Sweet drinks can be replaced by sufficient amounts of unsweetened liquids, e.g., boiled water. |
| Germany HI 2013 | Drink water with or without carbon dioxide and low-energy drinks. Drink sweetened drinks rarely. These are energetic and can increase the emergence of obesity. |
| Greece HI 1999 | Always prefer water over soft drinks. Non-alcoholic beverages, including sodas, have not been conclusively linked to health effects. Fruit juices are likely to share some of the benefits of fruits, whereas other beverages have been criticized for their high content in simple carbohydrates. Simple sugars are plentiful in deserts, and also exist, or are added, in beverages, like coffee, tea, fruit juices, soft drinks, and colas. Simple sugars have glycemic effects, mainly comparable to or less than those of starch from cooked foods. |
| Hungary HI 2004–2016 | Avoid the frequent consumption of foods or drinks rich in added sugar. To quench your thirst, drink water or mineral water instead of sugary drinks. Children: Consumption of energy drinks is not recommended because it has high caffeine and high sugar content. |
| Ireland HI 2012 | Limit high fat, sugar, and salt foods from the top shelf of the pyramid to no more than once or twice a week (includes soft drinks and juice). Fluids: Water is the best drink for hydration and the safest for teeth. At least 8–10 cups of fluid are needed every day, and this can come from fluids in the foods eaten as well as water, milk, tea, and coffee. Other sources of excessive sugar in the form of sweets, soft drinks, cakes, biscuits, and confectionery are not integrated with nutritious high-fiber foods. Limiting these foods will help to lower calories, fat, sugar, and salt. Although “diet” soft drinks (sugar free) can be used sometimes for variety, they are acidic and if taken too frequently, they can still harm teeth. Pregnant women: Caffeine in the mother’s diet can reach the baby and may be harmful. High caffeine intakes during pregnancy are not advisable, and mothers should aim to keep their caffeine intake below 200 mg of caffeine per day (an accompanying table provides caffeine content of the most common caffeine-containing foods and drinks). Also limit consumption of caffeine while breastfeeding. |
| Israel HI 2008 | Eat/drink sweets, snacks, and sweetened drinks sparingly. |
| Italy HI 2003 | Consume appropriate amounts of sugars, sweets, and sugar-sweetened beverages. The balance of water must be maintained by drinking essentially water, both tap and bottled, safe and controlled. Remember that certain drinks (such as orange juice, sodas, fruit juices, coffee, and tea), in addition to providing water, also bring other substances that contain calories (for example, simple sugars) or that are pharmacologically active (for example caffeine). These should be used in moderation. |
| Latvia HI 2003–2008 | Limit consumption of salt and sugar and products containing them. Do not wait until you feel thirsty—use liquid regularly! The day should consist of eight glasses of liquid including water and herbal teas. [The Centre for Disease Prevention and Control infographics stresses the importance of using non-sweetened and non-caffeinated drinks like pure water (2 liters a day) or herbal tea for hydration needs. Usage of these liquids instead of coffee or tea is also recommended for mental health and heart disease prevention. It is recommended for pregnant women to drink water every day and limit caffeine consumption to 200 mg per day. Exclusion of energy drinks during this period is also recommended. As coffee and tea reduces iron absorption, reduced intake of these drinks is recommended whilst using iron supplements. Limited coffee and tea usage for vegetarians is also recommended, especially during meals as these drinks reduce calcium absorption] |
| Malta HI 2016 | Avoid adding sugar to your tea or coffee. Avoid energy drinks. Avoid soft and sweetened drinks especially in children. Avoid energy drinks: Energy drinks generally have a high sugar and caffeine content as well as other stimulant substances. They can easily contribute to an excess energy intake and may cause a variety of problems such as headaches, restlessness, insomnia, stomach upset, fast heartbeat, tooth decay, and anxiety. |
| Netherlands HI 2016 | Drink three cups of tea daily. Replace unfiltered coffee by filtered coffee. Minimize consumption of sugar-containing beverages. Tea: In the context of this advisory report, the term “tea” covers green tea and black tea. Green tea comes from the tea plant, but unlike black tea, it has not undergone oxidation. Herbal teas and, for example, rooibos are outside the scope of this report. The Committee concludes that it has been convincingly demonstrated that the consumption of tea reduces the risk of stroke. That conclusion is based on the fact that randomized controlled trials (RCTs) show that three cups of green tea or five cups of black tea a day reduce blood pressure, while the consumption of tea is associated with a lower risk of stroke in cohort studies. In addition, the consumption of black tea and the consumption of green tea are plausibly associated with a lower risk of diabetes. Coffee: The way that coffee is prepared, whether it is filtered or not, makes a difference to its influence on health. That is because filtering can remove the cholesterol-raising substances cafestol and kahweol from coffee. In the context of this advisory report, “filtered coffee” covers coffee made using a filter machine, coffee made using coffee pods, instant coffee, and vending-machine coffee made using liquid coffee concentrate. Unfiltered coffee includes boiled coffee, cafetière coffee, Greek coffee, and Turkish coffee. Espresso and coffee from vending machines that use fresh coffee may count either as filtered or as unfiltered, depending on the type of machine, the type and amount of coffee, and the type of filter used. The Committee concludes that it has been convincingly demonstrated in RCTs that unfiltered coffee increases LDL cholesterol, which is known to be a causal risk factor for coronary heart disease. Coffee consumption is associated with lower risks of coronary heart disease, stroke, and diabetes in cohort studies, which relate predominantly to filtered coffee consumption. Sugar-containing beverages: Examples include fruit juice drinks and “nectars,” carbonated drinks (“pops” and “sodas”), ice tea, vitamin-fortified water, and sports drinks made by the addition of sugar. The Committee concludes that it has been convincingly demonstrated that the consumption of drinks with added sugar increases the risk of diabetes. That conclusion is based on the fact that RCTs have shown that drinks with added sugar increase body weight, while cohort studies indicate an association of the consumption of drinks with added sugar with a higher risk of diabetes. |
| Norway HI 2014 | Find the right balance between how much energy you consume through food and drink and how much energy you use by being physically active. Limit your consumption of food and drink with a high sugar content. People at risk of developing heart disease and diabetes should limit their consumption of non-filtered coffee. It is recommended that drinks with added sugar or caffeine not be offered in schools. |
| Poland HI 2010 | Moderate your intake of sugar and sweets. Drink tea and coffee in moderation. It is better to choose green tea, fruit tea, or herbal tea and rarely drink black teas and coffee. Exclude or limit sweetened beverages, especially sodas (carbonated drinks). Their excess in diet favors even more occurrence of overweight and obesity than consumption of great amounts of sugar and sweets. Carbon dioxide can suppress thirst. Tea is a good source of water, which you can drink but in smaller amounts. Fruit and herbal teas are best, rarely drink dark tea, which should not be too strong. Try not to sweeten tea, and if you do not like the bitter taste, decrease the amount of added sugar. |
| Portugal HI 2003 | Prefer water to beverages containing added sugar, alcohol, and caffeine. The recommended minimum consumption of liquids per day is 1.5 to 3 liters, depending on the activity and state of health of the individual. Although water is the best drink to satisfy your thirst, you can also drink other drinks that do not contain added sugar, alcohol, or caffeine. Natural fruit juices and caffeine-free teas are examples of these beverages. Coffee and some teas and soft drinks contain caffeine, a stimulant substance whose intake should be limited to a maximum of 300 mg per day. In the case of children adolescents and their consumption is discouraged. Despite the designation, decaffeinated beverages are not completely exempt of this substance. In tea, the absorption of caffeine is slower than in coffee, which means the stimulating effect is lower but lasts longer. |
| Romania UMI 2006 | Eat highly processed foods high in sugar sparingly. Caffeine, nicotine, and warm foods also increase the thermic effect of food. Various seeds, unprocessed grains, sprouted wheat and wheat bran, nuts, vegetables, green vegetables, hard water, coffee, tea, and cocoa are good sources of magnesium. Pregnant women Iron supplements must be administered between meals, preferable with liquids containing ascorbic acid (increases the iron absorption), avoiding concurrent administration of tea, milk, or coffee. Caffeine: There are controversies about an acceptable level of the caffeine intake during pregnancy. In USA, the Food and Drug Administration (FDA) recommends limiting the intake of caffeine during pregnancy and if possible complete avoidance, given the teratogenic effects seen in animal studies. In humans, large doses of caffeine (over 300 mg/day) are associated with low birth weight. Caffeinated beverages should also be avoided while breastfeeding. Elderly Avoid alcohol abuse, excess intake of caffeine and unnecessary medications. Tea and coffee have no contribution to calorie intake unless milk, cream, or sugar is added. They contain caffeine and theobromine and their excess use may cause insomnia and irritability. Tea is an important source of bioflavonoids with antioxidant properties that might protect against cardiovascular disease. Cocoa contains significant amounts of iron, proteins, fats, and carbohydrates; however, because of the quantities in which it is usually consumed, it loses its nutritional value. |
| Slovenia HI 2011 | Consume enough fluids, preferably drinking water, mineral water, unsweetened fruit or herbal teas or diluted fruit and vegetable juices. |
| Spain HI 2008 | Avoid excessive consumption of sugary soft drinks and juices with added sugar. The studies warn about the relationship between the excessive consumption of these soft drinks and the increase in childhood obesity. Do not consume them as a substitute for water. |
| Sweden HI 2015 | Less sugar - Hold back on the sweets, pastries, ice creams, and other products containing lots of sugar. Cut back on sweet drinks in particular. Water is by far the best drink for quenching thirst—much better than fizzy drinks, juice, soft drinks, and sports drinks. Sweet drinks in particular increase the risk of obesity as they contain lots of calories but do not make you feel full. |
| Switzerland HI 2011 | Beverages: Consume 1–2 liters per day, preferably in the form of unsweetened drinks such as tap water/mineral water or fruit/herb tea. Caffeinated drinks, such as coffee, black tea, and green tea, can also count towards your fluid intake. |
| Turkey UMI 2006 | Reduce the consumption of sugary beverages and sweets and choose foods containing less sugar. Instead of sugar-added soft drinks, please prefer skim milk, ayran (watered yogurt), and kefir. Instead of drinking beverages containing sugar, water should be preferred. Drink sugar-free tea and herbal teas. |
| United Kingdom HI 2016 | If consuming foods and drinks high in fat, salt, or sugar, have these less often and in small amounts. Aim to drink six to eight glasses of fluid every day. Water, lower fat milk, and sugar-free drinks including tea and coffee all count. Fruit juice and smoothies also count towards your fluid consumption, although they are a source of free sugars and so you should limit consumption to no more than a combined total of 150 mL per day. Swap sugary soft drinks for diet, sugar-free, or no added sugar varieties to reduce your sugar intake in a simple step. The European Food Safety Authority (EFSA) opinion confirms the safety of daily caffeine intakes of up to 3 mg per kg of body weight for children and adolescents (3–18 years) and up to 400 mg for adults. |
| LATIN AMERICA and the CARIBBEAN | |
| Antigua and Barbuda HI 2013 | Reduce the intake of food and drinks that are high in sugars and fats. |
| Argentina UMI 2015 | Limit the consumption of sugary drinks and foods high in fats, sugar, and salt. |
| Bahamas HI 2002 | Eating too much high-seasoned and sweet foods increases your risk of developing heart disease, high blood pressure, and type II diabetes. Sodas, fruit-flavored drinks, and desserts like guava duff and tarts contain lots of sugar. |
| Barbados HI 2017 | Choose food and beverages with less added sugar every day. Many foods and beverages with added sugar are high in calories and have little nutritional value. These extra calories can contribute to overweight and obesity. High sugar intake can also increase blood pressure and risk of death from cardiovascular disease. |
| Belize HI 2012 | Replace sweet drinks with water. Add less sugar when preparing foods and drinks. Foods that contain a high amount of sugar include soft drinks, box drinks, cakes, ice cream, puddings, sweets, jams and jellies, and condensed milk. Benefits: better weight control, better control of blood sugar levels, and fewer problems with dental caries/tooth decay. |
| Bolivia LMI 2013 | Avoid the over consumption of sugar, sweets, sodas, and alcoholic drinks. Reduce the consumption of tea and coffee, replacing them with milk, fruit juices or “apis”. Avoid the exaggerated consumption of sugar, sweets, soft drinks: Exaggerated consumption of these products cause tooth decay and deteriorate health. Certain substances such as caffeine and alcohol have a diuretic effect and increase the urinary losses of water and electrolytes. Adequate water intake can be covered not only with water, but also with food or liquids that do not contain caffeine and alcohol. |
| Brazil UMI 2014 | Avoid consumption of ultra-processed foods. Because of their ingredients, ultra-processed foods, such as salty fatty packaged snacks, soft drinks, sweetened breakfast cereals, and instant noodles, are nutritionally unbalanced. As a result of their formulation and presentation, they tend to be consumed in excess, and displace natural or minimally processed foods. Their means of production, distribution, marketing, and consumption damage culture, social life, and the environment. Examples of natural/minimally processed foods: tea, herbal infusions, coffee, and tap, spring, and mineral water. Breakfast examples: Fruits and coffee with milk are a constant part of the first meal of the day. Water: Pure water (or, as preferred by some people, “seasoned” with lime slices or mint leaves) is the best option. Brazilians also consume water in the form of coffee and tea, in which case sugar should be reduced to a minimum or not added at all. |
| Chile HI 2013 | If you want to maintain a healthy weight, avoid eating sugar, sweets, sugar-sweetened juices, and beverages. The [lactating] mother should be well fed, eat healthy, drink water, and not consume any alcoholic drinks, tobacco, drugs, or excessive tea or coffee. Children 6–11 months Artificial sweeteners (saccharin, aspartame, sucralose, stevia, or other) should not be used in children’s foods under 2 years of age directly or in preparations or commercial products labeled “light” or “diet” or other similar ones. Powdered drinks, juices or nectars with sugar, soft drinks, and in general any sugary drink or with artificial sweeteners, are not recommended, nor necessary. |
| Colombia UMI 2014 | To maintain a healthy weight, reduce the consumption of packaged products, fast foods, soft drinks, and sweetened drinks. Pregnant women Avoid the consumption of products like soft drinks, energy drinks, and sugary drinks that favor the onset of diabetes, being overweight, and obesity. Lactating mothers Do not consume alcoholic beverages or energy drinks. |
| Costa Rica UMI 2010 | Decrease the amount of sugar that is used to sweeten your drinks. Choose juices or drinks that are 100% natural, without sugar. Avoid the consumption of pastries, cookies, condensed milk, dulce de leche, soft drinks, sweets, chocolates, ice creams, jellies, and jams. In addition to water, you can consume other liquids like juices, tea, broths, and soups. |
| Cuba UMI 2009 | Decrease the consumption of all types of sweets (homemade, industrial, candies, jams and others), as well as sweetened drinks. |
| Dominica UMI 2007 | Choose less sweet foods and drinks. |
| Dominican Republic UMI 2009 | Prefer medium and low energy foods to achieve energy balance. Foods high in energy include: fritters, desserts, oils, margarine, butter, lard, mayonnaise, picaderas, pork rinds, bacon, fast food, snacks, dressings, stuffed crackers, sausages, pastries, and carbonated and alcoholic beverages. |
| El Salvador LMI 2012 | Avoid eating sugary foods and drinks, chips, sausages, sweets, highly processed foods, and canned foods. These foods have delicious taste and appetizing appearance, but they provide large amounts of saturated fat and calories. Therefore, the consequences of frequent consumption are: becoming overweight and obesity, the appearance of diseases of the heart, diabetes mellitus, hypertension, tumors and cancers, and dental caries. |
| Grenada UMI 2016 | Choose to use less sweet foods and drinks. |
| Guatemala LMI 2012 | Avoid the consumption of carbonated water, drinks energizers, bottled drinks with artificial flavors, packaged juices, etc., because they contain excess sugar, preservatives, and dyes that are harmful to health. Coffee consumption is not recommended as a substitute for water. Coffee stimulates acidity or secretion of gastric acids and produces discomfort in cases of diseases of the digestive system. The effect of tea, especially black tea, is similar. |
| Honduras LMI 2013 | Do not substitute water for coffee or tea, as they can cause acidity and other problems in the digestive system. Avoid the consumption of soft drinks, energy drinks, bottled beverages, packaged juices, juices and natural soft drinks, etc., since they generally contain large amounts of sugar, dyes, and preservatives that are harmful to health. |
| Jamaica UMI 2015 | Reduce intake of sugary foods and drinks. These include honey, syrup, jam, sweetened carbonated beverages, condensed milk, sweet snacks, and desserts. Benefits: reduces risk of becoming overweight/obesity, hypertension, diabetes, heart diseases, and other chronic illness. |
| Mexico UMI 2015 | Drink plenty of plain water. Drink plain aguas frescas or flavored water without added sugar instead of sweetened drinks such as soft drinks, juices, and aguas frescas. Decrease the consumption of energy-containing beverages such as soft drinks, nectars, and sweetened drinks with fruit flavors. Mexico has one of the highest consumption of sugary drinks in the world for all age groups from 1 year old. The types of beverages that contribute the greatest to energy in the population are: soft drinks (carbonated and not carbonated); drinks made with fruit juices (with or without sugar), which are taken as natural juices; fresh waters; juices made with 100% fruit; and flavored milks. Beverage classes according to their energy content, nutritional value, and risks to health on a scale that classifies drinks from the most (level 1) to the least (level 5) healthy. Level 1: Drinking water; Jamaican water without sugar (six to eight glasses of water per day) Level 2: Low-fat milk (1%) or fat-free and sugar-free (max two glasses a day) Level 3: Coffee, tea, and fruit water without sugar (maximum four cups a day) Level 4: Drinks with high calorific value and limited health benefits (fruit juices, whole milk, fruit smoothies with sugar or honey, and sports drinks) (maximum 1/2 cup per day) Level 5: Drinks with sugar and low nutrient content |
| Panama UMI 2013 | Avoid sodas, iced tea, and sugary drinks. Prefer natural juices without sugar. The frequent or daily consumption of sodas or sugary drinks leads to the appearance of obesity, diabetes, hypertension, and high cholesterol, as well as cardiovascular and renal diseases. Avoid all colors and flavors of sodas, iced teas of any flavor, and sugary drinks with colorants, packaged, or with powder. |
| Paraguay UMI 2015 | Drink less carbonated beverages and artificial juices because they damage your health. Consume less sweets, sodas, and sweetened drinks to stay healthy. Foods high in simple sugars contribute empty calories without special nutrients, and so excessive consumption can harm your health when these foods rich in sugars are eaten in excess, they are accumulated in the body in the form of fat, which is considered a risk factor of obesity, cardiovascular disease (heart and arteries), diabetes, dental cavities, and others. |
| Saint Kitts and Nevis HI 2010 | Limit the use of foods and drinks with added salt and sugar. |
| Saint Lucia UMI 2007 | Choose fewer beverages and foods preserved or prepared with added sugar. |
| Saint Vincent and the Grenadines UMI 2006 | Reduce the intake of sugar: use less sugar, sweet foods, and drinks. |
| Uruguay HI 2016 | Base your diet on natural foods, and avoid the regular consumption of ultra-processed products with excessive contents of fat, sugar, and salt. Prefer water to other beverages. Limit sodas, artificial juices, and flavored waters. |
| Venezuela UMI 1991 | Soft drinks and other sugary drinks only provide calories. In contrast, natural fruit juices prepared at home provide an addition of calories, vitamins, and minerals |
| NORTH AMERICA | |
| Canada HI 2007 | Limit foods and beverages high in calories, fat, sugar or salt (sodium) [many listed, i.e., soft drinks, sports and energy drinks, and sweetened hot or cold drinks, hot chocolate, specialty coffee]. Have a glass of low fat milk rather than pop or fruit drinks. Use low-fat evaporated milk instead of cream or coffee whitener in coffee or tea. Soft drinks, sports drinks, energy drinks, and alcoholic beverages can add a significant number of calories to the diet. These drinks may also contain caffeine or sodium. Health Canada: https://www.canada.ca/en/health-canada/services/food-nutrition/food-safety/food-additives/caffeine-foods/foods.html A review (Nawrot et al, Food Additives and Contaminants, 2003) undertaken by Health Canada scientists has considered the numerous studies dealing with caffeine and its potential health effects. It has re-confirmed that for the average adult, moderate daily caffeine intake at dose levels of 400 mg/day is not associated with any adverse effects. Data has shown, however, that women of childbearing age and children may be at greater risk from caffeine. Recommended max caffeine intake levels. 4–6 years: 45 mg/day 7–9 years: 62.5 mg/day 10–12 years: 85 mg/day Women planning to become pregnant, pregnant women, and breast feeding mothers: 300 mg/day Suggestions for adolescents 13+ years: 2.5 mg/kg body weight. |
| United States HI 2016 | Limit calories from added sugars and saturated fats and reduce sodium intake. When choosing beverages, both the calories and nutrients they may provide are important considerations. Beverages that are calorie-free, especially water, or that contribute beneficial nutrients, such as fat-free and low-fat milk and 100% juice, should be the primary beverages consumed. Milk and 100% fruit juice should be consumed within recommended food group amounts and calorie limits. Sugar-sweetened beverages, such as soft drinks, sports drinks, and fruit drinks that are less than 100% juice, can contribute excess calories while providing few or no key nutrients. If they are consumed, amounts should be within overall calorie limits and limits for calories from added sugars. Caffeine is not a nutrient; it is a dietary component that functions in the body as a stimulant. Caffeine occurs naturally in plants (e.g., coffee beans, tea leaves, cocoa beans, and kola nuts). It is also added to foods and beverages (e.g., caffeinated soda and energy drinks). Moderate coffee consumption (three to five 8-oz cups/day or providing up to 400 mg/day of caffeine) can be incorporated into healthy eating patterns. This guidance on coffee is informed by strong and consistent evidence showing that, in healthy adults, moderate coffee consumption is not associated with an increased risk of major chronic diseases (e.g., cancer) or premature death, especially from CVD. Individuals who do not consume caffeinated coffee or other caffeinated beverages are not encouraged to incorporate them into their eating pattern. Limited and mixed evidence is available from randomized controlled trials examining the relationship between those energy drinks which have high caffeine content and cardiovascular risk factors and other health outcomes. Caffeinated beverages, such as some sodas or energy drinks, may include calories from added sugars, and although coffee itself has minimal calories, coffee beverages often contain added calories from cream, whole or 2% milk, creamer, and added sugars, which should be limited. The same considerations apply to calories added to tea or other similar beverages. Those who choose to drink alcohol should be cautious about mixing caffeine and alcohol together or consuming them at the same time. Women who are capable of becoming pregnant or who are trying to, or who are pregnant, and those who are breastfeeding should consult their health care providers for advice concerning caffeine consumption. |
© 2018 by the authors. Licensee MDPI, Basel, Switzerland. This article is an open access article distributed under the terms and conditions of the Creative Commons Attribution (CC BY) license (http://creativecommons.org/licenses/by/4.0/).
Share and Cite
Reyes, C.M.; Cornelis, M.C. Caffeine in the Diet: Country-Level Consumption and Guidelines. Nutrients 2018, 10, 1772. https://doi.org/10.3390/nu10111772
Reyes CM, Cornelis MC. Caffeine in the Diet: Country-Level Consumption and Guidelines. Nutrients. 2018; 10(11):1772. https://doi.org/10.3390/nu10111772
Chicago/Turabian StyleReyes, Celine Marie, and Marilyn C. Cornelis. 2018. "Caffeine in the Diet: Country-Level Consumption and Guidelines" Nutrients 10, no. 11: 1772. https://doi.org/10.3390/nu10111772
APA StyleReyes, C. M., & Cornelis, M. C. (2018). Caffeine in the Diet: Country-Level Consumption and Guidelines. Nutrients, 10(11), 1772. https://doi.org/10.3390/nu10111772