


Abstract
Background: Cardiovascular disease (CVD) remains the leading cause of mortality globally. The associations between composite indices integrating body composition and lipid-related metabolic characteristics and CVD remain insufficiently investigated. We therefore constructed the skeletal muscle-fat distribution metabolic index (SMFDMI) and explored its association with CVD. Methods: Data were derived from the China Health and Retirement Longitudinal Study. The prospective analysis included 6785 participants aged ≥45 years followed from 2011 to 2020, while the cross-sectional analysis included 8279 participants. Cox and logistic regression models, restricted cubic splines, subgroup analyses, and sensitivity analyses were performed. Results: The cohort and cross-sectional analyses included participants with median ages of 58 and 59 years and male proportions of 47.19% and 46.42%, respectively. In Model 3, higher SMFDMI was associated with a lower risk of incident CVD, with a 25% lower risk in Q5 than in Q1 (HR = 0.75, 95% CI: 0.63–0.89). The cross-sectional analysis also showed an inverse association with prevalent CVD. Restricted cubic splines suggested an approximately N-shaped nonlinear relationship between SMFDMI and CVD risk. Subgroup analyses showed a stronger inverse association in males (Q5 vs. Q1: HR = 0.62, 95% CI: 0.48–0.81) and in those without chronic diseases. An alternative index yielded similar findings. Conclusions: Higher SMFDMI was associated with a lower risk of incident CVD in middle-aged and older Chinese adults. SMFDMI may provide additional insights into the relationship between muscle health and cardiovascular health during aging, with potential relevance to primary healthcare.
1. Introduction
Cardiovascular disease (CVD), the leading cause of mortality and disability worldwide, has shown a marked increase in prevalence from 271 million in 1990 to 780 million in 2022, with stroke and ischemic heart disease as its main subtypes [1]. In China, CVD remains the leading cause of death, with higher incidence and mortality in rural areas [2,3]. Population aging further exacerbates the burden [2]. Given the complexity of CVD pathogenesis and its diverse risk factors, clarifying its epidemiology and determinants is critical for guiding prevention and control strategies. CVD risk factors include traditional ones such as hypertension, diabetes, and smoking [4,5], as well as non-traditional ones like environmental exposures and sleep disorders [6,7]. Sarcopenia has been linked bidirectionally with heart failure and atherosclerotic cardiovascular disease [8], prompting growing research interest in the relationships between body composition parameters such as body fat percentage (BFP) and muscle mass, lipid metabolism, and CVD.
Among body composition-related indicators, abnormal elevation of body fat constitutes a crucial risk factor for CVD. Regional body fat distribution is differentially associated with cardiovascular and metabolic disease risk, with abdominal adipose tissue linked to higher risk and lower-extremity fat linked to lower risk [9,10]. Large-scale cohort and genome-wide association studies have identified genetic correlations between BFP and CVD, with evidence suggesting a potential causal association between higher BFP and heart failure [11]. The “harmful” and “beneficial” phenotypes of fat accumulation exhibit opposing associations with disease risk [12]. Excess adiposity may promote cardiovascular pathogenesis through multiple mechanisms [13,14]. Increased visceral fat has been linked to greater arterial stiffness and higher estimated cardiovascular risk even in normal-weight individuals [15]. Body fat is therefore a vital indicator for CVD management. Muscle mass is a key component of body composition, and muscle-derived myokines regulate systemic metabolism and inflammation [16]. Reduced muscle mass with impaired function is associated with dyslipidemia in older adults [17] and with an elevated sleep disorder risk in diabetic patients [18]. These metabolic and physiological disturbances are closely linked to cardiovascular risk, underscoring the important role of muscle-related parameters in cardiovascular health [19]. A high-fat, low-muscle profile may increase cardiovascular risk [20,21]. Maintaining or increasing muscle mass might improve metabolic health and alleviate age-related cardiovascular risk in middle-aged and older adults [22]. Dyslipidemia is a critical bridge linking abnormal body composition to CVD. Excess adiposity is frequently accompanied by elevated triglycerides (TG) and low-density lipoprotein cholesterol (LDL-C), along with reduced high-density lipoprotein cholesterol (HDL-C), reflecting an adverse lipid profile that may contribute to atherosclerosis [23,24]. Insufficient muscle mass could impair lipid oxidation and lipoprotein lipase activity, exacerbating dyslipidemia [19,25]. Therefore, body fat, muscle mass, and blood lipids are interrelated. Abnormal body fat may impair muscle anabolism and function, with decreased muscle mass potentially exacerbating dyslipidemia and lipid disorders disrupting body composition homeostasis. This vicious cycle could contribute to the development and progression of CVD.
Although previous studies have demonstrated close interrelationships among body fat, muscle mass, and blood lipids in relation to CVD, their combined association with CVD risk remains insufficiently investigated. Existing cardiovascular risk assessments often consider these factors individually or in partial combinations, which may not fully characterize the combined characteristics. To further explore these associations, the skeletal muscle-fat distribution metabolic index (SMFDMI) was constructed as an exploratory composite index in the present study. This index integrates anthropometrically estimated skeletal muscle mass, body fat percentage, and lipid-related metabolic measures to characterize their combined profiles in relation to CVD. Using data from the China Health and Retirement Longitudinal Study (CHARLS) collected between 2011 and 2020, we examined the association between SMFDMI and CVD in middle-aged and older Chinese adults. First, a cross-sectional analysis assessed the association between baseline SMFDMI and prevalent CVD in 2011. Second, a prospective cohort analysis investigated the association between baseline SMFDMI and incident CVD during follow-up among participants without prevalent CVD at baseline. This study may provide additional epidemiological evidence on the relationship between muscle-related characteristics, adiposity, lipid metabolism, and cardiovascular health during aging, while offering insights for primary healthcare professionals into the potential relevance of these routinely accessible indicators to cardiovascular health.
2. Materials and Methods
2.1. Study Design and Participants
We used data from the CHARLS, a nationally representative, prospective cohort that has tracked community-dwelling adults aged 45 years or older since 2011. The baseline survey employed a four-stage stratified sampling design with probability proportional to size sampling at the county and village/community levels, covering 150 counties/districts and 450 villages/urban communities across 28 provincial-level administrative regions in China. Surveys were conducted in 2011, 2013, 2015, 2018, and 2020. CHARLS was approved by the Institutional Review Board (IRB) of the Biomedical Ethics Review Committee of Peking University (IRB 00001052-11015 for household survey and anthropometric measurement; IRB 00001052-11014 for biomarker collection), and all participants provided written informed consent.
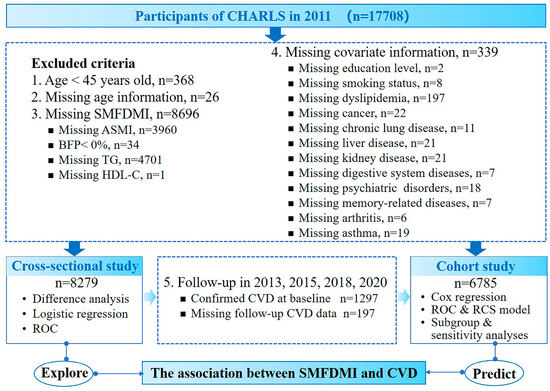
Participants aged younger than 45 years, those with missing age information, those with missing or invalid baseline SMFDMI component data, and those with missing baseline covariate information were excluded from both analyses. After these exclusions, 8279 participants were eligible for the cross-sectional analysis, including individuals with prevalent CVD at baseline. For the prospective cohort analysis, 1297 participants with prevalent CVD at baseline and 197 participants without follow-up CVD information were additionally excluded. Thus, 6785 participants free of prevalent CVD at baseline were included in the longitudinal cohort analysis. The participant selection process is illustrated in Figure 1.
Figure 1.
Flow chart of participant selection and study design. ASMI, appendicular skeletal muscle mass index; BFP, body fat percentage; CHARLS, China Health and Retirement Longitudinal Study; CVD, cardiovascular disease; HDL-C, high-density lipoprotein cholesterol; RCS, restricted cubic spline; ROC, receiver operating characteristic; SMFDMI, skeletal muscle-fat distribution metabolic index; TG, triglycerides.
2.2. Assessment of Skeletal Muscle-Fat Distribution Metabolic Index
2.2.1. Appendicular Skeletal Muscle Mass Index (ASMI)
ASM was estimated using the anthropometric prediction equation developed by Wen et al. for the Chinese population [26]:
ASM (kg) = 0.193 × body weight (kg) + 0.107 × height (cm) − 4.157 × sex (1 = male, 2 = female)
− 0.037 × age (years) − 2.631.
− 0.037 × age (years) − 2.631.
The equation is consistent with that used in previous CHARLS-based research [27].
According to the 2025 Asian Working Group for Sarcopenia consensus [28], body mass index (BMI)-adjusted ASMI was calculated as:
2.2.2. Body Fat Percentage (BFP)
BFP was estimated via the formula proposed by Gómez-Ambrosi et al. [29]:
where sex was coded as 0 for males and 1 for females and age was in years. This equation has also been widely applied in epidemiological studies involving Chinese populations [13].
BFP = −44.988 + (0.503 × age) + (10.689 × sex) + (3.172 × BMI) − (0.026 × BMI2)
+ (0.181 × BMI × sex) − (0.02 × BMI × age) − (0.005 × BMI2 × sex)
+ (0.00021 × BMI2 × age),
+ (0.181 × BMI × sex) − (0.02 × BMI × age) − (0.005 × BMI2 × sex)
+ (0.00021 × BMI2 × age),
2.2.3. Triglycerides (TG) and High-Density Lipoprotein Cholesterol (HDL-C)
Serum TG and HDL-C were measured at baseline by enzymatic colorimetry using an automatic biochemistry analyzer, in line with the CHARLS Official National Baseline Blood Data User Guide. Only fasting TG and HDL-C measurements were included in the analysis.
2.2.4. Skeletal Muscle-Fat Distribution Metabolic Index (SMFDMI)
SMFDMI was calculated as follows:
SMFDMI was constructed as an exploratory composite index integrating estimated relative muscle mass and adiposity [ASMI/(BFP/100)] with lipid metabolic characteristics, as defined in the equation above, consistent with the general approach of previous composite cardiometabolic indices [30,31,32]. All components were ascertained at baseline. Higher values indicated a more favorable muscle-fat metabolic status. Both TG and HDL-C were expressed in mg/dL in the calculation.
To account for differences in measurement scales and potential skewness in the distributions of the component variables, an alternative SMFDMI (Z-SMFDMI) was constructed. ASMI, BFP, TG, and HDL-C were first natural log-transformed and then individually standardized using Z-scores. The Z-SMFDMI was calculated as follows:
where Z denotes standardization using the mean and standard deviation (SD) of each log-transformed variable.
2.3. Assessment of Cardiovascular Disease
Incident CVD was identified from self-reported physician-diagnosed data in CHARLS. At each follow-up survey, participants were asked two key questions: “Has a doctor ever told you that you have heart disease?” and “Has a doctor ever told you that you have had a stroke?” A positive response to either question was defined as a CVD diagnosis. Previously reported disease statuses were retrospectively reviewed during subsequent follow-ups, and inconsistent records were corrected accordingly. For previously reported negative disease statuses retrospectively revised to positive, priority was given to the diagnosis year reported in the preceding survey, followed by that reported in the current survey. If both were unavailable, the preceding survey year was used as a proxy. For other positive reports with missing diagnosis years, the corresponding survey year was assigned. The earlier assigned diagnosis year of heart disease or stroke was used to determine the CVD event year. Participants with a diagnosis year of 2011 or earlier were classified as having prevalent CVD and excluded from the prospective analysis. When the recorded death year preceded the estimated CVD diagnosis year, the prespecified rule was to censor at death.
2.4. Covariates
Covariates were collected at baseline by trained staff and categorized into three domains. Sociodemographic characteristics encompassed age, sex, marital status (married or other [including separated, divorced, widowed and never married]), education level (illiterate, primary school, middle school, high school or above) and residence (rural or urban). Participants’ sex was self-reported. Lifestyle factors included smoking status and drinking status, both dichotomized as yes or no. Chronic diseases comprised diabetes, hypertension, dyslipidemia, cancer, chronic lung disease, liver disease, kidney disease, digestive system diseases, psychiatric disorders, memory-related diseases, arthritis, and asthma, all of which were treated as binary variables (yes/no). Diabetes was defined by self-reported physician diagnosis, fasting blood glucose ≥ 126 mg/dL, random blood glucose ≥ 200 mg/dL, or glycated hemoglobin ≥ 6.5%; hypertension was identified via self-reported physician diagnosis, systolic blood pressure ≥ 140 mmHg, or diastolic blood pressure ≥ 90 mmHg; all other chronic conditions were ascertained based on self-reported physician diagnoses [33].
2.5. Statistical Analysis
All statistical analyses were performed using IBM SPSS Statistics version 27 (IBM Corp., Armonk, NY, USA) and R version 4.5.2 (R Foundation for Statistical Computing, Vienna, Austria). A two-sided p < 0.05 was considered statistically significant. As all continuous variables were non-normally distributed, they were presented as medians (interquartile ranges), and categorical variables as numbers (percentages). Group differences were assessed using the Mann–Whitney U test and χ2 test for continuous and categorical variables, respectively. For both cross-sectional and cohort analyses, ASMI, BFP, TG, HDL-C, and SMFDMI were categorized into sex-specific quintiles, with cutoff values provided in Supplementary Table S1. Per 1-SD associations with prevalent and incident CVD were assessed using the means and SDs calculated from the corresponding overall analytical samples.
The cross-sectional analysis of baseline data employed logistic regression to assess the associations between these five indices and prevalent CVD. Three models were constructed: Model 1, an unadjusted model; Model 2, adjusted for age, sex, marital status, education level, residence, smoking status, and drinking status; and Model 3, further adjusted for chronic diseases, including diabetes, hypertension, dyslipidemia, cancer, chronic lung disease, liver disease, kidney disease, digestive system diseases, psychiatric disorders, memory-related diseases, arthritis, and asthma.
In the longitudinal analysis, cumulative CVD incidence across quintiles of each index was plotted with Kaplan–Meier curves and compared by the log-rank test. Cox proportional hazards regression was performed to examine the prospective associations of these five indices with incident CVD risk. Hazard ratios (HRs) and 95% confidence intervals (CIs) were estimated in three models adjusted for the same covariates as in the logistic regression analysis. Nonlinear dose–response relationships were explored using restricted cubic splines (RCS). Four knots were placed at the 5th, 35th, 65th, and 95th percentiles of each index, with the median value as the reference (HR = 1).
Covariate-adjusted ROC curves were generated from predicted probabilities obtained using logistic regression models incorporating each index and the Model 3 covariates in both the cross-sectional and longitudinal analyses. In the longitudinal analysis, incident CVD was treated as a binary outcome without accounting for event timing or censoring, and AUCs were compared using paired ROC curve comparisons. Incremental prognostic performance was evaluated by comparing a conventional Cox base model with models additionally including TG/HDL-C, SMFDMI, or its four components. Discrimination was assessed using the C-index and 4-year time-dependent AUC with inverse probability of censoring weighting. Model fit was compared using Akaike Information Criterion (AIC) and likelihood ratio tests, while internal validation and calibration were evaluated using bootstrap resamples and 4-year calibration plots, respectively. Subgroup analyses were performed by stratifying participants according to age (≤60, >60 years), sex (male, female), and individual chronic disease status (no, yes). In sensitivity analyses, Z-SMFDMI was categorized into sex-specific quintiles, and Cox regression models were used to examine its association with incident CVD, with adjustment for the same covariates as in the primary analyses. Additionally, Model 3 was further adjusted for baseline BMI to assess the association between SMFDMI and incident CVD.
3. Results
3.1. The Characteristics of Participants in the Cross-Sectional and Cohort Studies
The cohort and cross-sectional studies included 6785 and 8279 participants, with median ages of 58 and 59 years and male proportions of 47.19% and 46.42%, respectively (Table 1, Supplementary Table S2). Participants were grouped by incident CVD in the cohort study and prevalent CVD in the cross-sectional study.
Table 1.
The characteristics of participants in the cohort study.
In the cohort study, participants with incident CVD were older, were more likely to be female, and had higher prevalences of diabetes, hypertension and dyslipidemia than those without incident CVD (all p < 0.05). Significant between-group differences were also observed in ASMI, BFP, TG, HDL-C, and SMFDMI. The incident CVD group had lower median ASMI, HDL-C, and SMFDMI values (Table 1).
In the cross-sectional study, participants with prevalent CVD differed significantly from those without prevalent CVD in age, sex, marital status, residence, drinking status, and the prevalence of several chronic diseases (all p < 0.05). A lower proportion of participants with prevalent CVD reported alcohol consumption. Differences in ASMI, BFP, TG, HDL-C, and SMFDMI were also statistically significant, with a lower median SMFDMI value in the prevalent CVD group (Supplementary Table S2).
3.2. The Association Between ASMI, BFP, TG, HDL-C, SMFDMI and CVD
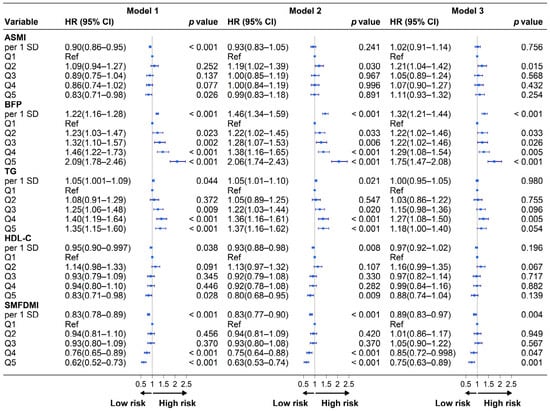
The median follow-up duration was 9 years. Cox regression analyses showed that ASMI, BFP, TG, HDL-C, and SMFDMI were each significantly associated with incident CVD in unadjusted models (all p < 0.05, Figure 2). After multivariable adjustment, significant associations persisted in selected quintile comparisons for ASMI, BFP, TG, and SMFDMI. In the per 1-SD analyses, only BFP and SMFDMI remained significantly associated with incident CVD in Model 3. Each 1-SD increase in SMFDMI was associated with lower CVD risk in Model 3 (HR = 0.89, 95% CI: 0.83–0.97, p = 0.004). Compared with the lowest quintile (Q1), participants in the highest quintile (Q5) of SMFDMI had a 25% lower incident CVD risk in Model 3 (HR = 0.75, 95% CI: 0.63–0.89, p = 0.001).
Figure 2.
CVD association with ASMI, BFP, TG, HDL-C, and SMFDMI (Cox Regression). Model 1 was unadjusted; Model 2 was adjusted for age, sex, marital status, education level, residence, smoking status and drinking status; Model 3 was further adjusted for diabetes, hypertension, dyslipidemia, cancer, chronic lung disease, liver disease, kidney disease, digestive system diseases, psychiatric disorders, memory-related diseases, arthritis and asthma based on Model 2. Squares represent hazard ratio (HR) estimates, and horizontal lines represent 95% confidence intervals (CIs). The vertical reference line at HR = 1.0 indicates no association. Arrows indicate the direction of lower or higher CVD risk. ASMI, appendicular skeletal muscle mass index; BFP, body fat percentage; CI, confidence interval; CVD, cardiovascular disease; HDL-C, high-density lipoprotein cholesterol; HR, hazard ratio; SD, standard deviation; SMFDMI, skeletal muscle-fat distribution metabolic index; TG, triglycerides.
In cross-sectional logistic regression analyses, all five indices remained significantly associated with prevalent CVD (all p < 0.05, Supplementary Table S3). In Model 3, per 1-SD increases in ASMI and BFP were positively associated with prevalent CVD, whereas HDL-C and SMFDMI were inversely associated. Compared with Q1, Q5 of SMFDMI was associated with 32% lower odds of prevalent CVD (OR = 0.68, 95% CI: 0.55–0.84).
3.3. Kaplan–Meier Curves
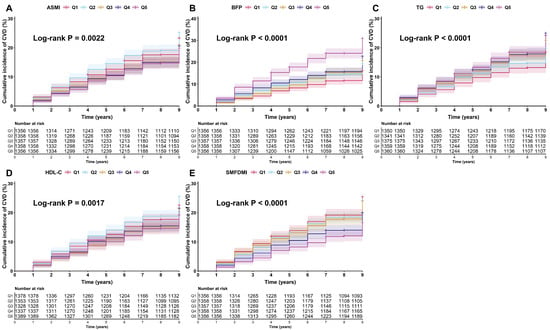
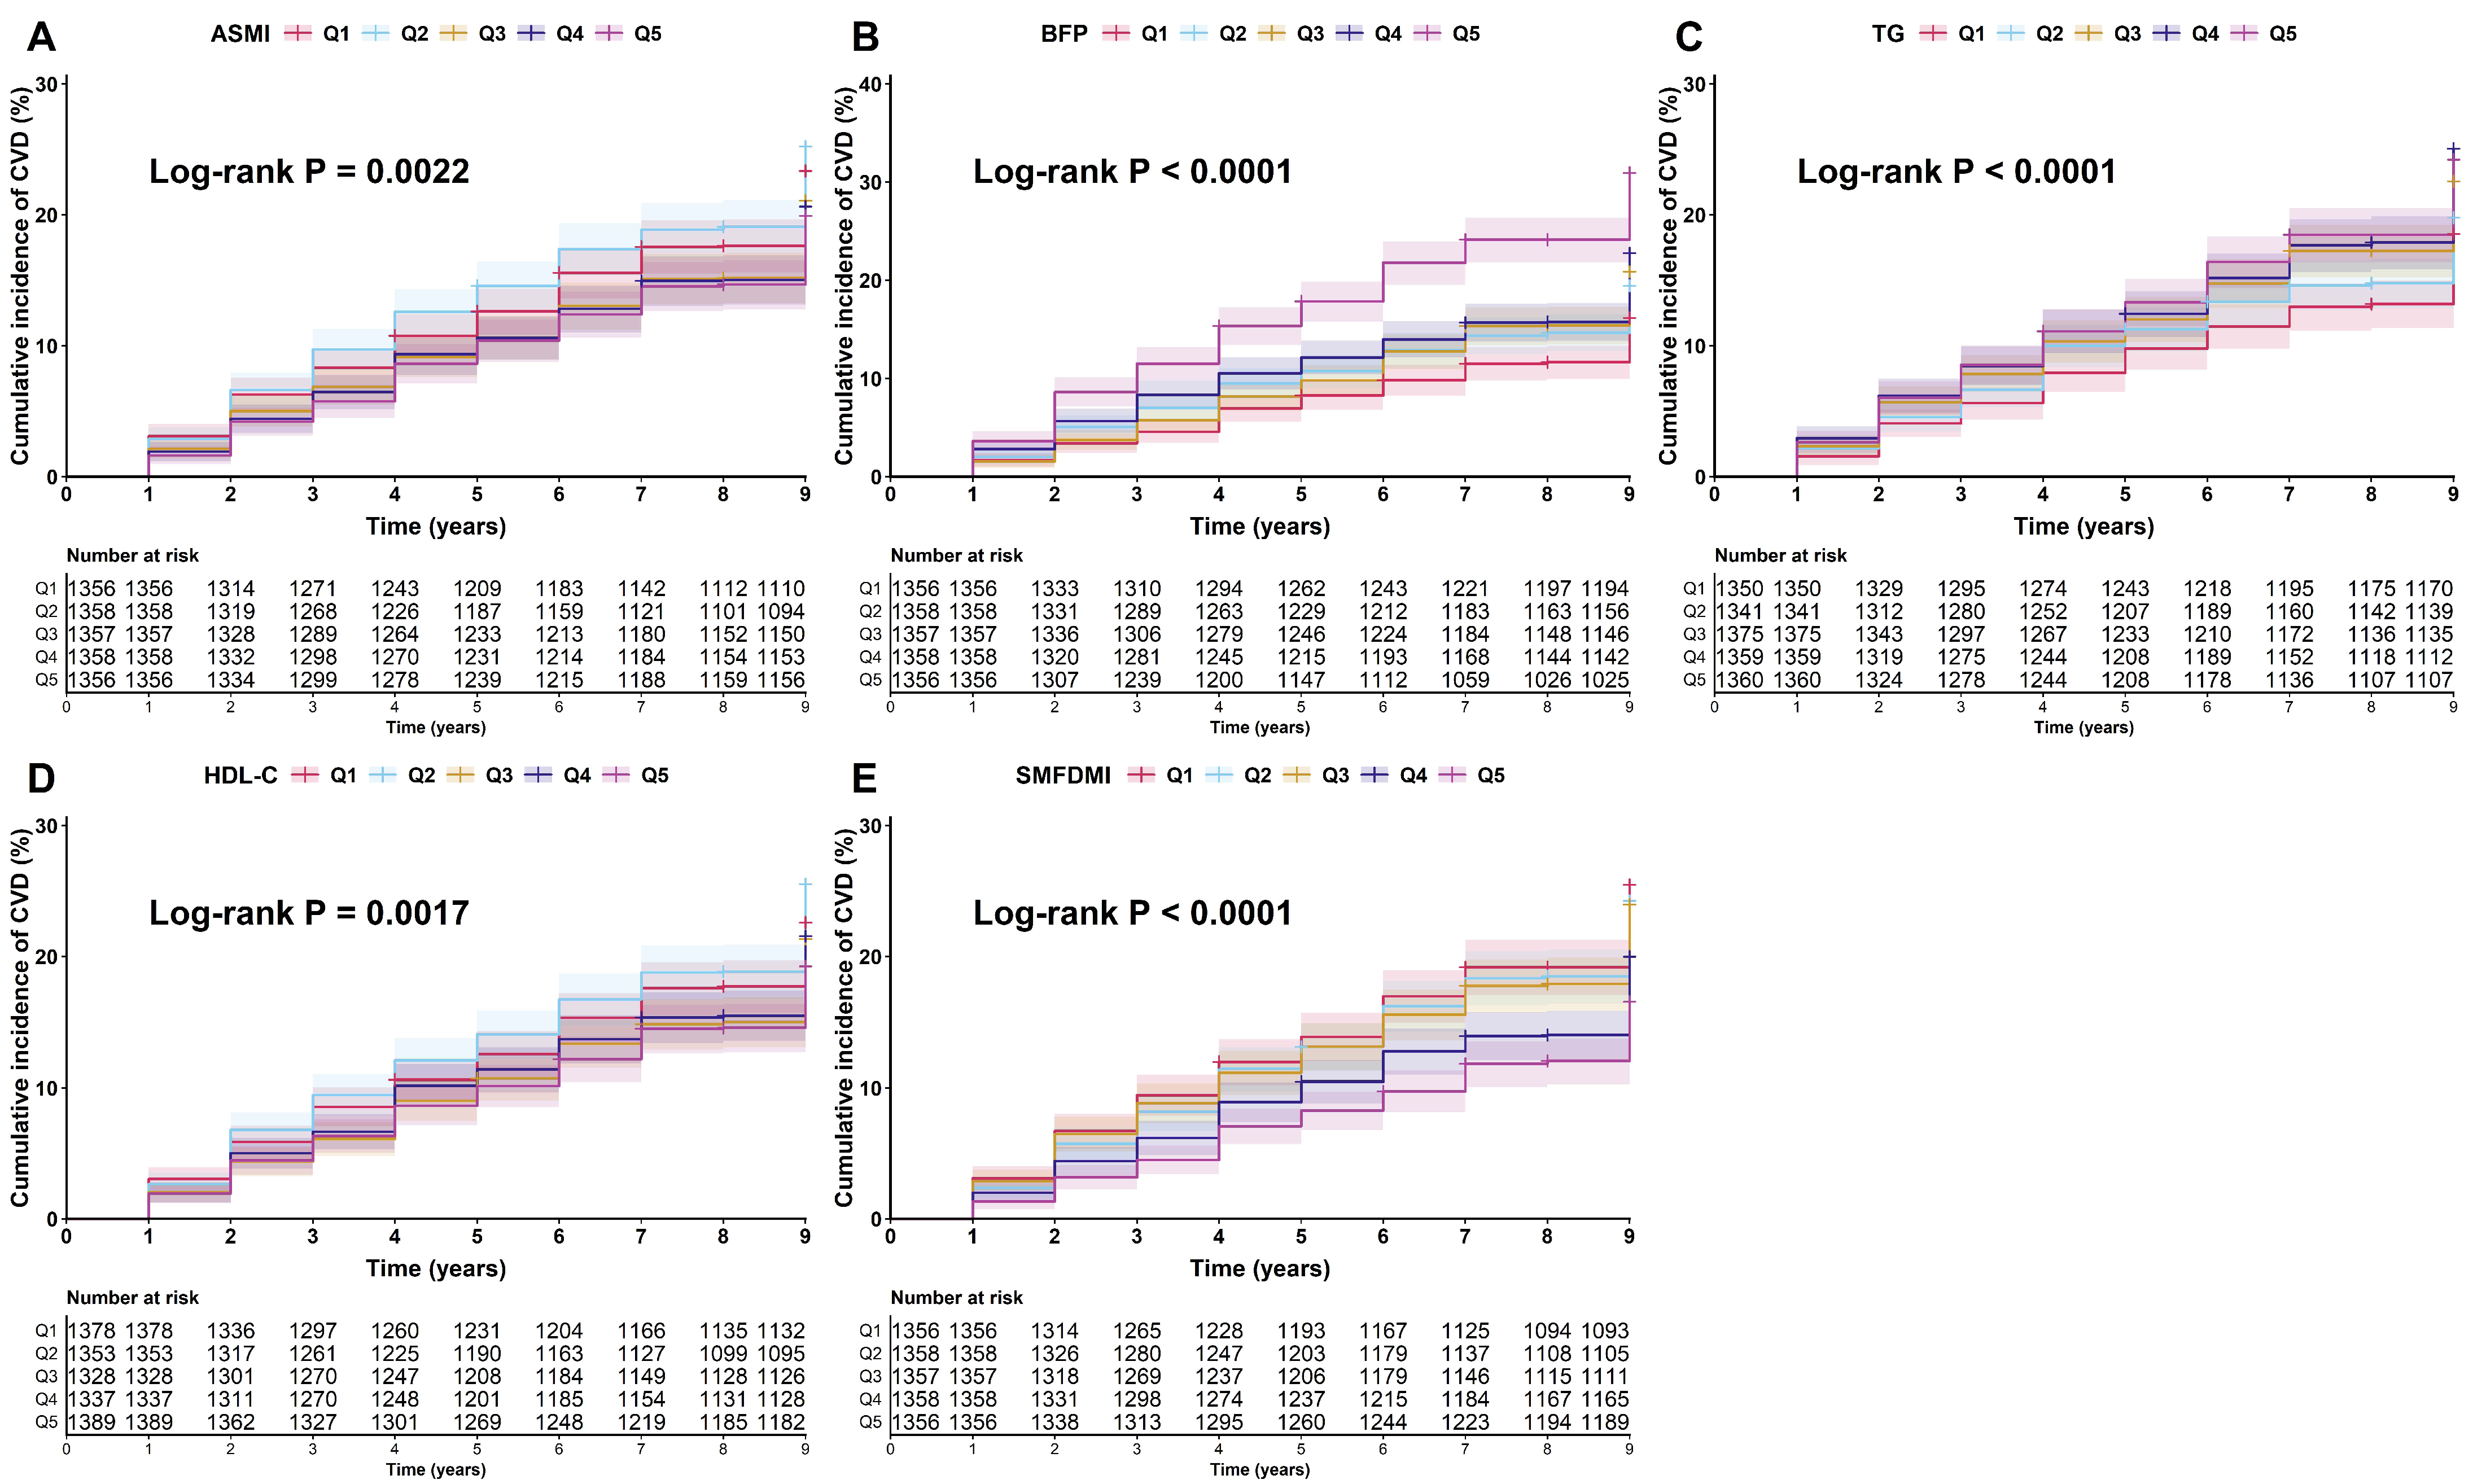
Log-rank tests revealed significant differences in cumulative CVD incidence across quintiles of all five indices. The cumulative incidence of CVD increased progressively with lower quintiles of ASMI (log-rank p = 0.0022, Figure 3A) and HDL-C (log-rank p = 0.0017, Figure 3D), and with higher quintiles of BFP (log-rank p < 0.0001, Figure 3B) and TG (log-rank p < 0.0001, Figure 3C). In contrast, a graded inverse association was observed for SMFDMI (Figure 3E), with higher quintiles associated with progressively lower cumulative CVD incidence (log-rank p < 0.0001).
Figure 3.
CVD cumulative incidence in ASMI, BFP, TG, HDL-C, and SMFDMI groups. Kaplan–Meier curves show the cumulative incidence of CVD according to sex-specific quintiles (Q1–Q5) of (A) ASMI, (B) BFP, (C) TG, (D) HDL-C, and (E) SMFDMI. Quintile cutoffs were determined separately for men and women. Shaded areas represent 95% CIs. Differences among quintiles were assessed using the log-rank test. Numbers at risk are shown below each panel. ASMI, appendicular skeletal muscle mass index; BFP, body fat percentage; CI, confidence interval; CVD, cardiovascular disease; HDL-C, high-density lipoprotein cholesterol; SMFDMI, skeletal muscle-fat distribution metabolic index; TG, triglycerides.
3.4. Dose–Response Relationship
RCS analysis indicated significant nonlinear relationships of TG (p for nonlinear = 0.001), HDL-C (p for nonlinear = 0.034), and SMFDMI (p for nonlinear < 0.001) with incident CVD risk (Supplementary Figure S1C–E). The association between SMFDMI and incident CVD exhibited an approximately N-shaped pattern, with the estimated HR initially increasing, then decreasing, and showing a slight apparent increase at higher SMFDMI values. However, the 95% CIs widened toward the upper end of the SMFDMI distribution. Among the 6785 participants included in the RCS analysis, 340 (5.01%) had SMFDMI values above the 95th percentile, with 59 incident CVD events recorded in this range (Supplementary Table S4). In contrast, no significant nonlinear associations were found between ASMI (p for nonlinear = 0.568), BFP (p for nonlinear = 0.132) and incident CVD risk (Supplementary Figure S1A,B).
3.5. Covariate-Adjusted ROC Curve Analysis and AUC Comparison
Baseline ROC analyses demonstrated moderate discriminative ability of all five indices for CVD, with AUCs ranging from 0.71 to 0.72 (Supplementary Figure S2A). In the longitudinal binary-outcome ROC analysis, AUCs ranged from 0.63 to 0.64, with an AUC of 0.64 (95% CI: 0.62–0.65) for SMFDMI (Supplementary Figure S2B). Although some paired comparisons were statistically significant, the AUC differences between SMFDMI and the other indices were small (ΔAUC: −0.00576 to 0.00385, Supplementary Figure S2C).
In the incremental prognostic analysis (Supplementary Table S5), adding SMFDMI to the conventional base model increased the C-index from 0.62283 to 0.62665 and the 4-year time-dependent AUC from 0.64296 to 0.64738 (ΔAUC = 0.00442; p = 0.043). In comparison, adding TG/HDL-C resulted in minimal changes in discrimination (ΔC-index = −0.00002; ΔAUC = 0.00005, p = 0.592). The SMFDMI-extended model also had a lower AIC (ΔAIC = −7.39539; likelihood ratio test p = 0.002). Bootstrap validation showed only small differences in AUC and Brier score between the base model and the SMFDMI-extended model. Four-year calibration plots are presented in Supplementary Figure S3.
3.6. Subgroup Analyses
Subgroup analyses were performed to evaluate the association between SMFDMI and incident CVD across subgroups (Table 2, Supplementary Table S6). Significant interaction effects were observed for sex and for diabetes, hypertension, dyslipidemia, chronic lung disease, liver disease, kidney disease, memory-related diseases, and asthma (all interaction p < 0.05). In Model 3, a stronger inverse association was observed in males, among whom Q5 of SMFDMI was associated with a substantially lower CVD risk (HR = 0.62, 95% CI: 0.48–0.81, p < 0.001) compared with Q1. Similarly, among participants without diabetes, hypertension, dyslipidemia, or chronic lung disease, the Q5 group showed a 24–28% reduction in CVD risk (HR range: 0.72–0.76; all p < 0.05).
Table 2.
Subgroup analyses of the association between SMFDMI and CVD stratified by age and sex.
3.7. Sensitivity Analyses
In sensitivity analyses, Z-SMFDMI showed an inverse association with incident CVD, consistent with the findings for the original SMFDMI. In Model 3, participants in Q5 of Z-SMFDMI had a lower risk of incident CVD than those in Q1 (HR = 0.75, 95% CI: 0.63–0.89) (Supplementary Table S7). After further adjustment for baseline BMI in Model 3, the association between SMFDMI and incident CVD was no longer statistically significant (HR = 0.88, 95% CI: 0.73–1.06) (Supplementary Table S8).
4. Discussion
CVD persists as the foremost global cause of mortality and disability, imposing substantial health and economic burdens worldwide [34]. Despite advances in lifestyle, pharmacological, and surgical interventions, clinical management remains hampered by insensitivity to traditional risk factors and the multifactorial complexity of CVD pathogenesis [35]. Novel composite biomarkers are therefore urgently needed to facilitate the early identification of high-risk populations, optimize prevention, and reduce the CVD burden [36]. Using nationally representative CHARLS data, this study found that higher SMFDMI was associated with lower prevalent and incident CVD among middle-aged and older Chinese adults. An approximately N-shaped association was observed, with numerically stronger inverse associations among men and individuals without major cardiometabolic comorbidities. The associations were generally robust but attenuated after BMI adjustment, and improvements in risk discrimination were limited.
A key feature of SMFDMI is its integration of body composition and lipid-related characteristics. Higher SMFDMI was associated with lower odds of prevalent CVD (OR = 0.81) and a lower hazard of incident CVD (HR = 0.89) per 1-SD increase, even after adjustment for multiple potential confounders. The consistency of these associations across cross-sectional and prospective analyses suggests that SMFDMI may characterize a broader cardiometabolic phenotype associated with cardiovascular health. Previous research has highlighted the close relationship between skeletal muscle, adipose tissue, and cardiometabolic outcomes [37]. In the present study, ASMI showed a positive association with CVD. Previous longitudinal research has also shown that associations between skeletal muscle mass indices and cardiovascular events may vary according to the methods used to adjust for body size [38], suggesting that muscle mass should be interpreted in the context of body size and adiposity, and the magnitude of ASMI increments. These findings provide a rationale for considering muscle mass alongside adiposity and lipid-related characteristics when examining cardiovascular health.
From this perspective, SMFDMI may provide a composite description of muscle mass, adiposity, and lipid-related metabolic characteristics, particularly in middle-aged and older adults, among whom changes in body composition and lipid profiles frequently coexist. The sensitivity analysis using Z-SMFDMI yielded a similar association with incident CVD, suggesting that the observed association was relatively robust to differences in the construction of the index. After further adjustment for baseline BMI, the association between SMFDMI and incident CVD was no longer statistically significant. This finding may partly reflect the overlap in anthropometric information between SMFDMI and BMI. The observed associations therefore support further investigation of SMFDMI as an integrated cardiometabolic measure, and its potential value beyond conventional anthropometric indicators remains to be established.
The approximately N-shaped nonlinear relationship represents another finding of this study. The inverse association observed in the middle range of the curve was consistent with the overall inverse association between SMFDMI and incident CVD reported above. Although the estimated HR showed a slight apparent increase at higher SMFDMI values, the widening 95% CIs indicated greater uncertainty in this region. The relatively limited number of participants and CVD events in the extreme upper range may have partly contributed to this uncertainty. Whether this apparent increase reflects sparse data, extreme index values, or other factors remains unclear. The apparent increase at higher SMFDMI levels should be interpreted cautiously.
Subgroup analyses showed that the inverse association between SMFDMI and CVD was stronger in males and individuals without comorbidities such as diabetes, hypertension, or dyslipidemia, suggesting its potential utility for risk stratification. The stronger association observed in males (HR = 0.62) may be related to the role of testosterone in regulating muscle synthesis and lipid metabolism [39]. Males typically have greater muscle mass and a propensity for visceral fat accumulation, potentially influencing the association between SMFDMI and CVD risk in this population. In individuals with established metabolic diseases, the conditions themselves might serve as the dominant factor driving CVD progression, which may mask the independent role of baseline metabolic reserve represented by SMFDMI [40]. This association was more pronounced in relatively healthy individuals, suggesting its potential relevance to cardiovascular risk assessment in primary prevention settings. For middle-aged and older individuals with low SMFDMI levels who have not yet met the diagnostic criteria for diseases—often categorized as “apparently healthy”—this index may help identify individuals with unfavorable muscle–fat and lipid-related metabolic profiles. Such populations could benefit from lifestyle interventions, including resistance training and nutritional optimization [41,42].
Although SMFDMI was associated with prevalent and incident CVD, its inclusion in a model with conventional risk factors resulted in only marginal improvements in discrimination. These findings do not support its use as a substitute for established cardiovascular risk assessment tools incorporating factors such as blood pressure and glycemic measures [24]. Nevertheless, SMFDMI is relatively simple to calculate using routinely available clinical measurements and may serve as a complementary indicator in epidemiological research. Its incremental clinical predictive value warrants further evaluation.
The innovation of this study lies in breaking away from the limitations of traditional isolated investigations into the associations of sarcopenia, obesity, or dyslipidemia with CVD risk, and developing the SMFDMI that integrates ASMI, BFP, TG and HDL-C. Although previous studies have confirmed the independent effects of low muscle mass [43], greater adiposity [44], and adverse lipid profiles on cardiometabolic health, no unified index has been established to capture the synergistic interplay between body composition and metabolic status. This approach contributes additional epidemiological evidence regarding the associations between integrated muscle–fat–lipid characteristics and cardiovascular health in middle-aged and older adults.
This study has several limitations. First, ASM and BFP were estimated using anthropometric equations rather than precise measurement techniques such as bioelectrical impedance analysis or dual-energy X-ray absorptiometry, potentially introducing measurement error [45,46]. The ASM equation was developed in Chinese adults aged 18–69 years, whereas the BFP equation was originally developed in White adults, raising concerns about age-related extrapolation and cross-population applicability, respectively. Moreover, shared anthropometric variables underlying ASM, BFP, and BMI may introduce mathematical coupling, which represents an important methodological limitation. Further studies incorporating directly measured body composition and muscle function data are needed to clarify the biological interpretation of SMFDMI. Second, CVD outcomes were ascertained through self-reported physician diagnoses, which may be subject to underreporting and misclassification bias, particularly among middle-aged and older adults in rural areas where access to healthcare may be limited. Additionally, the study did not distinguish between CVD subtypes such as ischemic heart disease and stroke, limiting the interpretation of underlying mechanisms. Third, the formula and component weights of SMFDMI were determined based on theoretical considerations. Differences in measurement scales and potential skewness in the distributions of component variables may influence the resulting index, while the relative contributions of individual components remain uncertain. Further studies are needed to validate and refine the mathematical structure and weighting of SMFDMI in diverse populations. Fourth, the exclusion of participants with missing or invalid SMFDMI data may have introduced selection bias, potentially affecting the representativeness and generalizability of the findings. Fifth, the study population consisted of middle-aged and older Chinese adults, and external validation was not performed. Therefore, caution is warranted when generalizing the findings to other ethnic groups or younger populations.
5. Conclusions
In conclusion, higher SMFDMI was associated with lower odds of prevalent CVD and a lower risk of incident CVD among middle-aged and older Chinese adults. The inverse associations were numerically stronger in men and in individuals without major cardiometabolic comorbidities. By integrating skeletal muscle mass, body fat, and lipid-related measures, SMFDMI may reflect a broader cardiometabolic phenotype associated with cardiovascular health. The association remained generally consistent with an alternative index construction. Given its reliance on routinely accessible body composition and lipid-related measures, SMFDMI may provide primary healthcare professionals with additional insights into cardiometabolic health. Further studies using directly measured body composition and independent external cohorts are needed to confirm these associations and evaluate the potential clinical utility of SMFDMI.
Supplementary Materials
The following supporting information can be downloaded at: https://www.mdpi.com/article/10.3390/metabo16110867/s1, Supplementary Table S1. Sex-stratified quintile cutoff values of ASMI, BFP, TG, HDL-C, and SMFDMI for the cross-sectional and cohort analyses. Supplementary Table S2. The characteristics of participants in the cross-sectional study. Supplementary Table S3. Association of ASMI, BFP, TG, HDL-C, and SMFDMI with CVD by logistic regression models. Supplementary Table S4. Distribution of participants and incident CVD events across SMFDMI ranges used in the restricted cubic spline analysis. Supplementary Table S5. Incremental prognostic performance of SMFDMI and related indices for incident CVD. Supplementary Table S6. Subgroup analyses of the association between SMFDMI and CVD stratified by chronic diseases. Supplementary Table S7. Sensitivity analysis comparing sex-specific quintiles of SMFDMI and Z-SMFDMI in relation to incident CVD. Supplementary Table S8. Sensitivity analysis of the association between SMFDMI and incident CVD with additional adjustment for BMI. Supplementary Figure S1. Dose–response associations for ASMI, BFP, TG, HDL-C and SMFDMI with CVD. Supplementary Figure S2. Covariate-adjusted ROC analysis of ASMI, BFP, TG, HDL-C and SMFDMI for CVD. Supplementary Figure S3. Internal calibration plots for the Cox base model and the SMFDMI-extended model at four years.
Author Contributions
Conceptualization, S.L.; methodology, S.L., Z.Q., N.B.F., W.C.W.W. and E.Y.F.W.; software, Z.Q.; validation, H.Y. and H.W. (Hao Wang); formal analysis, Z.Q.; investigation, S.L.; data curation, Z.Q.; writing—original draft preparation, Z.Q.; writing—review and editing, S.L., N.B.F., W.C.W.W., E.Y.F.W. and H.W. (Hao Wu); visualization, H.Y., H.W. (Hao Wang) and H.W. (Hao Wu); supervision, S.L.; project administration, S.L. and H.W. (Hao Wu); funding acquisition, S.L. All authors have read and agreed to the published version of the manuscript.
Funding
This research was funded by the Beijing Municipal Health Commission, grant number Key Discipline Member-02-44.
Institutional Review Board Statement
Ethical review and approval were waived for this study because it is a secondary analysis based on the China Health and Retirement Longitudinal Study (CHARLS), a publicly available cohort dataset. The original CHARLS was conducted in accordance with the Declaration of Helsinki and approved by the Biomedical Ethics Committee of Peking University (IRB 00001052-11015 for household survey and anthropometric measurement; IRB 00001052-11014 for biomarker collection, Approval Date: 17 January 2011).
Informed Consent Statement
Patient consent was waived because our study only utilized publicly available cohort datasets (CHARLS). We did not directly recruit participants nor collect any primary data ourselves.
Data Availability Statement
The datasets analyzed in this study are publicly available from the official websites of the China Health and Retirement Longitudinal Study (CHARLS, https://charls.pku.edu.cn (accessed on 3 November 2026)), subject to registration and approval by the corresponding data custodians. No new data were generated in this study. The analytic code is available from the corresponding author upon reasonable request.
Acknowledgments
We express our sincere gratitude to the CHARLS research team for granting access to the demographic, health status, and biomarker datasets employed in the present study, as well as to all CHARLS participants for their invaluable contributions to this research.
Conflicts of Interest
The authors declare no conflicts of interest. The funders had no role in the design of the study; in the collection, analyses, or interpretation of data; in the writing of the manuscript; or in the decision to publish the results.
Abbreviations
The following abbreviations are used in this manuscript:
| AIC | Akaike Information Criterion |
| ASM | Appendicular skeletal muscle mass |
| ASMI | Appendicular skeletal muscle mass index |
| AUC | Area under the curve |
| AWGS | Asian Working Group for Sarcopenia |
| BFP | Body fat percentage |
| BMI | Body mass index |
| CHARLS | China Health and Retirement Longitudinal Study |
| CI | Confidence interval |
| CVD | Cardiovascular disease |
| HbA1c | Glycated hemoglobin |
| HDL-C | High-density lipoprotein cholesterol |
| HR | Hazard ratio |
| IRB | Institutional Review Board |
| LDL-C | Low-density lipoprotein cholesterol |
| OR | Odds ratio |
| RCS | Restricted cubic spline |
| ROC | Receiver operating characteristic |
| SD | Standard deviation |
| SMFDMI | Skeletal muscle-fat distribution metabolic index |
| TG | Triglycerides |
References
- Mensah, G.A.; Fuster, V.; Murray, C.J.L.; Roth, G.A. Global Burden of Cardiovascular Diseases and Risks Collaborators. Global Burden of Cardiovascular Diseases and Risks, 1990-2022. J. Am. Coll. Cardiol. 2023, 82, 2350–2473. [Google Scholar] [CrossRef] [Scilit] [PubMed]
- Hu, S.-S. Writing Committee of the Report on Cardiovascular Health and Diseases in China. Epidemiology and Current Management of Cardiovascular Disease in China. J. Geriatr. Cardiol. 2024, 21, 387–406. [Google Scholar] [CrossRef] [Scilit] [PubMed]
- Hu, S.-S. Epidemiology and Current Management of Cerebrovascular Disease in China. J. Geriatr. Cardiol. 2024, 21, 465–474. [Google Scholar] [CrossRef] [Scilit] [PubMed]
- Arnett, D.K.; Blumenthal, R.S.; Albert, M.A.; Buroker, A.B.; Goldberger, Z.D.; Hahn, E.J.; Himmelfarb, C.D.; Khera, A.; Lloyd-Jones, D.; McEvoy, J.W.; et al. 2019 ACC/AHA Guideline on the Primary Prevention of Cardiovascular Disease: A Report of the American College of Cardiology/American Heart Association Task Force on Clinical Practice Guidelines. Circulation 2019, 140, e596–e646, Erratum in Circulation 2019, 140, e649–e650. https://doi.org/10.1161/CIR.0000000000000725. Erratum in Circulation 2020, 141, e60. https://doi.org/10.1161/CIR.0000000000000755. Erratum in Circulation 2020, 141, e774. https://doi.org/10.1161/CIR.0000000000000771. [Google Scholar] [CrossRef] [Scilit] [PubMed]
- Wong, N.D.; Sattar, N. Cardiovascular Risk in Diabetes Mellitus: Epidemiology, Assessment and Prevention. Nat. Rev. Cardiol. 2023, 20, 685–695. [Google Scholar] [CrossRef] [Scilit] [PubMed]
- Scimeca, M.; Palumbo, V.; Giacobbi, E.; Servadei, F.; Casciardi, S.; Cornella, E.; Cerbara, F.; Rotondaro, G.; Seghetti, C.; Scioli, M.P.; et al. Impact of the Environmental Pollution on Cardiovascular Diseases: From Epidemiological to Molecular Evidence. Heliyon 2024, 10, e38047. [Google Scholar] [CrossRef] [Scilit] [PubMed]
- Faria, A.; Macedo, A.; Castro, C.; Valle, E.; Lacerda, R.; Ayas, N.; Laher, I. Impact of Sleep Apnea and Treatments on Cardiovascular Disease. Sleep. Sci. 2022, 15, 250–258. [Google Scholar] [CrossRef] [Scilit] [PubMed]
- Anagnostou, D.; Theodorakis, N.; Hitas, C.; Kreouzi, M.; Pantos, I.; Vamvakou, G.; Nikolaou, M. Sarcopenia and Cardiogeriatrics: The Links Between Skeletal Muscle Decline and Cardiovascular Aging. Nutrients 2025, 17, 282. [Google Scholar] [CrossRef] [Scilit] [PubMed]
- Gowri S, M.; Antonisamy, B.; Geethanjali, F.S.; Thomas, N.; Jebasingh, F.; Paul, T.V.; Karpe, F.; Osmond, C.; Fall, C.H.D.; Vasan, S.K. Distinct Opposing Associations of Upper and Lower Body Fat Depots with Metabolic and Cardiovascular Disease Risk Markers. Int. J. Obes. 2021, 45, 2490–2498. [Google Scholar] [CrossRef] [Scilit] [PubMed]
- Qiu, Z.; Lee, D.H.; Lu, Q.; Li, R.; Zhu, K.; Li, L.; Li, R.; Pan, A.; Giovannucci, E.L.; Liu, G. Associations of Regional Body Fat With Risk of Cardiovascular Disease and Mortality Among Individuals With Type 2 Diabetes. J. Clin. Endocrinol. Metab. 2025, 110, e372–e381. [Google Scholar] [CrossRef] [Scilit] [PubMed]
- Zhuang, Z.; Yao, M.; Wong, J.Y.Y.; Liu, Z.; Huang, T. Shared Genetic Etiology and Causality between Body Fat Percentage and Cardiovascular Diseases: A Large-Scale Genome-Wide Cross-Trait Analysis. BMC Med. 2021, 19, 100. [Google Scholar] [CrossRef] [Scilit] [PubMed]
- Martin, S.; Cule, M.; Basty, N.; Tyrrell, J.; Beaumont, R.N.; Wood, A.R.; Frayling, T.M.; Sorokin, E.; Whitcher, B.; Liu, Y.; et al. Genetic Evidence for Different Adiposity Phenotypes and Their Opposing Influences on Ectopic Fat and Risk of Cardiometabolic Disease. Diabetes 2021, 70, 1843–1856. [Google Scholar] [CrossRef] [Scilit] [PubMed]
- Tian, X.; Qu, Z.; Yang, X.; Cao, Y.; Zhang, B. Synergistic Effects of Body Fat Percentage and C-Reactive Protein Triglyceride-Glucose Index on Cardiovascular Disease Risk: A Chinese Cohort Study. Sci. Rep. 2025, 15, 40266. [Google Scholar] [CrossRef] [Scilit] [PubMed]
- Matar, D.B.; Elahi, M.A.; Sukkarieh, H.; Nassar, W.K.; Aljada, A. Unlocking the Secrets: Adipose Tissue Dysfunction and Atherosclerosis-Mechanisms and Innovative Therapeutic Approaches. Atherosclerosis 2025, 408, 120424. [Google Scholar] [CrossRef] [Scilit] [PubMed]
- Huang, Y.; Hu, Y.; Bao, B. Relationship of Body Mass Index and Visceral Fat Area Combination with Arterial Stiffness and Cardiovascular Risk in Cardiovascular Disease-Free People: NHANES (2011-2018). Endocr. Connect. 2023, 12, e230291. [Google Scholar] [CrossRef] [Scilit] [PubMed]
- Yi, J.; Chen, J.; Yao, X.; Zhao, Z.; Niu, X.; Li, X.; Sun, J.; Ji, Y.; Shang, T.; Gong, L.; et al. Myokine-Mediated Muscle-Organ Interactions: Molecular Mechanisms and Clinical Significance. Biochem. Pharmacol. 2025, 242, 117326. [Google Scholar] [CrossRef] [Scilit] [PubMed]
- Bi, B.; Dong, X.; Yan, M.; Zhao, Z.; Liu, R.; Li, S.; Wu, H. Dyslipidemia Is Associated with Sarcopenia of the Elderly: A Meta-Analysis. BMC Geriatr. 2024, 24, 181. [Google Scholar] [CrossRef] [Scilit] [PubMed]
- Li, S.; Wang, Y.; Li, L.; Wu, H. The Relationship Between Sleep Disorders and Combination of Diabetes and Sarcopenia in Adults Aged 45 Years or Older: 10-Year Nationwide Prospective Cohort Study. JMIR Aging 2025, 8, e66372. [Google Scholar] [CrossRef] [Scilit] [PubMed]
- Damluji, A.A.; Alfaraidhy, M.; AlHajri, N.; Rohant, N.N.; Kumar, M.; Al Malouf, C.; Bahrainy, S.; Ji Kwak, M.; Batchelor, W.B.; Forman, D.E.; et al. Sarcopenia and Cardiovascular Diseases. Circulation 2023, 147, 1534–1553. [Google Scholar] [CrossRef] [Scilit] [PubMed]
- Chong, H.W.; Son, J.; Chae, C.; Jae, C. The Relationship between Skeletal Muscle Mass and the KOSHA Cardiovascular Risk in Obese Male Workers. Ann. Occup. Environ. Med. 2023, 35, e40. [Google Scholar] [CrossRef] [Scilit] [PubMed]
- Kim, D.; Lee, J.; Park, R.; Oh, C.-M.; Moon, S. Association of Low Muscle Mass and Obesity with Increased All-Cause and Cardiovascular Disease Mortality in US Adults. J. Cachexia Sarcopenia Muscle 2024, 15, 240–254. [Google Scholar] [CrossRef] [Scilit] [PubMed]
- Tyrovolas, S.; Panagiotakos, D.; Georgousopoulou, E.; Chrysohoou, C.; Tousoulis, D.; Haro, J.M.; Pitsavos, C. Skeletal Muscle Mass in Relation to 10 Year Cardiovascular Disease Incidence among Middle Aged and Older Adults: The ATTICA Study. J. Epidemiol. Community Health 2020, 74, 26–31. [Google Scholar] [CrossRef] [Scilit] [PubMed]
- Borén, J.; Chapman, M.J.; Krauss, R.M.; Packard, C.J.; Bentzon, J.F.; Binder, C.J.; Daemen, M.J.; Demer, L.L.; Hegele, R.A.; Nicholls, S.J.; et al. Low-Density Lipoproteins Cause Atherosclerotic Cardiovascular Disease: Pathophysiological, Genetic, and Therapeutic Insights: A Consensus Statement from the European Atherosclerosis Society Consensus Panel. Eur. Heart J. 2020, 41, 2313–2330. [Google Scholar] [CrossRef] [Scilit] [PubMed]
- Mach, F.; Baigent, C.; Catapano, A.L.; Koskinas, K.C.; Casula, M.; Badimon, L.; Chapman, M.J.; De Backer, G.G.; Delgado, V.; Ference, B.A.; et al. 2019 ESC/EAS Guidelines for the Management of Dyslipidaemias: Lipid Modification to Reduce Cardiovascular Risk. Eur. Heart J. 2020, 41, 111–188, Corrigendum in Eur. Heart J. 2020, 41, 4255. https://doi.org/10.1093/eurheartj/ehz826. [Google Scholar] [CrossRef] [Scilit] [PubMed]
- Zderic, T.W.; Hamilton, M.T. Physical Inactivity Amplifies the Sensitivity of Skeletal Muscle to the Lipid-Induced Downregulation of Lipoprotein Lipase Activity. J. Appl. Physiol. 2006, 100, 249–257. [Google Scholar] [CrossRef] [Scilit] [PubMed]
- Wen, X.; Wang, M.; Jiang, C.-M.; Zhang, Y.-M. Anthropometric Equation for Estimation of Appendicular Skeletal Muscle Mass in Chinese Adults. Asia Pac. J. Clin. Nutr. 2011, 20, 551–556. [Google Scholar] [PubMed]
- Wang, Y.; Chen, W.; Wang, C.; Li, L.; Bi, B.; Li, S.; Wu, H. Sarcopenia Is Associated With Increased Risk of Abnormal Sleep Duration in the Older People: A 10-Year Cohort Study From China. J. Cachexia Sarcopenia Muscle 2025, 16, e70017. [Google Scholar] [CrossRef] [Scilit] [PubMed]
- Chen, L.-K.; Hsiao, F.-Y.; Akishita, M.; Assantachai, P.; Lee, W.-J.; Lim, W.S.; Muangpaisan, W.; Kim, M.; Merchant, R.A.; Peng, L.-N.; et al. A Focus Shift from Sarcopenia to Muscle Health in the Asian Working Group for Sarcopenia 2025 Consensus Update. Nat. Aging 2025, 5, 2164–2175. [Google Scholar] [CrossRef] [Scilit] [PubMed]
- Gómez-Ambrosi, J.; Silva, C.; Catalán, V.; Rodríguez, A.; Galofré, J.C.; Escalada, J.; Valentí, V.; Rotellar, F.; Romero, S.; Ramírez, B.; et al. Clinical Usefulness of a New Equation for Estimating Body Fat. Diabetes Care 2012, 35, 383–388. [Google Scholar] [CrossRef] [Scilit] [PubMed]
- Wu, X.; Hou, X.; Yin, J.; Li, Y.; Xiong, C.; Liu, H.; Meng, H. Association of a Novel Fat-Muscle-BMI Index (FMBI) with NAFLD, Liver Fibrosis, and Atherosclerotic Cardiovascular Disease Risk: A Cross-Sectional Study in 1,592 Chinese Adults. BMC Gastroenterol. 2026, 26, 501. [Google Scholar] [CrossRef] [Scilit] [PubMed]
- Liu, Z.; Ren, X.; Su, C.; Wang, G.; Liu, J. Association of Combined Cardiometabolic and Muscle Impairment Index with Cardiovascular-Kidney-Metabolic Syndrome Progression among Middle-Aged and Older Adults: A Prospective Two-Cohort Study. Health Care 2026, 14, 3228. [Google Scholar] [CrossRef] [Scilit] [PubMed]
- Wakabayashi, I.; Daimon, T. The “Cardiometabolic Index” as a New Marker Determined by Adiposity and Blood Lipids for Discrimination of Diabetes Mellitus. Clin. Chim. Acta 2015, 438, 274–278. [Google Scholar] [CrossRef] [Scilit] [PubMed]
- Zhang, A.; Quan, J.; Eggleston, K. Association between the Quality of Primary Care, Insurance Coverage, and Diabetes-Related Health Outcomes in a Cohort of Older Adults in China: Results from the China Health and Retirement Longitudinal Study. BMJ Open 2022, 12, e059756. [Google Scholar] [CrossRef] [Scilit] [PubMed]
- Global Burden of Cardiovascular Diseases and Risks 2023 Collaborators. Global, Regional, and National Burden of Cardiovascular Diseases and Risk Factors in 204 Countries and Territories, 1990-2023. J. Am. Coll. Cardiol. 2025, 86, 2167–2243. [Google Scholar] [CrossRef] [Scilit] [PubMed]
- Neumann, J.T.; de Lemos, J.A.; Apple, F.S.; Leong, D.P. Cardiovascular Biomarkers for Risk Stratification in Primary Prevention. Eur. Heart J. 2025, 46, 3823–3843. [Google Scholar] [CrossRef] [Scilit] [PubMed]
- de Bakker, M.; Gordon, B.; Shah, A.S.V.; Boersma, E.; Kimenai, D.M. Circulating Cardiovascular Biomarkers in Motion: Redefining Cardiovascular Risk with Dynamic Prediction. Eur. J. Prev. Cardiol. 2025, zwaf764. [Google Scholar] [CrossRef] [Scilit] [PubMed]
- Park, M.J.; Choi, K.M. Interplay of Skeletal Muscle and Adipose Tissue: Sarcopenic Obesity. Metabolism 2023, 144, 155577. [Google Scholar] [CrossRef] [Scilit] [PubMed]
- Hu, T.; Xu, Y.; Li, X.; Xiao, Y.; Wang, Y.; Ma, X.; Bao, Y. Optimal Skeletal Muscle Mass Index and Incident Cardiovascular Events: Insights from a Longitudinal Analysis. Eur. J. Cardiovasc. Nurs. 2025, 24, 1110–1118. [Google Scholar] [CrossRef] [Scilit] [PubMed]
- Kelly, D.M.; Jones, T.H. Testosterone: A Metabolic Hormone in Health and Disease. J. Endocrinol. 2013, 217, R25–R45. [Google Scholar] [CrossRef] [Scilit] [PubMed]
- Visseren, F.L.J.; Mach, F.; Smulders, Y.M.; Carballo, D.; Koskinas, K.C.; Bäck, M.; Benetos, A.; Biffi, A.; Boavida, J.-M.; Capodanno, D.; et al. 2021 ESC Guidelines on Cardiovascular Disease Prevention in Clinical Practice. Eur. Heart J. 2021, 42, 3227–3337. [Google Scholar] [CrossRef] [Scilit] [PubMed]
- Saeidifard, F.; Medina-Inojosa, J.R.; West, C.P.; Olson, T.P.; Somers, V.K.; Bonikowske, A.R.; Prokop, L.J.; Vinciguerra, M.; Lopez-Jimenez, F. The Association of Resistance Training with Mortality: A Systematic Review and Meta-Analysis. Eur. J. Prev. Cardiol. 2019, 26, 1647–1665. [Google Scholar] [CrossRef] [Scilit] [PubMed]
- Chinese Society of Cardiology of Chinese Medical Association; Cardiovascular Disease Prevention and Rehabilitation Committee of Chinese Association of Rehabilitation Medicine; Cardiovascular Disease Committee of Chinese Association of Gerontology and Geriatrics; Thrombosis Prevention and Treatment Committee of Chinese Medical Doctor Association. Chinese Guideline on the Primary Prevention of Cardiovascular Diseases. Zhonghua Xin Xue Guan Bing Za Zhi 2020, 48, 1000–1038. [Google Scholar] [CrossRef] [PubMed]
- Damigou, E.; Kouvari, M.; Panagiotakos, D. The Role of Skeletal Muscle Mass on Cardiovascular Disease Risk: An Emerging Role on Modulating Lipid Profile. Curr. Opin. Cardiol. 2023, 38, 352–357. [Google Scholar] [CrossRef] [Scilit] [PubMed]
- Wang, Y.; Pan, L.; Wan, S.; Yihuo, W.; Yang, F.; Li, Z.; Yong, Z.; Shan, G. Body Fat and Muscle Were Associated with Metabolically Unhealthy Phenotypes in Normal Weight and Overweight/Obesity in Yi People: A Cross-Sectional Study in Southwest China. Front. Public Health 2022, 10, 1020457. [Google Scholar] [CrossRef] [Scilit] [PubMed]
- Buckinx, F.; Landi, F.; Cesari, M.; Fielding, R.A.; Visser, M.; Engelke, K.; Maggi, S.; Dennison, E.; Al-Daghri, N.M.; Allepaerts, S.; et al. Pitfalls in the Measurement of Muscle Mass: A Need for a Reference Standard. J. Cachexia Sarcopenia Muscle 2018, 9, 269–278. [Google Scholar] [CrossRef] [Scilit] [PubMed]
- Ponti, F.; Santoro, A.; Mercatelli, D.; Gasperini, C.; Conte, M.; Martucci, M.; Sangiorgi, L.; Franceschi, C.; Bazzocchi, A. Aging and Imaging Assessment of Body Composition: From Fat to Facts. Front. Endocrinol. 2019, 10, 861. [Google Scholar] [CrossRef] [Scilit] [PubMed]

Disclaimer/Publisher’s Note: The statements, opinions and data contained in all publications are solely those of the individual author(s) and contributor(s) and not of MDPI and/or the editor(s). MDPI and/or the editor(s) disclaim responsibility for any injury to people or property resulting from any ideas, methods, instructions or products referred to in the content. |
© 2026 by the authors. Licensee MDPI, Basel, Switzerland. This article is an open access article distributed under the terms and conditions of the Creative Commons Attribution (CC BY) license.