


Abstract
Early detection of foliar diseases in potato crops remains challenging in real-world agricultural settings because symptoms can be similar and field images present challenges (weather, illumination, orientation, scale, blur, etc.). Although deep learning models have shown promising results in leaf disease detection in agricultural images, comparisons between modern lightweight convolutional neural network (CNN) architectures and attention-based mechanisms (Transformers) for potato crops remain limited, especially for local inference on edge computing devices. This study experimentally compares lightweight YOLO26 (CNN-based) and RT-DETRv2 (Transformer-based) object detectors under a common training and evaluation protocol for leaf-level detection and classification of four potato leaf classes: Healthy leaf, Early blight, Late blight, and Septoria leaf spot. These diseases exhibit noticeable symptoms in the foliage, distinguishable in the visible spectrum. These conditions generate irregular and asymmetric visual patterns on the leaf surface, making them difficult to detect under varying lighting and environmental conditions. The models were trained on the PyTorch framework using the CRISP-DM methodology on a hybrid dataset of 3060 RGB images, consisting of 2152 public images from the PlantVillage dataset and 908 custom images collected from agricultural plots in the Carchi province of Ecuador. The images were annotated with leaf-level bounding boxes using the Roboflow software. The task was formulated as leaf-level disease detection, where each bounding box represents a complete leaf assigned to a single diagnostic class. Among the evaluated configurations, YOLO26n provided the most favorable observed balance between predictive performance and computational efficiency, achieving 98.89% mAP50, 98.05% mAP50-95, 96.99% precision, and 95.76% recall, with a GPU inference time of 5.06 ms. The evaluated RT-DETRv2 configurations achieved competitive detection performance but required greater computational resources and higher inference latency. The YOLO26n model turned out to be comparable to some existing works and was therefore exported to TensorFlow Lite and integrated into a mobile application called CultivoScan, published on the Google Play Store. The application performs inference locally on Android devices, without relying on an external server, making it suitable as technological support for the visual identification of foliar diseases in potato crops in real-world agricultural contexts.
1. Introduction
The detection of foliar diseases in crops is a fundamental process for the early identification of alterations or visible symptoms in the leaves, such as spots, necrosis, yellowing, or deformations, associated with the presence of pathogens [1]. In agriculture, its importance lies in its ability to detect problems early, apply timely treatments, and reduce economic losses. Potato cultivation is a significant agricultural activity in various regions of the world, including the highlands of Ecuador. However, its productivity can also be significantly affected by various foliar diseases that reduce crop quality and yield in local production [2]. The identification of foliar diseases often relies on visual observation and farmers’ experience, which can lead to manual, imprecise, and delayed diagnoses when symptoms are similar across different pathologies [3].
In this context, computer vision and deep learning models represent a technological alternative to support visual diagnosis in various application domains, from medicine [4,5], forecasting [6], livestock [7] and agriculture [8,9,10,11,12], an area that motivates us in this study. Specifically, object detection allows us to locate regions of interest in an image and associate them with a specific class, which is useful, in our case, for analyzing potato plant leaves affected by visible symptoms. The detected object is the complete potato leaf rather than an individual lesion. Thus, the proposed task combines leaf localization with leaf-level disease classification.
Several studies have shown that analyzing plant leaf images allows us to identify patterns associated with spots, color changes, and visible lesions, thus facilitating the development of automated systems to support agricultural diagnostics [13]. Detecting specific disease types instead of a single generic disease class is essential for precision agriculture, as it enables targeted interventions, selective removal of infected leaves or plants, and site-specific treatments. In addition, accurate detection and spatial mapping of disease distribution support smart farming by optimizing resource use and improving crop health management through computer vision technologies [14].
Deep learning models based on convolutional neural networks, such as YOLO (You Only Look Once), have demonstrated adequate performance in real-time detection tasks, thanks to their ability to balance accuracy and inference speed across various agricultural scenarios [15]. On the other hand, architectures based on Transformers, such as RT-DETR (Real-Time DEtection TRansformer), allow contrasting the detection capacity, computational cost, and efficiency in scenarios oriented to mobile deployment or edge computing [16].
This study aims to develop and experimentally validate a lightweight, leaf-level detection and mobile deployment strategy for potato foliar diseases, integrating model adaptation, controlled comparisons of CNN- and Transformer-based detectors, computational efficiency analysis, and on-device inference on resource-constrained Android devices. Within this framework, lightweight YOLO26 [17] and RT-DETRv2 [18] architectures were evaluated under a common experimental protocol to determine the most suitable configuration for local mobile inference.
This study considers four classes: three foliar diseases (early blight, late blight, and Septoria leaf spot) and a reference category (healthy leaf). We selected these diseases because they are prevalent in samples collected in Carchi province (Ecuador) and show visible symptoms on potato foliage [19]. Furthermore, the Septoria class is scarce or nonexistent in public datasets (such as in PlantVillage). Thus, we constructed a hybrid dataset from public and custom images collected under controlled conditions. This dataset was prepared, annotated, and used in various experimental configurations of deep learning models. This hybrid dataset is publicly shared for academic and research purposes.
YOLO26 and RT-DETRv2 were selected because they represent two contemporary and complementary detection paradigms with practical relevance for real-time applications. YOLO26 provides lightweight CNN-based variants optimized for low-latency inference, whereas RT-DETRv2 represents an end-to-end Transformer-based detector designed to balance accuracy and computational efficiency. Their joint evaluation therefore allows comparison between different architectural strategies under the same agricultural application scenario. All models were trained and evaluated experimentally using the same hybrid dataset, dataset partitions, computational environment, and evaluation metrics; therefore, the reported comparison is based on original experiments rather than external benchmark results.
Additionally, the best resulting model was exported to TensorFlow Lite and integrated into a mobile application. This application is useful in real-world agricultural contexts for performing local inferences on Android devices, following the trend of foliar diagnostics and its deployment in mobile applications [20,21].
The main contributions of this study are summarized as follows: (i) the construction of a four-class hybrid potato-leaf dataset combining PlantVillage images with locally acquired samples, including Septoria leaf spot, which is scarcely represented in public datasets; (ii) the adaptation and validation of a lightweight leaf-level detection strategy, including localization-loss adjustment, input-resolution analysis, and controlled CNN–Transformer benchmarking under identical experimental conditions, considering performance, efficiency, interpretability, and suitability for resource-constrained deployment; (iii) the export of the best model to TensorFlow Lite and its deployment in the CultivoScan mobile application, freely available on the Google Play Store.
The remainder of the manuscript is as follows: Section 2 presents related work and literature gaps. Section 3 outlines the methodology, dataset, and software used to develop this study for detecting various potato leaf diseases. Section 4 presents the main results of this study, including the model’s interpretability. Section 5 discusses related research, and the conclusions and future work are presented in Section 6.
2. Related Work
2.1. Deep Learning for the Detection of Leaf Diseases
Deep learning has been applied to the diagnosis of foliar diseases using three approaches: classification, object detection, and semantic segmentation. Classification assigns a category to the entire image, detection locates leaves or regions of interest using bounding boxes, and segmentation delimits affected areas at the pixel level. Convolutional neural networks have predominated in these tasks due to their ability to extract features of color, texture, and shape, while more recent Transformer-based architectures enable modeling of global relationships within images [13,14].
In potato crops, convolutional neural network-based solutions [22] and mobile applications have been developed to recognize foliar diseases from images [20,23], as well as approaches based on vision transformers to differentiate healthy leaves from diseased ones [19]. Although these classification models achieve favorable results, they produce a global label that does not indicate the leaf’s location or the affected regions. In contrast, detection and segmentation provide interpretable spatial information, although they require more detailed annotations and higher computational cost, aspects relevant for systems that must balance accuracy and inference efficiency in field conditions for edge computing.
2.2. Object Detection Models in Precision Agriculture
In precision agriculture, object detection localizes crops, weeds, pests, and diseases using bounding boxes, providing spatial information that global classification models do not. Two-stage detectors, such as Faster R-CNN, are geared towards fine-grained localization and incur higher resource consumption, while single-stage architectures, especially the YOLO family, aim to balance accuracy, speed, and computational cost. Recent studies have evaluated lightweight YOLO models in agricultural scenarios, including greenhouses, with small lesions, occlusions, and variable backgrounds, demonstrating their potential for real-time monitoring applications [15,24].
The newest net family, YOLO26, incorporates end-to-end inference without applying the Non-Maximum Suppression (NMS) technique, and features an architecture optimized to reduce deployment complexity on resource-constrained devices [17]. On the other hand, the RT-DETRv2 family uses an efficient hybrid encoder and a Transformer-based decoder (attention mechanisms) to process multiscale features and balance accuracy and speed [18]. However, comparative evaluations between both families of architectures in the same agricultural context remain limited when jointly considering accuracy, localization quality, computational efficiency, and the feasibility of local inference on mobile devices.
2.3. Mobile Deployment and Local Inference in Smart Agricultural Systems
Deploying computer vision and deep learning models on mobile devices enables image analysis without sending images to external servers, reducing reliance on connectivity and enabling faster response times in the field. This is particularly useful in rural areas with limited or poor-quality connectivity. In plant diagnostics, Android applications have been developed that integrate lightweight models using TensorFlow Lite and cross-platform development tools, such as Flutter, to perform local inference on images captured by users with mid-range mobile devices [20,21].
In addition, smart agricultural systems have incorporated machine vision into monitoring cameras, greenhouses, and robotic platforms to detect symptoms under variations in lighting, scale, and occlusion. However, these solutions are typically focused on controlled environments or specialized infrastructure, so there is still room for accessible mobile applications that combine disease localization, computational efficiency, and local inference on Android devices [24,25].
For isolated single-leaf images, image classification represents a simpler and potentially more lightweight alternative for mobile applications. However, classification provides only a global label, whereas object detection additionally provides explicit leaf localization through a bounding box. This spatial information is used in the mobile workflow to define the region of interest for visualization and subsequent processing and also facilitates future extension to images containing multiple leaves. Therefore, object detection was selected in this study despite its higher computational complexity.
Table 1 presents recent studies on the automated diagnosis of leaf diseases in potatoes and other similar crops. The analysis considers the evaluated crop, the diseases, the number of classes, the model architecture used, the dataset origin, the reported metrics, the deployment, and the main limitations. This organization facilitates the identification of methodological differences, technological trends, and gaps in foliar disease detection, as well as the assessment of the feasibility of their adoption.
Table 1.
Recent studies on the automated diagnosis of leaf diseases in potato crops.
Although previous studies have reported high classification or detection accuracy for potato foliar diseases, most focus either on predictive performance or on a single model family, often using public datasets acquired under controlled conditions. Few studies jointly examine model adaptation, localization accuracy, computational complexity, inference latency, interpretability, and actual mobile deployment under a unified experimental protocol. Furthermore, Septoria leaf spot remains poorly represented in commonly used public potato datasets. Therefore, the novelty of this study lies not in proposing a new neural architecture, but in integrating these methodological and deployment components into a reproducible lightweight detection pipeline specifically designed for local potato foliar disease diagnosis.
Finally, although alternative detectors remain relevant, including previous YOLO generations, this study focuses on YOLO26 and RT-DETRv2 because they provide recent representatives of lightweight convolutional and Transformer-based real-time detection approaches, respectively, which are particularly aligned with the deployment requirements of the proposed mobile application.
3. Materials and Methods
3.1. Methodological Approach
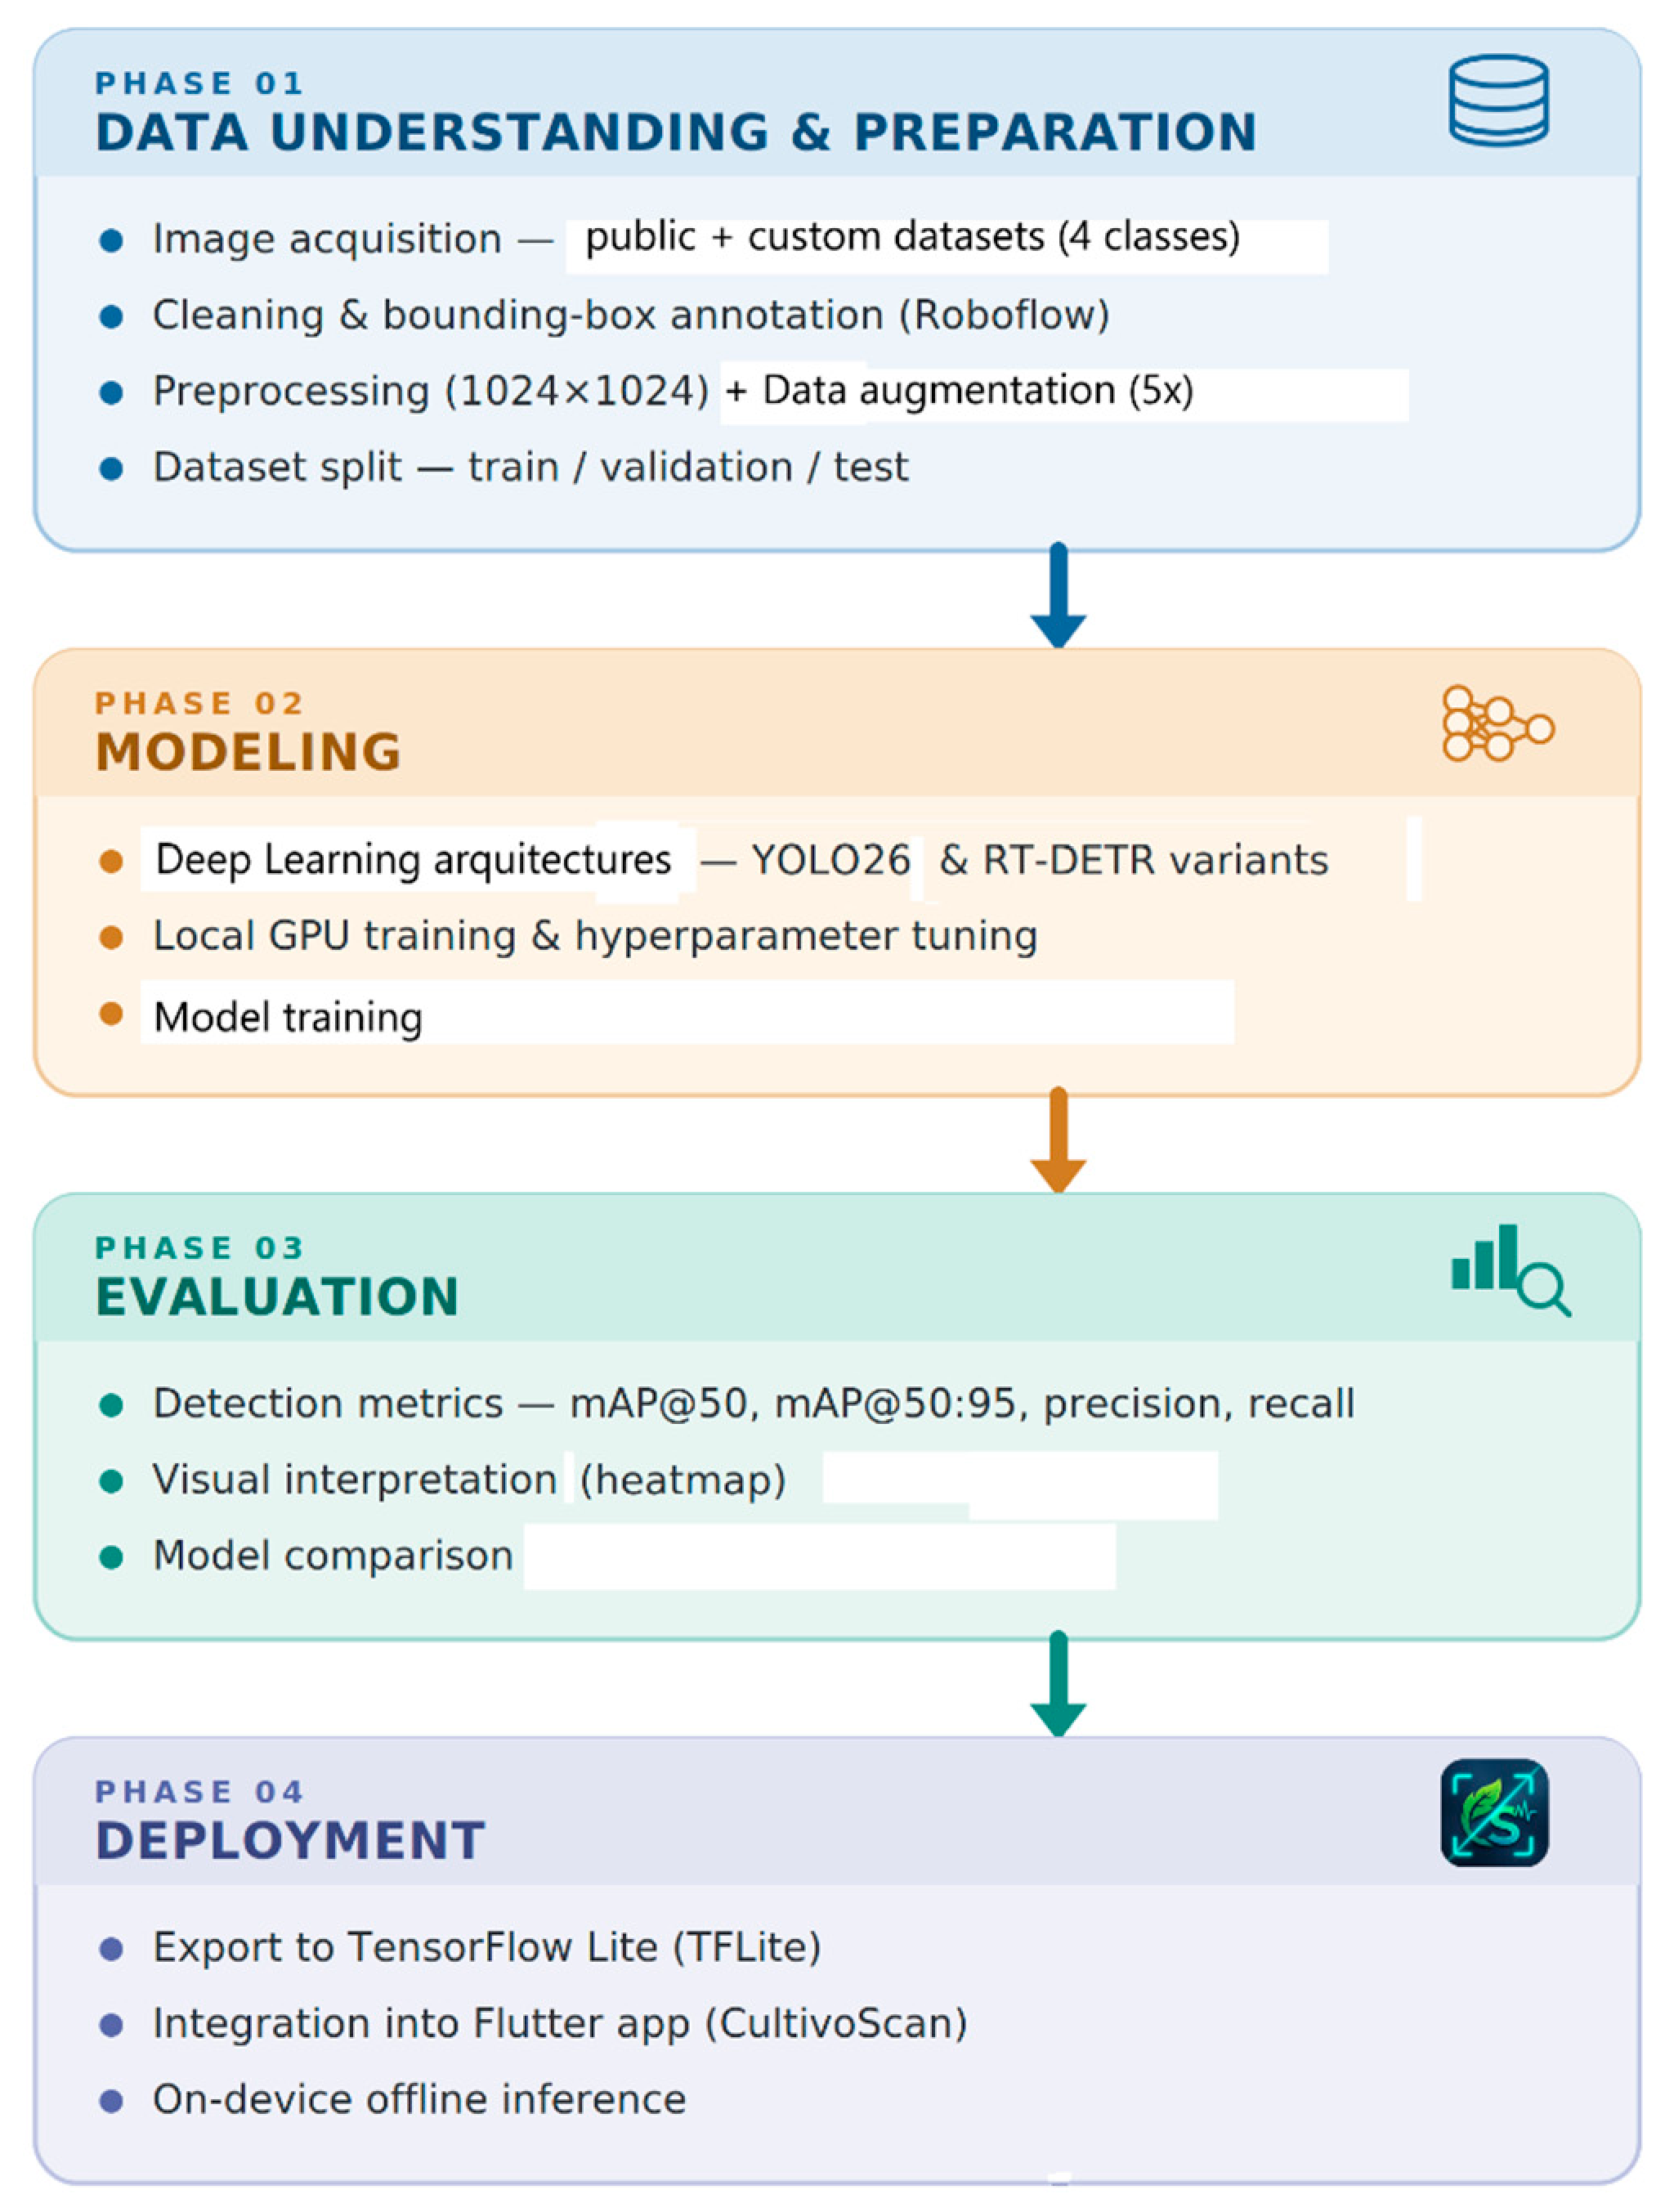
The experimental development was organized using the well-known CRISP-DM data analysis methodology [30], as a reference, structured in ordered, traceable, and reproducible phases. This methodology enabled the process to be guided from understanding the agricultural problem to preparing the dataset, training the models, evaluating the results, and deploying the best-selected model in a mobile environment [31]. The task was formulated as leaf-level object detection with disease classification, where each bounding box encloses the complete leaf and is assigned a single diagnostic class.
Thus, understanding the problem involved visually identifying leaf diseases in potato crops; the data preparation phase focused on building a hybrid dataset (public and custom), cleaning images, annotating with bounding boxes, and organizing the training, validation, and test subsets. The modeling phase involved implementing the modern YOLO26 and RT-DETRv2 architectures in various experimental configurations using the PyTorch framework 2.5.1 and Ultralytics library 8.4.41. The evaluation phase enabled comparison of model performance using quantitative metrics and visual analysis of predictions on an activation map. In the deployment phase, the best model was selected and exported as a TensorFlow Lite model for integration into the CultivoScan mobile application. Figure 1 summarizes the phases of the methodological process.
Figure 1.
Workflow of the experimental process for the detection of leaf diseases in potato crops.
3.2. Construction of the Dataset
A hybrid dataset was constructed, composed of images of potato leaves from the PlantVillage repository [32] and custom images collected from agricultural plots in the province of Carchi, Ecuador. PlantVillage is a publicly available plant-disease image dataset widely used in computer vision studies. It contains labeled images of healthy and diseased leaves from multiple crop species, generally acquired under controlled conditions with relatively uniform backgrounds.
Regarding our custom images, the acquisition protocol was based on controlled visual conditions: leaves with symptoms were photographed individually on a white background to isolate the environment. The shots were taken with natural light using an iPhone 11. To standardize the capture, the camera was positioned perpendicular to the leaf sample, at an approximate distance of 20 to 30 cm. Images were acquired with a 26 mm equivalent focal length and an aperture of f/1.8, and saved in JPG format at a resolution of 9 megapixels (2611 × 3723). Our custom dataset has been published in open access in the Zenodo repository [33] for academic and research purposes.
The hybrid dataset was organized into four classes, a reference category (Healthy Leaf) and three types of foliar diseases: early blight caused by Alternaria solani, late blight caused by Phytophthora infestans, and Septoria leaf spot produced by Septoria malagutii.
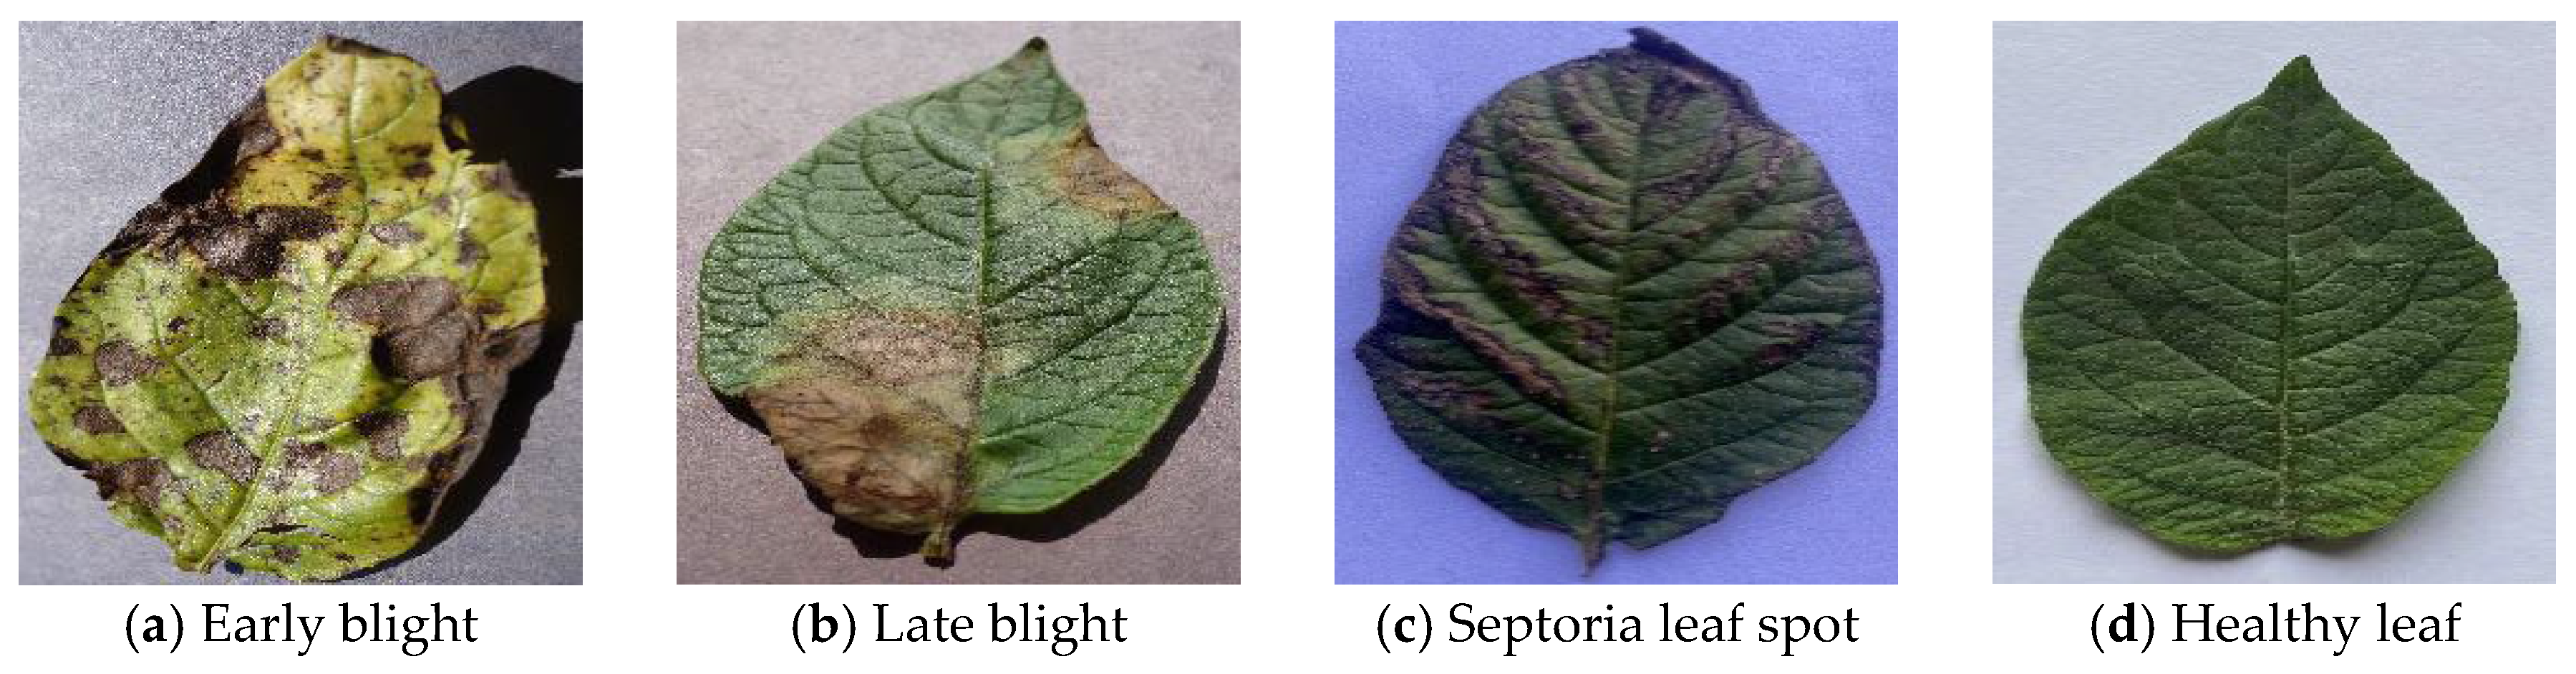
Of the 3060 images collected, 2152 (70.3%) were from PlantVillage and 908 (29.7%) were from the custom dataset. The three classes, early blight, late blight, and healthy leaf, incorporated samples from both data sources, while the Septoria leaf spot disease comprised exclusively of our own images, due to its absence in public data and because it is very common in our local agricultural context. Table 2 presents the distribution of classes in the dataset, showing an imbalance in the minority categories, Septoria and Healthy leaf. Figure 2 shows representative examples of each class analyzed.
Table 2.
Distribution of the hybrid dataset by class and origin.
Figure 2.
Representative samples of the four classes of the hybrid dataset.
Overall, PlantVillage images were used as publicly available reference samples, whereas the custom dataset was included to complement the four-class hybrid dataset described and to incorporate locally acquired disease manifestations and acquisition conditions relevant to the Ecuadorian agricultural context.
3.3. Image Preparation and Annotation
Once the dataset was collected, the images were organized by class and reviewed before model training. During this stage, blurry, duplicate, out-of-focus images, or those showing faint disease symptoms, were discarded to reduce the sample size that could negatively impact model learning. Subsequently, the dataset was loaded into the Roboflow platform, where manual annotations were made using bounding boxes in YOLO format, with the entire plant leaf as the primary unit of analysis. Each image was labeled as one of four defined classes: early blight, late blight, Septoria leaf spot, and healthy leaf. The class assignments for the custom images were reviewed with the support of agronomists. The proposed task corresponds to leaf-level object detection and disease classification rather than lesion-level detection. Individual disease lesions were not annotated separately. Consequently, the model is not intended to identify multiple co-occurring diseases within the same leaf or to quantify the proportion of affected tissue.
The dataset was divided into training, validation, and test sets with an 80/10/10 split. This split is a good balance in general, where one wants to maximize data usage for model training without sacrificing adequate validation (hyperparameter tuning) or testing of the model’s generalizability on unseen data [12]. The three subsets had strictly separated roles throughout the experimental workflow. The training subset was used to optimize model weights, whereas the validation subset was used to compare model configurations, select the input resolution, and determine the confidence operating threshold. The test subset remained independent during these decisions and was used only for the final evaluation of the selected model configuration.
Subsequently, a data augmentation process was applied to the training subset, while the validation and test subsets remained unchanged to prevent data leakage. To achieve this, the original training subset (80%, 2448 images) was expanded fivefold (5×) by applying horizontal and vertical flipping, rotation between −15° and +15°, brightness adjustment between −15% and +15%, blurring of up to 1.5 pixels, and noise reduction of up to 1% of the pixels. As a result of this process, the training dataset was expanded to 12,240 images, and the total image set increased from 3060 to 12,852. Table 3 presents the image distribution used in model training.
Table 3.
Image distribution for data subsets applying data augmentation.
Although most images in the current dataset contain a single isolated leaf and could therefore be addressed using image classification, object detection was adopted to provide explicit spatial localization of the leaf in addition to its diagnostic class. The predicted bounding box defines the region of interest used by the mobile application for visualization and subsequent image processing, while also providing a framework that can be extended to future scenarios containing multiple leaves.
3.4. Deep Learning Models
The implementation considered two types of modern architecture: CNNs and Transformers. On the one hand, the CNN variants of YOLO26 [17] are YOLO26n (nano), YOLO26s (small), and YOLO26m (medium). The YOLO26 family comprises single-stage detectors with end-to-end inference, designed to reduce post-processing (Non-Maximum Suppression, NMS) and maintain low latency. Its nano, small, and medium variants share the general architecture but differ in net scale (feature representation capacity), number of parameters, and computational cost. YOLO26n prioritizes efficiency, YOLO26s offers a balanced configuration between capacity and efficiency, and YOLO26m increases model capacity.
On the other hand, RT-DETRv2 [18] was evaluated as an end-to-end detection architecture based on Transformers. Its structure integrates a convolutional backbone, a hybrid encoder for processing multiscale features, a query selection mechanism, and a Transformer decoder that generates bounding boxes and predicted classes without requiring non-maximum suppression (NMS). The RT-DETR-S (small) and RT-DETR-L (large) variants enabled comparison of different levels of capacity and computational cost against YOLO variants [16]. Table 4 summarizes the characteristics and experimental purpose of each model.
Table 4.
Deep Learning architectures implemented based on CNNs and transformers.
3.5. Experimental Training Setup
The experiments were structured to analyze the effect of each architecture, input image resolution, optimization strategy, and adjustments to the total loss function, composed of location loss (bounding box) and classification loss (label). During preliminary experiments on the validation subset, we explored alternative loss-weight settings to balance bounding-box localization and class prediction (a strategy known as BoxGain in YOLO). Because the task focuses on detecting the entire leaf, we weighted the localization component more heavily. Based on these preliminary validation experiments, we fixed the coefficients at box = 15 and cls = 0.5 for subsequent model comparisons. We selected these values empirically and did not derive them from an exhaustive hyperparameter search.
We trained the models locally on a PC with GPU acceleration, as shown in Table 5, which presents the computational environment and the selected configuration.
Table 5.
Computational environment and training configuration of the models.
3.6. Evaluation Metrics
The performance of the models was evaluated using standard object detection metrics, considering both class-assignment accuracy and bounding-box localization quality. Precision, recall, mAP50, and mAP50-95 were used to quantitatively compare the implemented architectures.
Precision (P) is the ratio of correct positive predictions to the total positive forecasts made by the model, calculated using Equation (1), where TP denotes True-Positive, representing the number of weed samples correctly detected by the model. FP stands for False-Positive, indicating the number of incorrectly predicted weed samples.
Recall (R) measures the proportion of true-positive cases that the model correctly identifies and is calculated using Equation (2), where FN denotes the number of undetected weed samples.
The Average Precision (AP) metric combines precision and recall into a single metric, providing an overview of how well the model detects (localizes) and classifies objects in a dataset. The mean average precision (mAP) metric is the average of the APs calculated for all classes in a dataset; see Equation (3), where N is the number of classes, which is 4 in this case.
The mAP50 calculates average precision with an IoU (Intersection over Union) threshold of 0.50, while the mAP50-95 considers thresholds between 0.50 and 0.95, in increments of 0.05, providing a tighter assessment of localization [34,35]. In the present leaf-level detection task, the model must not only predict the diagnostic class but also correctly localize the complete annotated leaf. Therefore, mAP50-95 was used as the primary detection metric because it jointly reflects classification performance and the spatial agreement between predicted and reference leaf bounding boxes across increasingly strict IoU thresholds.
In addition to predictive metrics, indicators of computational efficiency and model complexity were considered. These elements allowed for the evaluation of the training time cost (hours), inference time (ms) speed (FPS), the number of parameters (millions), and the model size (MB).
3.7. Deployment of the Best Model
After the quantitative evaluation of the models, the best model was selected, exported to TensorFlow Lite, and integrated into a mobile application called CultivoScan, developed in Flutter, a cross-platform mobile application development framework created by Google, with modern interfaces and good performance [21].
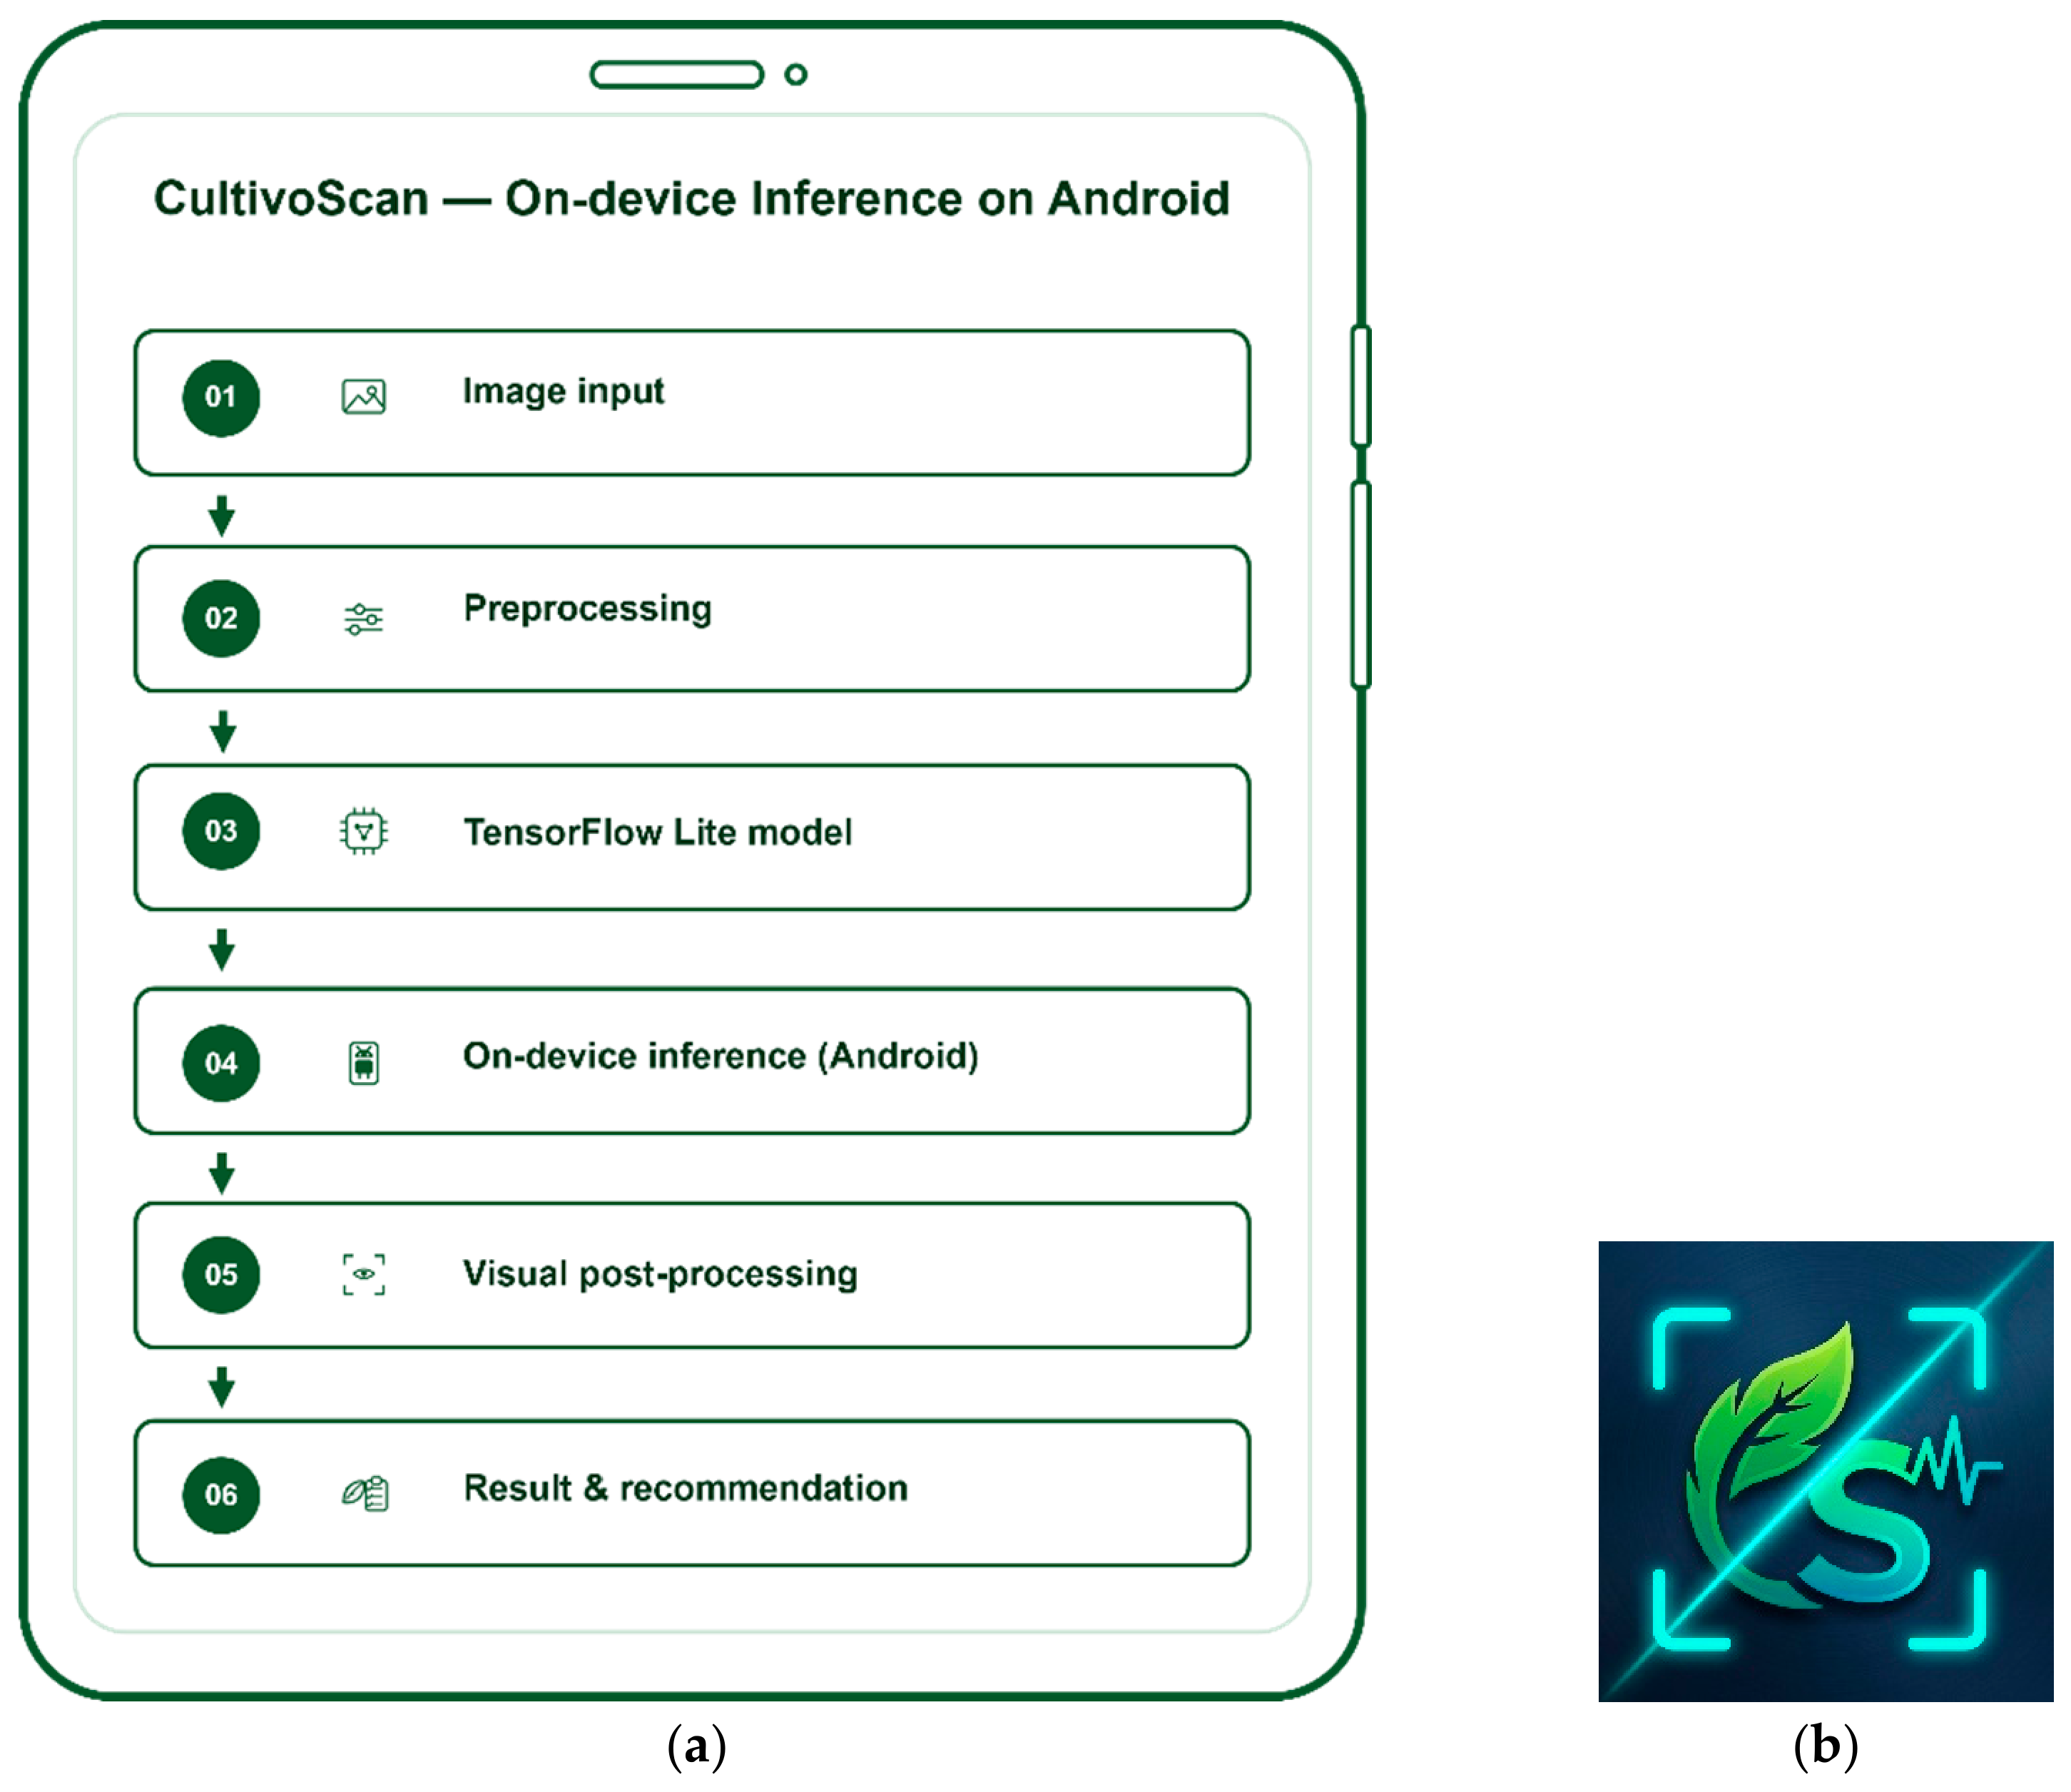
Model inference is performed locally on the Android mobile device, without sending the diagnostic image to an external server. The mobile application’s data flow includes: image acquisition, model inference, visual post-processing (heat map), location of the region of interest, identification of the foliar disease, and associated recommendations. These recommendations consist of specific treatments for the analyzed pathologies, with prescriptions validated by agronomists based on technical criteria, as shown in Figure 3.
Figure 3.
(a) Workflow of the CultivoScan mobile application with local inference. (b) CultivoScan app icon.
Table 6 presents the characteristics of the Android device used to deploy the mobile application. Finally, the CultivoScan application was published on the Google Play Store.
Table 6.
Mobile device used in the deployment of the model.
4. Results
4.1. Results of the YOLO26 and RT-DETRv2 Architectures
The trained models were evaluated to compare the behavior of the YOLO26 and RT-DETRv2 architectures using the object detection metrics mentioned: precision, recall, mAP50, mAP50-95, inference time and speed, number of parameters, and model size. The candidate architectures were compared on the validation subset to select the model configuration for final evaluation.
Table 7 summarizes the results obtained by the models during the experimental phase, with an input resolution of 1024 pixels as the initial tentative configuration. The comparison shows that the YOLO26 variants achieved a better balance between accuracy and inference speed than the RT-DETRv2 family.
Table 7.
Validation performance of the evaluated architectures at an input resolution of 1024 pixels. Results correspond to a single training run per configuration.
Among the evaluated configurations, YOLO26n showed a favorable balance between mAP50-95, inference time (197.62 FPS), model size, and number of parameters. However, because each configuration was evaluated from a single run, the small differences in predictive performance should be interpreted descriptively rather than as statistically significant superiority.
Therefore, YOLO26n was selected as the final model for integration into the CultivoScan mobile application. The good performance may be due to its lighter model design, which results in lower complexity and a reduced risk of overfitting to a relatively specific set of foliar disease images, especially if the leaf lesions in the dataset exhibit well-defined visual patterns, small sizes, or controlled variations. This demonstrates that the lighter model achieved a better balance among precision, generalizability, and fit to the visual characteristics of potato foliar diseases.
On the other hand, although the RT-DETR-S and RT-DETR-L variants achieved competitive mAP50 and mAP50-95 scores, their inference times were 4 times longer, reducing their suitability for deployment on resource-constrained mobile devices in this study. Although RT-DETRv2-S/L exhibited higher inference latency than YOLO26n, these configurations also have substantially greater model complexity. Therefore, the observed latency differences should be interpreted as differences between the evaluated model configurations rather than as evidence of intrinsic superiority of one architectural family over another.
4.2. Analysis of the Effect of Image Input Resolution
To analyze the influence of the decrease in input size, the selected architecture (YOLO26n) and the validation dataset were kept constant, and resolutions of 1024, 800, and 640 pixels were evaluated. Therefore, the observed differences are mainly attributed to variations in the spatial information available for recognizing foliar disease symptoms and locating leaves. Table 8 presents the results obtained by decreasing the image input resolutions.
Table 8.
Validation performance of YOLO26n at different input resolutions.
The results showed that 1024 pixels achieved the highest validation Recall, F1-score, mAP50, and mAP50-95, and was therefore selected as the final input resolution before evaluation on the independent test set.
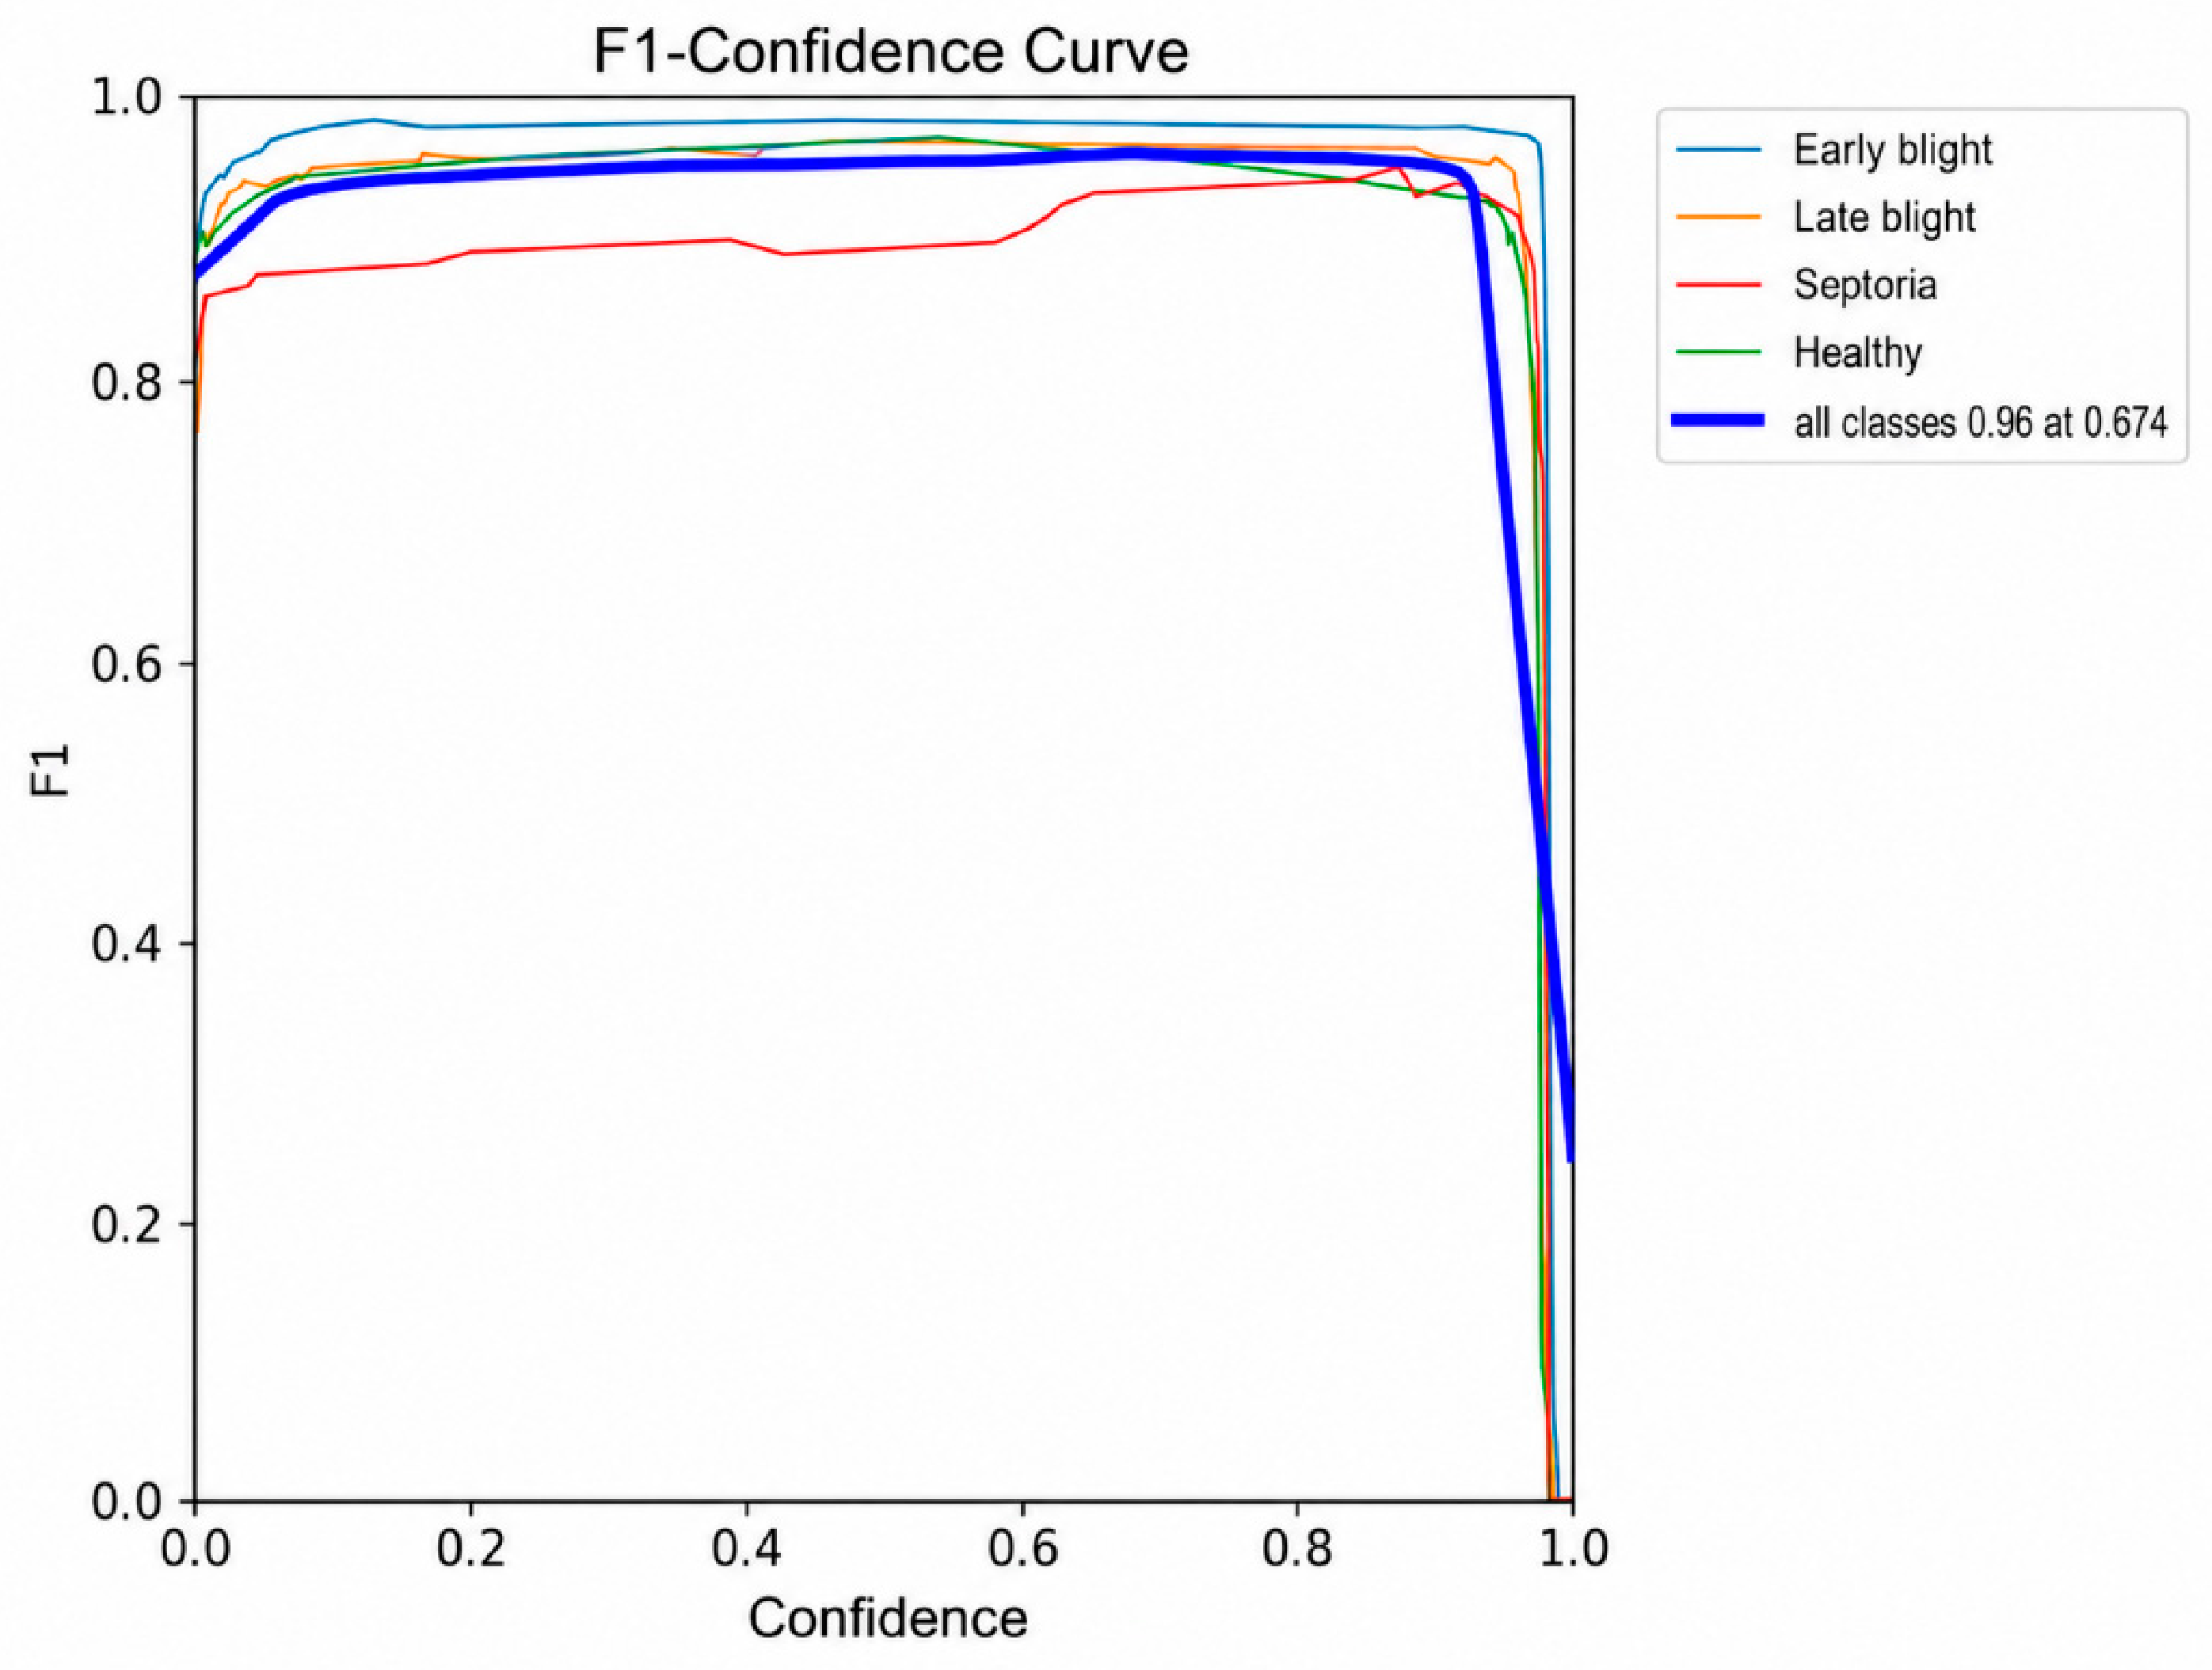
Additionally, the validation F1–Confidence curve was used to select the operating confidence threshold. Figure 4 provides a reference for the optimal balance between precision and recall as a function of the prediction threshold, indicating that the model achieved an overall F1 of 0.96 in all classes, with a confidence threshold of 0.674. This value represents the ideal operating point of the detector, where correct leaf-level detections are maximized, while false positives are minimized.
Figure 4.
F1–Confidence curve of the YOLO26n model on the validation set used to determine the operating confidence threshold.
Based on the validation set, YOLO26n with an input resolution of 1024 pixels and a confidence threshold of 0.674 was established as the final configuration. These settings were fixed before evaluation on the independent test set.
4.3. Analysis of the Chosen Model
Based on the aforementioned experimental comparison, the YOLO26n model, with an input resolution of 1024 pixels, was selected as the final configuration, suitable for performing local inference on Android devices. Table 9 summarizes the main technical characteristics and final performance of the YOLO26n model on the test set.
Table 9.
Final performance and technical characteristics of the selected YOLO26n model on the test set (306 images).
4.4. Results by Class of the Chosen Model
The performance of the YOLO26n model was analyzed by class, and its consistency across the four categories of the test set was assessed (see Table 10). Using the strictest metric, mAP50-95, the Early blight class achieved the highest value, 99.05%, followed by Healthy leaf at 98.63%, Septoria leaf spot at 97.68%, and Late blight at 96.90%. All categories demonstrated adequate detection capacity in the test set. Although the Late blight class was the most represented in the dataset (35.03%), it paradoxically achieved the lowest mAP50-95, possibly due to the high morphological variability of its symptoms, their visual similarity to other foliar diseases, and the heterogeneous distribution of symptomatic patterns within the annotated leaf region.
Table 10.
Class-wise performance of the selected YOLO26n model on the test set.
However, these class-wise results were obtained from the hybrid test set and should be interpreted in light of the unequal source composition of the classes, particularly because Septoria leaf spot contains only custom images; therefore, the reported performance does not demonstrate source-independent generalization.
4.5. Confusion Matrix Analysis of the YOLO26n Model
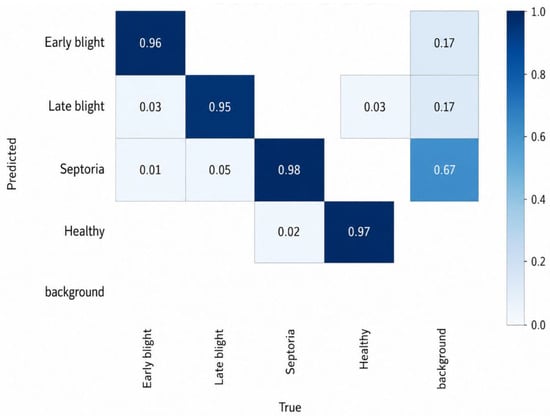
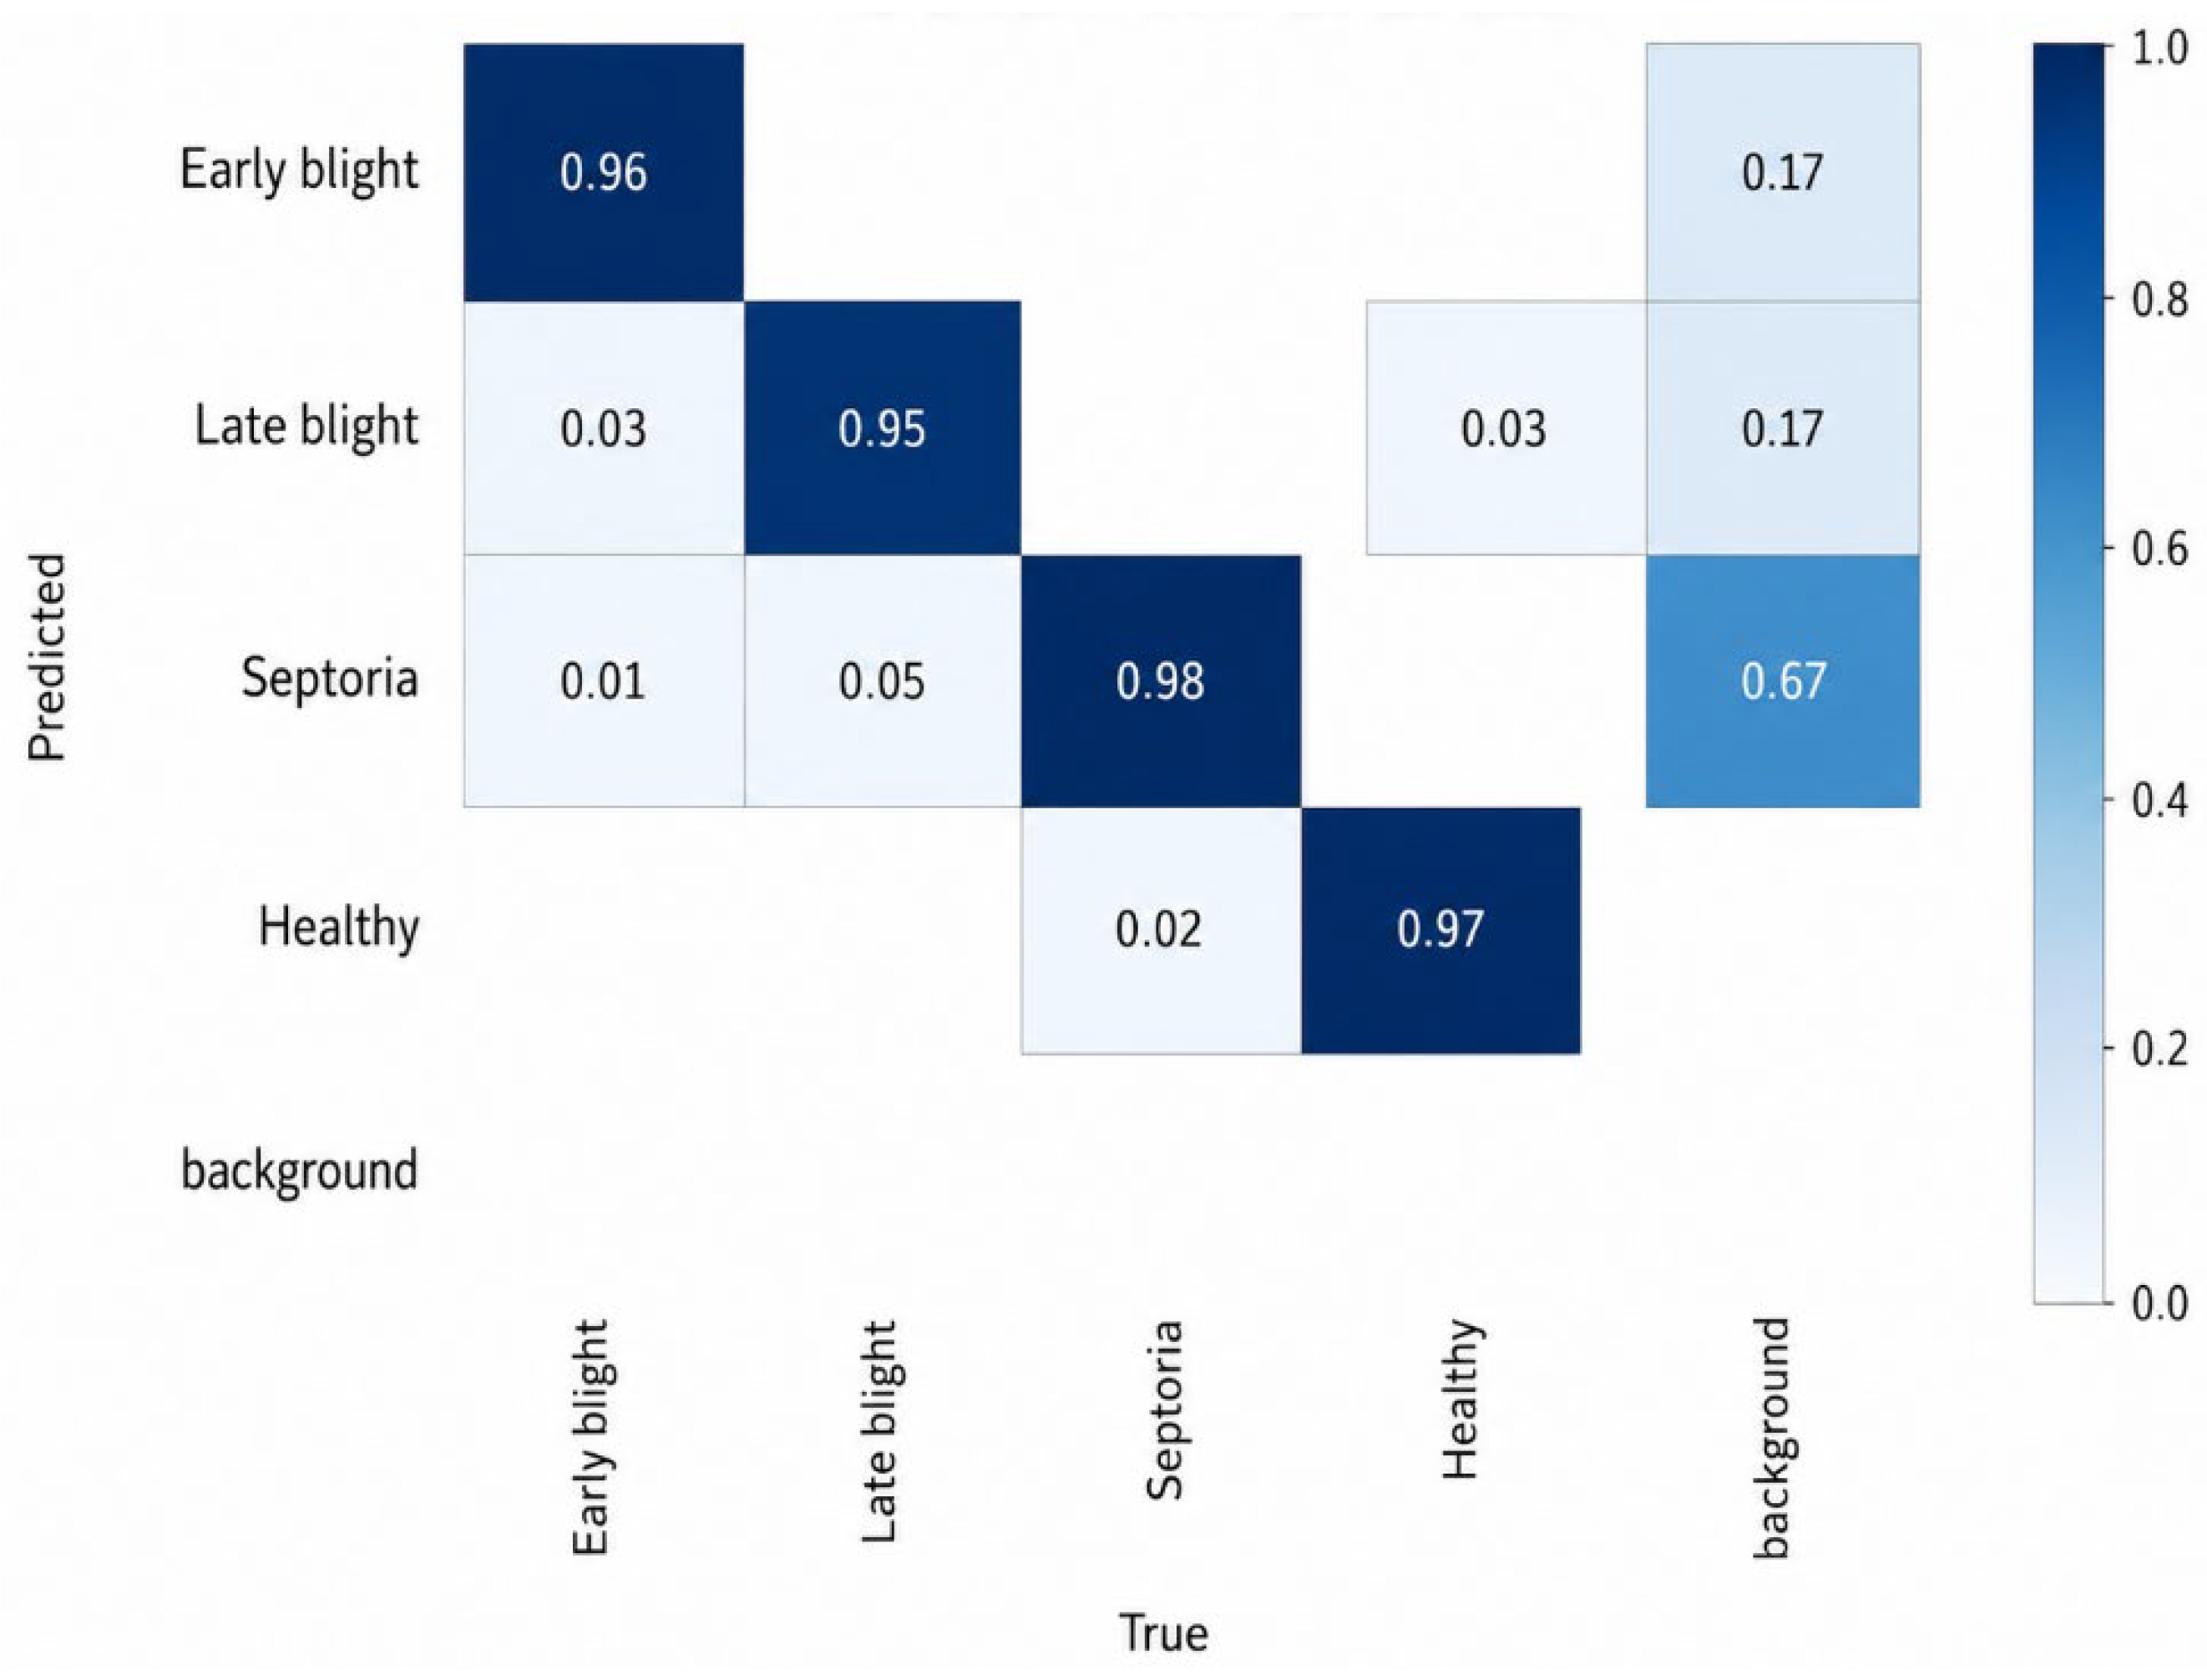
To complement the quantitative results on the test set, the normalized confusion matrix for the YOLO26n model was analyzed. This matrix allows comparison of the proportional distributions of hits and misses across the classes (see Figure 5). The high values on the main diagonal indicate consistent recognition of the four classes analyzed.
Figure 5.
Normalized confusion matrix of the selected YOLO26n model on the test set.
The background class, automatically incorporated into the normalized confusion matrix, represents errors inherent in object detection, such as false positives in unannotated regions, real objects not detected, and predictions whose locations do not sufficiently match the real bounding boxes. Thus, background is not an actual crop class, but an auxiliary category for analyzing detection errors. Since the rows correspond to the model’s predictions and the columns to the actual labels, the values in the background column indicate false positives—that is, detections generated by the model in regions without actual annotation. The highest value of 0.67 indicates that the model has a greater tendency to generate false positives in the Septoria class, suggesting visual confusion between the symptoms of this pathology and external factors such as background patterns, unlabeled spots, or image noise.
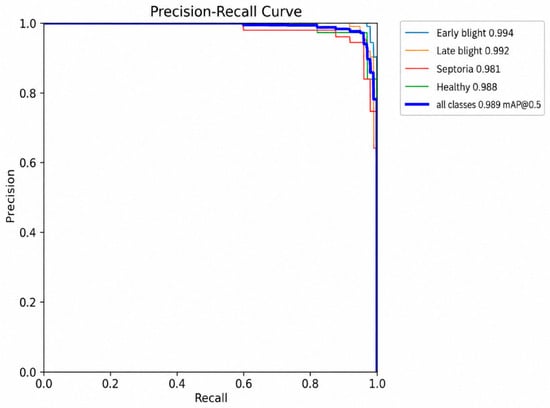
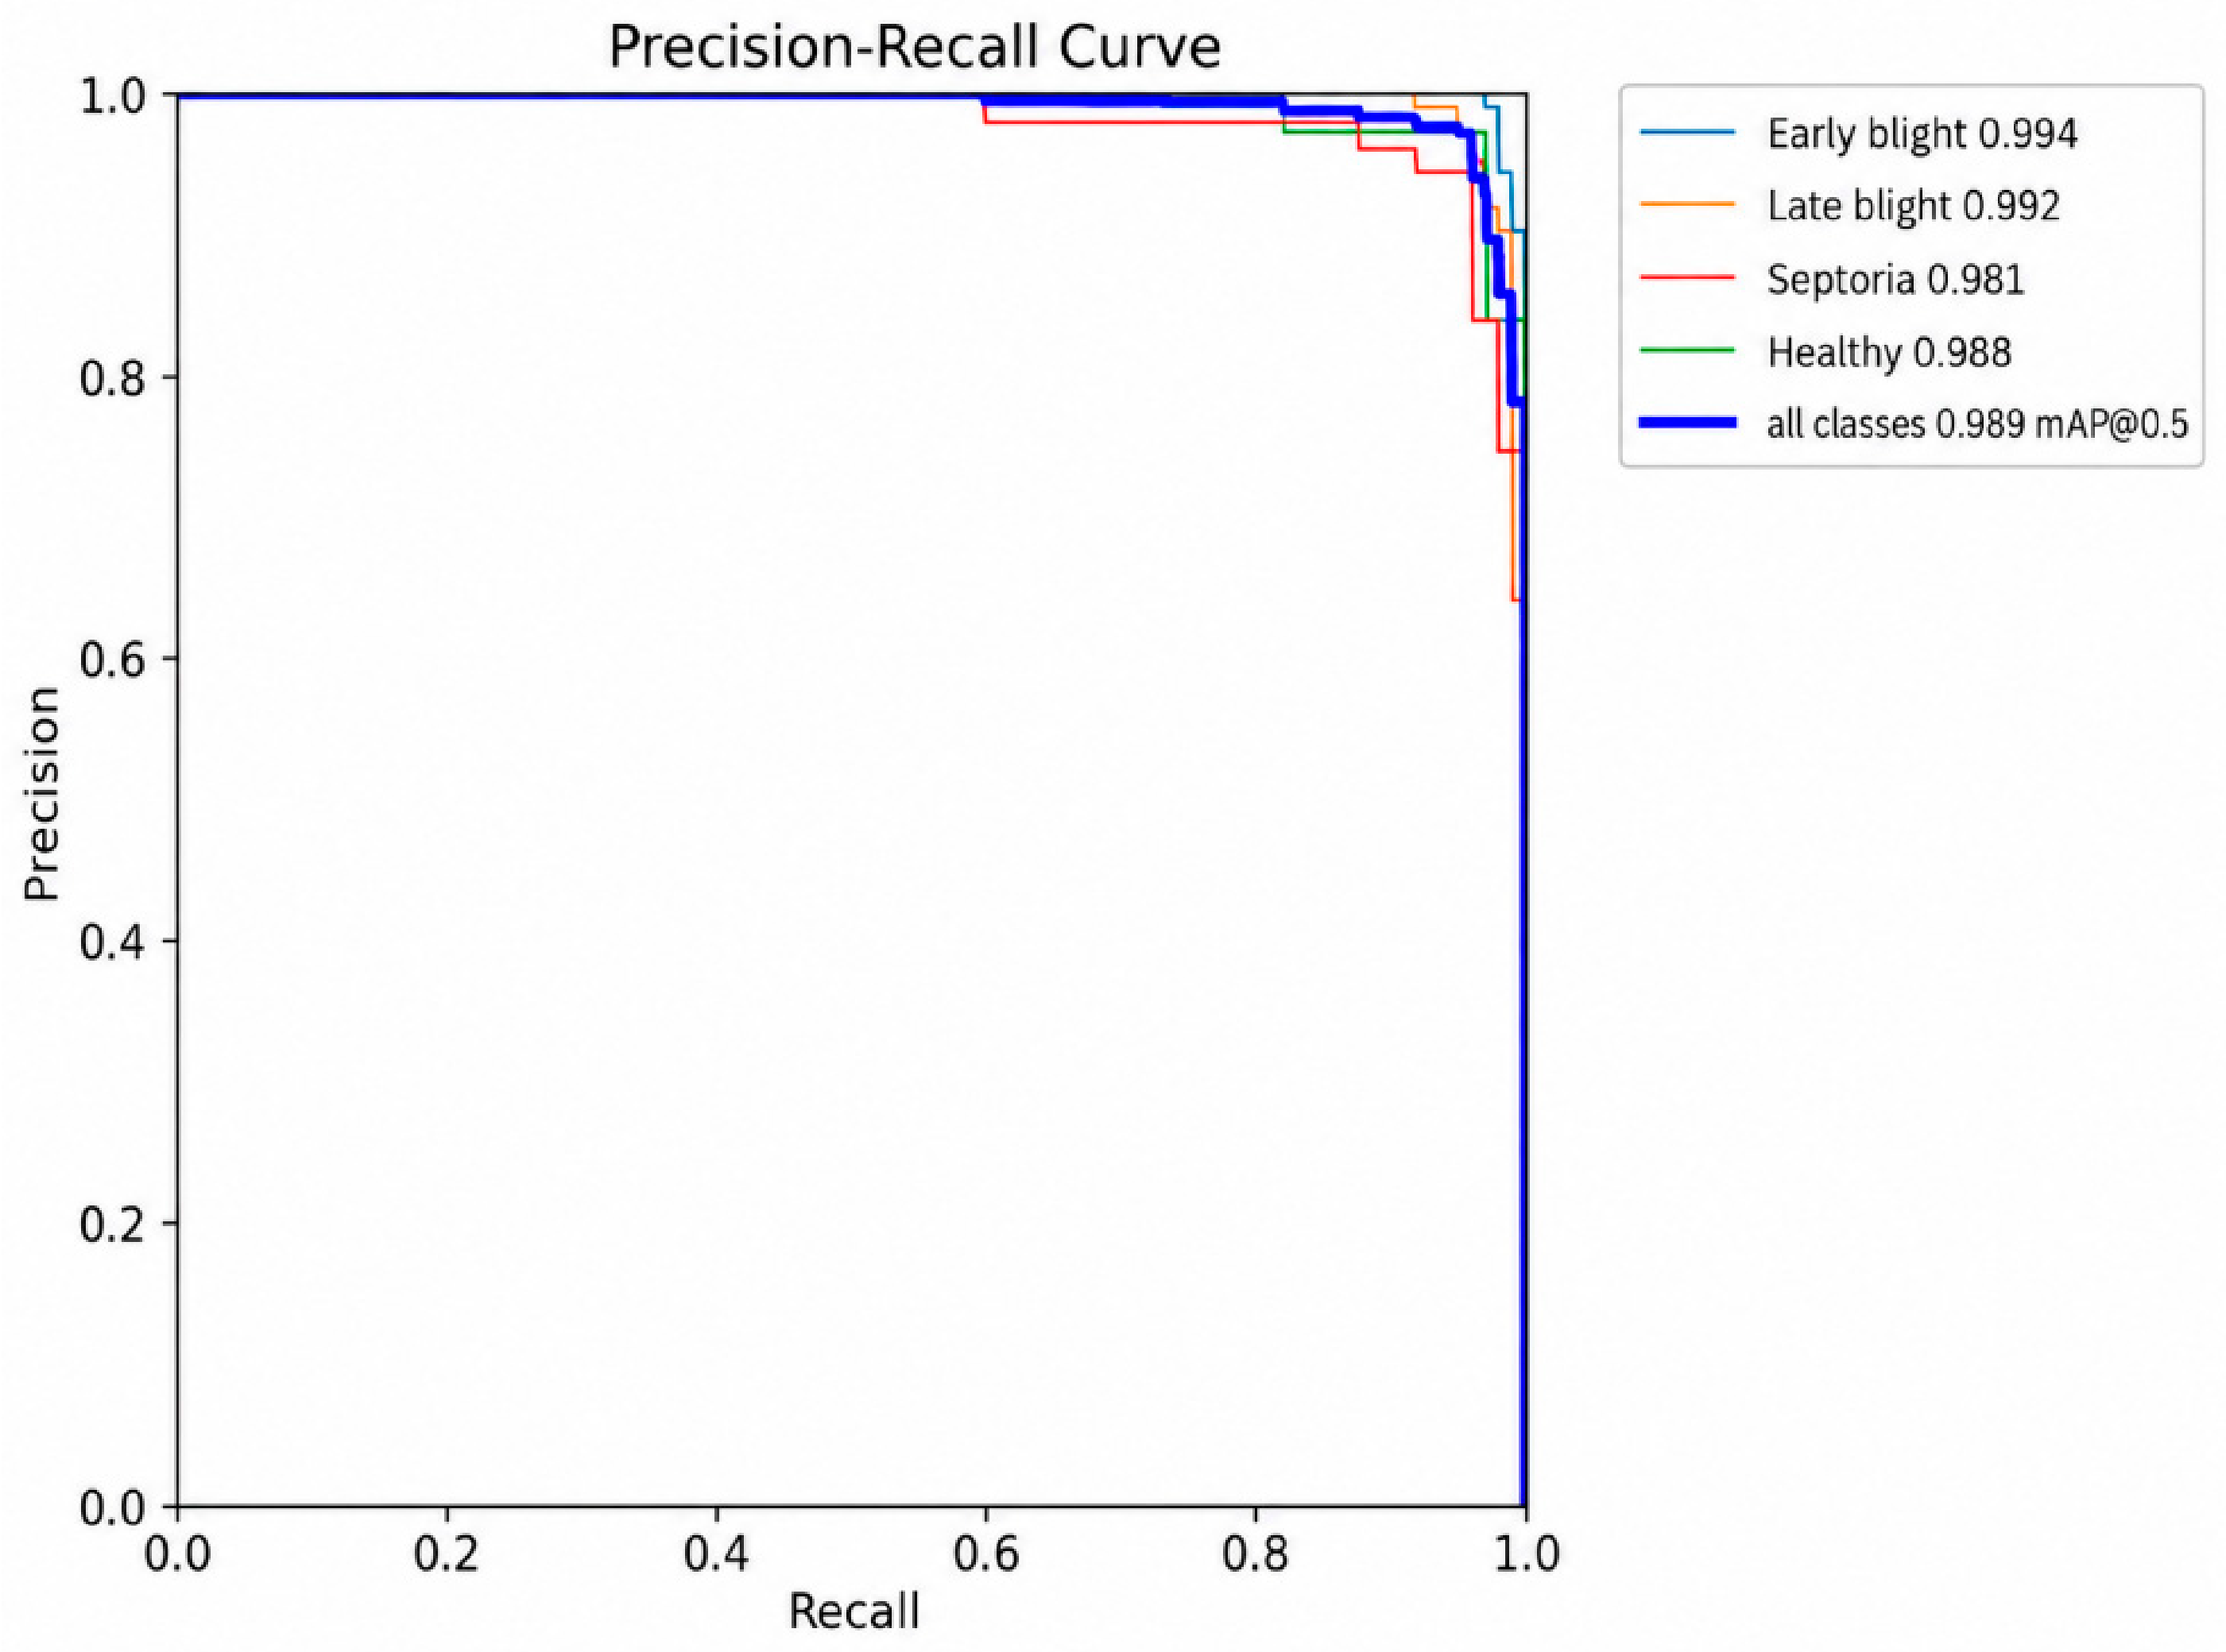
Additionally, a performance evaluation curve for the YOLO26n model was reviewed. As shown in Figure 6, the precision-recall curve demonstrates high and stable performance across the evaluated classes, with an overall mAP@0.5 of 0.989. The model demonstrates a high capacity for individual detection, reaching values of 0.994 for Early blight, 0.992 for Late blight, 0.981 for Septoria leaf spot, and 0.988 for Healthy leaf.
Figure 6.
Precision–Recall curve of the YOLO26n model on the test set.
4.6. Examples of YOLO26n Model Predictions
An analysis was performed of the predictions generated by the YOLO26n model, examining the correspondence between the actual and predicted classes, as well as the location of the bounding boxes under different visual conditions.
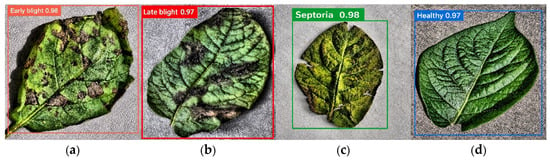
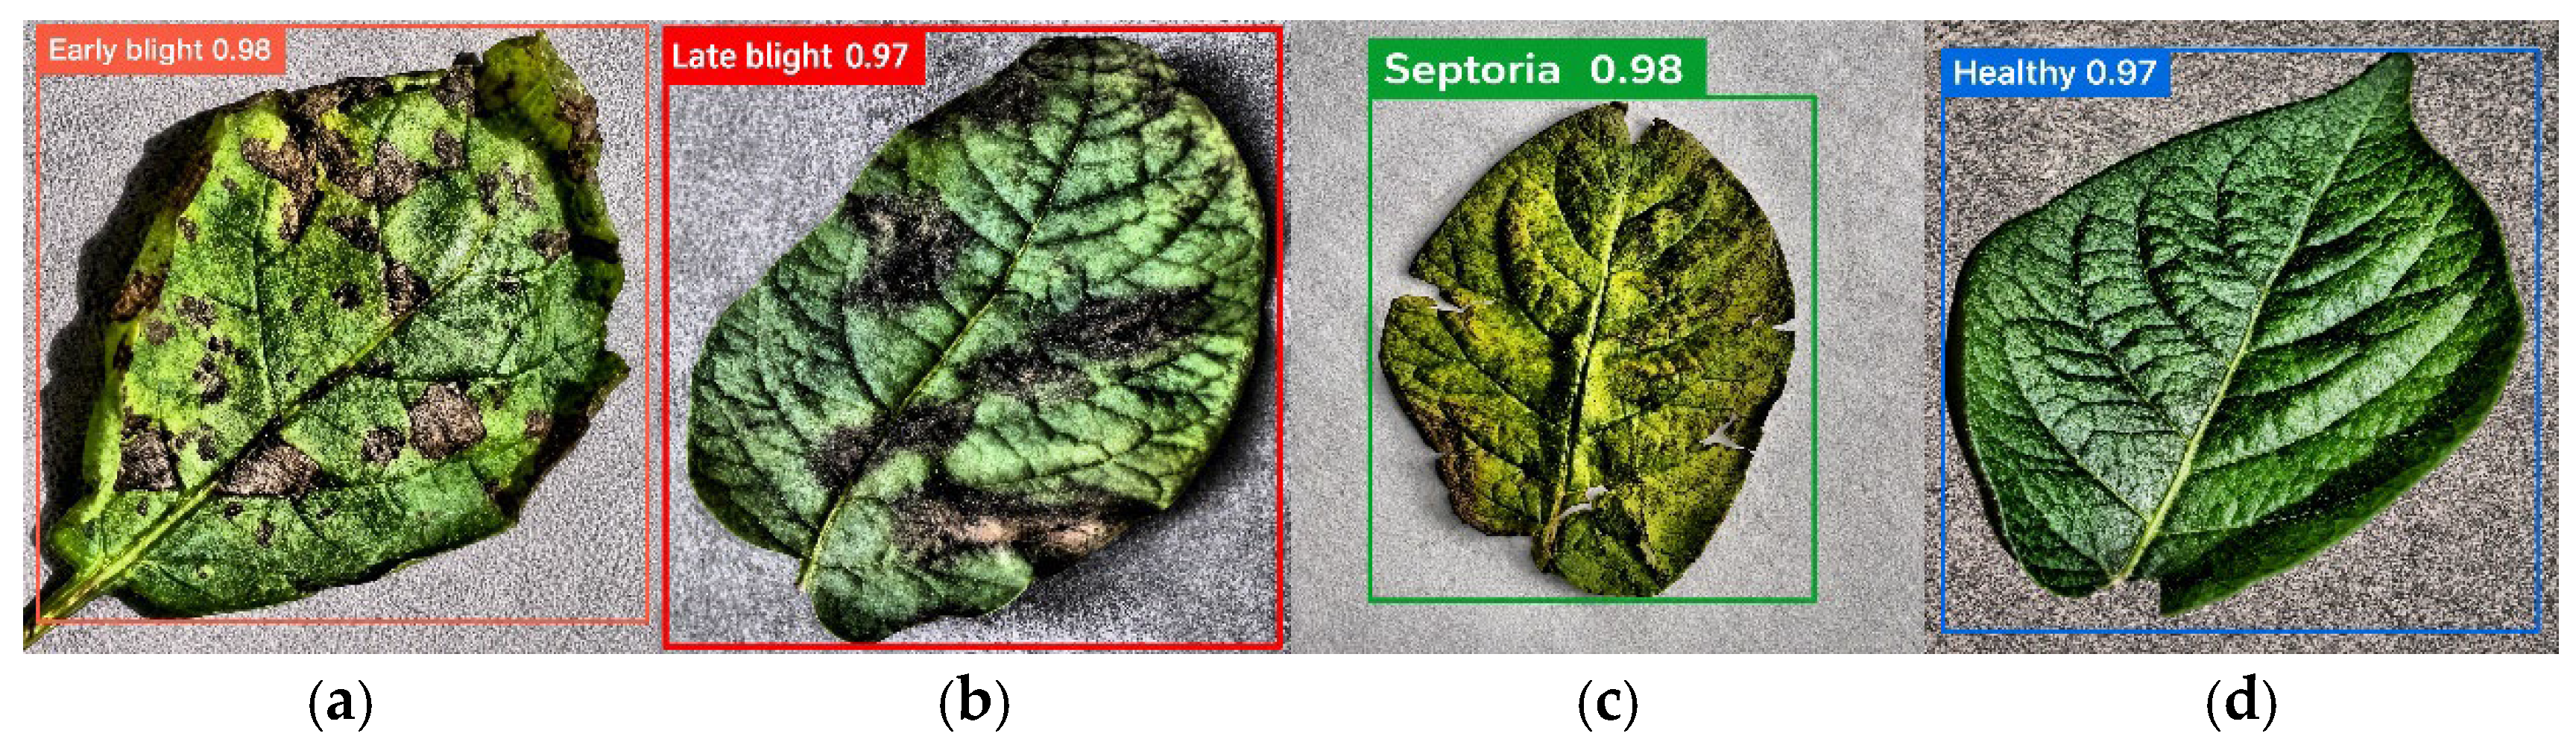
Figure 7 shows examples of correct predictions for the Early blight, Late blight, Septoria leaf spot, and Healthy leaf classes. In all four cases, the model located the complete leaf and assigned the corresponding class with high confidence. These results are consistent with the performance observed in the class-level quantitative metrics and the normalized confusion matrix.
Figure 7.
Examples of correct predictions from the YOLO26n model on the test set: (a) Early blight, (b) Late blight, (c) Septoria leaf spot, and (d) Healthy leaf.
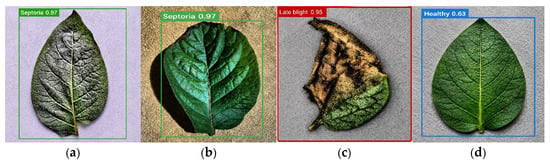
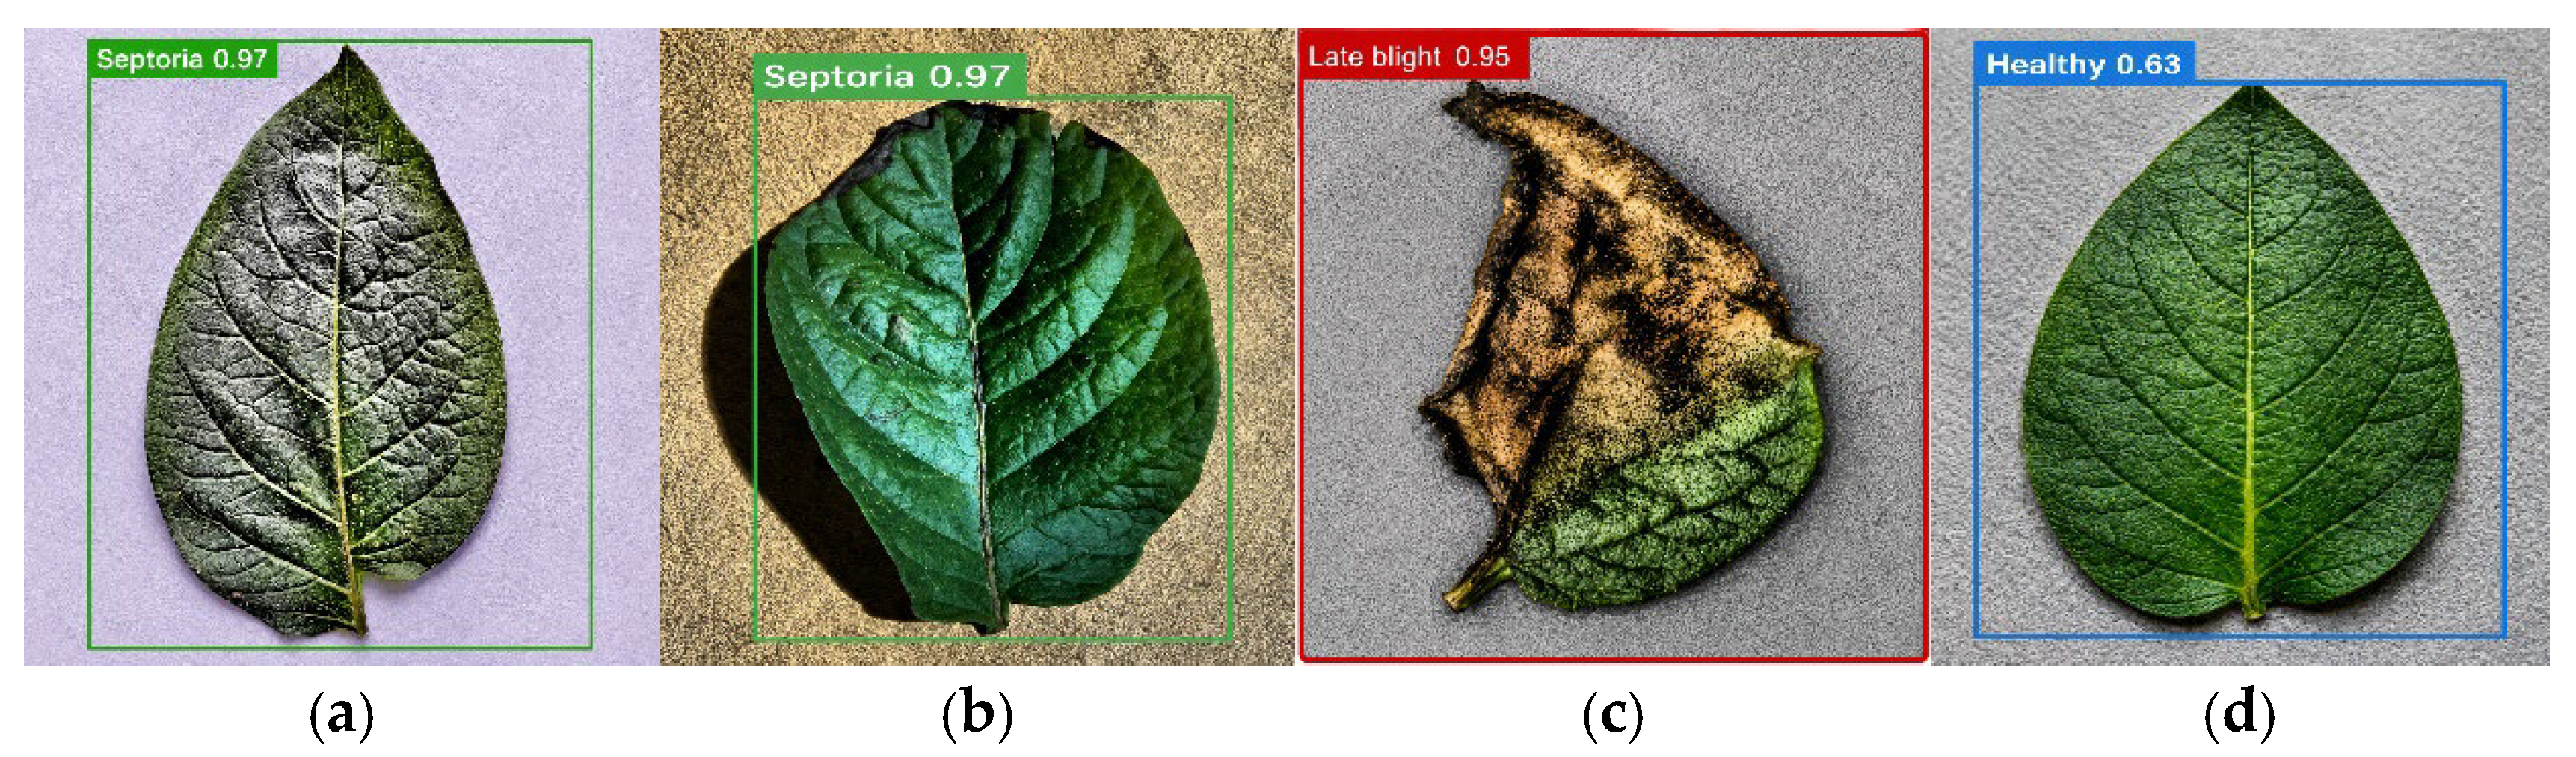
On the other hand, Figure 8 shows examples of erroneous predictions in challenging cases. In the first case, an incomplete, healthy leaf was incorrectly classified as Septoria, demonstrating confusion due to similarities in texture and coloration. The remaining cases show that the model maintained the leaf’s location against a background with irregular texture and poor lighting, including shadows—conditions that can reduce the contrast between the object and its surroundings.
Figure 8.
Challenging cases observed during visual analysis on the test set: (a) incomplete healthy leaf misclassified as Septoria, (b) prediction on a complex background and presence of shadow, (c) prediction with irregular shape with shadow, and (d) prediction with ambiguous symptoms with low confidence (63%).
4.7. Interpretability of the YOLO26n Model
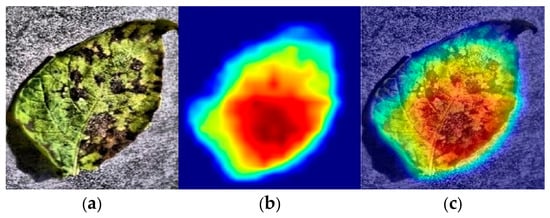
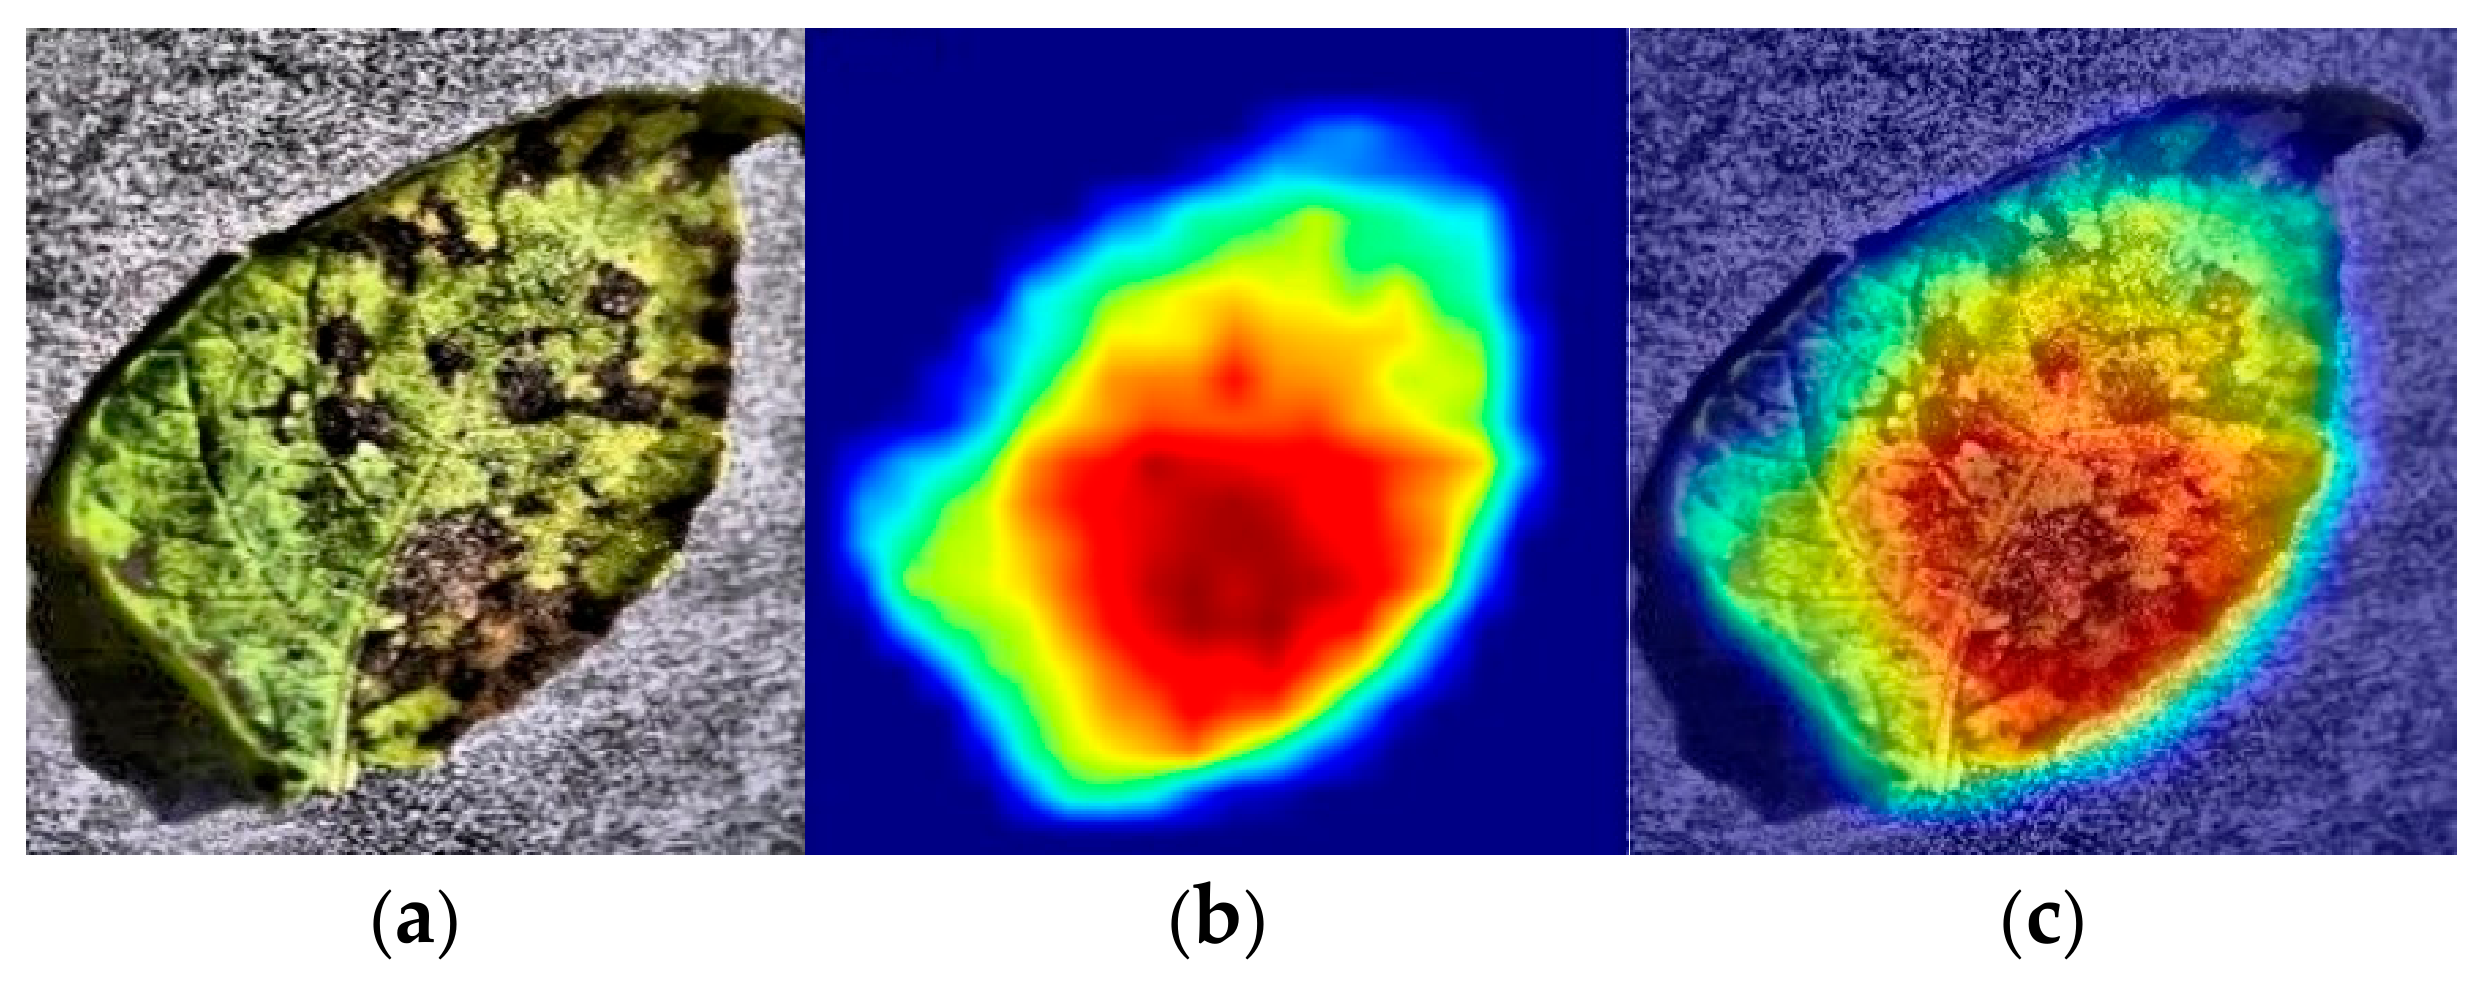
To complement the analysis of the predictions, the EigenCAM technique [36] was applied to generate class activation maps, visualized as heat maps, to identify the leaf regions that influenced the model’s predictions. EigenCAM was applied to the YOLO26n model, using the output of the SPPF (Spatial Pyramid Pooling-Fast) module of the backbone as the target layer. This module extracts and merges features at multiple scales using sequential max-pooling operations, expanding the network’s receptive field without significantly increasing computational cost. The SPPF output was selected as the target for EigenCAM because, at this stage, the algorithm concentrates the highest-level semantic and spatial information before moving to the prediction phase. This is ideal for accurately visualizing the leaf areas that the model considers critical for diagnosis [37].
In Figure 9, the activation map provides a qualitative visualization of regions that contribute to the model response with greater intensity (red and yellow colors) in the central region of the leaf and around the necrotic lesions near the main vein, associated with the foliar symptoms, while the response against the background is reduced (blue colors). However, because the detector was trained using complete leaves as the annotation unit, these activations should not be interpreted as direct evidence of lesion-specific attention. The highlighted regions may reflect a combination of leaf shape, internal texture, color distribution, and disease-related visual patterns.
Figure 9.
Visual interpretability of predictions using EigenCAM on the test set: (a) input image with textured gray background belonging to Early blight class, (b) activation map generated from the output of the backbone SPPF module, and (c) overlay of the activation map on the input image. The model predicted Early blight with 97.09% confidence. Leaf regions with warm colors (red and yellow) contribute primarily to the model response.
4.8. CultivoScan Mobile Application
Exporting the YOLO26n model to TensorFlow Lite and integrating it into a mobile application to support the diagnosis of foliar diseases in potato leaves allows for local inference on Android devices without relying on external processing.
Unlike the GPU-based inference measurements reported during model evaluation, the deployment results presented here were obtained directly on the target Android device using the TensorFlow Lite model.
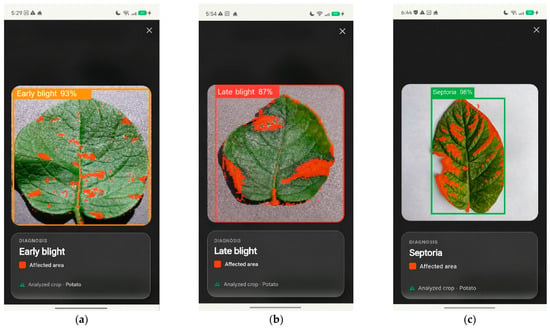
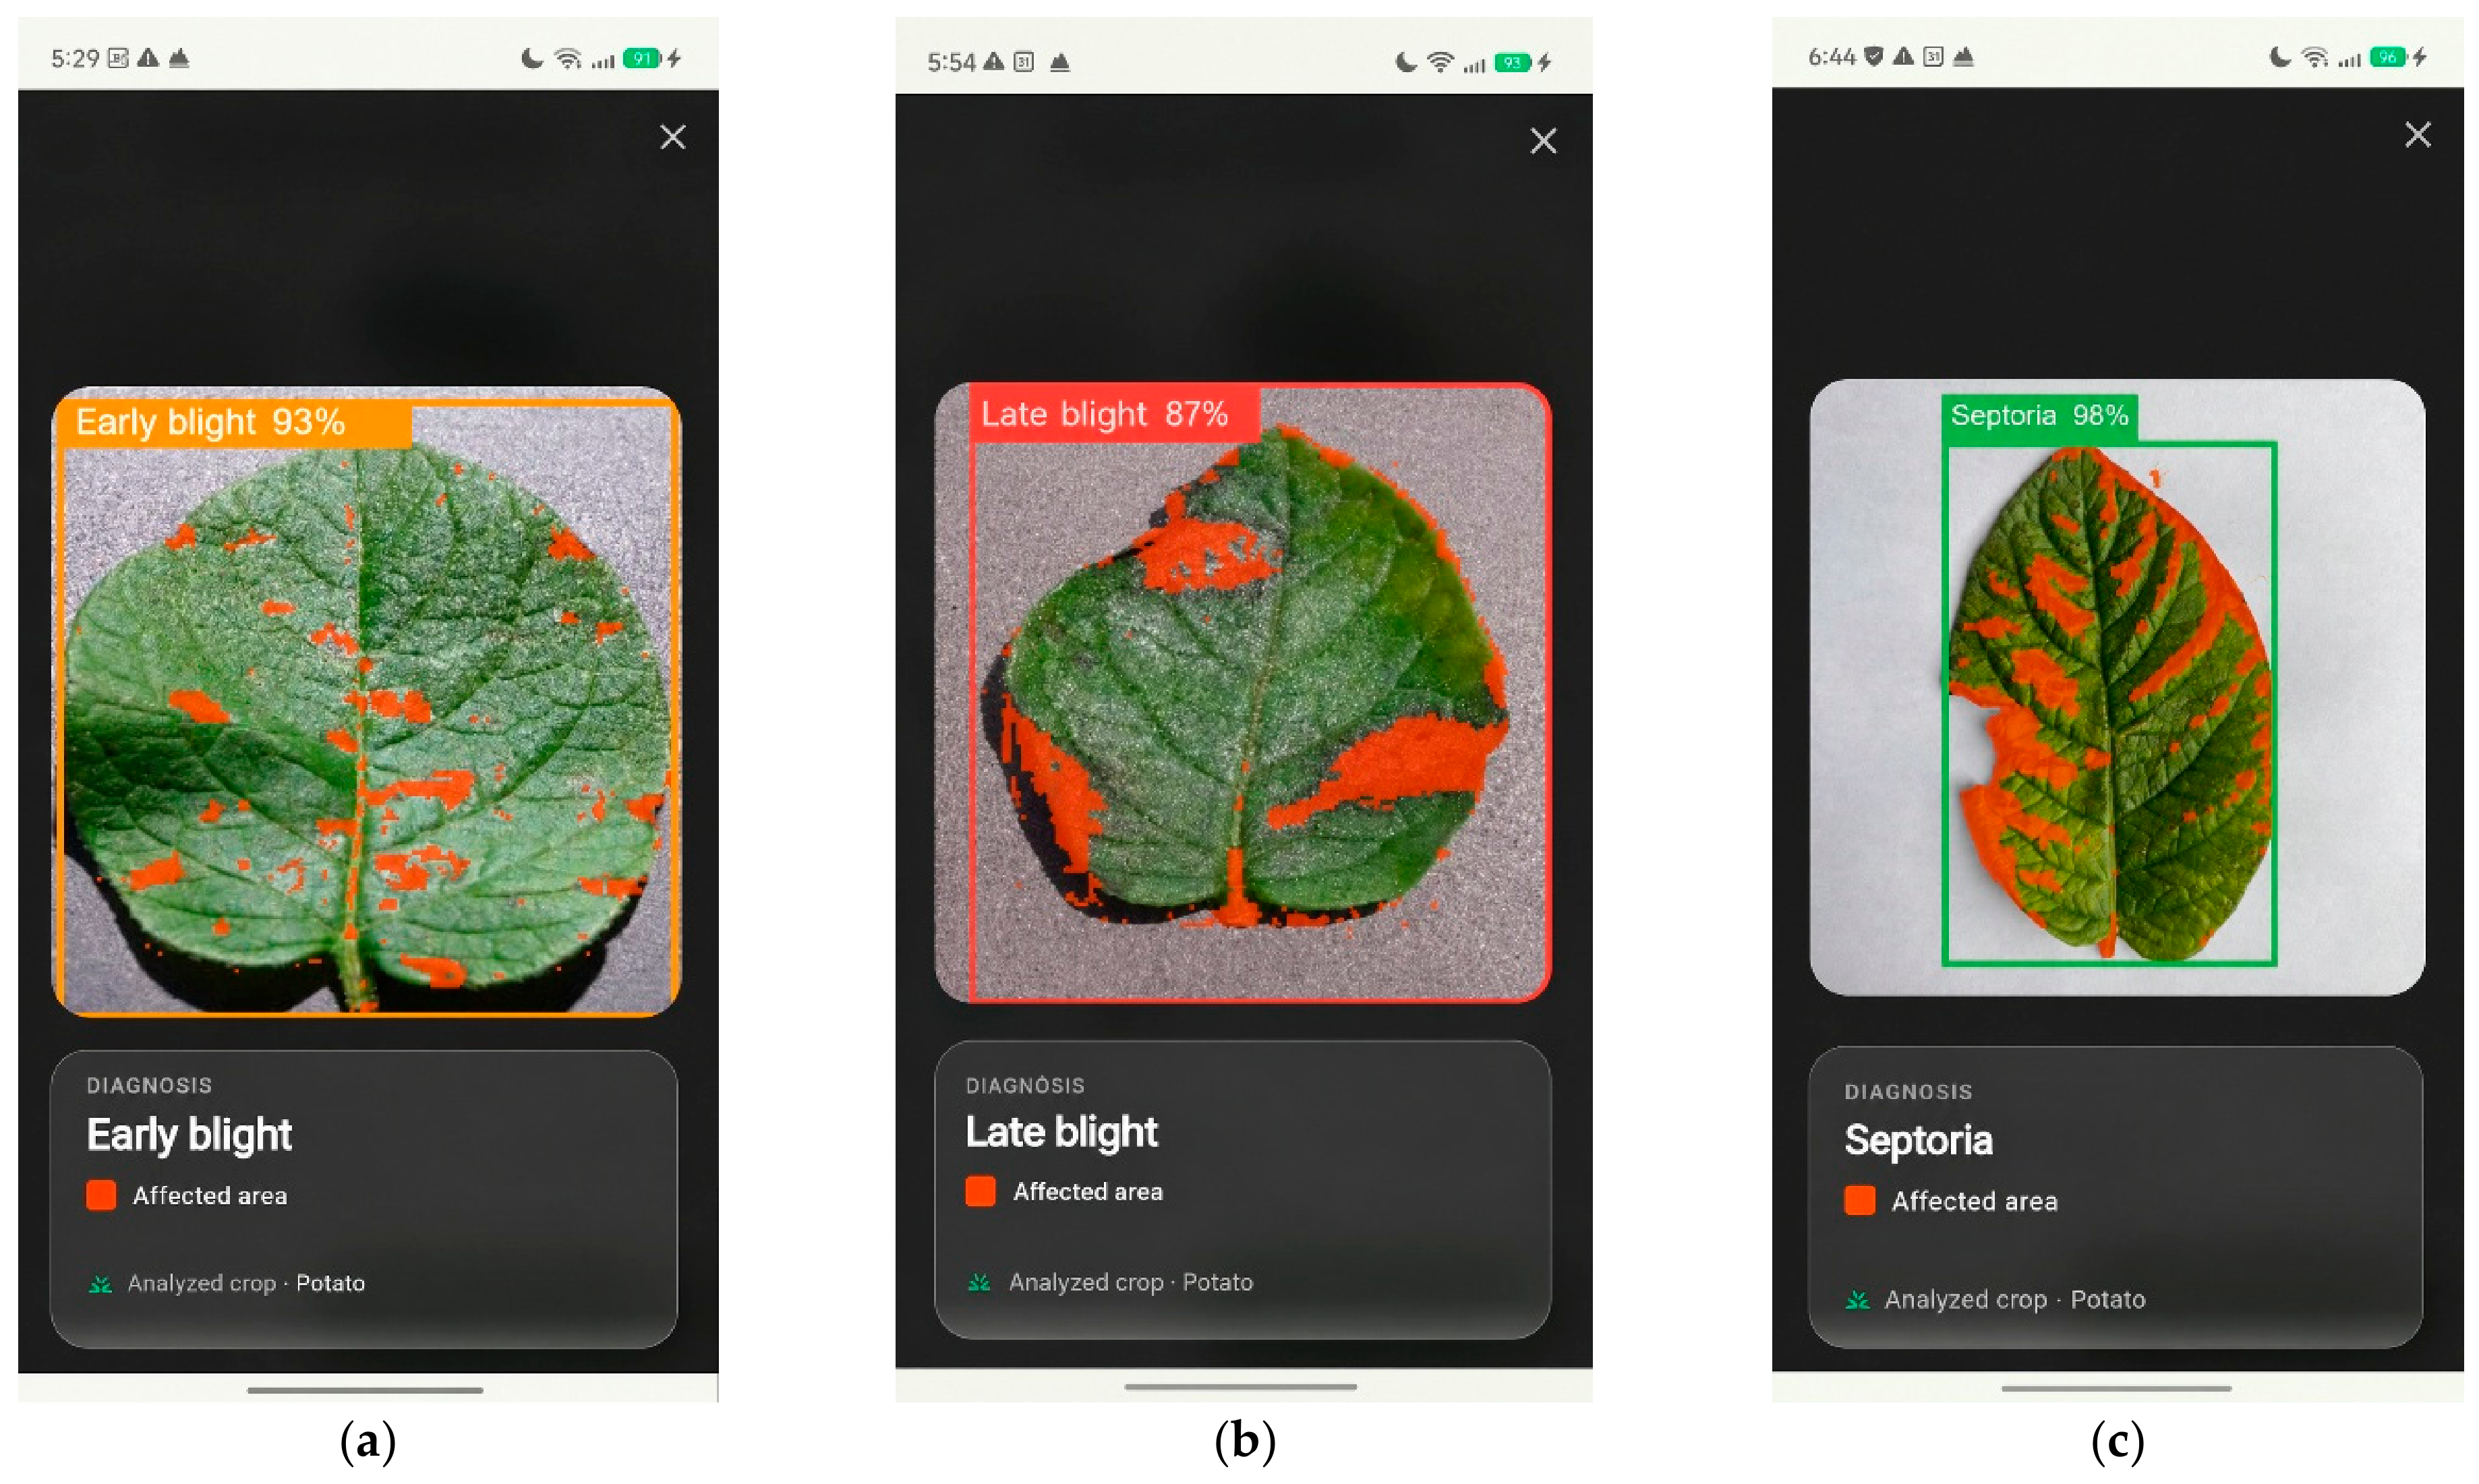
Figure 10 shows example screenshots of the CultivoScan mobile application for identifying the diseases Early blight, Late blight, and Septoria leaf spot. In all cases, the interface displays the leaf location (bounding box), the predicted class, and the associated confidence level. Additionally, as a visual aid, the specific regions affected by the disease are highlighted, since the application incorporates a post-processing algorithm based on the HSV color space [38]. This algorithm filters, pixel by pixel, the shades that differ from healthy green tissue within the detected region, applying a color mask to highlight the lesions and facilitate the end user’s didactic interpretation of the diagnosis.
Figure 10.
Example screenshots of the CultivoScan mobile application with the identification of the diseases: Early blight in (a), Late blight in (b), and Septoria leaf spot in (c).
The average inference time for a 1024-pixel image in the CultivoScan application, running on the aforementioned mobile device, was 559.95 ms (1.79 FPS). Furthermore, the average total diagnostic time was 8.43 s; this time encompasses the end-to-end computational flow, including image loading, image resizing, model inference, execution of the visual post-processing algorithm (pixel-by-pixel HSV), recording of the diagnosis, and the corresponding recommendation generation.
5. Discussion
5.1. Comparison with Related Work
To contextualize the performance of the YOLO26n model, it is compared with current studies on the detection of leaf diseases in potato crops using YOLO architectures; see Table 11. The analysis considers the number of classes, foliar diseases, and quantitative metrics that allow examination of the identification capacity and stability of bounding boxes at different levels of spatial demand.
Table 11.
Comparison of results with related work on the detection of leaf diseases (location and classification) in potato crops using YOLO architectures.
In Muthulakshmi [22] and Aleinzi [27], improvements are achieved through structural changes to the YOLO architecture, whereas in Gong & Chen [28] and Xu et al. [29], attention mechanisms are applied to strengthen lesion representation and gain robustness against complex backgrounds. Our study adapts the YOLO26n configuration to the four-class hybrid dataset through validation-based selection of loss weighting and input resolution, while additionally considering computational efficiency and mobile deployment constraints.
Our YOLO26n model achieved an mAP50 of 98.89% and an mAP50-95 of 98.05%, with a difference of 0.84% between the two metrics. This indicates that, on the test set used, performance remained stable as the overlap requirement between predicted bounding boxes and actual annotations increased. Furthermore, a suitable balance between precision and recall is evident. The precision of 96.99% reflects a low proportion of false positives, while the recall of 95.76% indicates the model’s high ability to correctly detect instances in the images. In this context, false positives correspond to regions that the model detects as foliar disease or leaves, but that do not match any annotated instance or are incorrectly classified.
The YOLO26n model, with an mAP50-95 of 98.05%, outperforms other studies based on YOLO architectures, using only 2.5 million parameters and a model size of 5.23 MB (FP16), across four classes: three diseases (Early blight, Late blight, Septoria) and healthy leaf in potato crops. Comparisons with previous studies are provided only for contextual reference, since differences in datasets, class distributions, training strategies, hardware, and evaluation protocols prevent a controlled head-to-head comparison. Therefore, the reported values should not be interpreted as direct evidence of superiority over other models reported in the literature.
In short, the contribution of this research lies in the evaluation of convolutional (YOLO) and Transformer-based (RT-DETR) architectures under the same experimental protocol, the use of a hybrid dataset with images in controlled environments, and the integration of the model into TensorFlow Lite for local inference on Android devices through the CultivoScan application. In this way, the study relates the performance in detecting leaf diseases to the model’s interpretability, efficiency, and feasibility for mobile deployment.
5.2. Limitations of the Study
Some limitations were identified regarding the dataset’s composition, validation under real-world agricultural conditions, and the model’s deployment on mobile devices.
The hybrid dataset, which combines images from the PlantVillage and custom datasets, remains limited in terms of background conditions, lighting, orientation, and scale. Although the hybrid dataset increases variability within the experimental dataset, it does not constitute independent external validation. Therefore, the generalizability of the model to other acquisition domains, geographic regions, devices, and field conditions remains to be established.
We evaluated the models on the hybrid test set as a whole and did not estimate performance separately for PlantVillage and custom images. Because the two sources differ in acquisition conditions and class composition, a source-specific comparison would not represent a balanced domain comparison. In particular, the Septoria leaf spot class is represented exclusively by custom images, whereas Early blight, Late blight, and Healthy leaf include samples from both sources. Therefore, source-related visual characteristics, including background, illumination, acquisition protocol, and other dataset-specific image characteristics, may have contributed to the observed class-wise performance. Consequently, the high performance reported on the hybrid test set should not be interpreted as evidence of source-independent or cross-domain generalization. External evaluation using source-stratified datasets and images acquired under different field conditions is required to quantify this effect.
The annotation strategy adopted in this study defines the complete leaf as the detection unit and assigns a single diagnostic class to each annotated leaf. Consequently, the model performs leaf-level disease localization and classification rather than lesion-level detection. This design does not allow the precise delineation of individual lesions, the direct estimation of disease severity, or the identification of multiple co-occurring diseases within the same leaf.
The YOLO26n model was exported to TensorFlow Lite using FP16 precision, while INT8 quantization was not evaluated. Although INT8 could potentially reduce model size and inference latency, its actual benefits depend on hardware acceleration and operator support and may involve a loss in predictive performance. Therefore, the accuracy–size–latency trade-off of INT8 quantization remains to be experimentally evaluated. Moreover, we assessed mobile performance on a single Android device, limiting the generalizability of the reported latency results.
A further limitation is the absence of controlled baselines using previous lightweight YOLO generations trained under identical experimental conditions. Additionally, each model configuration was evaluated from a single training run; therefore, run-to-run variability was not quantified, and no statistical significance testing was performed. Repeating each configuration multiple times would have substantially increased the study’s computational cost.
6. Conclusions
This work implements and evaluates the modern architectures YOLO26 and RT-DETRv2 on the PyTorch framework for detecting leaf diseases (Early blight, Late blight, Septoria leaf spot) in potato crops, using a hybrid dataset comprising public and custom images collected in controlled environments. This combination allowed the models to be trained with samples from a local agricultural context.
The YOLO26n variant, with the BoxGain strategy and an input resolution of 1024 pixels, achieves the best overall performance, reaching an mAP50 of 98.89%, an mAP50-95 of 98.05%, a precision of 96.99%, and a recall of 95.76%, with 2.5 M params and a model size of 5.23 MB. EigenCAM’s activation maps show that the model focuses on relevant regions of the leaf, thereby increasing the interpretability of the predictions. This model is exported to TensorFlow Lite and deployed in the CultivoScan mobile application, demonstrating the feasibility of local inference on Android devices and its potential as a support tool for visual identification of potato leaf diseases. In comparison, the evaluated RT-DETRv2 configurations achieved competitive detection performance but required substantially greater computational resources and higher inference latency than YOLO26n, making them less suitable for the mobile deployment conditions considered in this study.
For future work, the following are proposed: Expanding the dataset with new images (mainly Septoria leaves) from different plots, seasons, capture devices, and environmental conditions; considering multiple plant leaves simultaneously; and increasing the number of leaf diseases relevant to the local context, incorporating balanced classes across multiple independent sources and conducting source-specific or cross-dataset evaluations to assess generalizability. They should also evaluate FP16 and INT8 TensorFlow Lite implementations across low-, mid-, and high-end Android devices, quantifying their impact on model size, inference latency, memory consumption, and detection accuracy. Finally, they should address instance/semantic segmentation, including multi-label cases with co-occurring diseases. Pixel-level masks will also enable estimation of the percentage of affected tissue relative to total leaf area and, consequently, quantitative disease-severity assessment.
Author Contributions
Conceptualization, M.P.-C. and V.C.-S.; Methodology, M.P.-C. and D.C.-T.; Software, D.C.-T.; Validation, I.G.-S.; Formal analysis, M.P.-C. and I.G.-S.; Investigation, M.P.-C.; Resources, I.G.-S.; Data curation, D.C.-T.; Writing—original draft, M.P.-C. and D.C.-T.; Writing—review & editing, V.C.-S. and I.G.-S.; Visualization, D.C.-T.; Supervision, V.C.-S.; Funding acquisition, I.G.-S. All authors have read and agreed to the published version of the manuscript.
Funding
This research was mostly funded by the Universidad Técnica del Norte, Ibarra, Ecuador, under Grant Number: InvestigaUTN-2025-1516.
Data Availability Statement
Datasets used in this study were made publicly available for comparison and can be found at https://zenodo.org/doi/10.5281/zenodo.20247346 (last accessed on 15 August 2026).
Acknowledgments
This research is supported by the Software Engineering and Artificial Intelligence research group from the Universidad Técnica del Norte (Ecuador) and the Department of Computer Science and Automation from the University of Salamanca (Spain). During the preparation of this manuscript, the authors used ChatGPT 5.5 to create Figure 1 (general workflow) and to improve the quality of Figure 5 (normalized confusion matrix). Grammarly was used to check the manuscript’s grammar. The authors have reviewed and edited the output and take full responsibility for the content of this publication.
Conflicts of Interest
The authors declare no conflicts of interest.
References
- Zhao, J.; Xu, L.; Ma, Z.; Li, J.; Wang, X.; Liu, Y.; Du, X. A review of plant leaf disease identification by deep learning algorithms. Front. Plant Sci. 2025, 16, 1637241. [Google Scholar] [CrossRef] [Scilit] [PubMed]
- Villavicencio, A.; Park, C.; Cho, K.; Bae, R.; Peñaherrera, D.; Narváez, G.; López, V.; Camacho, J.; Suquillo, J.; Yumisaca, F.; et al. Sustainable Potato Production in the Mountain Area of Ecuador, an Approach to Increase Productivity with Small Scale Farmers. Agric. Sci. 2022, 13, 1080–1090. [Google Scholar] [CrossRef]
- Basantes, F.; Aragón Suárez, J.P.; Albuja Illescas, L.M.; del Rocío Vásquez Hernández, L. Diagnóstico de la situación actual de la producción y comercialización de la papa (Solanum tuberosum L.) en la Zona 1 del Ecuador. E-Agronegocios 2020, 6, 103–120. [Google Scholar] [CrossRef] [Scilit]
- Ulloa, F.; Sandoval-Pillajo, L.; Landeta-López, P.; Granda-Peñafiel, N.; Pusdá-Chulde, M.; García-Santillán, I. Identification of Diabetic Retinopathy from Retinography Images Using a Convolutional Neural Network. In Technologies and Innovation; Valencia-García, R., Borodulina, T., Del Cioppo-Morstadt, J., Moran-Castro, C.E., Vera-Lucio, N., Eds.; Communications in Computer and Information Science; Springer Nature: Cham, Switzerland, 2025; Volume 2276, pp. 121–136. [Google Scholar] [CrossRef] [Scilit]
- Salazar-Fierro, F.; Cumbal, C.; Trejo-España, D.; León-Fernández, C.; Pusdá-Chulde, M.; García-Santillán, I. Detection of Scoliosis in X-Ray Images Using a Convolutional Neural Network. In Technologies and Innovation; Valencia-García, R., Borodulina, T., Del Cioppo-Morstadt, J., Moran-Castro, C.E., Vera-Lucio, N., Eds.; Communications in Computer and Information Science; Springer Nature: Cham, Switzerland, 2025; Volume 2276, pp. 167–183. [Google Scholar] [CrossRef] [Scilit]
- Herrera-Granda, I.D.; Chicaiza-Ipiales, J.A.; Herrera-Granda, E.P.; Lorente-Leyva, L.L.; Caraguay-Procel, J.A.; García-Santillán, I.D.; Peluffo-Ordóñez, D.H. Artificial Neural Networks for Bottled Water Demand Forecasting: A Small Business Case Study. In Advances in Computational Intelligence; Rojas, I., Joya, G., Catala, A., Eds.; Lecture Notes in Computer Science; Springer International Publishing: Cham, Switzerland, 2019; Volume 11507, pp. 362–373. [Google Scholar] [CrossRef] [Scilit]
- Montenegro, S.; Pusdá-Chulde, M.; Caranqui-Sánchez, V.; Herrera-Tapia, J.; Ortega-Bustamante, C.; García-Santillán, I. Android Mobile Application for Cattle Body Condition Score Using Convolutional Neural Networks. In Smart Technologies, Systems and Applications; Narváez, F.R., Urgilés, F., Bastos-Filho, T.F., Salgado-Guerrero, J.P., Eds.; Communications in Computer and Information Science; Springer Nature: Cham, Switzerland, 2023; Volume 1705, pp. 91–105. [Google Scholar] [CrossRef] [Scilit]
- Vinueza, K.; Sandoval-Pillajo, L.; Giret-Boggino, A.; Trejo-España, D.; Pusdá-Chulde, M.; García-Santillán, I. Automatic weed quantification in potato crops based on a modified convolutional neural network using drone images. Data Metadata 2025, 4, 194. [Google Scholar] [CrossRef] [Scilit]
- Cevallos, M.; Sandoval-Pillajo, L.; Caranqui-Sánchez, V.; Ortega-Bustamante, C.; Pusdá-Chulde, M.; García-Santillán, I. Morphological Defects Classification in Coffee Beans Based on Convolutional Neural Networks. In Technologies and Innovation. CITI 2024; Valencia-García, R., Borodulina, T., Del Cioppo-Morstadt, J., Moran-Castro, C.E., Vera-Lucio, N., Eds.; Communications in Computer and Information Science; Springer: Cham, Switzerland, 2025; pp. 3–15. [Google Scholar] [CrossRef] [Scilit]
- Sandoval-Pillajo, L.; García-Santillán, I.; Pusdá-Chulde, M.; Giret, A. Weed detection based on deep learning from UAV imagery: A review. Smart Agric. Technol. 2025, 12, 101147. [Google Scholar] [CrossRef] [Scilit]
- Sandoval-Pillajo, L.; Pusdá-Chulde, M.; Pazos-Morillo, J.; Granda-Gudiño, P.; García-Santillán, I. Multi-Class Weed Quantification Based on U-Net Convolutional Neural Networks Using UAV Imagery. Appl. Sci. 2026, 16, 3149. [Google Scholar] [CrossRef] [Scilit]
- Sandoval-Pillajo, L.; Perugachi-Chávez, L.; Pusdá-Chulde, M.; Giret-Boggino, A.; García-Santillán, I. Multi-class weed detection based on deep learning using unmanned aerial vehicle images in potato fields. Open Comput. Sci. 2026, 16, 20250058. [Google Scholar] [CrossRef] [Scilit]
- Bhargava, A.; Shukla, A.; Goswami, O.P.; Alsharif, M.H.; Uthansakul, P.; Uthansakul, M. Plant Leaf Disease Detection, Classification, and Diagnosis Using Computer Vision and Artificial Intelligence: A Review. IEEE Access 2024, 12, 37443–37469, Correction in IEEE Access 2024, 12, 162607. https://doi.org/10.1109/ACCESS.2024.3373001. [Google Scholar] [CrossRef] [Scilit]
- Pacal, I.; Kunduracioglu, I.; Alma, M.H.; Deveci, M.; Kadry, S.; Nedoma, J.; Slany, V.; Martinek, R. A Systematic Review of Deep Learning Techniques for Plant Diseases. Artif. Intell. Rev. 2024, 57, 304. [Google Scholar] [CrossRef] [Scilit]
- Badgujar, C.M.; Poulose, A.; Gan, H. Agricultural Object Detection with You Only Look Once (YOLO) Algorithm: A Bibliometric and Systematic Literature Review. Comput. Electron. Agric. 2024, 223, 109090. [Google Scholar] [CrossRef] [Scilit]
- Zhao, Y.; Lv, W.; Xu, S.; Wei, J.; Wang, G.; Dang, Q.; Liu, Y.; Chen, J. DETRs Beat YOLOs on Real-time Object Detection. In Proceedings of the IEEE/CVF Conference on Computer Vision and Pattern Recognition, Seattle, WA, USA, 16–22 June 2024; pp. 16965–16974. [Google Scholar]
- Jocher, G.; Qiu, J.; Liu, M.; Lyu, S.; Akyon, F.C.; Kalfaoglu, M.E. Ultralytics YOLO26: Unified Real-Time End-to-End Vision Models. arXiv 2026. [Google Scholar] [CrossRef] [Scilit]
- Lv, W.; Zhao, Y.; Chang, Q.; Huang, K.; Wang, G.; Liu, Y. RT-DETRv2: Improved Baseline with Bag-of-Freebies for Real-Time Detection Transformer. arXiv 2024. [Google Scholar] [CrossRef] [Scilit]
- Valle-Medina, F.D.; Castillo-Heredia, L.J.; Correa-Peralta, M.A.; Guzmán-Seraquive, J.E. Clasificación de Enfermedades en Hojas de Papa Utilizando Transformadores de Visión. Novasinergia Rev. Digit. Cienc. Ing. Tecnol. 2025, 8, 142–156. [Google Scholar] [CrossRef] [Scilit]
- Pineda Medina, D.; Miranda Cabrera, I.; Alfonso de la Cruz, R.; Guerra Arzuaga, L.; Cuello Portal, S.; Bianchini, M. A Mobile App for Detecting Potato Crop Diseases. J. Imaging 2024, 10, 47. [Google Scholar] [CrossRef] [Scilit] [PubMed]
- Goklani, D. Real-Time Plant Disease Detection Using Mobile Device with TensorFlow Lite and Flutter. 2024. Available online: https://papers.ssrn.com/sol3/papers.cfm?abstract_id=4921827 (accessed on 15 August 2026).
- Muthulakshmi, M.; Aishwarya, N.; Vinesh Kumar, R.K.; Rakesh Thoppaen Suresh, B. Potato Leaf Disease Detection and Classification With Weighted Ensembling of YOLOv8 Variants. J. Phytopathol. 2024, 172, e13433. [Google Scholar] [CrossRef] [Scilit]
- Yandún Velasteguí, M.A. Detección de enfermedades en cultivos de papa usando procesamiento de imágenes. Rev. Cumbres 2020, 6, 43–52. [Google Scholar] [CrossRef] [Scilit]
- Wang, X.; Liu, J. Vegetable Disease Detection Using an Improved YOLOv8 Algorithm in the Greenhouse Plant Environment. Sci. Rep. 2024, 14, 4261. [Google Scholar] [CrossRef] [Scilit] [PubMed]
- Mac, T.T.; Nguyen, T.-D.; Dang, H.-K.; Nguyen, D.-T.; Nguyen, X.-T. Intelligent Agricultural Robotic Detection System for Greenhouse Tomato Leaf Diseases Using Soft Computing Techniques and Deep Learning. Sci. Rep. 2024, 14, 23887. [Google Scholar] [CrossRef] [Scilit] [PubMed]
- Alhammad, S.M.; Khafaga, D.S.; El-Hady, W.M.; Samy, F.M.; Hosny, K.M. Deep Learning and Explainable AI for Classification of Potato Leaf Diseases. Front. Artif. Intell. 2025, 7, 1449329. [Google Scholar] [CrossRef] [Scilit] [PubMed]
- Aleinzi, M. Enhancing Precision Agriculture with YOLOv8: A Deep Learning Approach to Potato Disease Identification. Int. J. Adv. Comput. Sci. Appl. IJACSA 2025, 16, 1156. [Google Scholar] [CrossRef] [Scilit]
- Gong, F.; Chen, Y. ERL-YOLOv8n: A Potato Disease Detection Network for Complex Field Environments. J. Big Data Comput. 2025, 3, 1–10. [Google Scholar] [CrossRef] [Scilit]
- Xu, T.; Tang, L.; Qi, J.; Wang, P.; Zhou, G. SLR-YOLO: An Improved YOLO-Based Method for Accurate Detection of Potato Leaf Diseases in Complex Field Images. Plants 2026, 15, 2109. [Google Scholar] [CrossRef] [Scilit] [PubMed]
- Shimaoka, A.M.; Ferreira, R.C.; Goldman, A. The Evolution of CRISP-DM for Data Science: Methods, Processes and Frameworks. SBC Rev. Comput. Sci. 2024, 4, 28–43. [Google Scholar] [CrossRef] [Scilit]
- Saltz, J.; Hotz, N. Factors that Influence the Selection of a Data Science Process Management Methodology: An Exploratory Study. In Proceedings of the 54th Hawaii International Conference on System Sciences (HICSS); University of Hawai‘i at Mānoa: Honolulu, HI, USA, 2021; pp. 949–959. [Google Scholar] [CrossRef] [Scilit]
- Hughes, D.P.; Salathé, M. An open access repository of images on plant health to enable the development of mobile disease diagnostics. arXiv 2015. [Google Scholar] [CrossRef] [Scilit]
- Cuaycal Tirira, D.E. Annotated Dataset for Potato Foliar Disease and Healthy Leaf Detection (Septoria, Early Blight, Late Blight, Healthy). 2026. Available online: https://zenodo.org/records/20247346 (accessed on 15 August 2026).
- Padilla, R.; Passos, W.L.; Dias, T.L.B.; Netto, S.L.; da Silva, E.A.B. A Comparative Analysis of Object Detection Metrics with a Companion Open-Source Toolkit. Electronics 2021, 10, 279. [Google Scholar] [CrossRef] [Scilit]
- Lin, T.-Y.; Maire, M.; Belongie, S.; Hays, J.; Perona, P.; Ramanan, D.; Dollár, P.; Zitnick, C.L. Microsoft COCO: Common Objects in Context. In Proceedings of the European Conference on Computer Vision; Springer: Berlin/Heidelberg, Germany, 2014; pp. 740–755. [Google Scholar] [CrossRef] [Scilit]
- Muhammad, M.B.; Yeasin, M. Eigen-CAM: Class Activation Map using Principal Components. In Proceedings of the 2020 International Joint Conference on Neural Networks (IJCNN), Glasgow, UK, 19–24 July 2020; IEEE: Piscataway, NJ, USA, 2020; pp. 1–7. [Google Scholar] [CrossRef] [Scilit]
- Terven, J.; Córdova-Esparza, D.M.; Romero-González, J.A. A Comprehensive Review of YOLO Architectures in Computer Vision: From YOLOv1 to YOLOv8 and YOLO-NAS. Mach. Learn. Knowl. Extr. 2023, 5, 1680–1716. [Google Scholar] [CrossRef] [Scilit]
- Mendoza, F.; Valdes, J.; Hernandez, R. Robust plant disease lesion segmentation under varying illumination conditions using HSV color space analysis. Comput. Electron. Agric. 2024, 218, 108650. [Google Scholar] [CrossRef] [Scilit]

Disclaimer/Publisher’s Note: The statements, opinions and data contained in all publications are solely those of the individual author(s) and contributor(s) and not of MDPI and/or the editor(s). MDPI and/or the editor(s) disclaim responsibility for any injury to people or property resulting from any ideas, methods, instructions or products referred to in the content. |
© 2026 by the authors. Licensee MDPI, Basel, Switzerland. This article is an open access article distributed under the terms and conditions of the Creative Commons Attribution (CC BY) license.