


Abstract
Cover crop mixes play an important role in enhancing soil health, nutrient turnover, and ecosystem resilience; yet, maintaining even seed dispersion and planting uniformity is difficult due to significant variances in seed physical and aerodynamic properties. These discrepancies produce non-uniform seeding and species separation in drill hoppers, which has an impact on stand establishment and biomass stability. The thousand-grain weight is an important measure for determining cover crop seed quality and yield since it represents the weight of 1000 seeds in grams. Accurate seed counting is thus a key factor in calculating thousand-grain weight. Accurate mixed-seed identification is also helpful in breeding, phenotypic assessment, and the detection of moldy or damaged grains. However, in real-world conditions, the overlap and thickness of adhesion of mixed seeds make precise counting difficult, necessitating current research into powerful seed detection. This study addresses these issues by integrating deep learning-based computer vision algorithms for multi-seed detection and counting in cover crop mixes. The Canon LP-E6N R6 5D Mark IV camera was used to capture high-resolution photos of flax, hairy vetch, red clover, radish, and rye seeds. The dataset was annotated, augmented, and preprocessed on RoboFlow, split into train, validation, and test splits. Two top models, YOLOv5 and YOLOv7, were tested for multi-seed detection accuracy. The results showed that YOLOv7 outperformed YOLOv5 with 98.5% accuracy, 98.7% recall, and a mean Average Precision (mAP 0–95) of 76.0%. The results show that deep learning-based models can accurately recognize and count mixed seeds using automated methods, which has practical applications in seed drill calibration, thousand-grain weight estimation, and fair cover crop establishment.
1. Introduction
The implementation of digitalization, intelligence, and automation is revolutionizing the field of smart agriculture by decreasing the need for human labor, increasing operational efficiency, and raising the overall well-being of workers [1,2]. The identification and categorization of seed mixtures is critical to the sustainability and efficiency of the fields of agriculture, research, and seed quality control. Precise seed identification is essential for agricultural practice optimization and goes beyond simple procedural requirements. Studies by [3,4] emphasize how accuracy in seed identification directly affects agricultural productivity and ecological sustainability, underscoring the significance of this. However, existing seed identification procedures, which are mostly manual, pose major obstacles. These manual procedures, as shown by [5,6], are not only time-consuming but also prone to errors. When it comes to identifying seed combinations, the complexity increases exponentially, as does the possibility of misidentification. Given these obstacles, the trend toward automation in seed identification is gaining steam. Reference [7] underlines the importance of using automated approaches to overcome the constraints of human processes, implying a paradigm shift in how seed analysis is done. Cover crops are widely recognized for their diverse range of advantages and environmental benefits. However, selecting species based on specific objectives and field conditions is necessary to maximize the benefits for a range of purposes while avoiding underlying shortcomings. The effectiveness of cover crop mixes depends on the species’ ability to provide desired functions under specific environmental conditions. This balance is difficult to achieve, and scientists need new tools like variable seeding rates, termination timing, and seed mix selection to control biomass output and change the root-to-shoot biomass ratio. Because seed properties are highly variable, planting equipment and planters used to sow mixed cover crops must be tested for quality and field performance. Field vibration during planting can cause separation and non-uniformity in the combination of cover crop seeds within the same drill box hopper, compromising planting uniformity across the field. This study addresses a previously identified need for current research on the influence of mixed cover crop seed characteristics on planter performance. Our study focused on six winter crops (hairy vetch, radish, turnip, cereal rye, mustard, and red clover), focusing on the physical, mechanical, and aerodynamic properties of seeds and their effects on the uniformity of mixed cover crop seeds. Preliminary findings indicate that seed property differences influence seed mixture uniformity in the hopper. Non-uniformity has an adverse impact on planting uniformity and should be eliminated. Thousand-grain weight is a significant factor in determining the quality and production of cover crops. Thousand-grain weight is computed in grams and represents the total weight of 1000 grains. Precise seed counting is required to calculate thousand-grain weight. Therefore, precise detection of mixed seeds is important. Seed detection also allows for breeding, phenotypic analysis, and sorting of moldy and damaged grains. However, in complex agricultural production conditions, the overlap and close adherence of mixed seeds significantly reduce counting accuracy. How to accurately detect crop mixed seeds under adherence has been an important research issue that is receiving increased attention.
The field of deep learning has advanced significantly in agricultural applications and its ability to handle complex and large amounts of data has revolutionized several industries. Its applications in agriculture range from crop prediction to pest detection and, more recently, crop characterization. Within this context, crop counting is crucial at various growth stages. For example, counting seedlings helps assess germination rates, thereby improving breeding and enabling timely reseeding through early warnings [8,9], Monitoring crops during their growth stages helps identify problems such as disease or pest damage [10], while counting at later stages supports accurate yield predictions, guiding harvest planning [11]. However, manual counting is labor-intensive and impractical for large-scale farming [12], highlighting the need for automated, fast, and real-time counting solutions. Traditional image processing methods for crop counting often involve complex steps such as threshold segmentation, manual feature extraction, and feature regression [13]. For example, [14] proposed a method combining excessive green to count wheat seedlings. Reference [15] improved counting accuracy for maize through angle calculations, plant clustering, and mosaic methods. Other studies like those by [16,17] utilized various image processing techniques to count leaves and plants. While effective, these methods are complex and sensitive to factors like light, making them less suitable for practical agricultural use. Integrating artificial intelligence and computer vision technology offers a promising solution for automatic, fast, and accurate crop counting [18,19]. Deep learning, a key AI technology, has been applied to tasks such as crop prediction, pest detection, and seed classification. Recent studies have demonstrated deep learning’s effectiveness in seed germination detection [20,21]. For example, reference [22] used a semi-automatic germinator for high-throughput seed germination scoring, while [23] improved detection accuracy with image segmentation and convolutional neural networks. Reference [24] achieved 98.5% accuracy in “Enhancing Sunflower Head Segmentation and Counting Using Improved UNet”. Despite advancements, traditional image processing methods face limitations in complex agricultural environments. Sensitivity to environmental factors and the need for multiple processing steps reduce their practicality. Deep learning methods, especially those based on convolution regression and object detection, show promise. For example, reference [25] used UAV images and CNNs for plant counting, while [26] employed CNNs for citrus tree counting in high-density orchards. Detection-based methods like those by [27] have proven effective, particularly in scenarios with high target visibility. Furthermore, reference [28] investigates the application of deep learning for seed categorization, demonstrating significant benefits over previous methods, notably in terms of accuracy and efficiency. Deep learning’s performance, on the other hand, is strongly dependent on the quality of the dataset utilized, the selection of the suitable model, and the effectiveness of the training process. Reference [29] emphasizes the importance of high-quality datasets and the requirement for thorough model selection in deep learning applications. Reference [30] expands on this by proving the direct impact of dataset quality and model selection on deep learning model performance. This emphasizes the importance of being precise in the selection and preparation of datasets, as well as in the selection and tweaking of deep learning models for optimal results in seed mix detection and classification.
There are multiple object detection algorithms available, such as Region-based Convolutional Neural Network (R-CNN), Fast Region-based Convolutional Neural Network (Fast R-CNN), and Single Shot Detector (SSD) [31]. A single neural network can be used to combine all necessary features of an object detection system, as demonstrated in [32]. One such algorithm is You Only Look Once (YOLO), which was established in 2016. Ref. [33] found that the YOLO algorithm outperformed other algorithms in terms of speed and accuracy when detecting and calculating object coordinates. The basic YOLO model processes images in real time at 45 frames per second (FPS). Fast YOLO, a smaller variant of the network, can process at 155 FPS and achieve twice the mean Average Precision (mAP) of other real-time detectors. Reference [33] found that while YOLO generates more localization errors, it has a lower likelihood of predicting false positives in the background. Over the years, YOLO has evolved, with versions from YOLOv1 to YOLOv9 offering improvements in speed, accuracy, and efficiency. YOLOv5 is noted for its performance, while YOLOv7 boasts even higher accuracy and faster speeds [34,35]. Nonetheless, most existing studies focus on uniform, single-type seeds or controlled backgrounds, with little investigation into mixed-seed detection under adhesion, occlusion, or variable lighting conditions common in agricultural practice.
Despite these developments, there is still a substantial research gap. The relationship between planter kinematics, image-based detection performance, and the mechanical and physical characteristics of seed mixtures has not received much attention. Species heterogeneity (size, density, and shape) in cover crop combinations presents very difficult issues for mechanical consistency and visual recognition precision. Consistency is also impacted by separation caused by vibration and irregular flow during drill operation. Furthermore, the use of sophisticated deep-learning models for the detection of mixed seeds under adhesion or when light conditions change has not been evaluated in many trials. Designing robust detection and counting techniques that can function in a variety of real-world planting and hopper scenarios is therefore essential.
This study bridges the gap by integrating machine-vision and deep-learning techniques to increase multi-seed detection and counting accuracy in complex cover-crop systems. Our primary contributions are:
- ▪ Developing a mixed cover-crop seed multi-species dataset (flax, hairy vetch, red clover, radish, and rye) with real-world adhesion and heterogeneity. To reduce the issue of background lighting during data gathering, an adjustable brightness LED electronic light board with variable light modes was incorporated beneath the imaging platform. This resulted in homogeneous lighting and less shadows and reflections, which would induce bias in model learning.
- ▪ A comparison of two cutting-edge deep learning models (YOLOv5 and YOLOv7) for the identification and categorization of mixed seeds in real-world agricultural contexts.
- ▪ YOLOv7 outperforms YOLOv5 in terms of accuracy, precision, recall, and mAP.
- ▪ The use of detection-based counting to calibrate seed drills, estimate thousand-grain weights, and improve planter uniformity.
- ▪ The research presents a new dataset, light control setup, methodological framework, and empirical verification whose findings facilitate the automation of mixed-seed detection for precision seeding and quality assessment in smart agriculture.
2. Materials and Methods
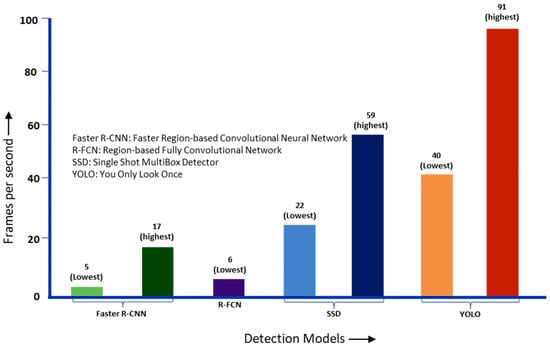
YOLO is an extremely fast model and can process images at 45 frames per second because it doesn’t require complex pipelines. Furthermore, when compared to other real-time systems, YOLO achieves more than double the mean Average Precision (mAP), making it an excellent option for real-time object counting and detection. With 91 FPS, YOLO is significantly faster than the other object detectors, as can be seen in the graphic below. (Figure 1) YOLO has very few background mistakes and significantly higher accuracy than other state-of-the-art models. Yolo is excellent for applications that require quick and reliable object identification because it also offers improved generalization for new domains. Although YOLOv1 has the lowest mAP for automatic detection, the model has been continuously improved by the community since it was made open source. This is among the factors that have contributed to YOLO’s rapid advancements.
Figure 1.
Comparison of YOLO speed with other state-of-the-art object detectors [36].
2.1. YOLO Architecture and Versions
The You Only Look Once (YOLO) model is a popular tool in computer vision, particularly for object recognition tasks. YOLO uses deep learning to find and classify objects in images, providing the coordinates of each object’s bounding box and identifying its class quickly and accurately. The model splits the input image into a grid of cells, and for each cell, it predicts bounding boxes using five parameters: the x and y coordinates of the box’s center, the box’s width and height, and the probability that the box contains an object. YOLO uses neural networks and techniques like backpropagation and gradient descent to improve its accuracy over time. Since its introduction, YOLO has undergone many improvements, leading to versions from YOLOv1 to YOLOv7. According to Nepal and Eslamiat (2022) [37], each version has its own advancements: YOLOv1 uses the softmax function for classification, while YOLOv2 introduces batch normalization, improving accuracy and efficiency. YOLOv3 uses Darknet53 as its backbone, which enhances feature extraction and detection performance, and replaces the softmax function with an independent logistic function, reducing computational complexity. YOLOv4 uses CSPDarknet53, combining Darknet53 and the CSP network, resulting in higher accuracy and efficiency with reduced hardware needs. YOLOv5 introduces the Focus layer with CSPDarknet53, reducing memory requirements and improving speed, making it faster and lighter than YOLOv4. YOLOv6 includes many backbones, neck, head, and training strategy improvements, such as the RepVGG Style structure and EfficientRep Backbone. YOLOv7 exceeds all previous versions in both speed and accuracy, achieving 56.8% average precision at 30 FPS or higher, reducing parameters and computation by about 40% and 50%, respectively, while improving real-time detection accuracy and inference speed. Running on GPU, observed approximately 10% improvement in the inference speed for YOLOv7 over YOLOv5 (Durve et al., 2023) [38]. Overall, YOLO models have become faster and more accurate with each version, making them highly effective for real-time object detection tasks. YOLOv5 and YOLOv7 were specifically chosen for this study based on three main criteria: (1) open-source stability and replicability with agricultural image datasets; (2) good balance between model complexity, inference speed, and scalability in training with mid-range GPUs; and (3) strong benchmarking in prior peer-reviewed agricultural imaging studies, even though later versions (YOLOv8–YOLOv13) have been included [39]. The decoupled heads and transformer-based modules used in YOLOv8, and later models increase the number of parameters and hardware requirements, resulting in small mAP increases (~1–2%) at the expense of a 35–50% longer training period [40]. With real-time inference and dataset variability as the primary concerns, YOLOv5 and YOLOv7 provide the best accuracy-to-efficiency ratio in mixed-seed detection tasks. While YOLOv7 uses Extended Efficient Layer Aggregation Networks (E-ELAN) and planned re-parameterization to provide enhanced feature fusion and real-time detection accuracy [41]. YOLOv5 is a lightweight baseline detector that performs well with smaller seed datasets. The combination makes it possible to assess robust detection against adhesion and heterogeneity using both a useful baseline (YOLOv5) and a cutting-edge reference point (YOLOv7).
- YOLOv5
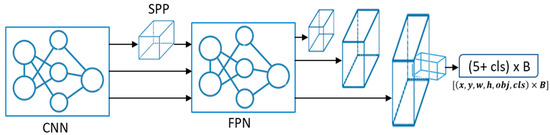
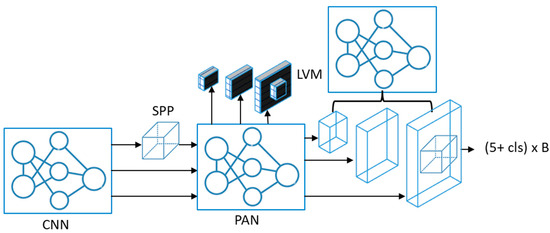
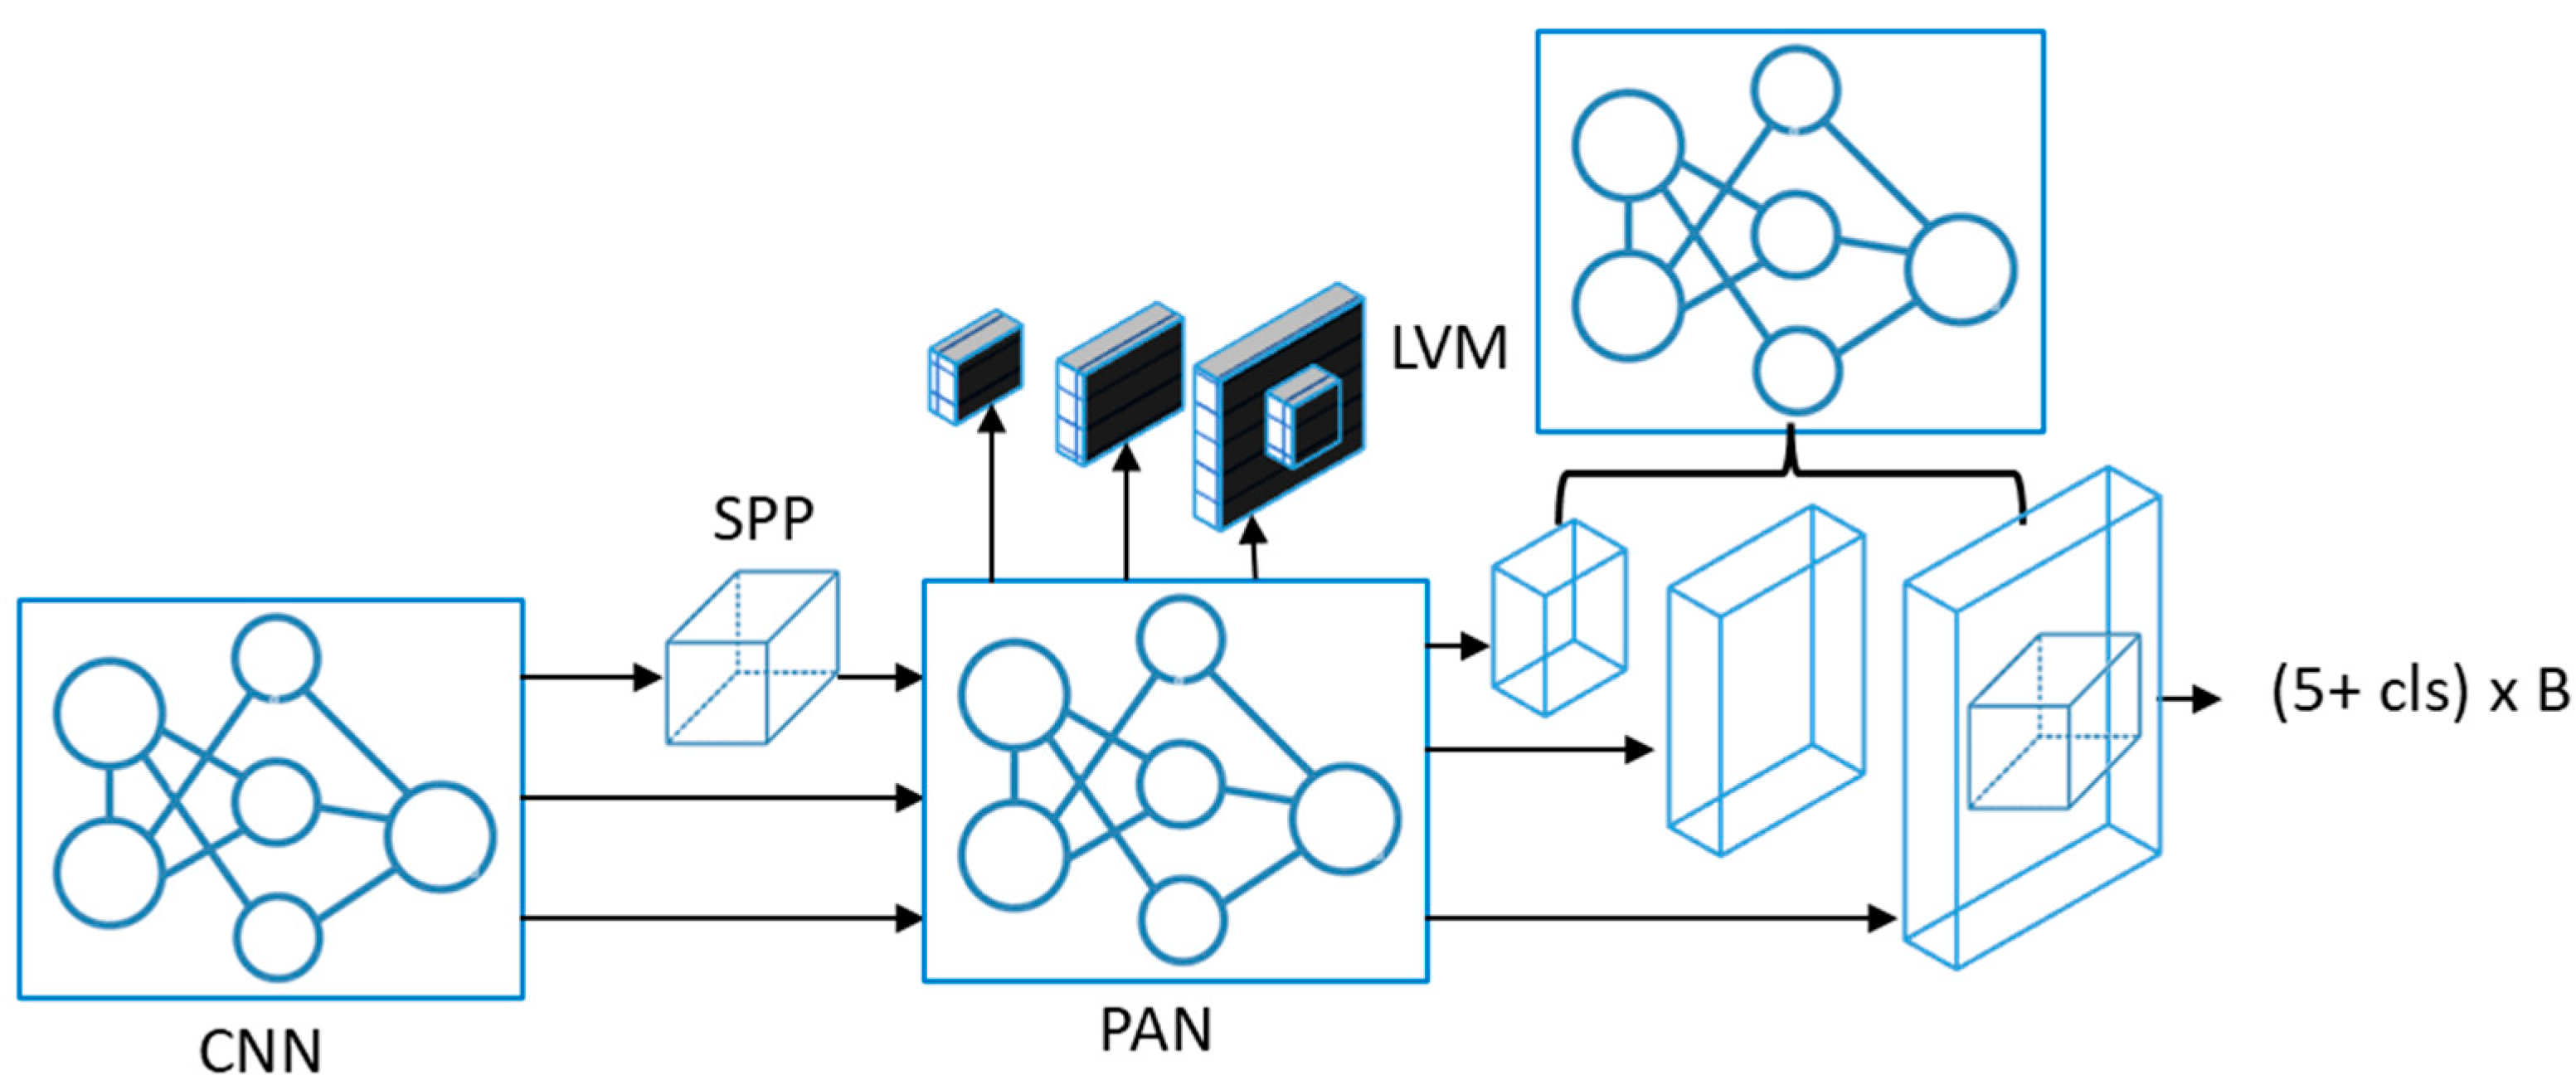
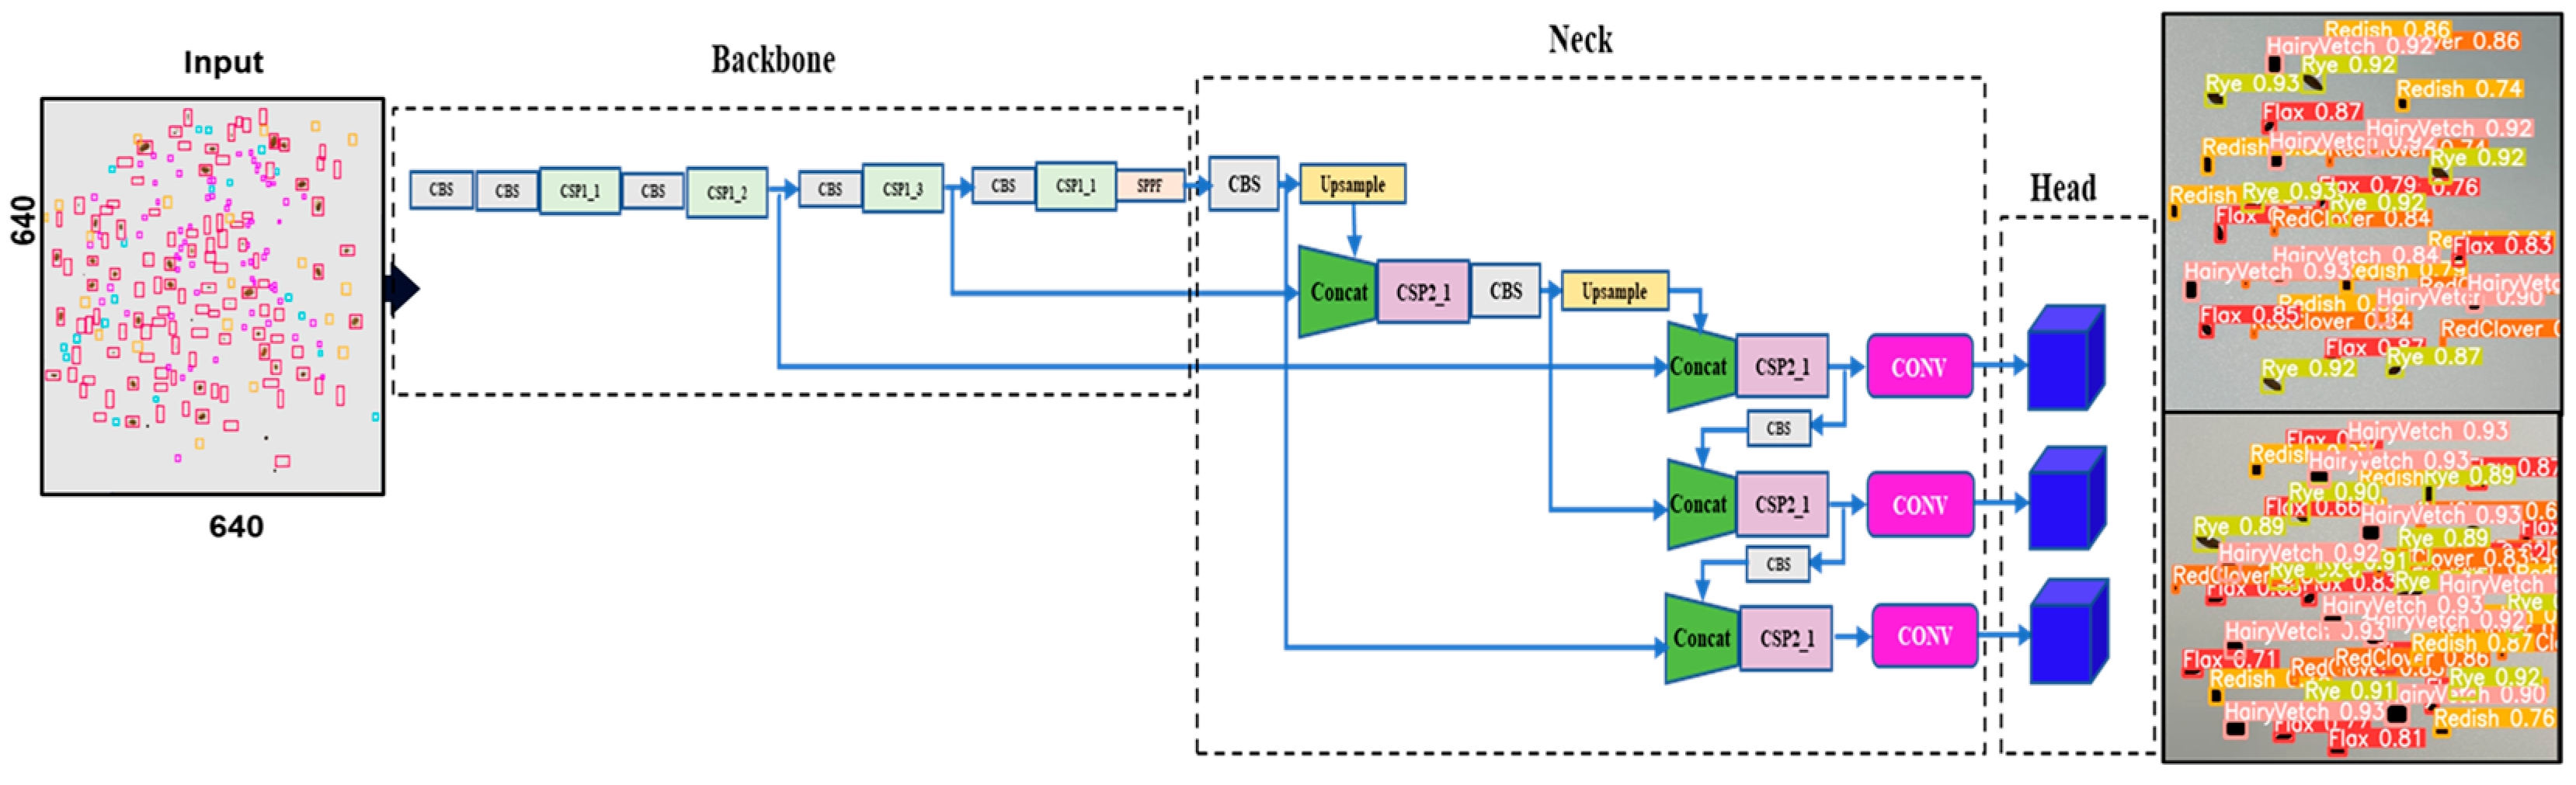
The YOLOv5 architecture consists of three main components: the backbone, neck, and head. The backbone of YOLOv5 is based on the CSPDarknet53 design, a variation in the Darknet architecture. It generates three feature maps P3, P4, and P5, with dimensions of 80 × 80, 40 × 40, and 20 × 20, respectively. These feature maps represent different receptive field scales and capturing multilevel image details. The neck module, constructed on the PANet (Path Aggregation Network) structure, strengthens the bidirectional flow of the information between feature layers. By integrating both top-down and bottom-up paths through the Feature Pyramid Network (FPN), PANet improves the localization precision of small and irregular objects. This is particularly beneficial for agricultural applications where seed sizes vary widely, and mixed seeds often appear partially occluded (Figure 2). The head of YOLOv5 consists of the final prediction layers, which handle objectness prediction, classification, and bounding box regression. The objectness branch determines the presence of objects in each cell, the classification branch distinguishes between seed categories (flax, hairy vetch, red clover, radish, and rye), and the bounding box regression localizes each seed precisely within the image. Two significant algorithmic advancements presented in YOLOv5 include improved detection stability and recall.
Figure 2.
Basic architecture of YOLOv5 model.
Power-Based Decoder: used a power-based formulation in place of YOLOv3’s exponential regression, limiting output scaling within anchor boundaries to guarantee stable training and quicker convergence.
Neighborhood Positive Sampling: improved the detection of dense and overlapping seeds while making up for recall restrictions by increasing the number of training grids deemed positive.
YOLOv5 is a dependable baseline for mixed-seed identification and counting in precision agriculture because of these advancements, which work together to maintain an ideal balance between computational efficiency and detection precision.
- b.
- YOLOv7
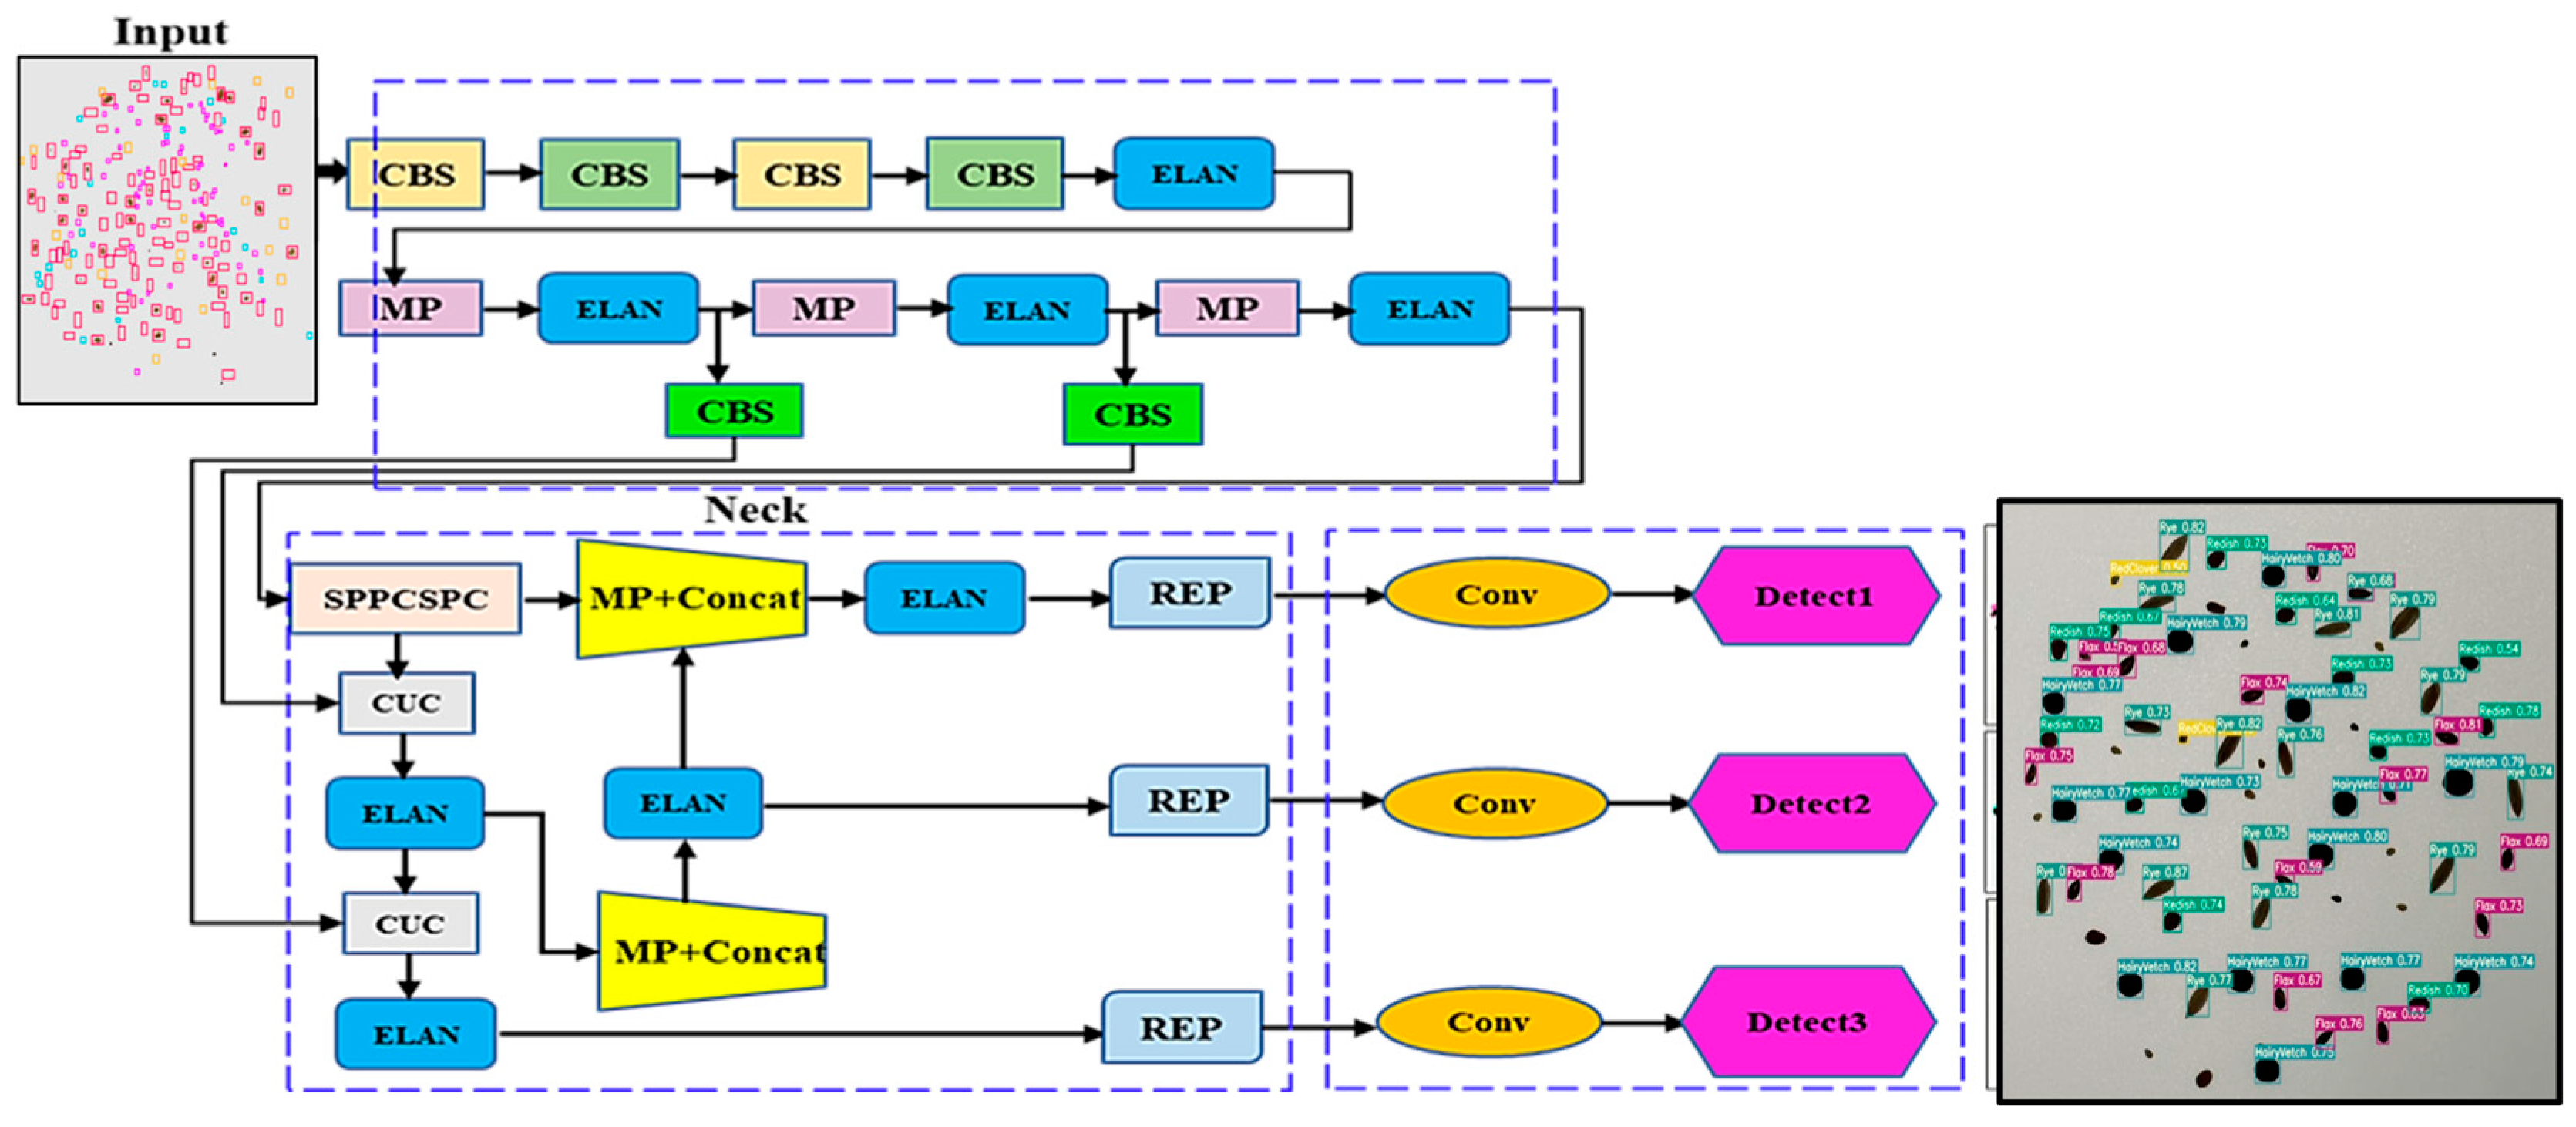
YOLOv7 utilizes extended efficient layer aggregation networks (E-ELAN), employing expand, shuffle, and merging cardinality techniques to continuously enhance learning ability without disrupting the original gradient path [42]. This design modification occurs solely within the computational block, leaving the transition layer architecture unchanged. Besides preserving the E-LAN design, E-ELAN facilitates diverse feature learning among different computational block groups [Figure 3]. Additionally, YOLOv7 incorporates model scaling for concatenation-based models, adjusting model attributes to produce varied scales for different inference speeds. The compound scaling method maintains the model’s original properties and optimal structure, as highlighted by [43], who noted that YOLOv7 outperforms existing object detectors in both speed and accuracy across a range of FPS values on GPU V100, achieving a remarkable 56.8% AP accuracy. The YOLOv7 introduces several advancements that improve accuracy and efficiency beyond E-ELAN. By effectively re-parameterizing the layers, the planned RepConv modules from RepVGG [44] allow for faster inference and stable convergence. Prediction alignment and refinement are enhanced without the need for additional complexity via consistent, coarse-to-fine label assignment procedures [45]. YOLOv7 is extended to detection, segmentation, and pose estimation with support for anchor-based and anchor-free heads, and partial auxiliary loss speeds up convergence even further. The YOLOv7 real-time detection architecture is highly scalable and accurate for agricultural applications thanks to the advancements in E-ELAN aggregation, RepConv re-parameterization, and dynamic label assignment.
Figure 3.
Basic architecture of YOLOv7 model.
Table 1 summarizes the selection of YOLOv5 and YOLOv7 based on their best accuracy, speed, and computational efficiency ratios. With its E-ELAN and RepConv improvements, YOLOv7 offers greater precision and robust feature learning, while YOLOv5 offers a portable, reliable, and repeatable baseline appropriate for small-object seed detection. The more recent versions (YOLOv8–v13) require more hardware and only provide slight accuracy improvements. Therefore, these two models are the most effective in achieving the study’s objectives of precise and efficient mixed-seed counting and analysis.
Table 1.
Comparative summary of YOLO v1–v13 architectures and performance.
2.2. Data Preparation
2.2.1. Overview of the Data
Our original dataset, with a balanced distribution across classes, comprised 500 images: 50 images for each type of single seed (flax, hairy vetch, red clover, radish, and rye) and 250 images of mixed seeds. Using publicly available seed datasets, we significantly enlarged the dataset through multi-stage augmentation and supplementary validation to improve model generalization and overcome dataset-size constraints.
The data was augmented with hue variation to replicate spectral diversity, positional variability was captured through rotation and horizontal flipping, and illumination changes were replicated through contrast-brightness modifications. About 2000 annotated images were produced because of these changes, which almost four times increased the dataset size. The augmented dataset was randomly divided into training (70%), validation (20%), and testing (10%) subsets, corresponding to roughly 1400, 400, and 200 images, respectively.
2.2.2. Data Collection and Annotation
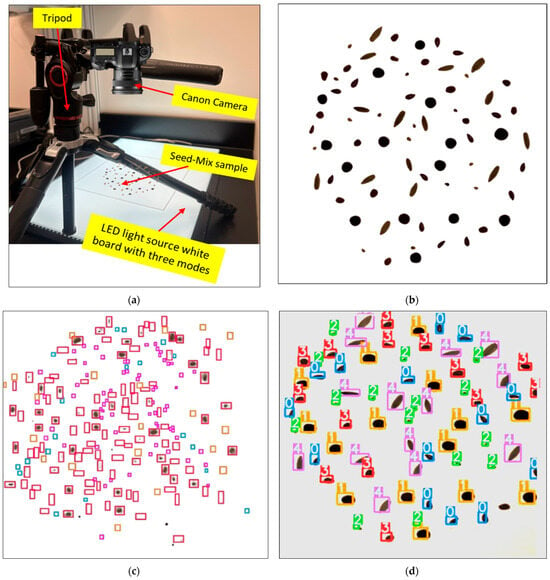
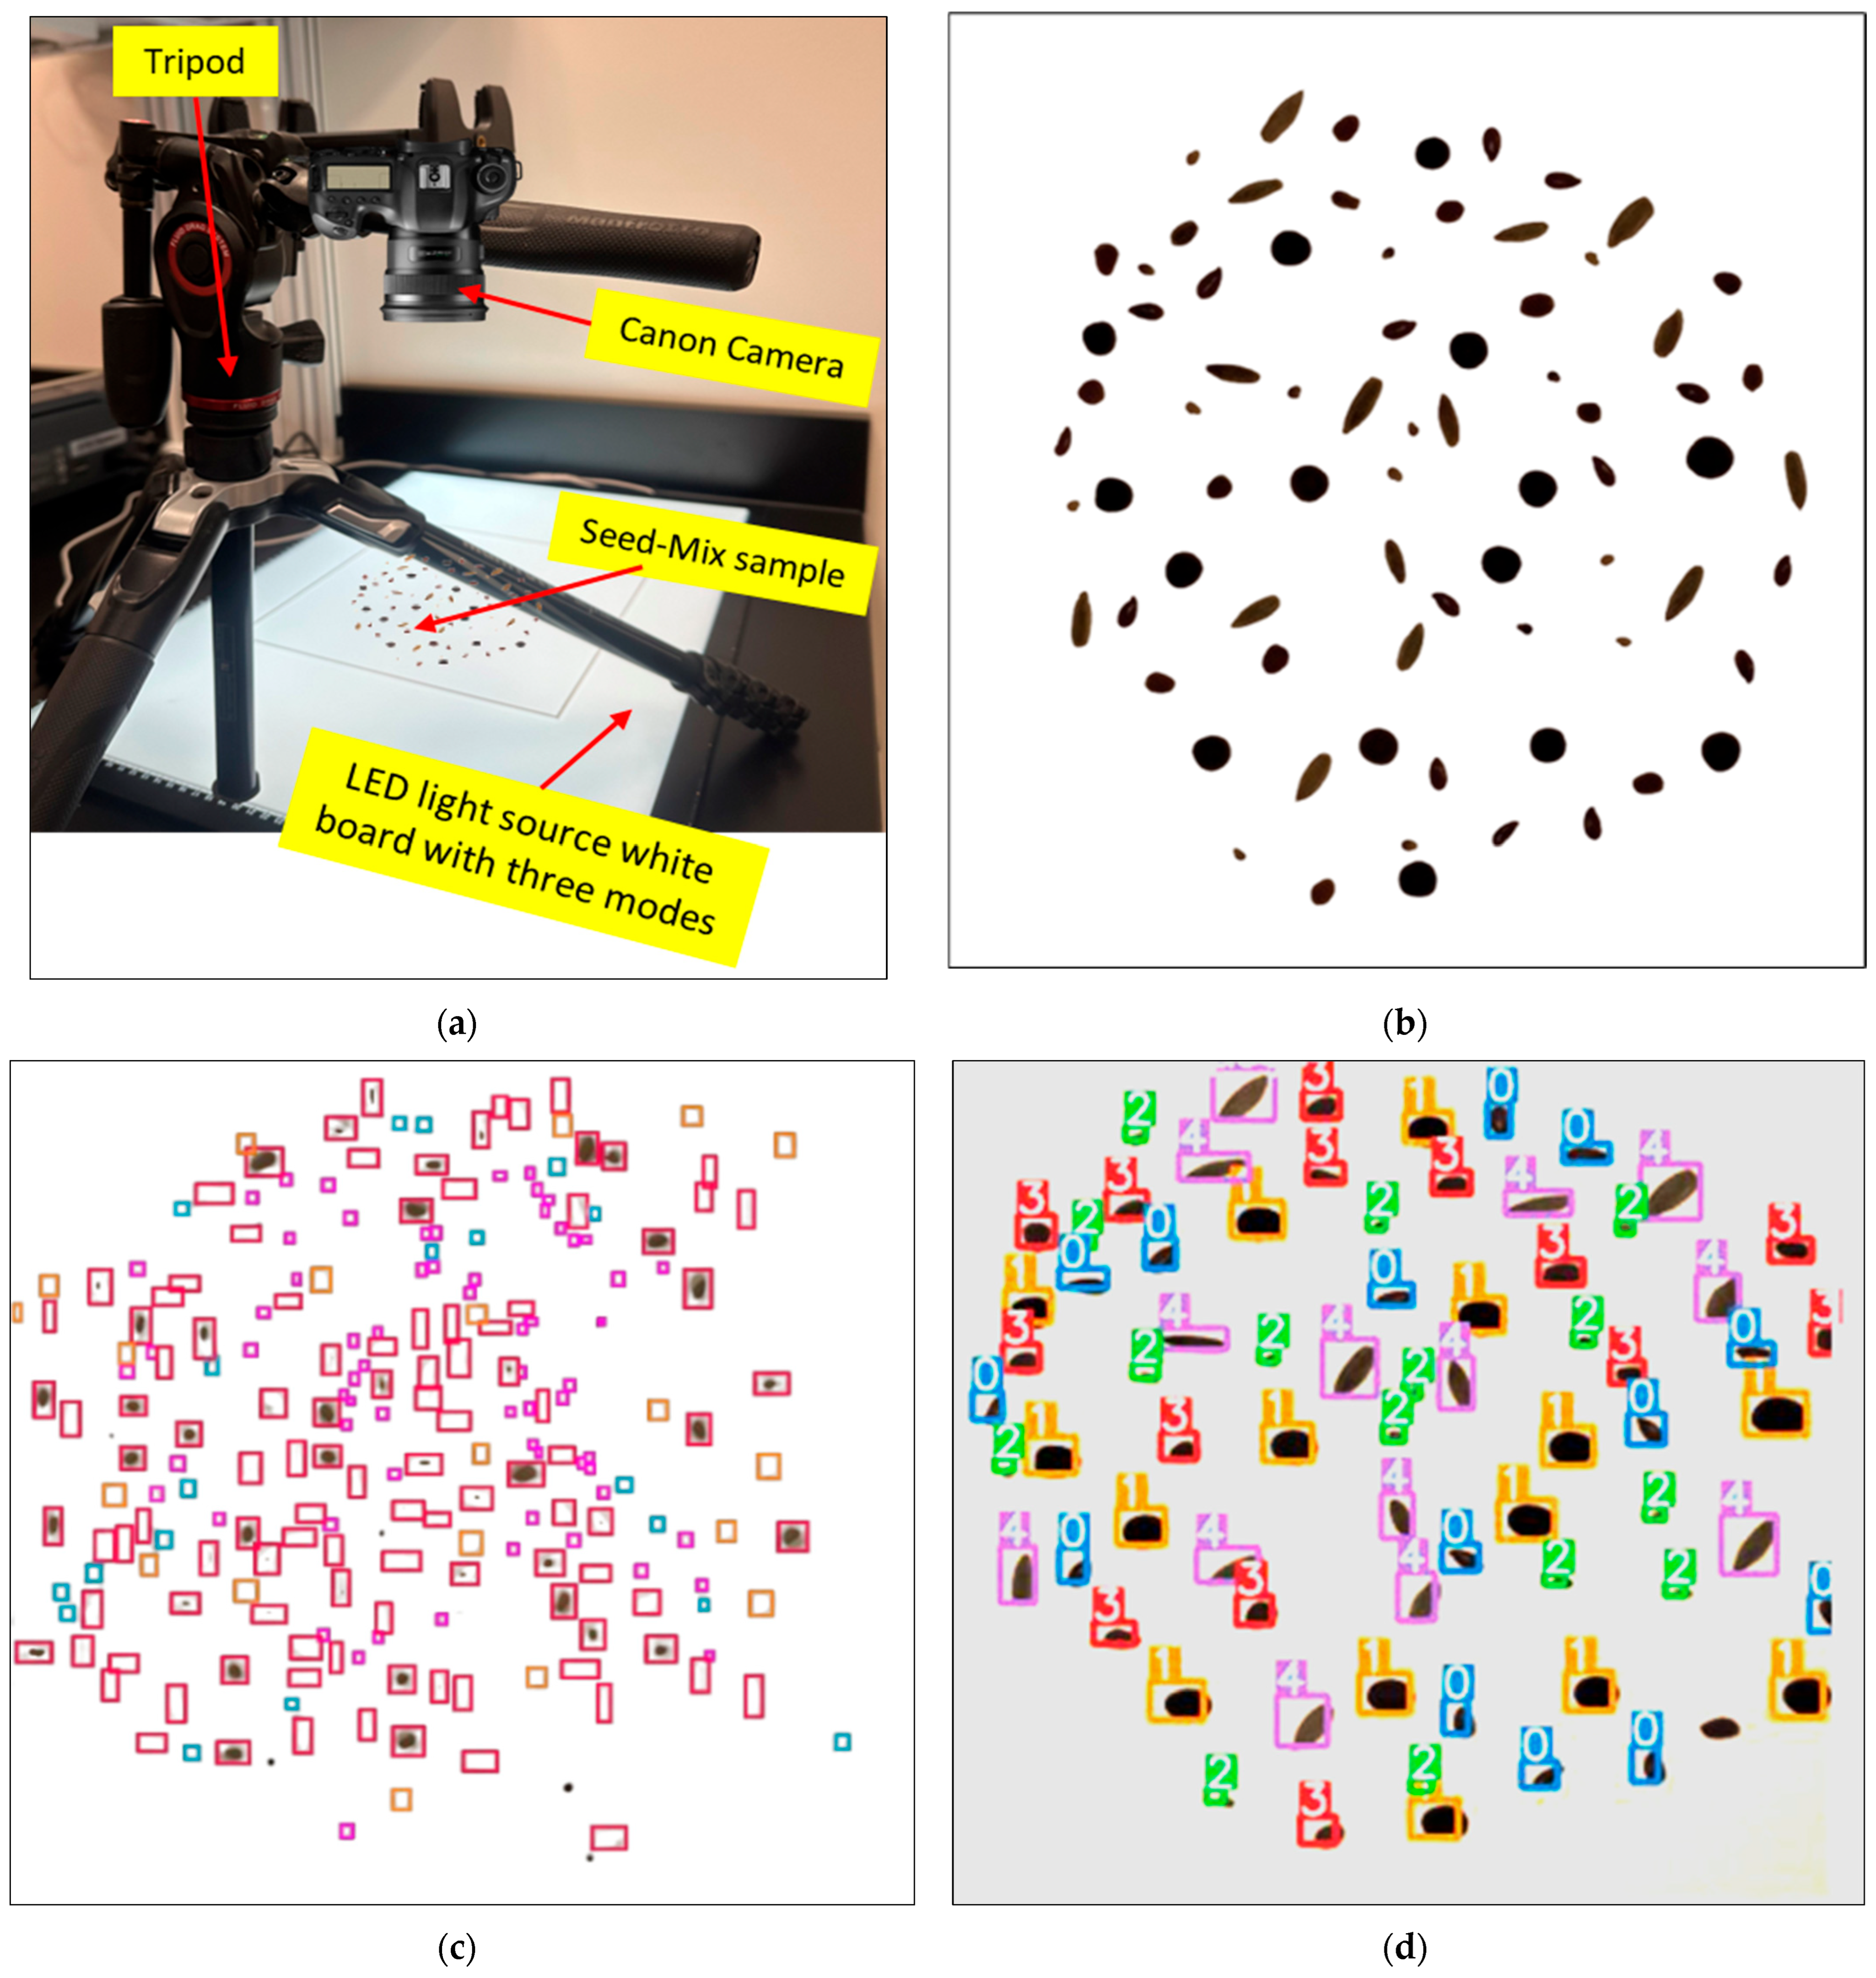
We captured high-quality images of seed types including flax, hairy vetch, red clover, radish, and rye using a Canon LP E6N R6 5D Mark IV Camera with a 24–105 mm f/4 L II Lens mounting on the tripod [Figure 4a]. Each RGB image was manually captured at a resolution of 6000 × 4000 pixels using a Canon EOS R6 Mark IV Camera equipped with a 24–105 mm f/4 L II lens, providing a versatile focal range and good low-light performance. To maintain consistency, standardized camera settings were employed, and the object-to-camera distance was kept at approximately 10 cm. To enhance the model’s ability to generalize to real-world scenarios, images were taken under varying backgrounds and lighting conditions using an LED light source white board with three modes: White, Warm, and Mix. This diversity ensures the model is not solely reliant on specific visual features from controlled environments, making it robust for unseen data. After capturing the images, they were meticulously annotated with bounding boxes and class labels using the Robo-flow platform to create ground truth bounding boxes, as illustrated in Figure 4. Roboflow offers a robust set of tools for streamlining the development of computer vision workflows for real-world applications [40]. The annotations were saved in YOLO format, with each image’s annotations stored in a zip file sharing the image’s filename. Additionally, a “classes.yml” file was created in each folder to list all class names. This annotation process is crucial for the YOLO object detection model to accurately interpret the labeled data and learn the characteristics of each object class.
Figure 4.
(a) Camera setup (b) Original image (c) Annotated image and (d) Labeled image (0-flax, 1-hairy vetch, and 2-red clover, 3-reddish and 4-rye).
2.2.3. Data Pre-Processing
We performed two key steps in the preprocessing phase to get the images suitable for model training. Initially, we employed an auto-orientation mechanism to automatically detect and correct any rotational irregularities in the images, enabling uniform object to display independent of the camera orientation at the time of collection. Second, a uniform 640 × 640-pixel size was applied to all images, which reduced CPU needs and made processing many images efficiently possible. Through these preprocessing stages, a dataset of uniformly sized and aligned images was produced, which improved model performance and learning.
Data Augmentation
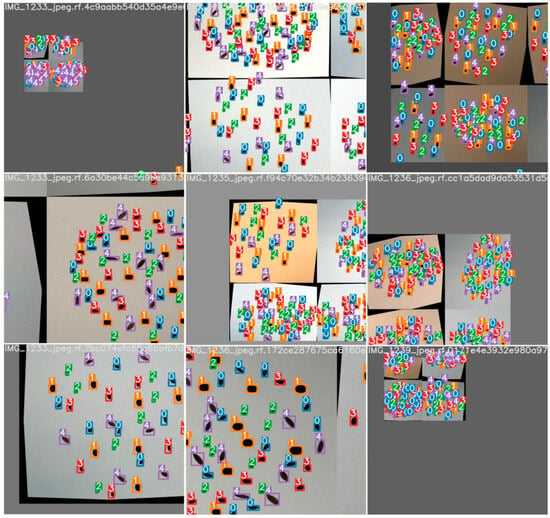
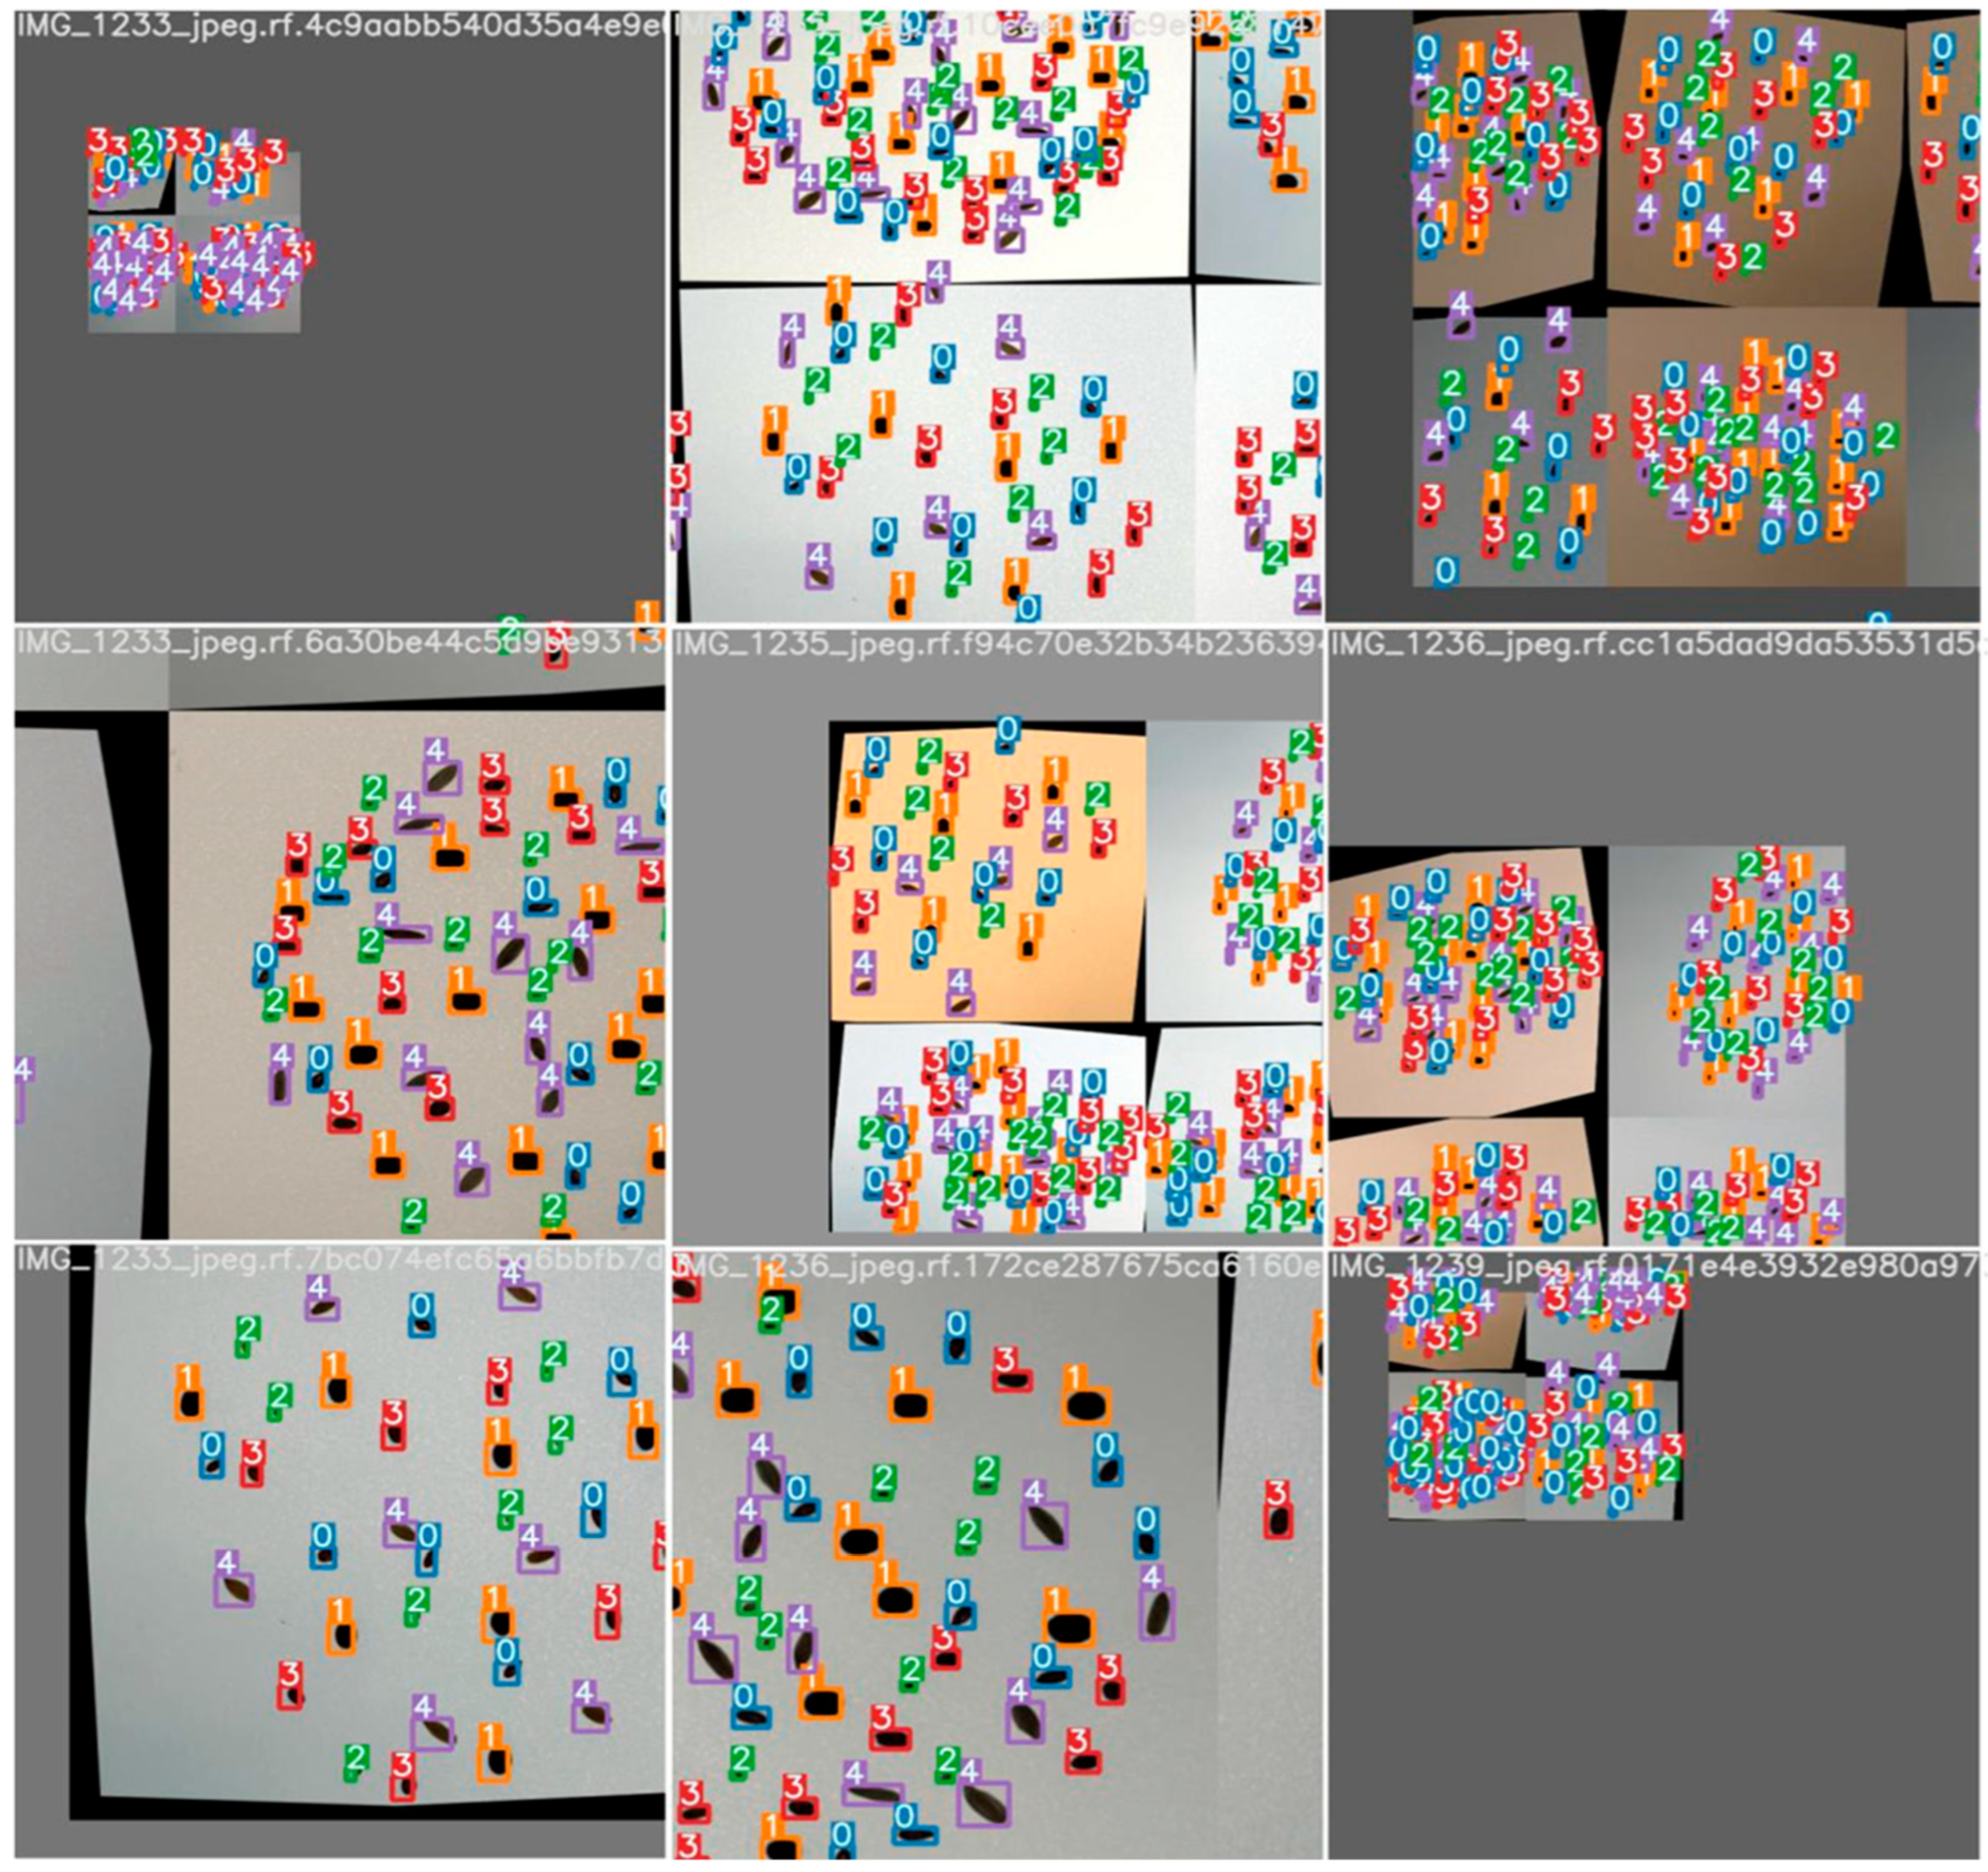
After preprocessing, we applied data augmentation to increase the dataset’s strength and the model’s generalizability to adjust to changes in the actual world. To improve the model’s accuracy under a variety of circumstances, this included creating modified versions of already-existing images to simulate actual scenarios the model would face during deployment. By using strategies like horizontal flipping, we were able to increase four times the number of training samples and let the model learn object properties independent of orientation. To simulate camera changes and color shifts, random rotations and hue modifications were done between −15 and +15 degrees [Figure 5]. By using these methods, the size of the dataset was expanded to approximately 2000 photos, improving the quality of the training data and producing a more robust and adaptable model for use in real-world situations.
Figure 5.
Mixed seeds images after data augmentation (flipping, rotating, and adjusting the hue).
2.3. Data Implementation and Training
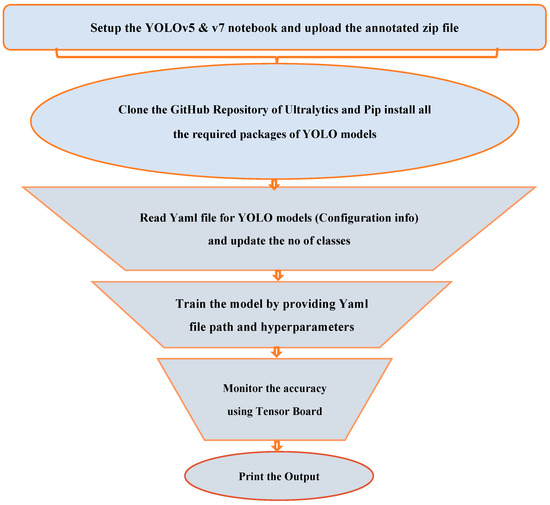
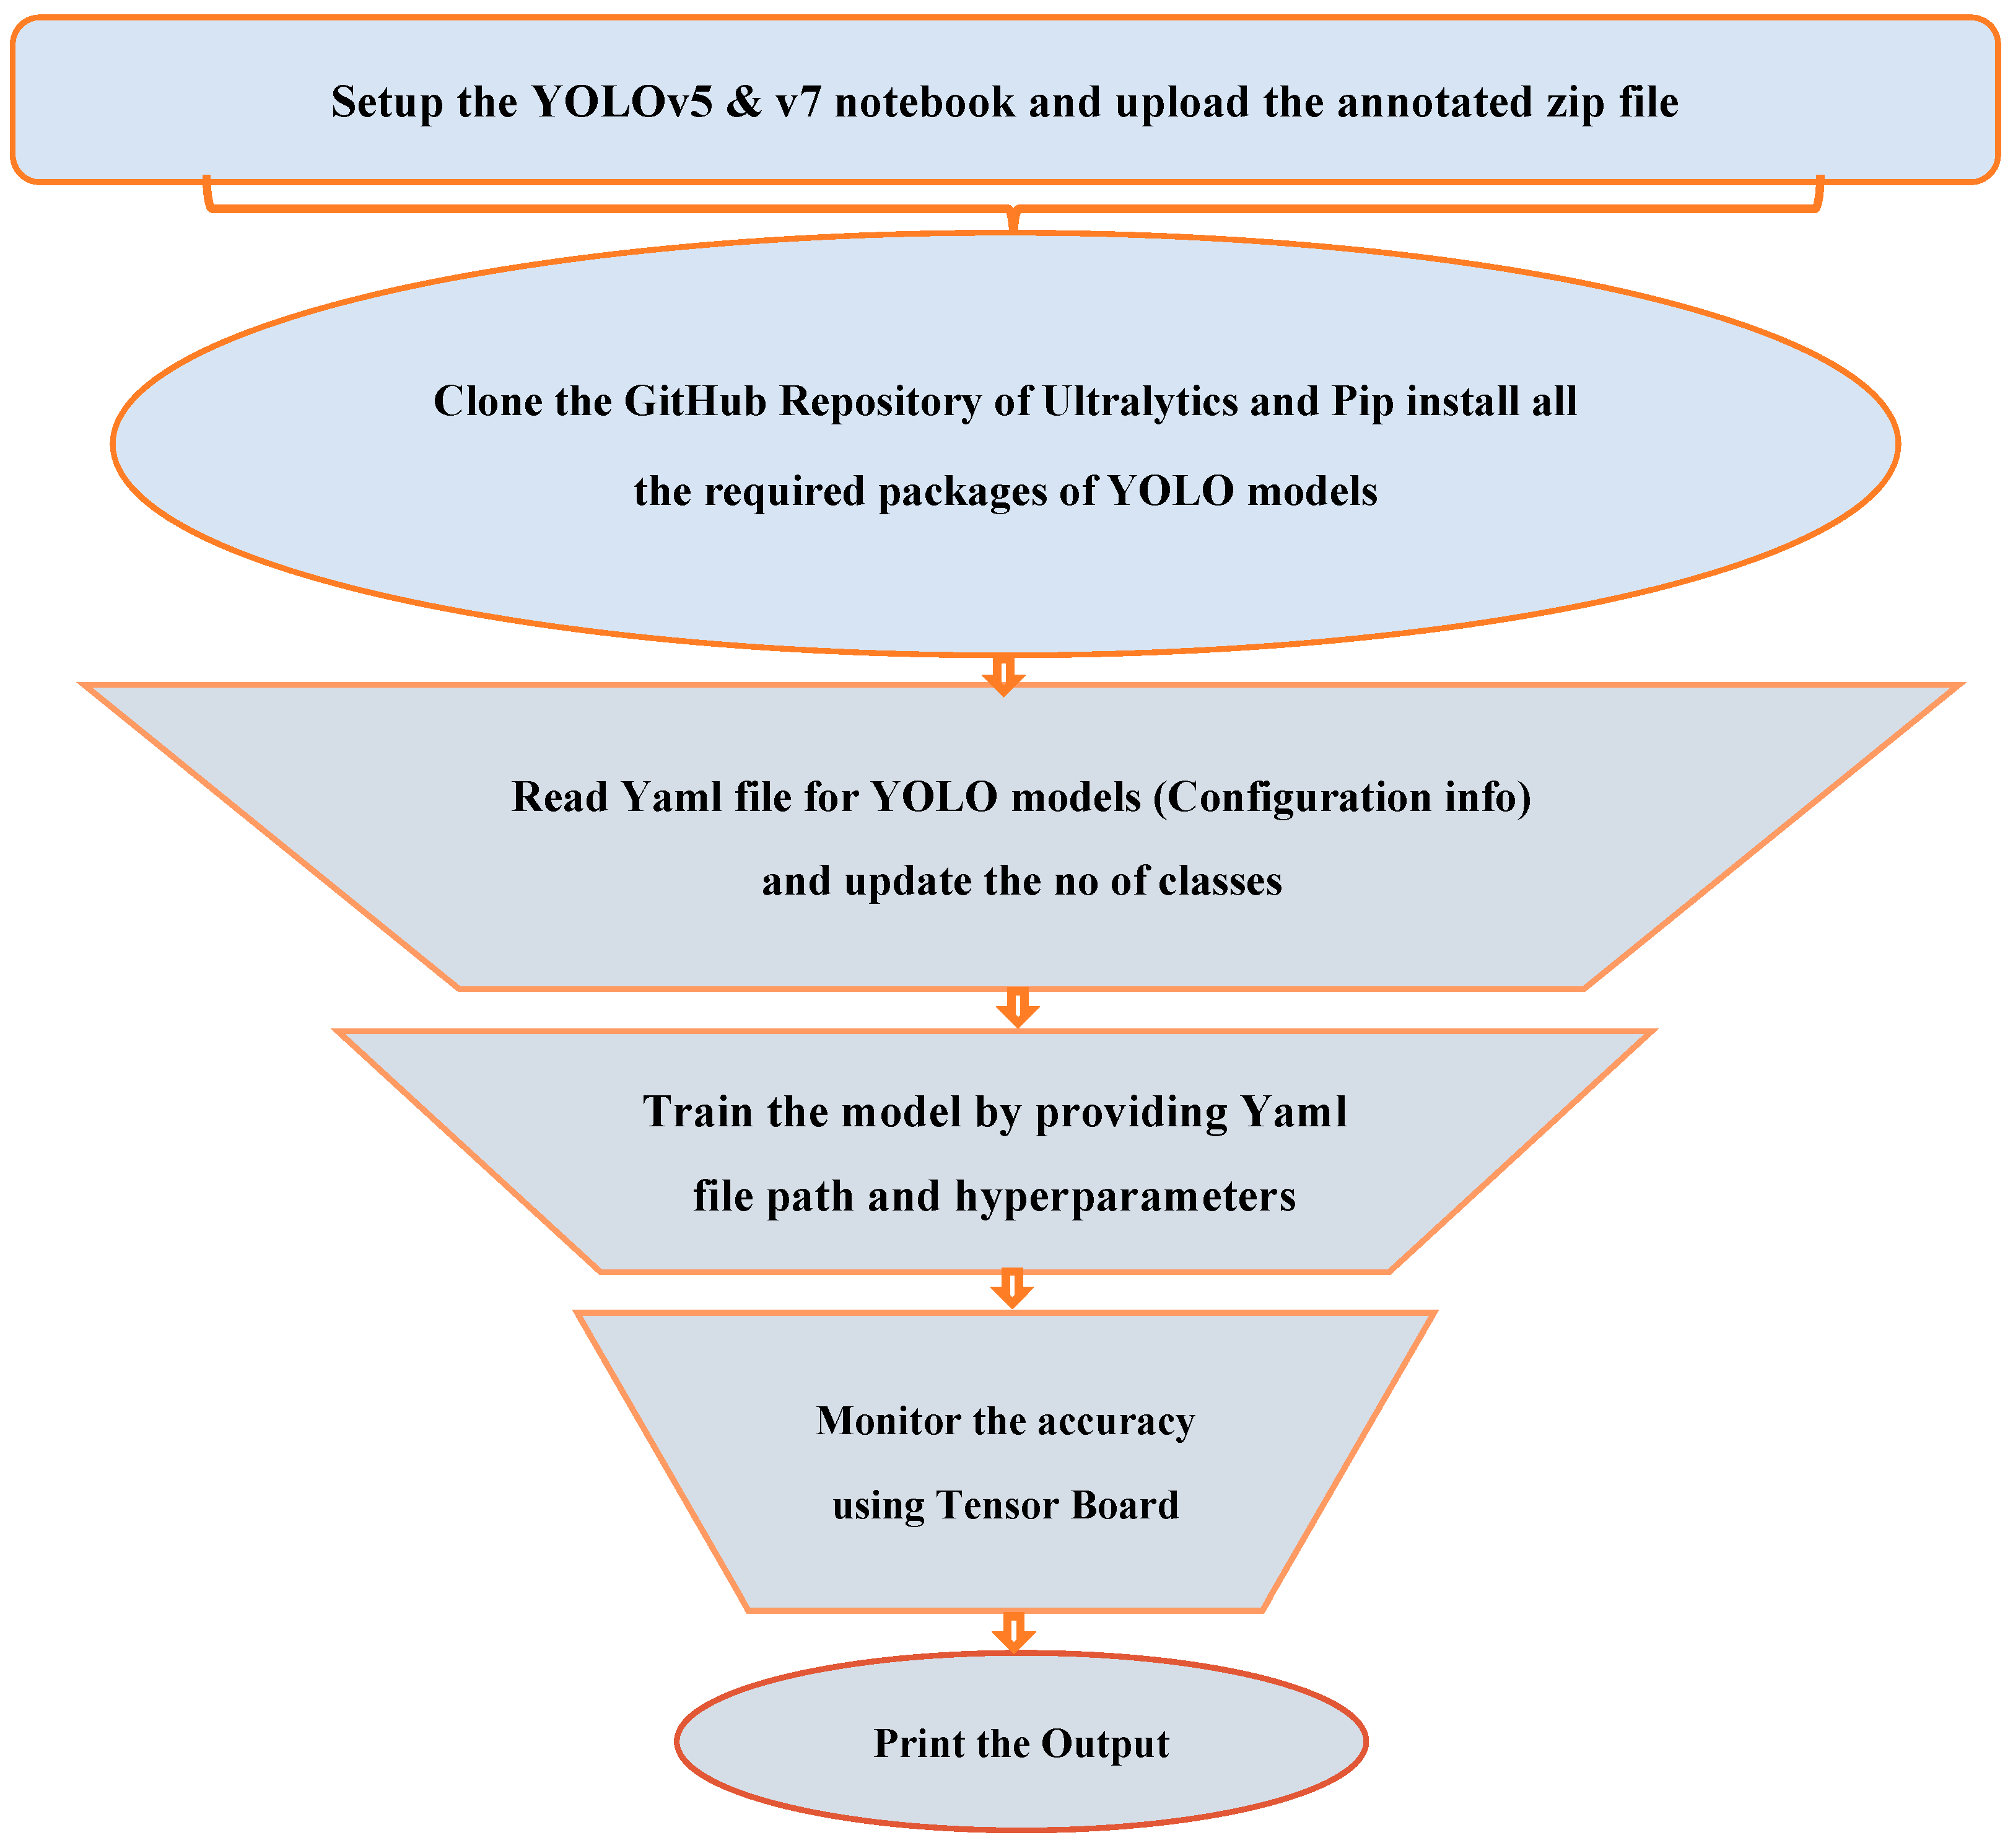
The YOLO (v5 and v7) notebook environment is configured, making sure that the required applications are installed, including Python 3.10, PyTorch 2.1.0 with Torchvision 0.19.0, and CUDA 12.1 for GPU acceleration. After that, the dataset which consists of images and associated annotation files like YOLO format.txt files for bounding box coordinates are uploaded as an annotated zip file. The coding and tools needed for training and testing YOLO models are contained in the cloned Ultralytics GitHub v7.0 repository for YOLOv5 & v7, and pip is used to install all the dependencies and necessary packages from the repository, such as PyTorch, torchvision, matplotlib, and other requirements. To ensure correct class detection during training and inference, the location and reading of the YAML configuration file particular to YOLO models is done. The number of classes is then changed to match those in the dataset. To begin training, the path to the new YAML file must be supplied, together with hyperparameters like batch size, learning rate, and epochs that must be optimized for precise object detection. Tensor Board, a real-time visualization tool, is then used to track metrics like as loss, precision, recall, and other assessment measures during the training process. This helps to assess the model’s learning progress, detect problems, and make the required adjustments to improve performance. Ultimately, the output files or results are printed at predetermined intervals or once training is finished in order to assess the model’s performance and measure factors like inference speed, detection accuracy, and other important metrics. These procedures allow for the efficient creation and training of a YOLO model customized for mixed seeds detection, classification and counting tasks, Figure 6.
Figure 6.
Implementation and Training Workflow for YOLO (v5 &v7) Models.
2.3.1. YOLOv5
We started our training process with the YOLOv5 architecture (Figure 7). We set specific hyperparameters for the training process, such as a learning rate of 1 × 10⁻³; a decay rate of 1 × 10⁻⁴; a batch size of 5; a momentum of 0.937, and a total of 500 epochs. To optimize the training process and investigate the benefits of a more stable computing environment, we moved the training to Google Colab Pro, a cloud-based platform that provides an A100 GPU with 40 GB of RAM [Table 2]. Training time was significantly decreased by using Colab Pro. We noticed that the model achieved its highest performance at the 375th epoch, indicating diminishing returns beyond this point, even though the precise number of epochs employed is unknown. Over the last 125 epochs, additional training did not considerably increase model accuracy. As a result, to maximize efficiency, we choose to discontinue training now. The final training results were plotted for visual analysis once they were recorded; The training, validation, and testing results were stored on Google Drive to access later and these will be covered in more detail in the result section. Additionally, we assessed the model’s performance on a specific testing dataset, which verified that the trained YOLOv5 model performed satisfactorily by successfully identifying, classifying, and counting the seeds in the given image dataset.
Figure 7.
Structure of the proposed YOLOv5 model for mix seed detection, classification and counting.
Table 2.
Training Environment and Hardware Specifications.
2.3.2. YOLOv7
The YOLOv7 architecture (Figure 8) was analyzed after the YOLOv5 model was successfully trained and assessed. Google Colab Pro (A100 GPU and 40 GB of RAM) was used with equivalent hyperparameters (learning rate of 1 × 10⁻²; decay rate of 5 × 10⁻⁴; a batch size of 5; momentum of 0.937 and a total of 500 epochs) to speed up training [Table 3]. The process was completed in about 4 h. Similarly to YOLOv5, training was stopped at the 425th epoch due to diminishing returns, indicating optimal performance. The specifics of the recorded and visualized final YOLOv7 training outcomes will be discussed later. A comparative analysis with YOLOv5 revealed a marginal improvement in performance with YOLOv8, indicating a possible benefit for this activity. Additionally, YOLOv7 was assessed on a specific testing dataset, which validated its efficacy in practical mixed seeds identification, classification and counting scenarios.
Figure 8.
Structure of the proposed YOLOv7 model for mix seed detection, classification and counting.
Table 3.
Training hyperparameters.
2.4. Seed Counting Methodology
Correct counting of seeds was achieved through a multi-stage post-processing pipeline on the YOLOv5 and YOLOv7 detection outcomes. Both models produced bounding boxes along with their corresponding class labels and confidence levels for every detected seed.
Detection Filtering: Only detections with a confidence level ≥ 0.5 were retained. Bounding boxes were ordered in decreasing order of confidence to prefer high-confidence detections.
Non-Maximum Suppression (NMS): To remove duplicate detections of a single seed, NMS was used with IoU threshold 0.45. Overlapping boxes of the same class and greater than this threshold were merged and kept only the most confident box.
Centroid Clustering for Overlaps and Occlusions: For overlapped or occluded seeds that created several nearby detections, centroids of their bounding boxes were determined and clustered using a distance-based threshold (≤15 pixels). A single seed instance was represented by each cluster, minimizing double-counting errors when seed density was high.
Count Generation:The seeds per image were counted as the number of unique remaining bounding boxes following NMS and centroid clustering. They were then counted by seed type (hairy vetch, flax, red clover, radish, and rye) based on class-label outputs.
Manual Verification: 10% of test images were manually verified to confirm the auto counts. Auto counts were within <±2% of the manual reference counts, confirming that detection-to-count conversion was correct.
2.5. Performance Evaluation Matrices
To evaluate the performance of our model, we employ three key evaluation metrics:
2.5.1. Precision
Precision measures the ratio of correctly predicted positive values to the total predicted positive values.
Precision = (True Positive + False Positive)/True Positive
2.5.2. Recall
Recall calculates the percentage of correctly predicted positive values to all the actual positive values in the relevant class.
Recall = (True Positive + False Negative)/True Positive
2.5.3. mAP (Mean Average Precision)
mAP is the average mean value of average precision (AP) across all categories. By comparing the detected box to the ground-truth box bounding box at the Intersection over the Union (IOU) threshold of 0.5, the mAP@0.5 computes a score. The higher the score, the more accurate the model’s detections are. mAP@0.5:0.95 is the average mAP in steps of 0.05 over a range of criteria, from 0.5 to 0.95. AP is calculated based on the Precision–Recall curve.
In multi-object detection tasks,
True Positive (TP) refers to correctly predicted bounding boxes that meet both classification and bounding box criteria, typically having an IOU above a predefined threshold.
False Positive (FP) refers to predicted bounding boxes with IOU below the threshold, and False Negative (FN) represents negative samples incorrectly classified as positive.
2.5.4. Loss Function
The YOLOv5 model employs a specific loss function to calculate the loss for objectness, and class probability, and refers to the weighted average of precision and recall, bounding box regression. This loss function is essential for training the model effectively. In our methodology, we use the following loss functions:
- A.
- BCEclsloss (binary cross-entropy loss):
This loss function is utilized to calculate the loss for class probability and target score. It measures the difference between the predicted class probabilities and the ground-truth class labels.
- B.
- GIOU_loss (generalized intersection over union loss):
The GIOU_Loss is employed as the loss function for bounding box regression. It is based on the Generalized Intersection over Union (GIOU) metric, which quantifies the similarity between
where
LGIOU = 1 − GIOU
- yi is the ith scalar value in the model output.
- i is the corresponding target value.
- N is the number of scalar values in the model output.
- A represents the predicted bounding box.
- B represents the ground-truth bounding box.
- C is the minor enclosing shape that includes both A and B.
3. Results
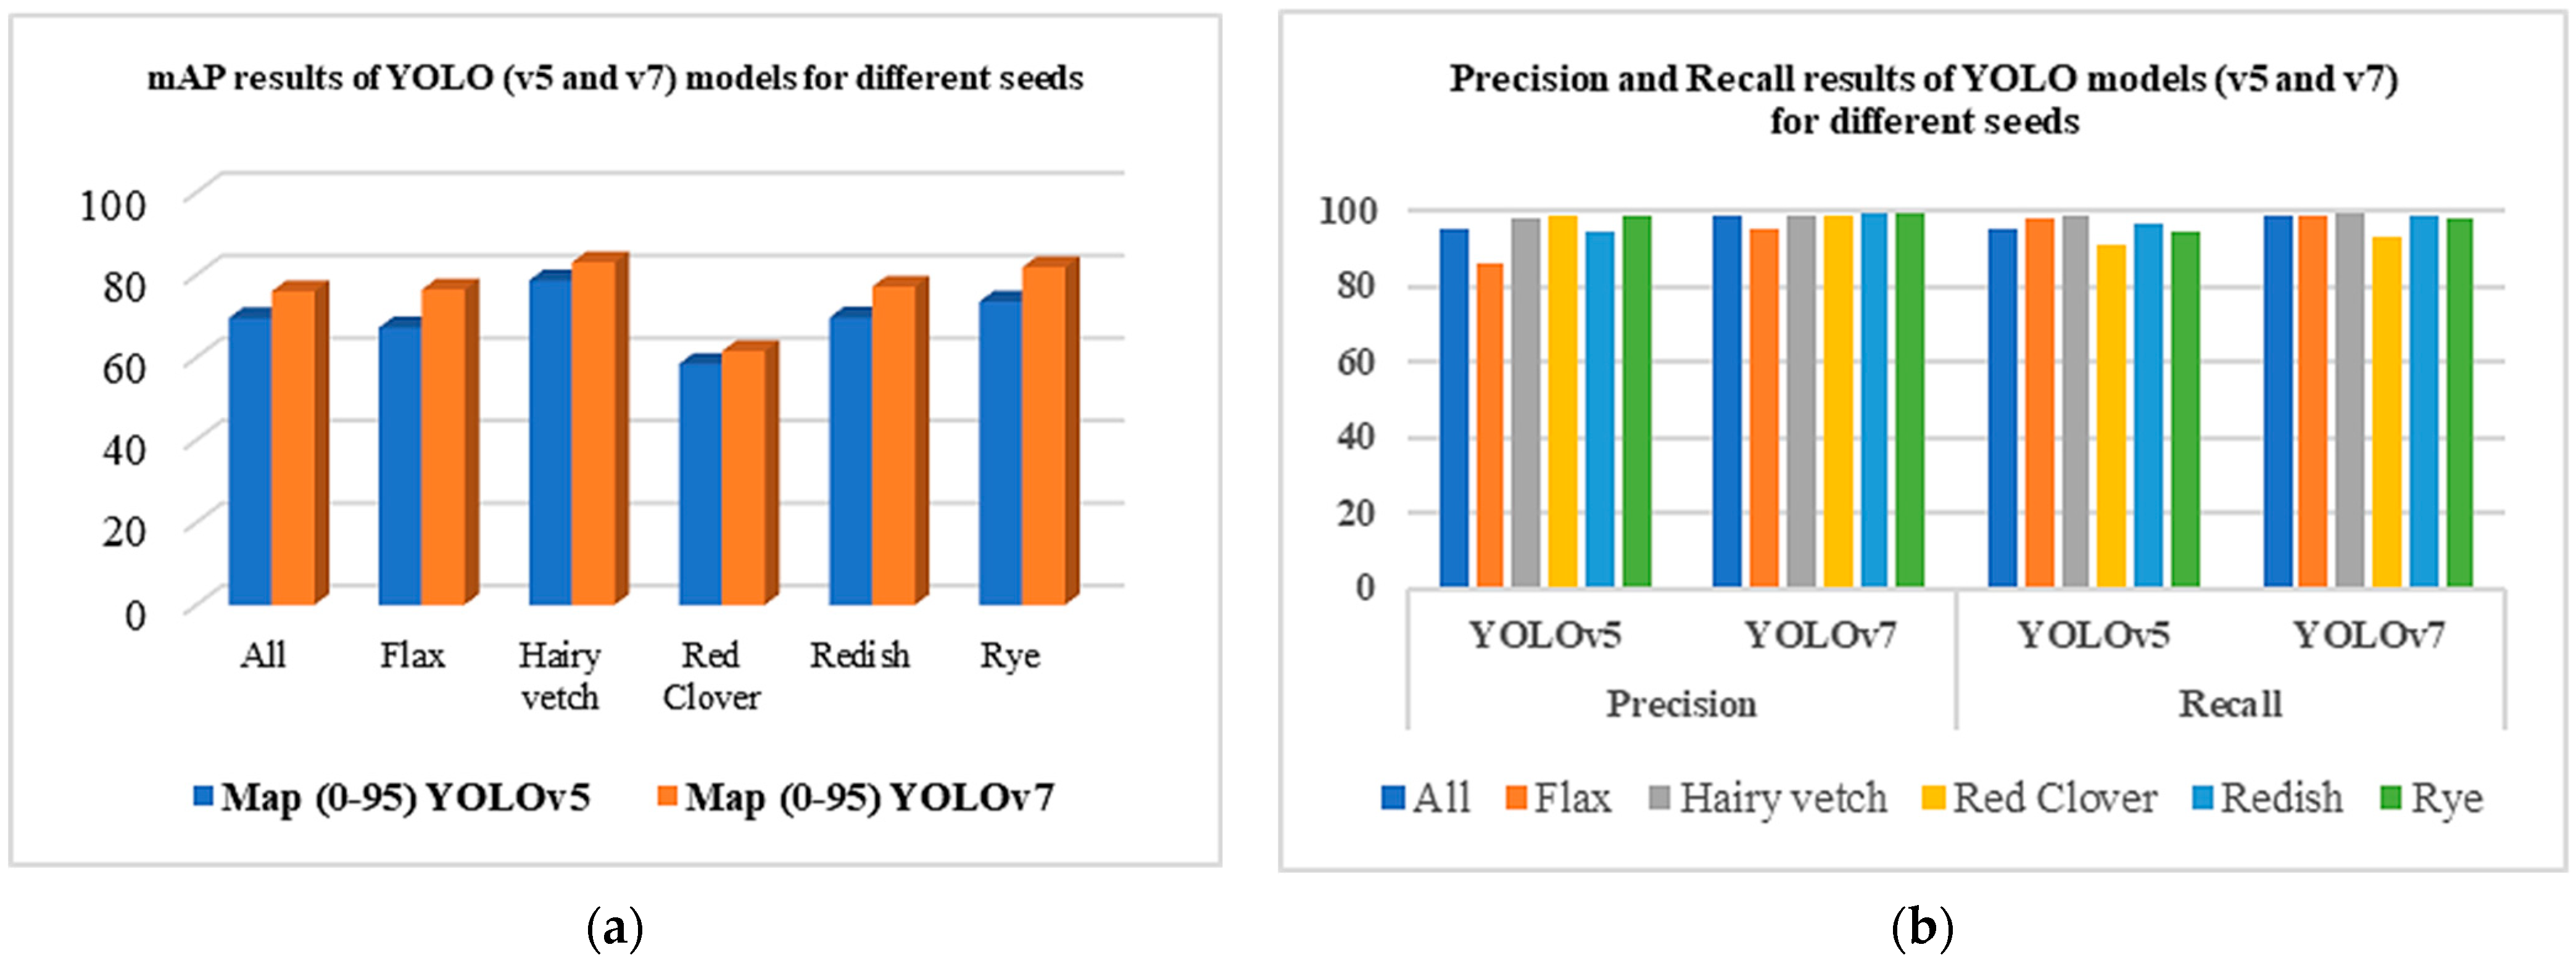
The comparison between YOLOv5 and YOLOv7 models, as summarized in Table 2, reveals that YOLOv7 significantly outperforms YOLOv5 across all key evaluation metrics: mAP (0–50), mAP (0–95), Precision, and Recall. For the overall “All” class, YOLOv7 reached an average mAP@0.5 of 99.5 ± 0.28 and mAP@0.5:0.95 of 76.0 ± 0.46, compared to 98.6 ± 0.45 and 69.5 ± 0.70 for YOLOv5, confirming improved detection accuracy under consistent training conditions. Precision and recall also improved from 95.4 ± 0.55 and 95.4 ± 0.62 (YOLOv5) to 98.5 ± 0.32 and 98.7 ± 0.35 (YOLOv7), indicating higher reliability and lower prediction variance [Table 4.]. Class-specific analysis shows substantial improvements in detection accuracy and reliability for individual classes such as Flax, Hairy Vetch, Red Clover, Radish, and Rye. For instance, YOLOv7 improved the mAP (0–50) for Flax from 98.4 to 99.6 and mAP (0–95) from 67.2 to 76.4, with Precision rising from 86.3 to 95.0 and recall from 98.3 to 99.0. Hairy Vetch saw a significant mAP (0–95) improvement from 78.6 to 83.0, and Radish exhibited dramatic enhancements across all metrics. Red Clover and Rye also showed notable gains in performance, particularly in Precision and Recall. Overall, the results demonstrate that YOLOv7 provides higher accuracy and reliability for object detection tasks, validating its effectiveness in real-world scenarios and highlighting the advantages of using this more advanced architecture.
Table 4.
Comparison of model YOLOv5 and YOLOv7 with performance matrices results (Mean ± SD over three runs).
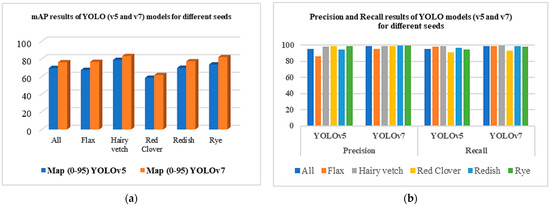
Figure 9a highlights the mean Average Precision (mAP) at the 0.95 IoU threshold for both models across different classes. YOLOv7 shows superior performance, with the mAP for all classes increasing from 69.5 for YOLOv5 to 76 for YOLOv7. Specific classes like Flax and Hairy Vetch see notable improvements, with mAP rising from 67.2 to 76.4 and from 78.6 to 83, respectively. In Figure 9b Precision and Recall metrics are presented. YOLOv7 consistently shows higher precision across all classes, with fewer false positive predictions. For the “All” category, precision for YOLOv7 is approximately 98.5 compared to YOLOv5’s 95.4. Significant improvements are observed in the Radish class, with precision increasing from 94.8 for YOLOv5 to 99.7 for YOLOv7. Recall for YOLOv7 also surpasses YOLOv5, indicating fewer missed true positive predictions, with recall for the “All” category at 98.7 compared to YOLOv5’s 95.4. Specific classes like Flax and Hairy Vetch also show improved recall.
Figure 9.
mAP (a) and Precision–Recall (b) Results of YOLOv5 and YOLOv7 Models for Different Classes.
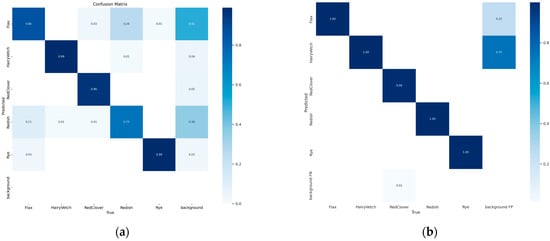
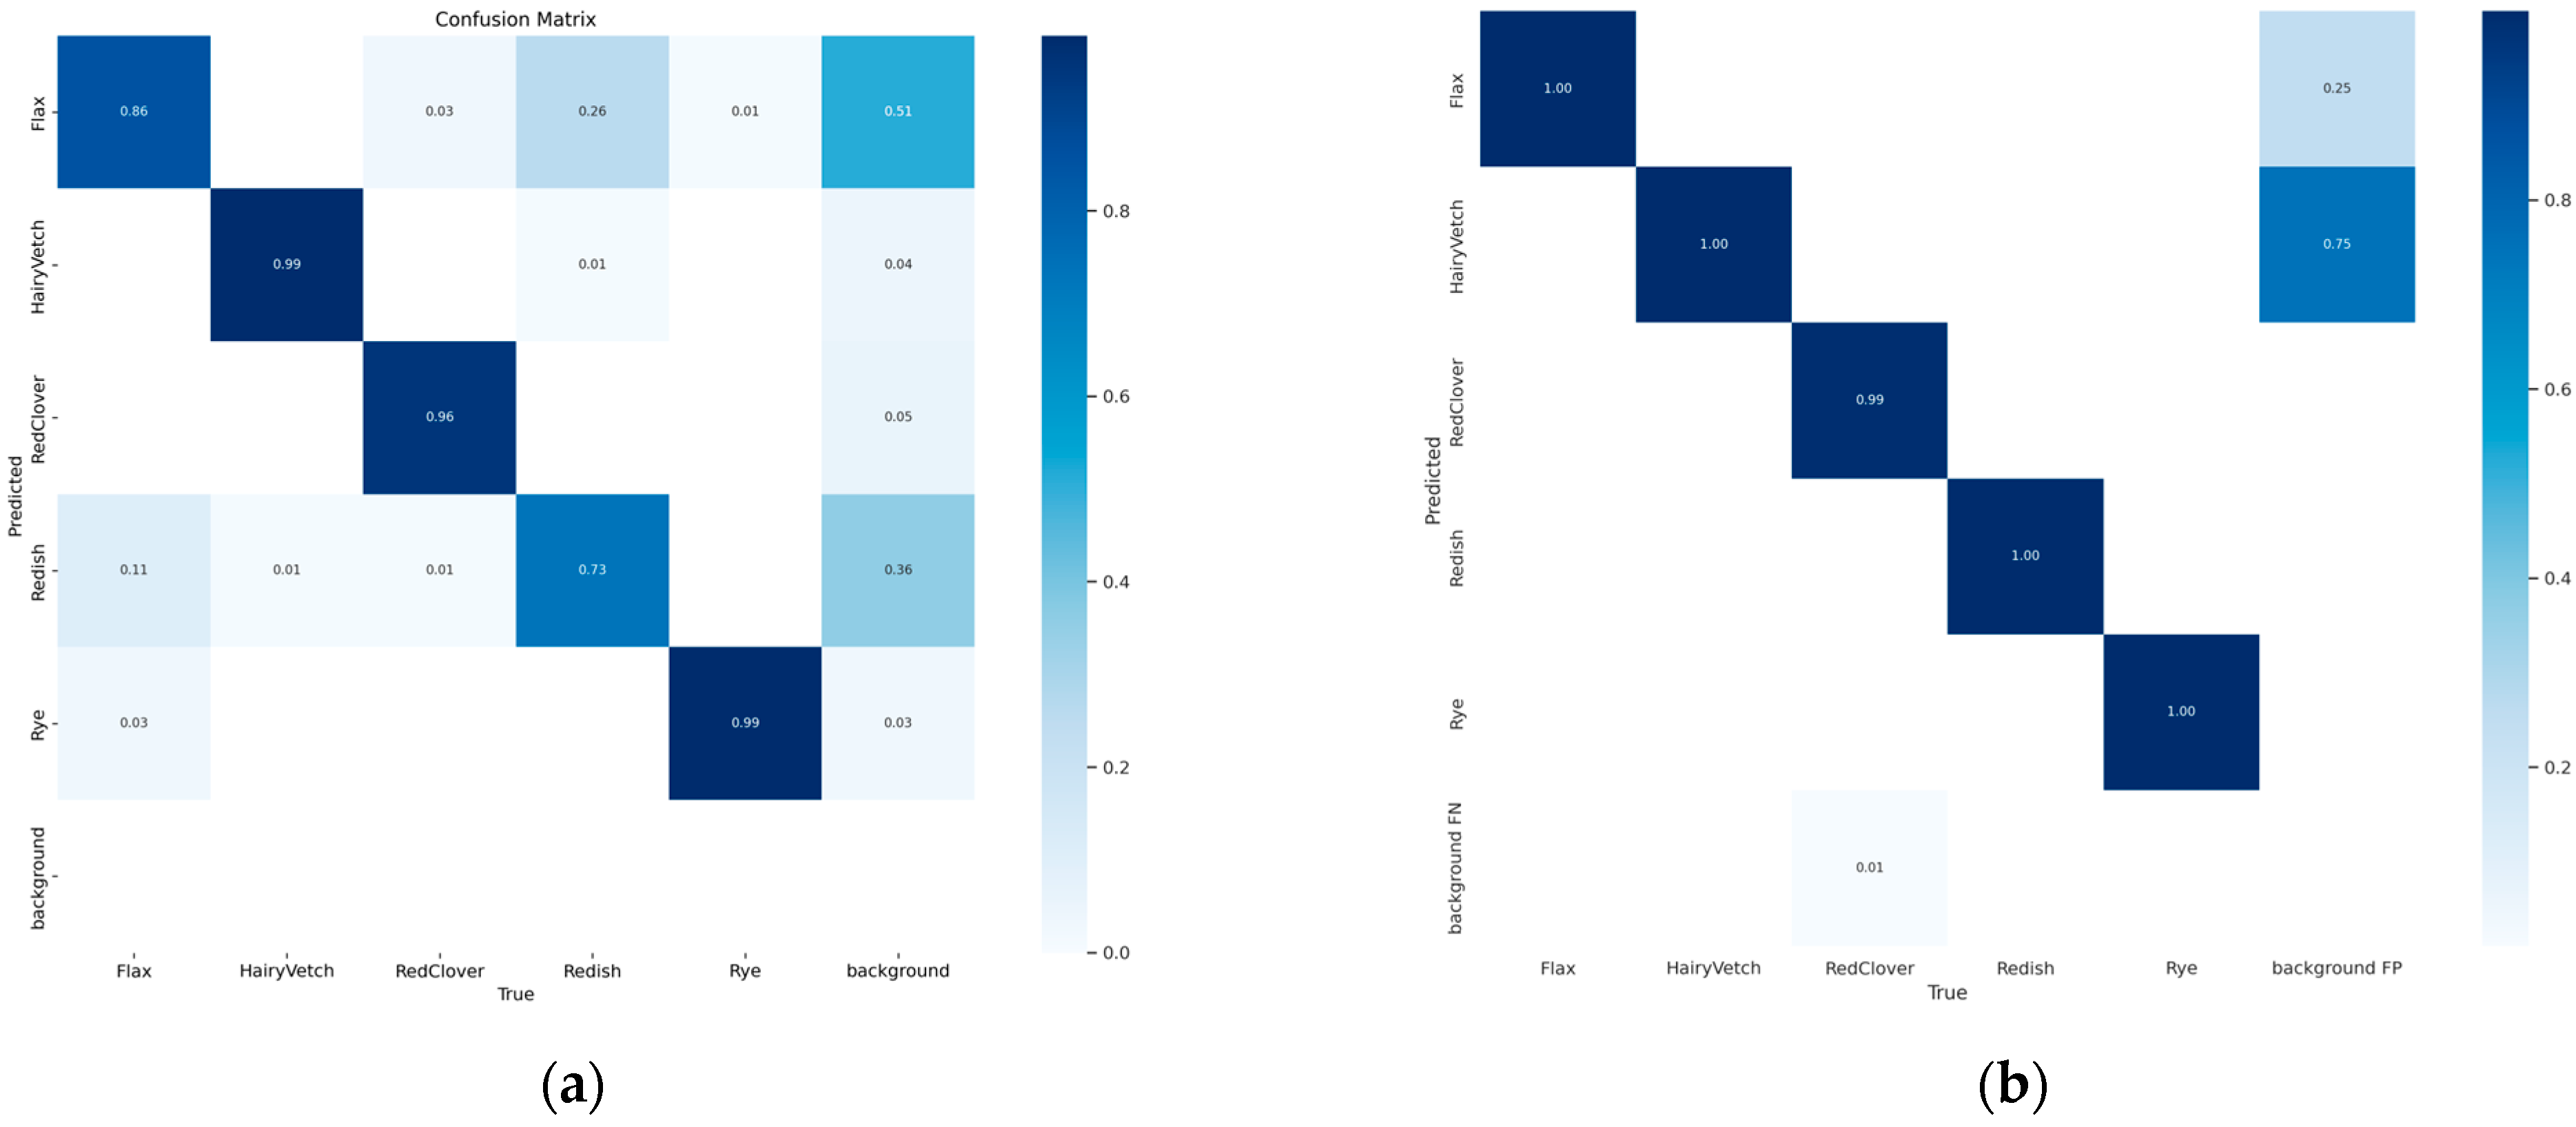
Confusion matrices were used to assess the way effectively the models identified different seed categories and counted them. These matrices contained very few off-diagonal entries, indicating that misclassification occurrences occurred uncommonly. This conclusion suggests that the models learned significant classification skills by successfully distinguishing between different types of seeds in the dataset. The confusion matrices for YOLOv5 and YOLOv7 are shown in Figure 10.
Figure 10.
Confusion Matrix of YOLOv5 (a) and YOLOv7 (b).
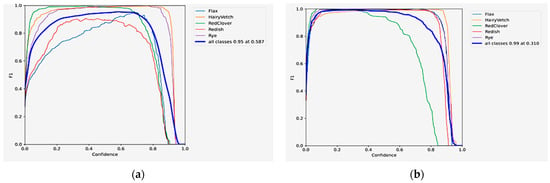
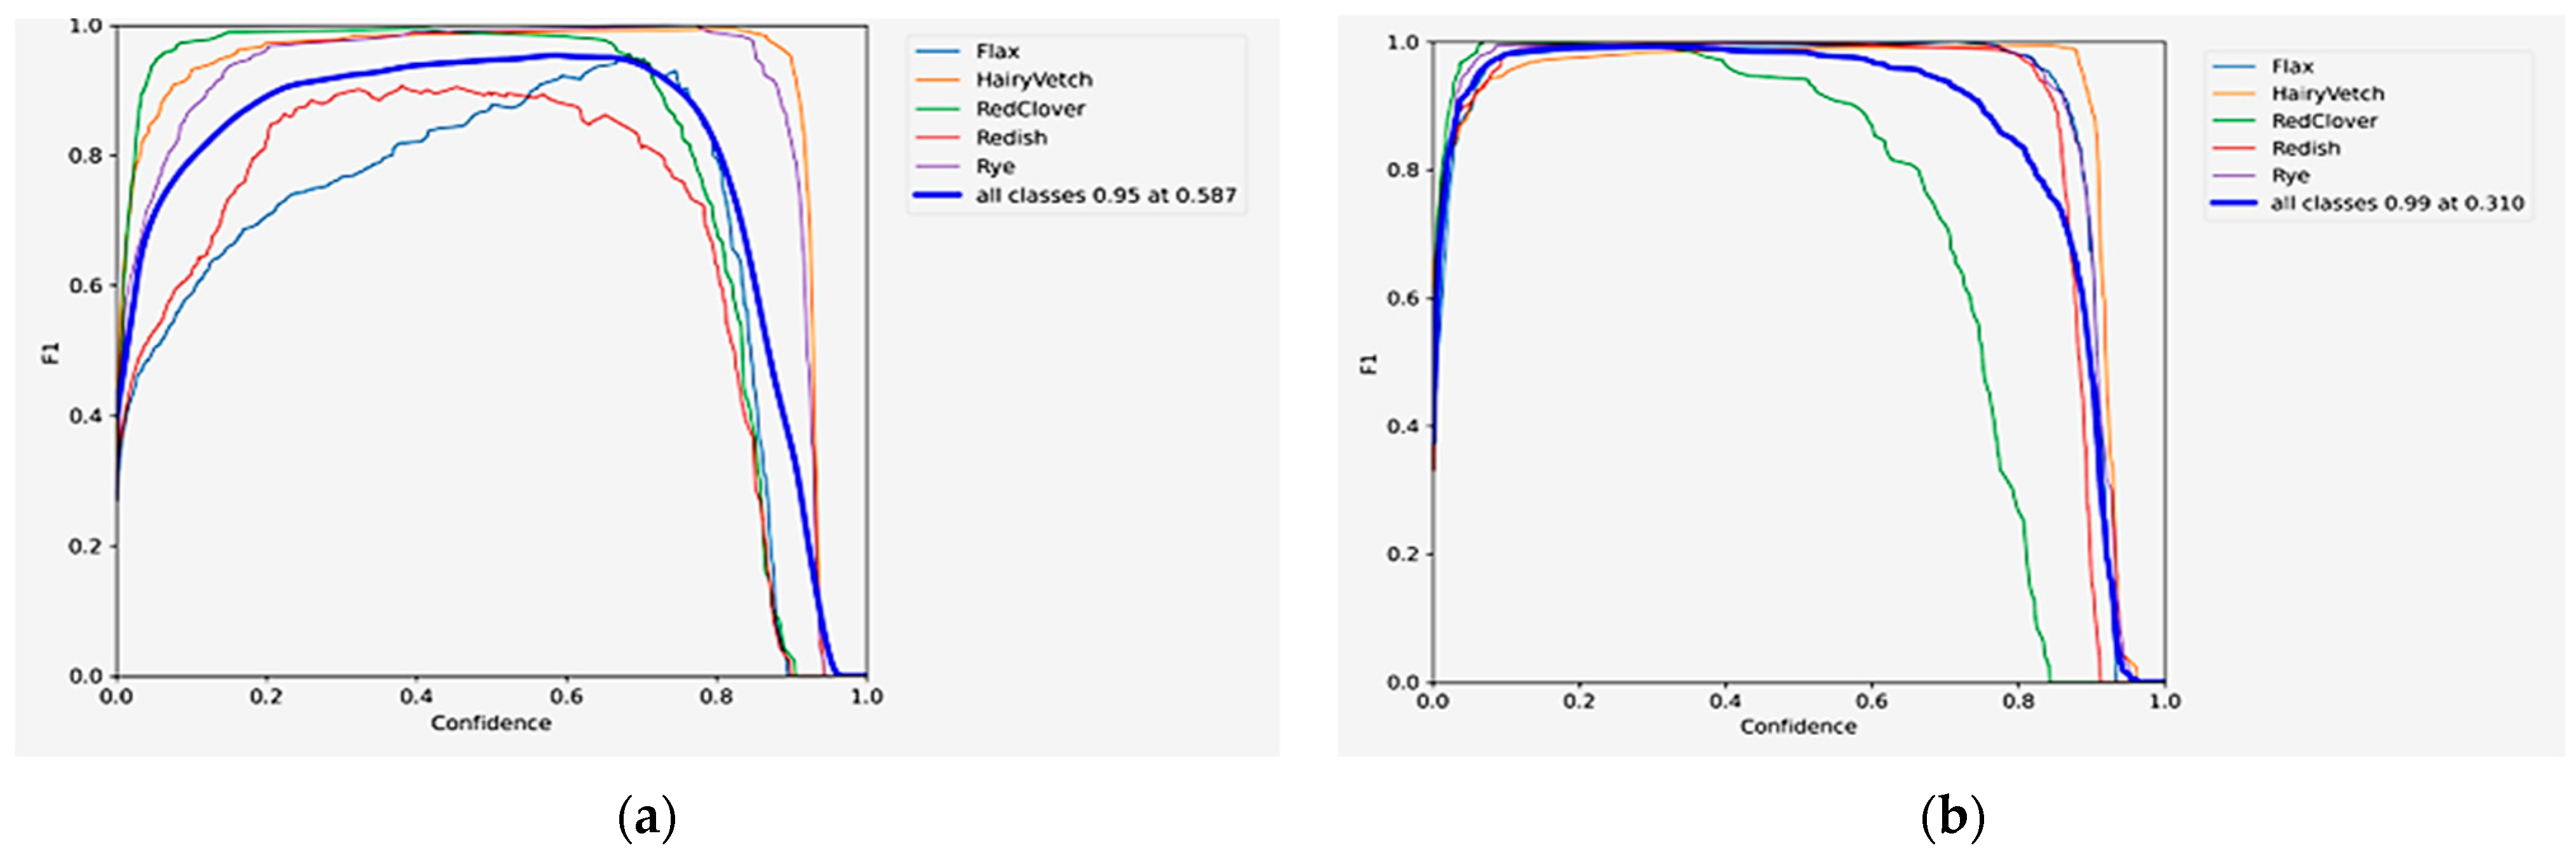
The F1 confidence curves for YOLOv5 (a) and YOLOv7 (b) are displayed in the graphs (Figure 11), showing the relationship between the F1 score and confidence levels for different classes. On the YOLOv5 graph, it is observed that the F1 scores peak around the 0.5 to 0.7 confidence range for most classes, with Flax and Rye showing higher F1 scores compared to other classes. The overall performance across all classes reaches an optimal F1 score of 0.587 at a 0.95 confidence level, indicated by the blue line. In comparison, the YOLOv7 graph demonstrates improved performance, with higher F1 scores achieved at a broader range of confidence levels, particularly between 0.6 and 0.8. It is noted that Red Clover and Rye exhibit consistently high F1 scores across this range. The overall optimal F1 score for all classes is 0.99 at a 0.310 confidence level, significantly higher than the performance observed with YOLOv5. This indicates that YOLOv7 not only achieves higher F1 scores but also maintains these scores over a wider range of confidence thresholds, suggesting better and more reliable detection performance across various classes.
Figure 11.
F1 confidence curve of YOLOv5 (a) and YOLOv7 (b).
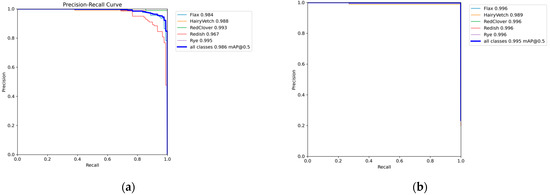
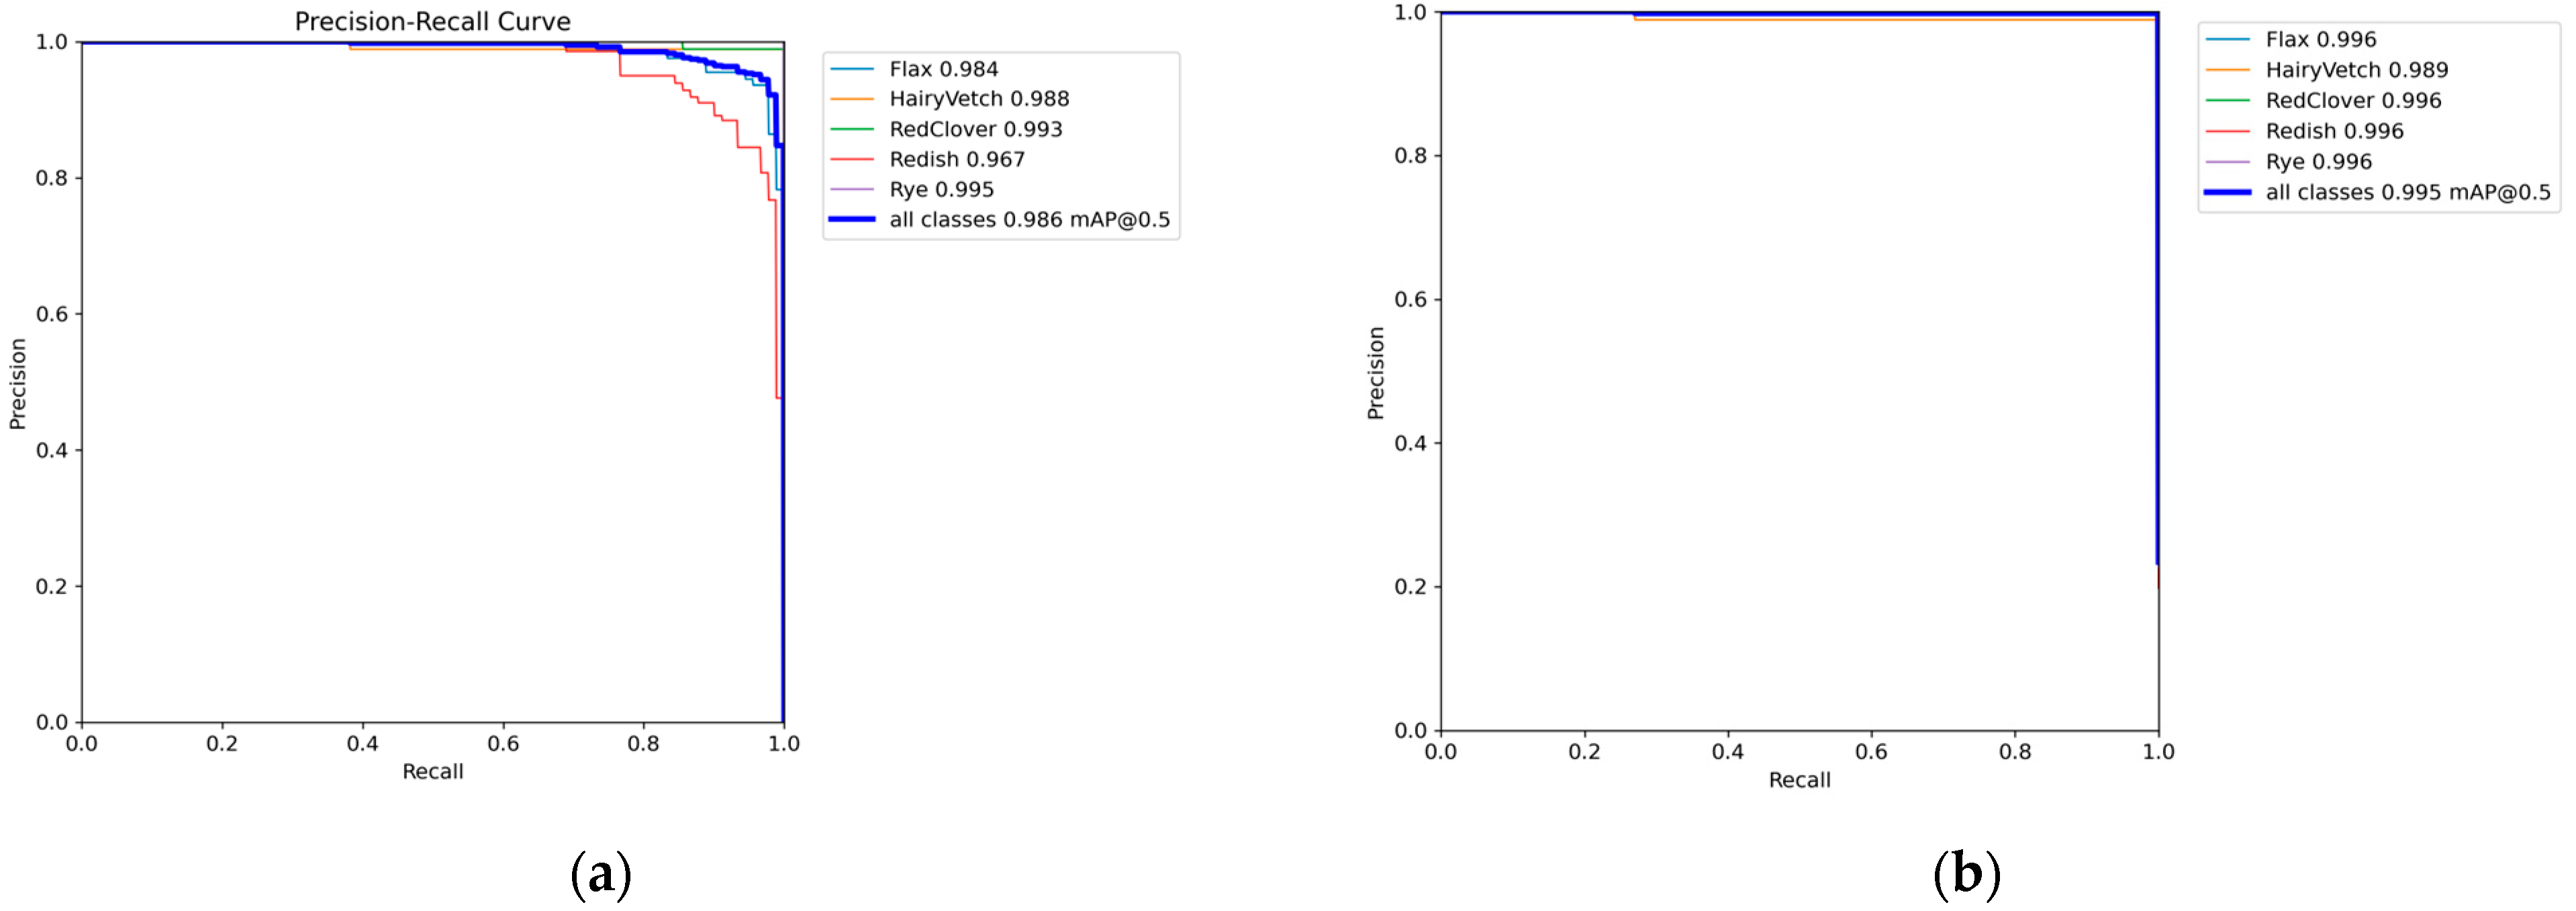
The precision–recall curves for YOLOv5 (a) and YOLOv7 (b) shows the models’ performance in balancing precision and recall across various classes (Figure 12). In the YOLOv5 graph, precision is high across a range of recall values but drops significantly as recall approaches 1. Flax and Hairy Vetch maintain high precision values of 0.984 and 0.988, respectively. Red Clover and Rye also show strong performance with precision values of 0.993 and 0.995, while Radish has a slightly lower precision of 0.967. The overall precision for all classes is approximately 0.986 at an mAP threshold of 0.5, as indicated by the blue line. The YOLOv7 graph displays a more robust performance, with precision remaining near 1 across almost the entire range of recall values. All classes, including Flax, Hairy Vetch, Red Clover, Radish, and Rye, exhibit precision values of approximately 0.996. The overall precision for all classes reaches 0.995 mAP at a 0.5 threshold. YOLOv7 shows significant improvements over YOLOv5, delivering superior detection performance with minimal trade-offs between precision and recall, making it a more effective model for object detection tasks.
Figure 12.
Precision–Recall curve of YOLOv5 (a) and YOLOv7 (b).
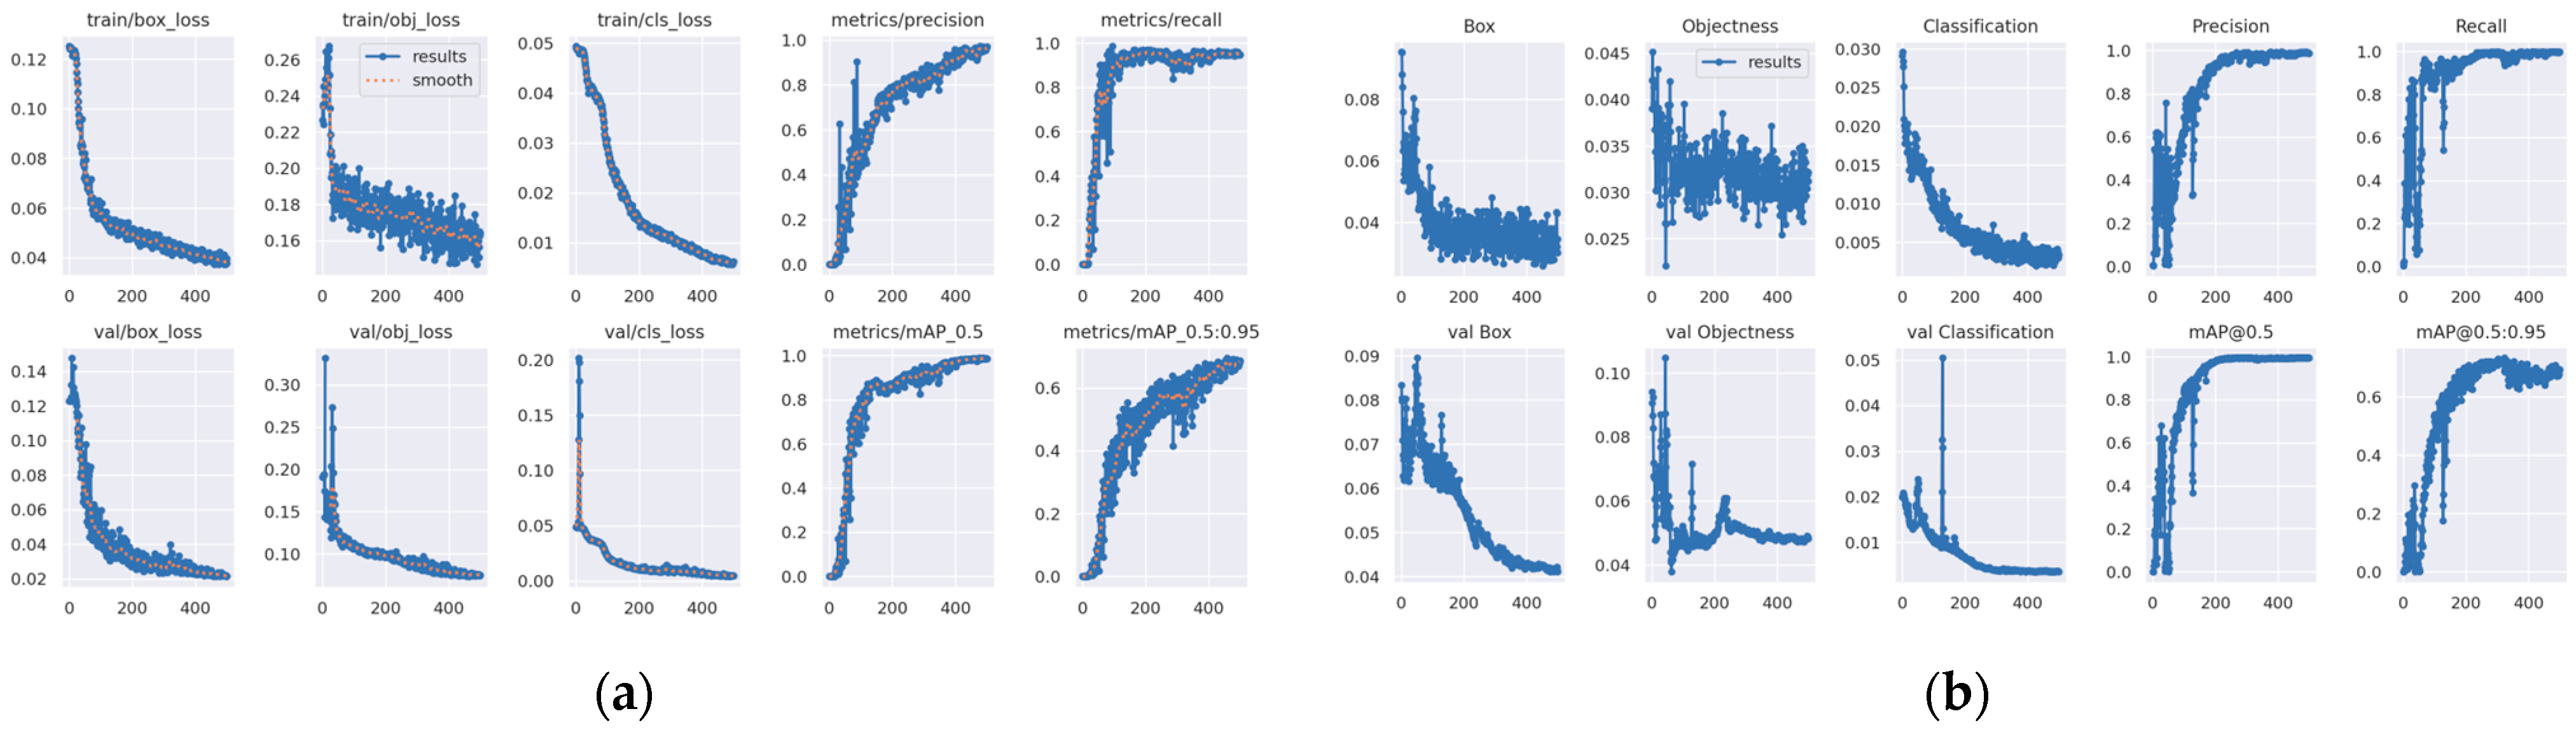
Figure 13 compares the training and validation performance metrics of YOLOv5 (left) and YOLOv7 (right) models. Both models demonstrate a steady decrease in box loss, objectness loss, and classification loss, indicating improved predictions and classification accuracy. Precision and recall metrics rise consistently, with precision stabilizing around 0.9 and recall approaching 1.0, highlighting high accuracy and correct detection rates. Mean Average Precision (mAP) metrics, both mAP@0.5 and mAP@0.5:0.95, show significant improvement, with YOLOv7 exhibiting slightly better values compared to YOLOv5. These results confirm the effective learning and robust performance of both models, with YOLOv7 showing marginally enhanced detection capabilities.
Figure 13.
Losses and performance results for the training and validation datasets for YOLOv5 (a) and YOLOv7 (b) models.
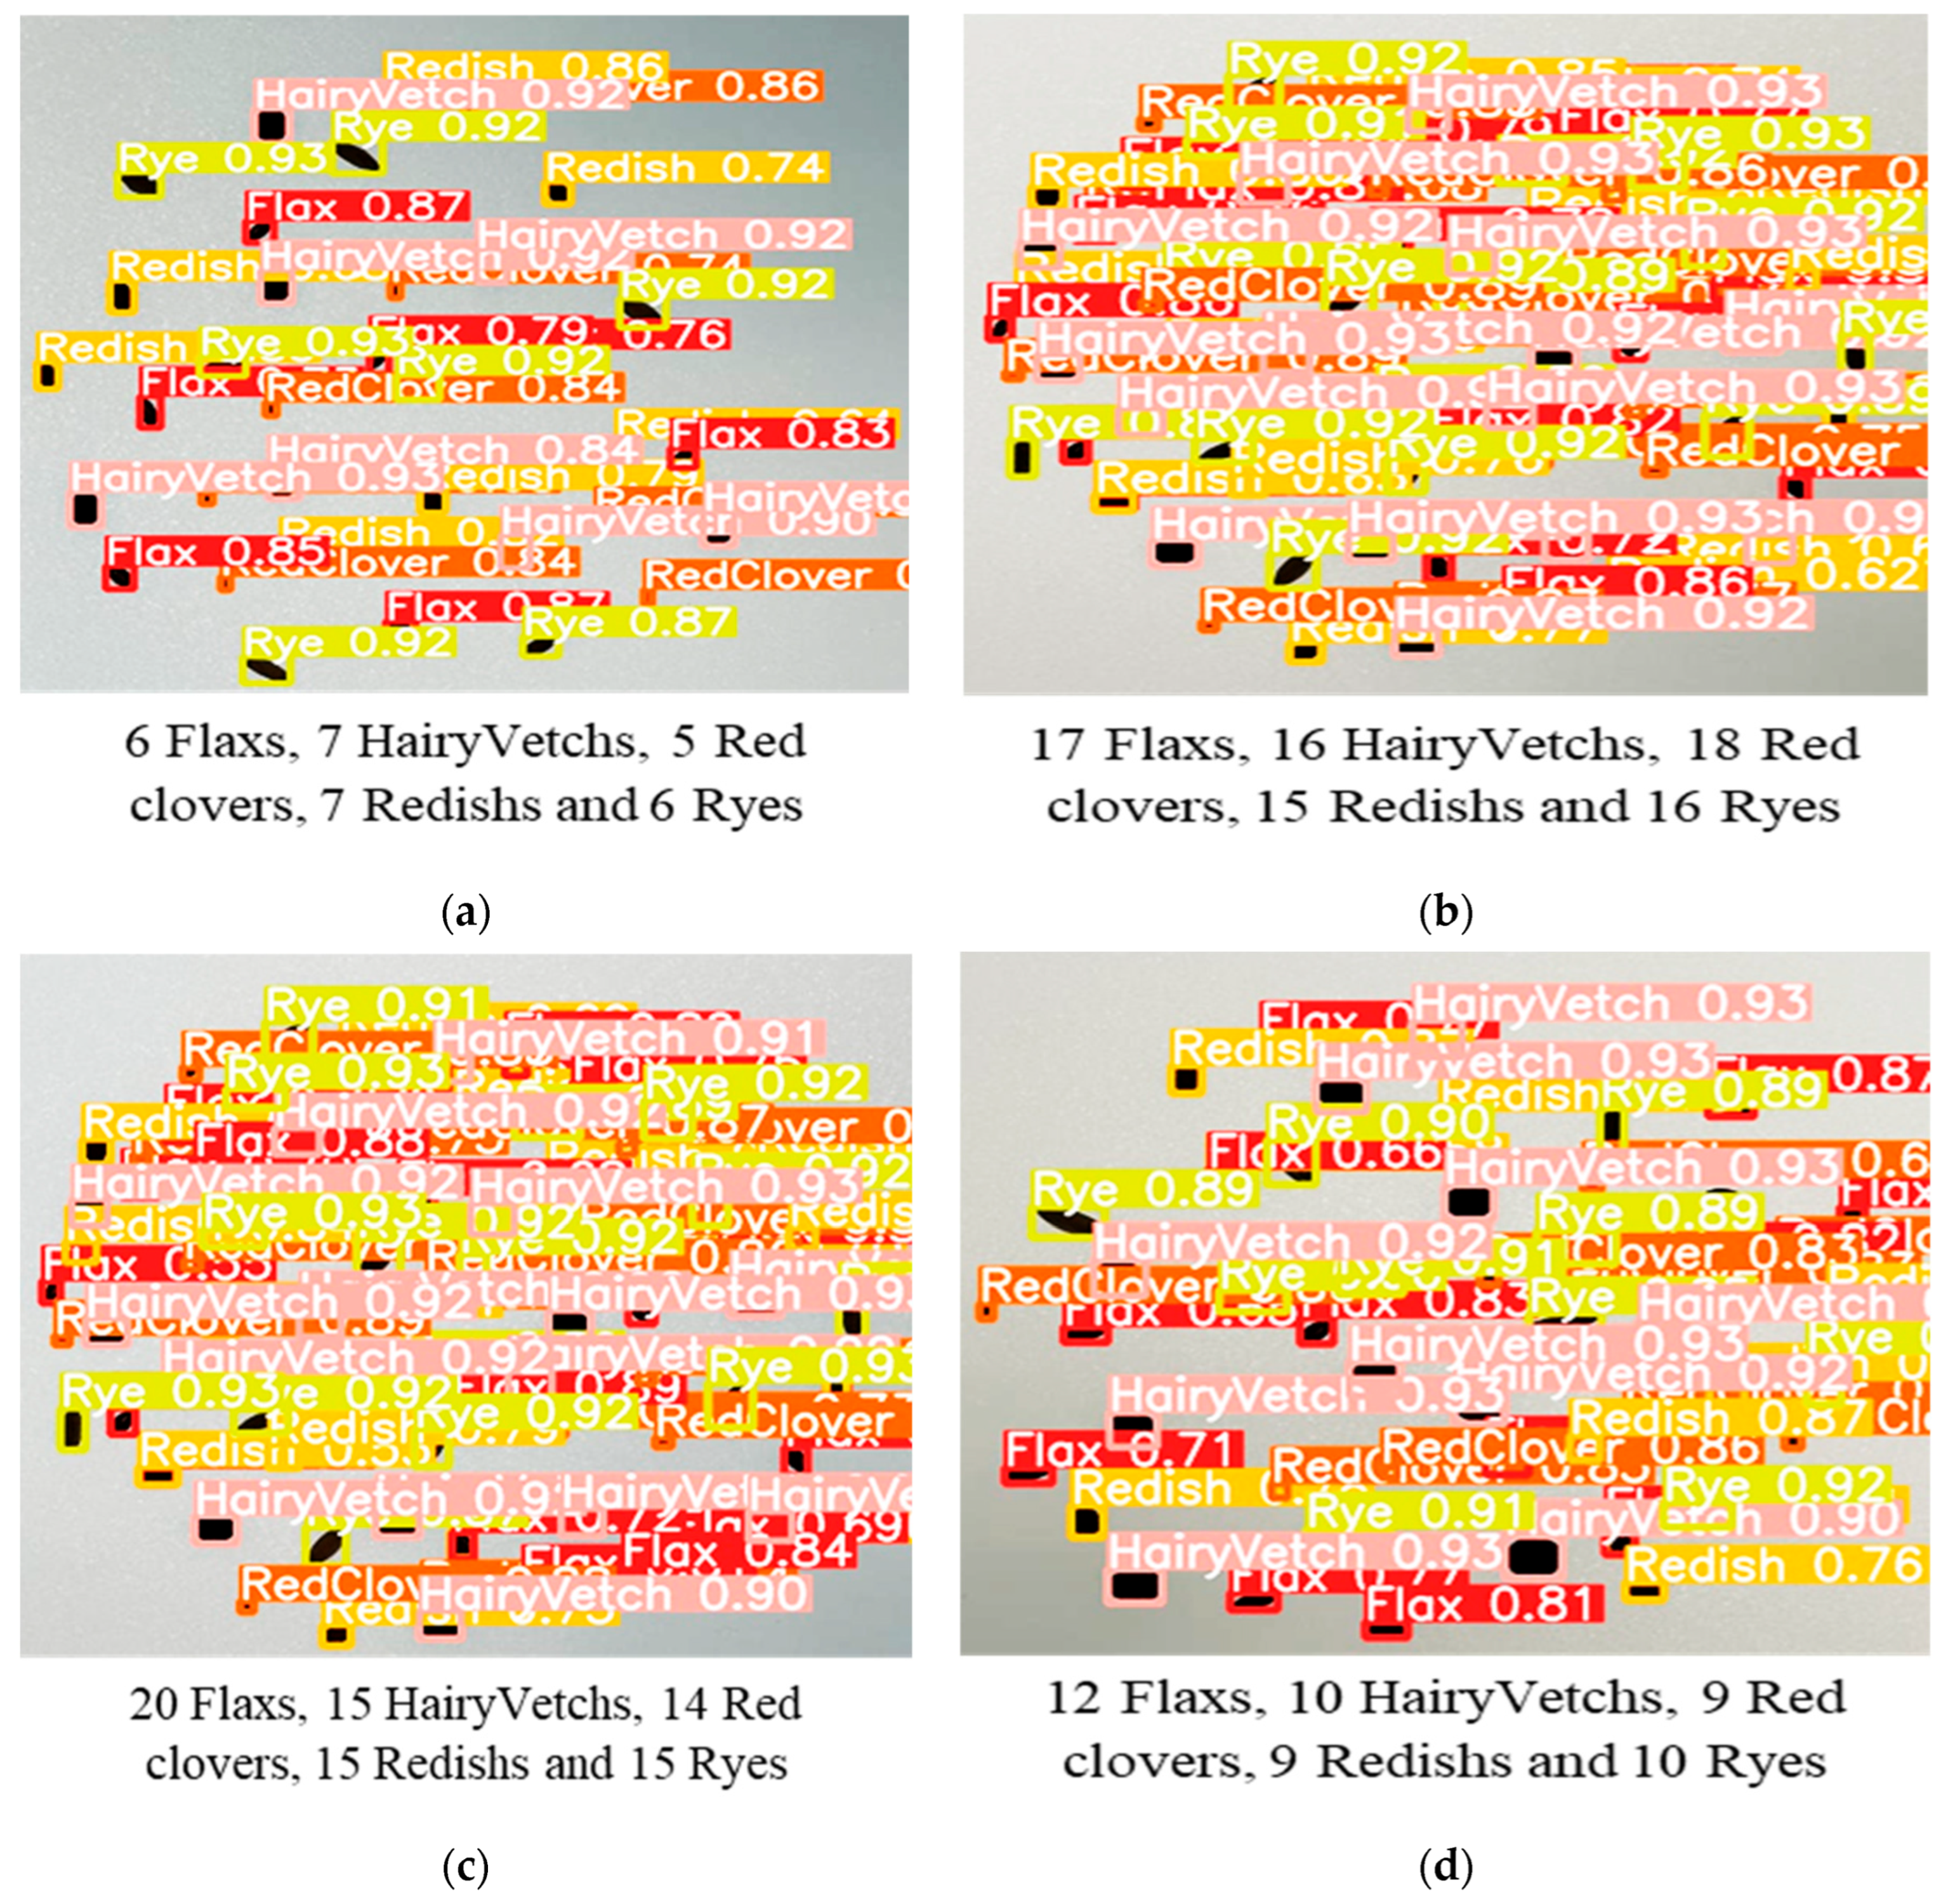
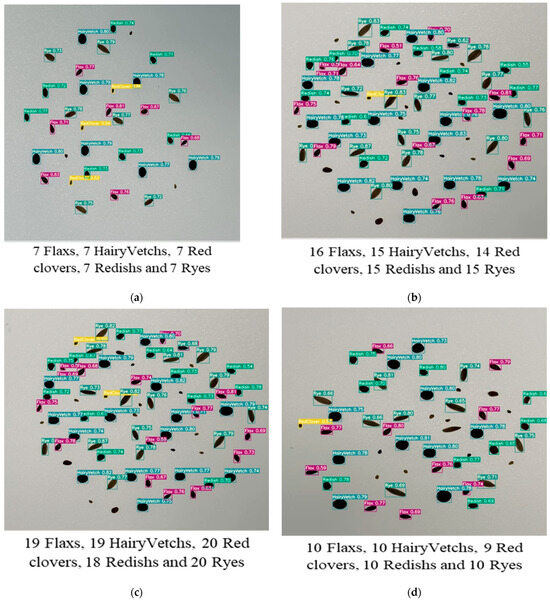
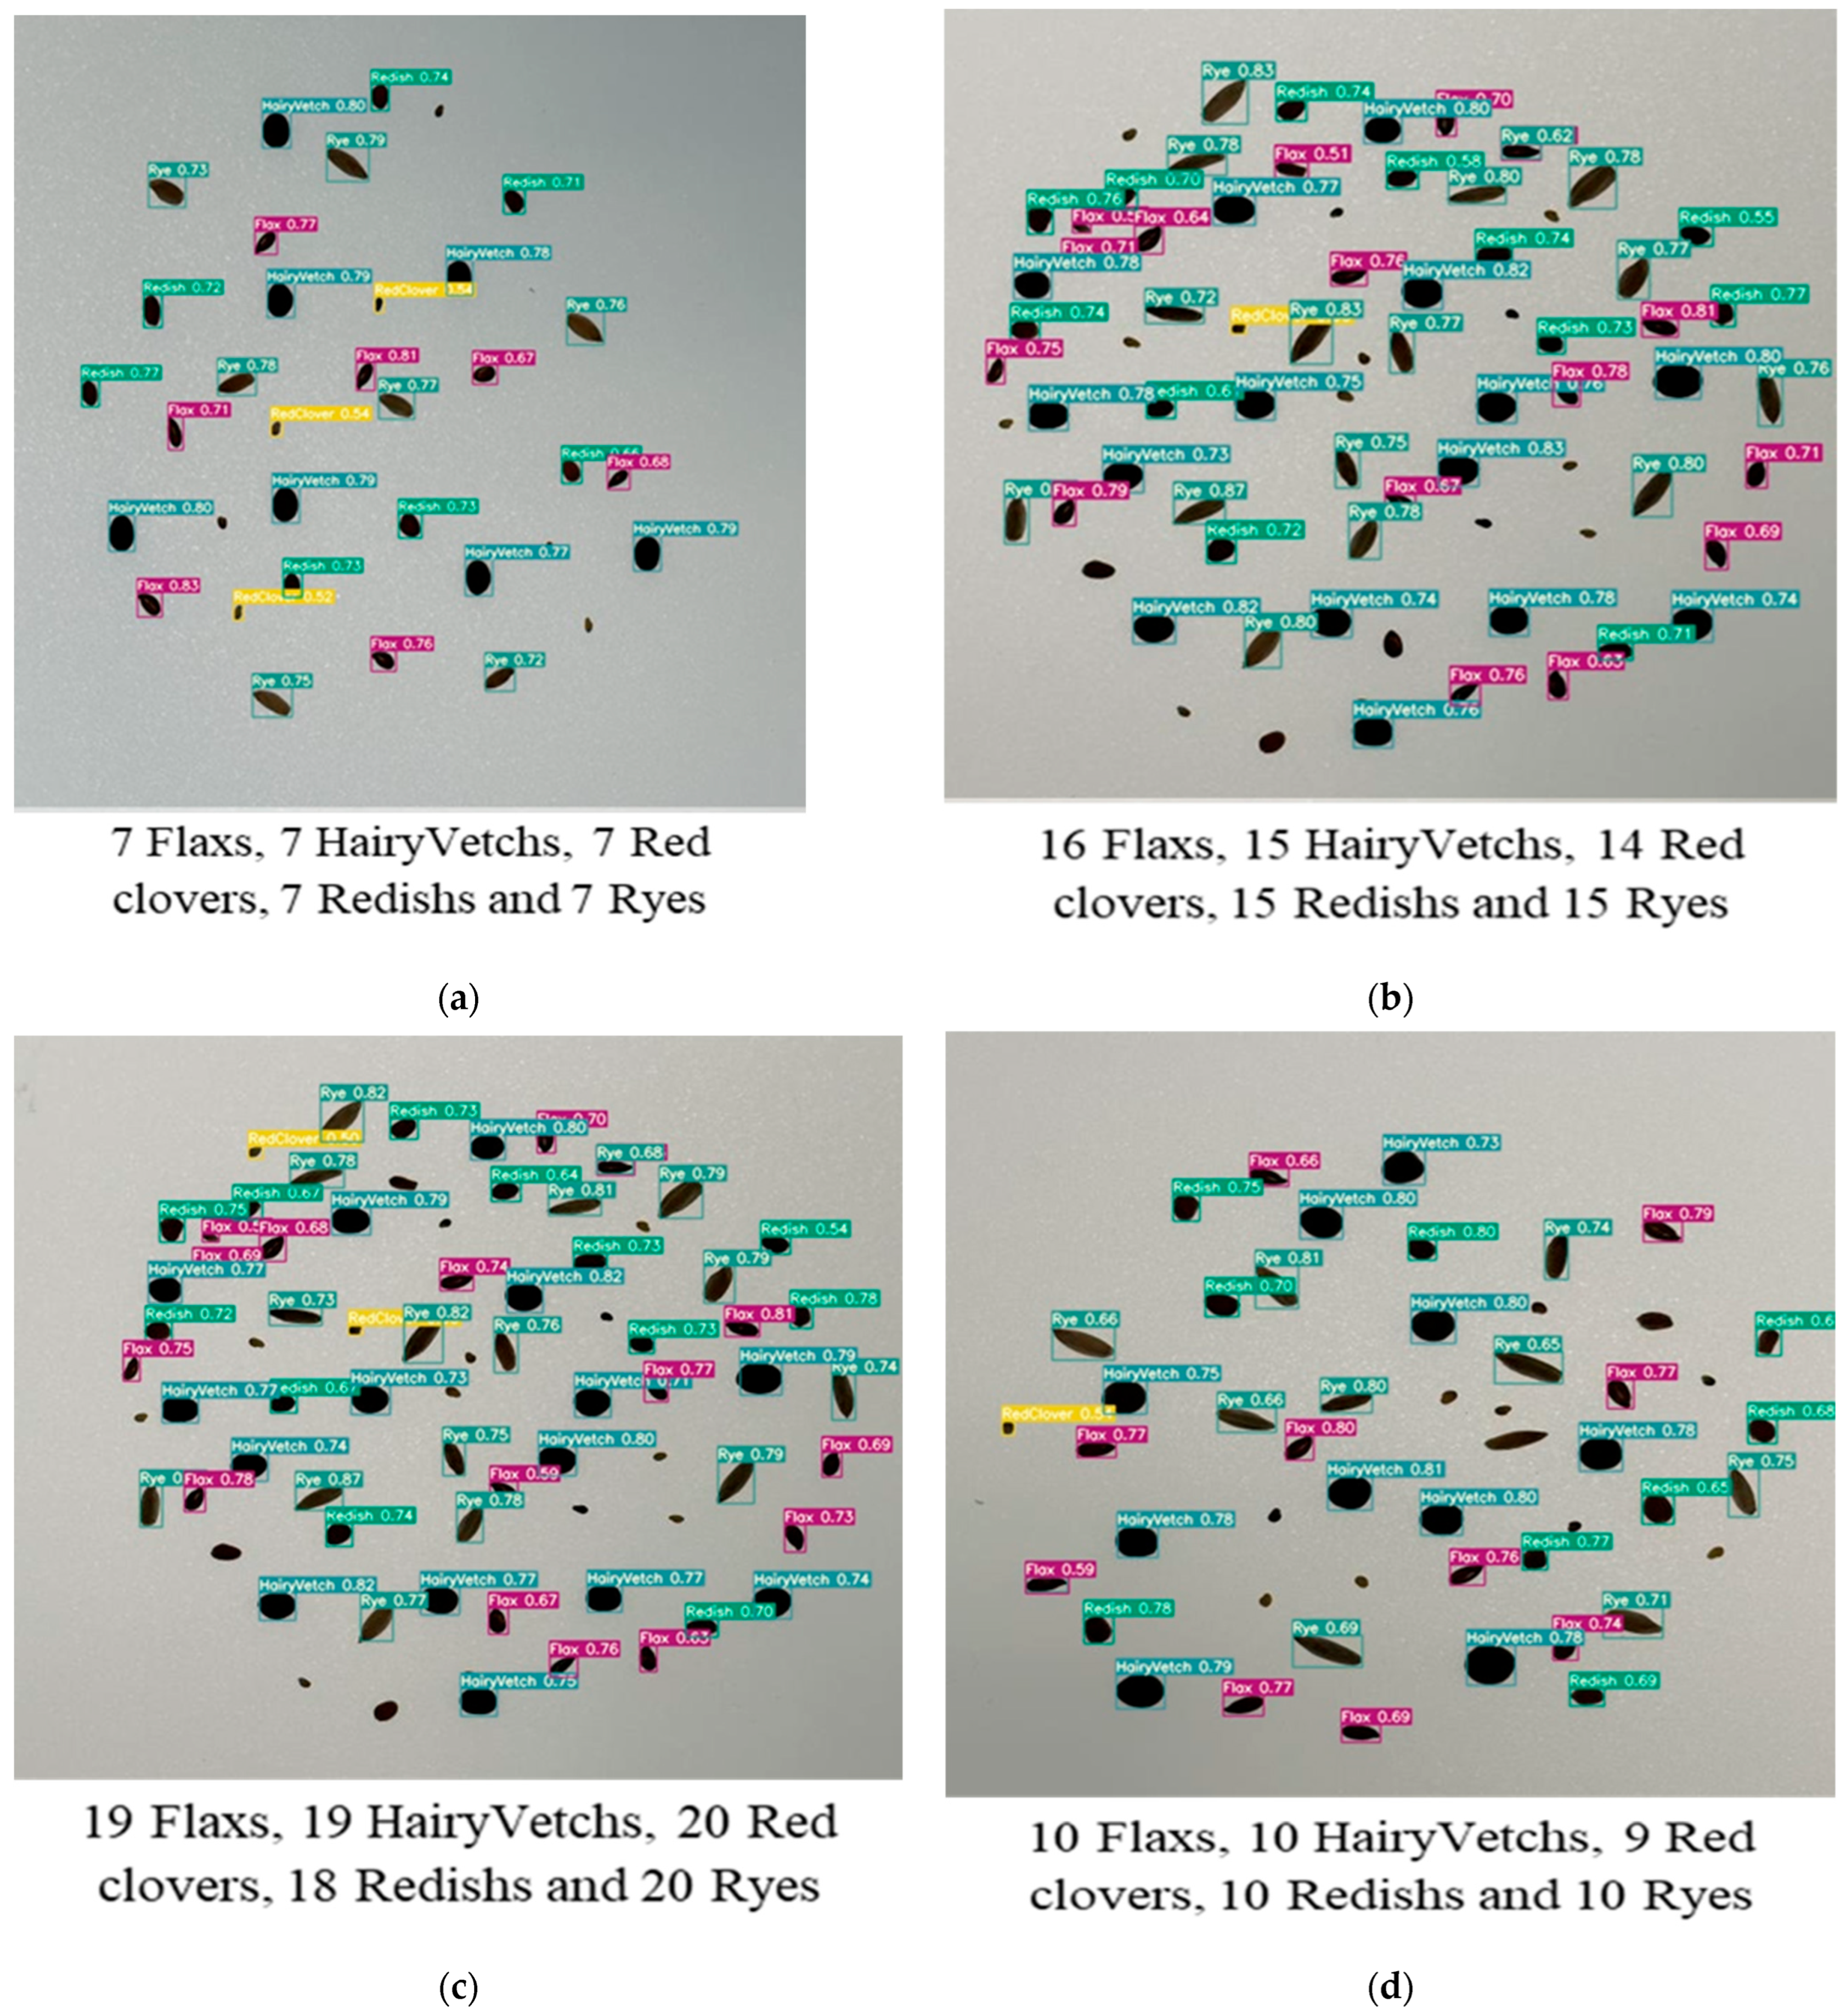
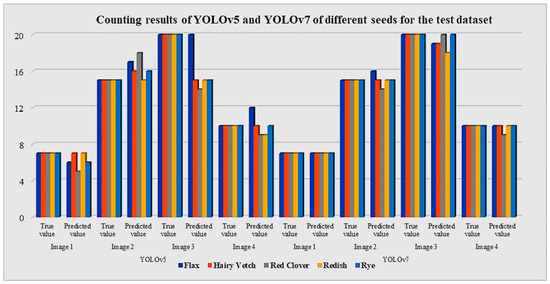
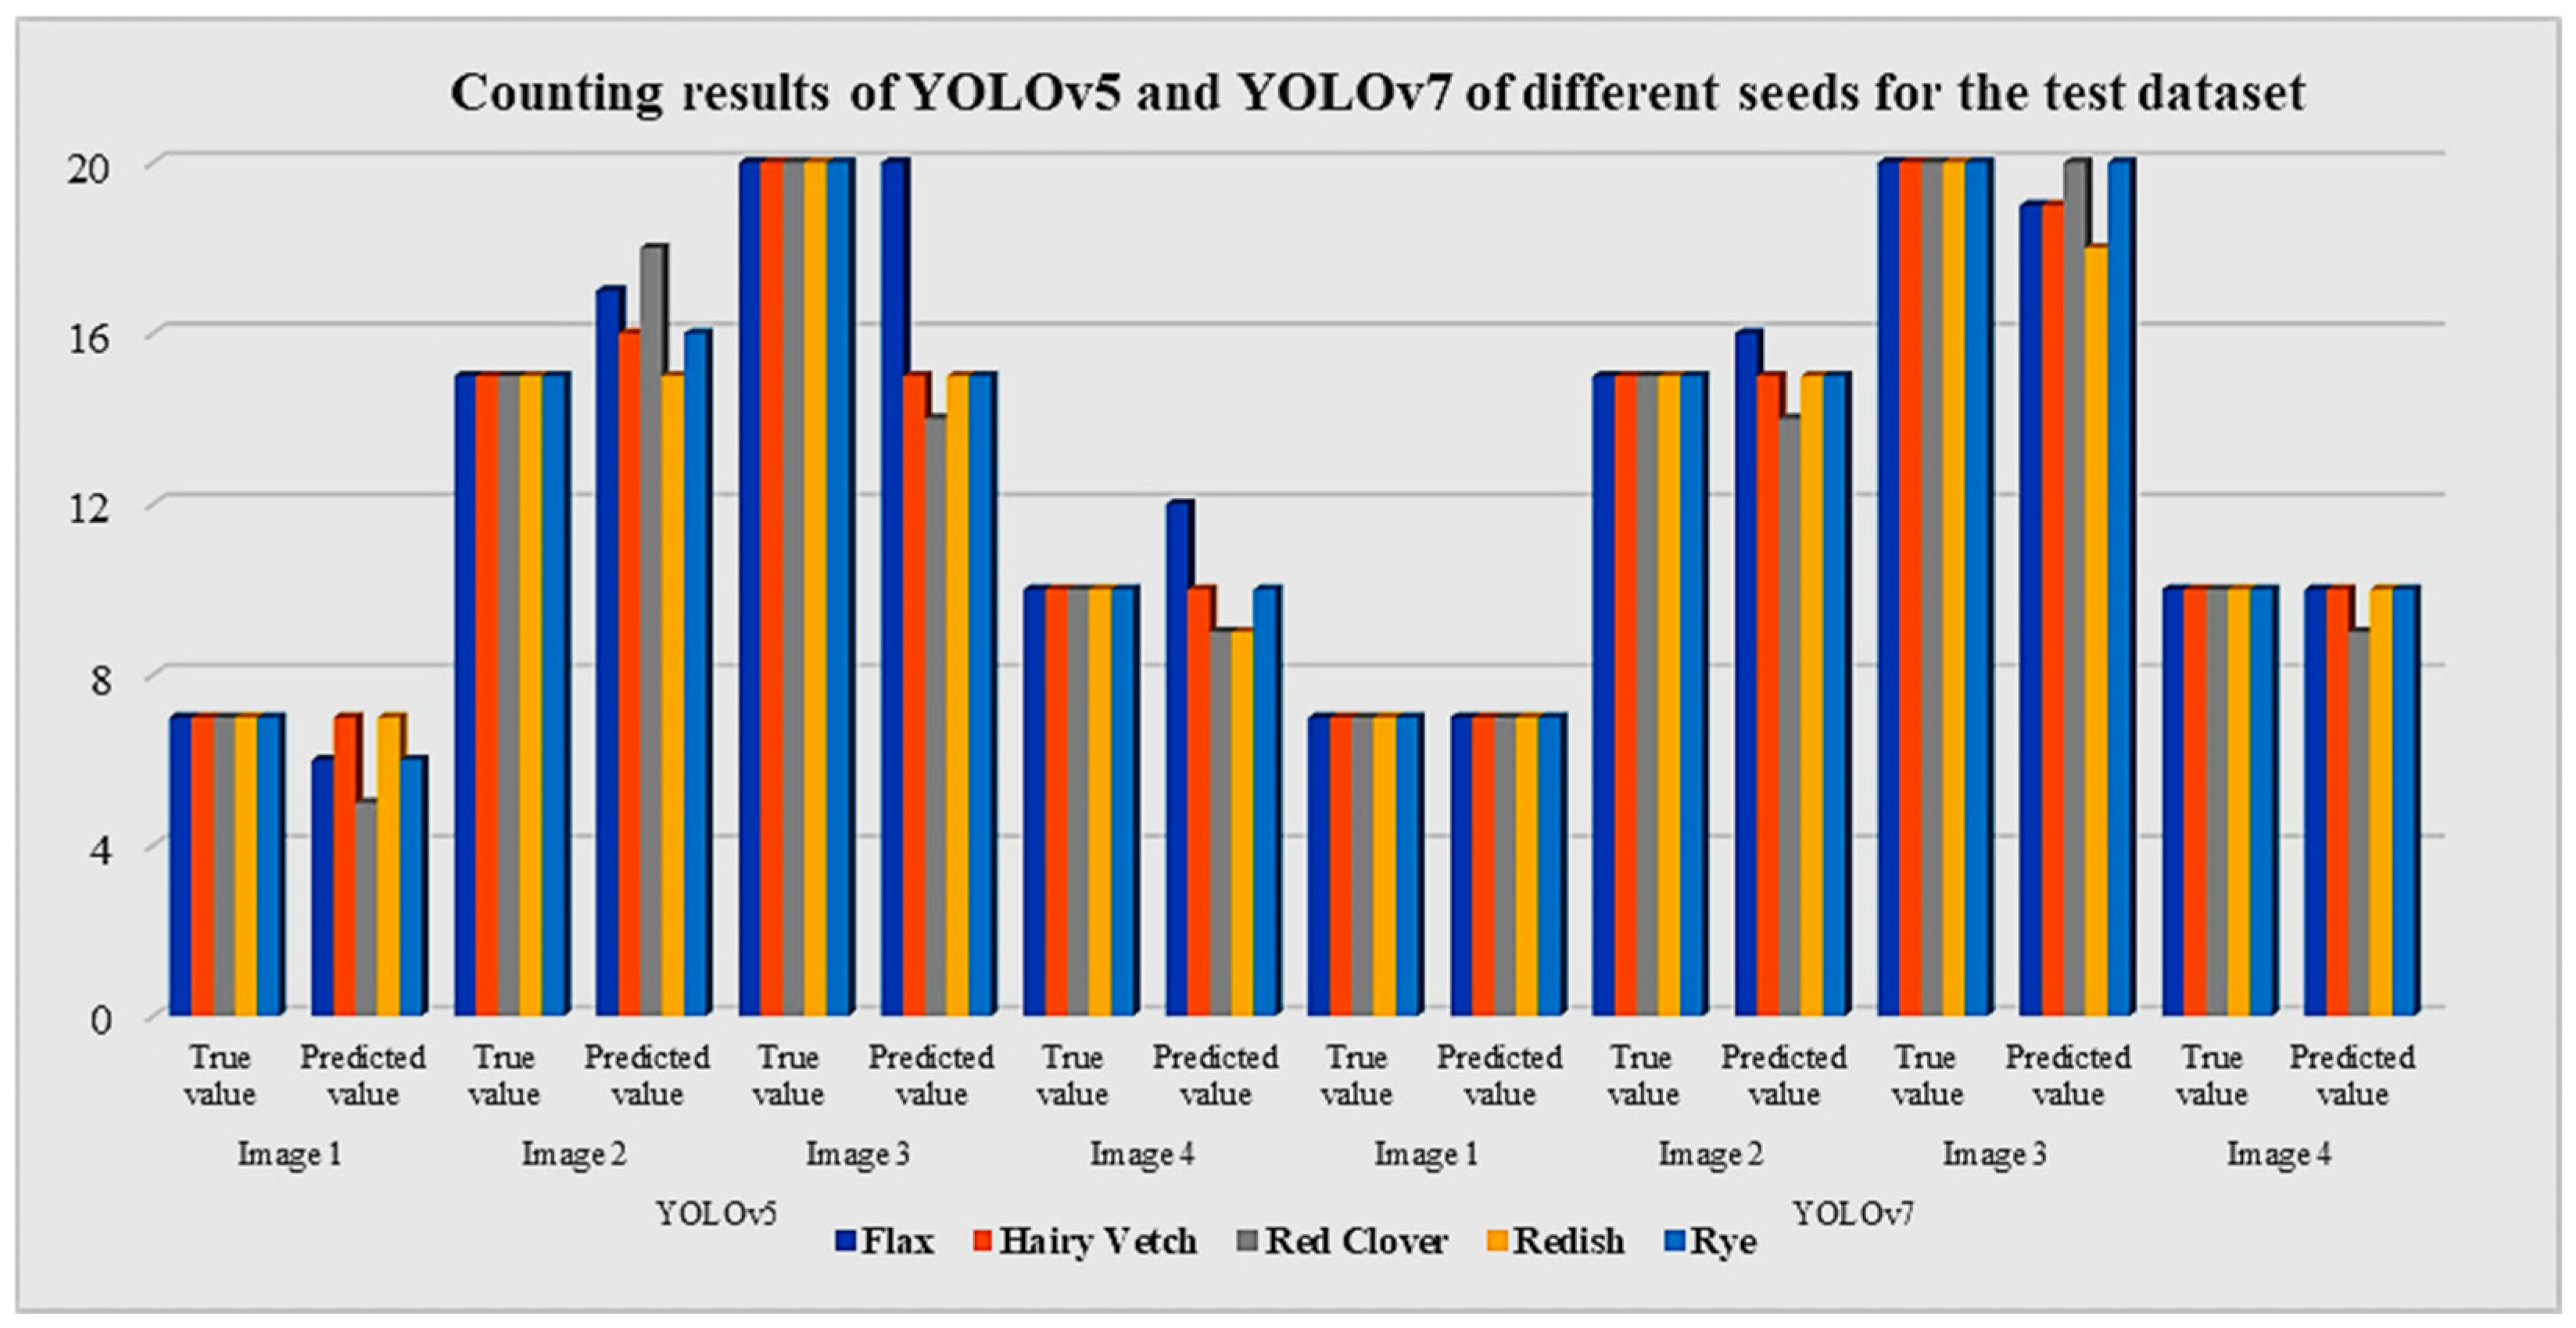
Figure 14, Figure 15 and Figure 16 show and compare the types of mixed seeds prediction, classification, and counting performance of YOLOv5 and YOLOv7 across various seed types in the test dataset. YOLOv7 consistently showed either equal or slightly higher counts compared to YOLOv5 for different seed types like Flax, Hairy Vetch, Red Clover, Radish, and Rye. The comparison revealed that YOLOv7 consistently counted more seeds than YOLOv5 across different types. On average, YOLOv7 showed a 3–5% increase in seed counts compared to YOLOv5. For instance, in Flax seeds, YOLOv7’s count improved by 10–15%, Hairy Vetch by 5–10%, and Red Clover, Radish, and Rye by 5–12%. This indicates that YOLOv7 generally performed better in accurately counting seeds across different images and seed types, showcasing its improved counting capabilities over YOLOv5.
Figure 14.
YOLOv5 predictions showing variable mixed seed densities across four samples (a–d), with increasing complexity in seed counts.
Figure 15.
YOLOv7 prediction results across four mixed seed samples (a–d), reflecting increasing variation in seed counts.
Figure 16.
Comparison of counting accuracy with true value of selected mixed seeds samples for YOLOv5 and YOLOv7 models.
4. Conclusions
The study’s main conclusions show that YOLOv7 significantly outperformed YOLOv5 in terms of accurate seed counting and mixed seed detection. YOLOv7 consistently counted three to five percent more seeds of several kinds, including rye, hairy vetch, flax, red clover, and radish. Notable improvements in accuracy measurements, such as mean Average Precision (mAP), Precision, and Recall, were observed in correlation with this increase in seed numbers. Specifically, YOLOv7 demonstrated improvements in Precision to 98.5% and recall to 98.7%, as well as increases in mAP (0–50) from 98.6% to 99.5% and mAP (0–95) from 69.5% to 76.0%. Strong classification abilities were indicated by the minimal misclassifications seen in the confusion matrices. YOLOv7 had outstanding performance, as evidenced by the F1 confidence curves. The F1 confidence curves also demonstrated YOLOv7’s superior performance, achieving an overall optimal F1 score of 0.99 at a 0.310 confidence level compared to YOLOv5’s peak of 0.587 at a 0.95 confidence level. Overall, these results demonstrate that YOLOv7 is a dependable and effective architecture for automated seed quantification and high-precision agricultural item detection. This development can be used to speed up phenotyping workflows in precision agriculture, decrease manual labor, and improve seed quality evaluation.
The controlled imaging environment, which might be further enhanced by adding multi-sensor data and varying illumination conditions to improve model generalizability, is one of the study’s limitations.
To increase the model’s resilience in a variety of real-world situations and broaden its applicability to different crops and phenotyping tasks, future studies should investigate including more deep learning architectures and sensor fusion approaches.
Author Contributions
Conceptualization, A.M.N. and K.K.; methodology, A.M.N. and K.K.; software, K.K.; validation, K.W., A.M.N. and K.K.; formal analysis, A.M.N.; investigation, A.M.N.; resources, A.M.N.; data curation, K.W.; writing—original draft preparation, K.K.; writing—review and editing, A.M.N.; visualization, A.M.N. and K.K.; supervision, A.M.N.; project administration, A.M.N.; funding acquisition, A.M.N. All authors have read and agreed to the published version of the manuscript.
Funding
This research received no external funding.
Institutional Review Board Statement
Not applicable. This study did not involve human participants, identifiable personal data, human tissue, or animals; therefore, ethical review and approval were not required under institutional or national guidelines.
Informed Consent Statement
Not applicable.
Data Availability Statement
The datasets generated and analyzed during the current study are available from the corresponding author on reasonable request.
Acknowledgments
The authors hereby acknowledge and express their gratitude to USDA_NRCS, USDA-USWSBI, and South Dakota State University for their funding support, as well as the graduate students; Ahmed Abdalla, Yashar Askarzadeh, and Salman Mirzaee help throughout this work.
Conflicts of Interest
The authors declare no conflicts of interest.
Abbreviations
The following abbreviations are used in this manuscript:
| AI | Artificial Intelligence |
| AP | Average Precision |
| AUB | Union of sets A and B |
| BCE | Binary Cross-Entropy |
| BCEclsloss | Binary Cross-Entropy Classification Loss |
| CNN | Convolutional Neural Network |
| CPU | Central Processing Unit |
| CSP | Cross Stage Partial |
| CSPDarknet53 | Cross Stage Partial Darknet53 (YOLO backbone network) |
| E-ELAN | Extended Efficient Layer Aggregation Network |
| E-LAN | Efficient Layer Aggregation Network |
| F1 | F1 Score (harmonic mean of precision and recall) |
| FN | False Negative |
| FP | False Positive |
| FPN | Feature Pyramid Network |
| FPS | Frames Per Second |
| GIOU | Generalized Intersection over Union |
| GIOU_loss | Generalized Intersection over Union Loss |
| GPU | Graphics Processing Unit |
| IOU | Intersection over Union |
| LP-E6N | Canon LP-E6N (camera battery model) |
| mAP | mean Average Precision |
| N | Number of scalar values in model output (in loss formula) |
| PANet | Path Aggregation Network |
| R-CNN | Region-based Convolutional Neural Network |
| RAM | Random Access Memory |
| RGB | Red, Green, Blue (color channels) |
| SD | South Dakota |
| SDSU | South Dakota State University |
| SSD | Single Shot Detector |
| TP | True Positive |
| UAV | Unmanned Aerial Vehicle |
| USA | United States of America |
| YAML | “YAML Ain’t Markup Language” (configuration file format) |
| YOLO | You Only Look Once (object detection algorithm family) |
| YOLOv5 | You Only Look Once version 5 |
| YOLOv7 | You Only Look Once version 7 |
References
- Deng, R.; Jiang, Y.; Tao, M.; Huang, X.; Bangura, K.; Liu, C.; Lin, J.; Qi, L. Deep learning-based automatic detection of productive tillers in rice. Comput. Electron. Agric. 2020, 177, 105703. [Google Scholar] [CrossRef] [Scilit]
- Feng, A.; Zhou, J.; Vories, E.; Sudduth, K.A. Evaluation of cotton emergence using UAV-based imagery and deep learning. Comput. Electron. Agric. 2020, 177, 105711. [Google Scholar] [CrossRef] [Scilit]
- Smith, A.; Jones, B. The identification and categorization of seed mixtures: Implications for agriculture and research. Agric. J. 2023, 45, 123–137. [Google Scholar]
- Granitto, P.M.; Navone, H.D.; Verdes, P.F.; Ceccatto, H.A. Weed seeds identification by machine vision. Comput. Electron. Agric. 2002, 33, 91–103. [Google Scholar] [CrossRef] [Scilit]
- Brown, X.; Davis, Y. Challenges of manual seed identification in agriculture. Agric. Technol. Rev. 2019, 22, 45–59. [Google Scholar]
- Johnson, Z. Manual seed identification: Time-consuming and error prone. J. Crop Sci. 2022, 14, 321–335. [Google Scholar]
- Taylor, R.; Khan, S. Automation in seed identification: A paradigm shift in agricultural analysis. Agric. Autom. 2022, 30, 78–92. [Google Scholar]
- Koh, J.C.; Hayden, M.; Daetwyler, H.; Kant, S. Estimation of crop plant density at early mixed growth stages using UAV imagery. Plant Methods 2019, 15, 64. [Google Scholar] [CrossRef] [Scilit] [PubMed]
- Lu, H.; Cao, Z.; Xiao, Y.; Zhuang, B.; Shen, C. TasselNet: Counting maize tassels in the wild via local counts regression network. Plant Methods 2017, 13, 79. [Google Scholar] [CrossRef] [Scilit] [PubMed]
- Kumari, K.; Bhalekar, D.G.; Chappa, S.; Kumar, P.; Bhattarai, R.; Nagineni, P. Crop Disease Detection and Prevention Using Artificial Intelligence. In Smart Farming, Smarter Solutions: Revolutionizing Agriculture with Artificial Intelligence; CRC Press/Taylor & Francis Group: Boca Raton, FL, USA, 2025; Volume 134. [Google Scholar]
- Lu, N.; Zhou, J.; Han, Z.; Li, D.; Cao, Q.; Yao, X.; Tian, Y.; Zhu, Y.; Cao, W.; Cheng, T. Improved estimation of aboveground biomass in wheat from RGB imagery and point cloud data acquired with a low-cost unmanned aerial vehicle system. Plant Methods 2019, 15, 17. [Google Scholar] [CrossRef] [Scilit]
- Madec, S.; Jin, X.; Lu, H.; De Solan, B.; Liu, S.; Duyme, F.; Heritier, E.; Baret, F. Ear density estimation from high resolution RGB imagery using deep learning technique. Agric. For. Meteorol. 2019, 264, 225–234. [Google Scholar] [CrossRef] [Scilit]
- Zhao, B.; Zhang, J.; Yang, C.; Zhou, G.; Ding, Y.; Shi, Y.; Zhang, D.; Xie, J.; Liao, Q. Rapeseed seedling stand counting and seeding performance evaluation at two early growth stages based on unmanned aerial vehicle imagery. Front. Plant Sci. 2018, 9, 1362. [Google Scholar] [CrossRef] [Scilit]
- Liu, T.; Wu, W.; Chen, W.; Sun, C.; Zhu, X.; Guo, W. Automated image-processing for counting seedlings in a wheat field. Precis. Agric. 2016, 17, 392–406. [Google Scholar] [CrossRef] [Scilit]
- Che, Y.; Wang, Q.; Zhou, L.; Wang, X.; Li, B.; Ma, Y. The effect of growth stage and plant counting accuracy of maize inbred lines on LAI and biomass prediction. Precis. Agric. 2022, 23, 2159–2185. [Google Scholar] [CrossRef] [Scilit]
- Kumar, J.P.; Domnic, S. Image based leaf segmentation and counting in rosette plants. Inf. Process. Agric. 2019, 6, 233–246. [Google Scholar] [CrossRef] [Scilit]
- Zhang, P.; Li, D. Automatic counting of lettuce using an improved YOLOv5s with multiple lightweight strategies. Expert Syst. Appl. 2023, 226, 120220. [Google Scholar] [CrossRef] [Scilit]
- Kumari, K.; Nafchi, A.M.; Mirzaee, S.; Abdalla, A. AI-Driven Future Farming: Achieving Climate-Smart and Sustainable Agriculture. AgriEngineering 2025, 7, 89. [Google Scholar] [CrossRef] [Scilit]
- Kartal, S.; Choudhary, S.; Masner, J.; Kholová, J.; Stočes, M.; Gattu, P.; Schwartz, S.; Kissel, E. Machine learning-based plant detection algorithms to automate counting tasks using 3d canopy scans. Sensors 2021, 21, 8022. [Google Scholar] [CrossRef] [Scilit] [PubMed]
- Yuan, Y.; Chen, L.; Wu, H.; Li, L. Advanced agricultural disease image recognition technologies: A review. Inf. Process. Agric. 2022, 9, 48–59. [Google Scholar] [CrossRef] [Scilit]
- Dang, F.; Chen, D.; Lu, Y.; Li, Z. YOLOWeeds: A novel benchmark of YOLO object detectors for multi-class weed detection in cotton production systems. Comput. Electron. Agric. 2023, 205, 107655. [Google Scholar] [CrossRef] [Scilit]
- Joosen, R.V.; Kodde, J.; Willems, L.A.; Ligterink, W.; Van Der Plas, L.H.; Hilhorst, H.W. GERMINATOR: A software package for high-throughput scoring and curve fitting of Arabidopsis seed germination. Plant J. 2010, 62, 148–159. [Google Scholar] [CrossRef] [Scilit] [PubMed]
- Zhang, W.; Dong, M.; Jiang, L. Image segmentation using convolutional neural networks in multi-sensor information fusion. Soft Comput. 2023, 27, 18353–18372. [Google Scholar] [CrossRef] [Scilit]
- Bai, B.; Zhang, J.; Song, Z.; Zhou, P.; Zhao, A. Enhancing Sunflower Head Segmentation and Counting Using Improved UNet. Appl. Eng. Agric. 2025, 41, 125–136. [Google Scholar] [CrossRef] [Scilit]
- Valente, J.; Sari, B.; Kooistra, L.; Kramer, H.; Mücher, S. Automated crop plant counting from very high-resolution aerial imagery. Precis. Agric. 2020, 21, 1366–1384. [Google Scholar] [CrossRef] [Scilit]
- Osco, L.P.; Arruda, M.D.S.D.; Marcato Junior, J.; da Silva, N.B.; Ramos, A.P.M.; Moryia, A.S.; Imai, N.N.; Pereira, D.R.; Creste, J.E.; Matsubara, E.; et al. A convolutional neural network approach for counting and geolocating citrus-trees in UAV multispectral imagery. ISPRS J. Photogramm. Remote Sens. 2020, 160, 97–106. [Google Scholar] [CrossRef] [Scilit]
- Guo, B.; Ling, S.; Tan, H.; Wang, S.; Wu, C.; Yang, D. Detection of the grassland weed phlomoides umbrosa using multi-source imagery and an improved YOLOv8 network. Agronomy 2023, 13, 3001. [Google Scholar] [CrossRef] [Scilit]
- Lv, X.; Ming, D.; Chen, Y.; Wang, M. Very high resolution remote sensing image classification with SEEDS-CNN and scale effect analysis for superpixel CNN classification. Int. J. Remote Sens. 2019, 40, 506–531. [Google Scholar] [CrossRef] [Scilit]
- Williams, E.; Sharma, R. Importance of high-quality datasets and model selection in deep learning for agriculture. J. Agric. Data Sci. 2020, 28, 89–104. [Google Scholar]
- Lee, G.Y.; Alzamil, L.; Doskenov, B.; Termehchy, A. A survey on data cleaning methods for improved machine learning model performance. arXiv 2021, arXiv:2109.07127. [Google Scholar] [CrossRef] [Scilit]
- Magalhães, S.A.; Castro, L.; Moreira, G.; Dos Santos, F.N.; Cunha, M.; Dias, J.; Moreira, A.P. Evaluating the single-shot multibox detector and YOLO deep learning models for the detection of tomatoes in a greenhouse. Sensors 2021, 21, 3569. [Google Scholar] [CrossRef] [Scilit] [PubMed]
- Hosain, M.T.; Zaman, A.; Abir, M.R.; Akter, S.; Mursalin, S.; Khan, S.S. Synchronizing object detection: Applications, advancements and existing challenges. IEEE Access 2024, 12, 54129–54167. [Google Scholar] [CrossRef] [Scilit]
- Redmon, J.; Divvala, S.; Girshick, R.; Farhadi, A. You only look once: Unified, real-time object detection. In Proceedings of the IEEE Conference on Computer Vision and Pattern Recognition, Las Vegas, NV, USA, 27–30 June 2016; pp. 779–788. [Google Scholar]
- Pola, V.G.; Vaishnavi, A.B.; Karra, S.S. Comparison of YOLOv3, YOLOv4 and yolov5 performance for detection of blood cells. Int. Res. J. Eng. Technol. 2021, 8, 4225–4229. [Google Scholar]
- Padilla, R.; Passos, W.L.; Dias, T.L.; Netto, S.L.; Da Silva, E.A. A comparative analysis of object detection metrics with a companion open-source toolkit. Electronics 2021, 10, 279. [Google Scholar] [CrossRef] [Scilit]
- Sanchez, S.A.; Romero, H.J.; Morales, A.D. A review: Comparison of performance metrics of pretrained models for object detection using the TensorFlow framework. In Proceedings of the IOP Conference Series: Materials Science and Engineering, Cartagena, Colombia, 30 October–1 November 2019; IOP Publishing: Bristol, UK, 2020; Volume 844, p. 012024. [Google Scholar]
- Nepal, U.; Eslamiat, H. Comparing YOLOv3, YOLOv4 and YOLOv5 for autonomous landing spot detection in faulty UAVs. Sensors 2022, 22, 464. [Google Scholar] [CrossRef] [Scilit]
- Wang, C.Y.; Liao, H.Y.M. YOLOv1 to YOLOv10: The fastest and most accurate real-time object detection systems. APSIPA Trans. Signal Inf. Process. 2024, 13, e19. [Google Scholar] [CrossRef] [Scilit]
- Glenn, J. v8.1.0—YOLOv8 Oriented Bounding Boxes (OBB). 2024. Available online: https://github.com/ultralytics/ultralytics/releases/tag/v8.1.0 (accessed on 10 January 2024).
- Wang, C.Y.; Bochkovskiy, A.; Liao, H.Y.M. YOLOv7: Trainable bag-of-freebies sets new state-of-the-art for real-time object detectors. In Proceedings of the IEEE/CVF Conference on Computer Vision and Pattern Recognition, Vancouver, BC, Canada, 17–24 June 2023; pp. 7464–7475. [Google Scholar]
- Durve, M.; Orsini, S.; Tiribocchi, A.; Montessori, A.; Tucny, J.-M.; Lauricella, M.; Camposeo, A.; Pisignano, D.; Succi, S. Benchmarking YOLOv5 and YOLOv7 models with DeepSORT for droplet tracking applications. Eur. Phys. J. E 2023, 46, 32. [Google Scholar] [CrossRef] [Scilit]
- Jiang, K.; Xie, T.; Yan, R.; Wen, X.; Li, D.; Jiang, H.; Jiang, N.; Feng, L.; Duan, X.; Wang, J. An attention mechanism-improved YOLOv7 object detection algorithm for hemp duck count estimation. Agriculture 2022, 12, 1659. [Google Scholar] [CrossRef] [Scilit]
- Bochkovskiy, A.; Wang, C.Y.; Liao, H.Y.M. Yolov4: Optimal speed and accuracy of object detection. arXiv 2020, arXiv:2004.10934. [Google Scholar] [CrossRef] [Scilit]
- Lin, Q.; Ye, G.; Wang, J.; Liu, H. Roboflow: A data-centric workflow management system for developing ai-enhanced robots. In Proceedings of the Conference on Robot Learning, London, UK, 8–11 November 2021; PMLR: Cambridge, MA, USA, 2022; pp. 1789–1794. [Google Scholar]
- Cai, Z.; Vasconcelos, N. Cascade r-cnn: Delving into high quality object detection. In Proceedings of the IEEE Conference on Computer Vision and Pattern Recognition, Salt Lake City, UT, USA, 18–23 June 2018; pp. 6154–6162. [Google Scholar]
- Hua, Z.; Aranganadin, K.; Yeh, C.-C.; Hai, X.; Huang, C.-Y.; Leung, T.-C.; Hsu, H.-Y.; Lan, Y.-C.; Lin, M.-C. A benchmark review of YOLO algorithm developments for object detection. IEEE Access 2025, 13, 123515–123545. [Google Scholar] [CrossRef] [Scilit]
- Redmon, J.; Farhadi, A. YOLO9000: Better, faster, stronger. In Proceedings of the IEEE Conference on Computer Vision and Pattern Recognition, Honolulu, HI, USA, 21–26 July 2017; pp. 7263–7271. [Google Scholar]
- Redmon, J.; Farhadi, A. Yolov3: An incremental improvement. arXiv 2018, arXiv:1804.02767. [Google Scholar] [CrossRef] [Scilit]
- Jocher, G.; Chaurasia, A.; Stoken, A.; Borovec, J.; Kwon, Y.; Michael, K.; Xie, T.; Fang, J.; Zeng, Y.; Wong, C.; et al. ultralytics/yolov5: v7. 0-yolov5 Sota Realtime Instance Segmentation; Zenodo: Geneva, Switzerland, 2022. [Google Scholar]
- Kumari, K.; Won, K.; Nafchi, A.M. YOLOv5 deep learning model for mixed seed detection, classification, and counting. In Proceedings of the 2024 ASABE Annual International Meeting, Anaheim, CA, USA, 28–31 July 2024; American Society of Agricultural and Biological Engineers: St. Joseph, MI, USA, 2024; p. 1. [Google Scholar]
- Li, C.; Li, L.; Jiang, H.; Weng, K.; Geng, Y.; Li, L.; Ke, Z.; Li, Q.; Cheng, M.; Nie, W.; et al. YOLOv6: A single-stage object detection framework for industrial applications. arXiv 2022, arXiv:2209.02976. [Google Scholar] [CrossRef] [Scilit]
- Selvi, A.S.; Aadesh, P.S.; Manoharan, B.; Narayanan, S.H. Real-Time Multiple Object Tracking and Object Detection Using YOLOv7 and FAIRMOT Algorithm. In Proceedings of the 2023 International Conference on Innovative Computing, Intelligent Communication and Smart Electrical Systems (ICSES), Chennai, India, 21–22 December 2023; IEEE: Piscataway, NJ, USA, 2023; pp. 1–5. [Google Scholar]
- Jocher, G.; Chaurasia, A.; Qiu, J.; Stoken, A. YOLOv8: The next generation of real-time object detection. arXiv 2023, arXiv:2301.00001. [Google Scholar]
- Wang, C.Y.; Yeh, I.H.; Mark Liao, H.Y. Yolov9: Learning what you want to learn using programmable gradient information. In Proceedings of the European Conference on Computer Vision, Milan, Italy, 29 September–4 October 2024; Springer Nature: Cham, Switzerland, 2024; pp. 1–21. [Google Scholar]
- Kumari, K.; Parray, R.; Basavaraj, Y.B.; Godara, S.; Mani, I.; Kumar, R.; Khura, T.; Sarkar, S.; Ranjan, R.; Mirzakhaninafchi, H. Spectral sensor-based device for real-time detection and severity estimation of groundnut bud necrosis virus in tomato. J. Field Robot. 2025, 42, 5–19. [Google Scholar] [CrossRef] [Scilit]
- Wang, A.; Chen, H.; Liu, L.; Chen, K.; Lin, Z.; Han, J. Yolov10: Real-time end-to-end object detection. Adv. Neural Inf. Process. Syst. 2024, 37, 107984–108011. [Google Scholar]
- Lei, M.; Li, S.; Wu, Y.; Hu, H.; Zhou, Y.; Zheng, X.; Ding, G.; Du, S.; Wu, Z.; Gao, Y. YOLOv13: Real-Time Object Detection with Hypergraph-Enhanced Adaptive Visual Perception. arXiv 2025, arXiv:2506.17733. [Google Scholar]

Disclaimer/Publisher’s Note: The statements, opinions and data contained in all publications are solely those of the individual author(s) and contributor(s) and not of MDPI and/or the editor(s). MDPI and/or the editor(s) disclaim responsibility for any injury to people or property resulting from any ideas, methods, instructions or products referred to in the content. |
© 2025 by the authors. Licensee MDPI, Basel, Switzerland. This article is an open access article distributed under the terms and conditions of the Creative Commons Attribution (CC BY) license (https://creativecommons.org/licenses/by/4.0/).