


Abstract
Geological CO2 storage is essential to pathways to carbon neutrality, but its deployment depends on trustworthy estimates of storage capacity, injectivity, trapping, reactive evolution, and containment. Digital rock physics can provide pore-scale inputs to these estimates from X-ray and electron microscopy images, but translation to formation-scale performance requires additional geological, fluid, and operational information. Each image-derived result depends on image segmentation, which converts grayscale data into pore, mineral, fracture, and fluid phases. This review evaluates classical methods, machine learning, deep learning, transformers, and foundation models according to whether they support reliable storage decisions rather than image overlap scores alone. Evidence is synthesized from imaging of dry rocks, CO2–brine experiments, multiscale studies of carbonates and shales, and analyses of fractured rocks. We introduce a framework with seven dimensions: class accuracy, boundary fidelity, topology, morphology, calibrated uncertainty, sensitivity of physical properties, and consequences for engineering decisions. The evidence shows that visually similar segmentations can yield substantially different predictions of permeability, connected porosity, residual trapping, reactive surface area, and leakage paths when errors occur at critical pore throats, fluid interfaces, or fractures. We therefore recommend selecting methods according to storage task and lithology, validating them on independent samples, propagating ensembles of plausible segmentations, using metrics that account for topology, and comparing predictions with laboratory measurements. The central message is simple: segmentation should be treated as both a measurement process and a form of risk control. Segmentation with auditable and quantified uncertainty has the potential to improve the inputs to site screening, injection design, and monitoring. These project-level benefits are proposed consequences requiring upscaling and project-specific validation, not outcomes demonstrated by this review.
1. Introduction
1.1. Carbon Neutrality, Geological CO2 Storage, and the Digital Rock Measurement Problem
Geological CO2 storage at large scale will support pathways to carbon neutrality only if its capacity, injectivity, trapping, and containment can be estimated with defensible uncertainty. A single decision during image processing can close a pore throat, merge trapped CO2 clusters, or create a false fracture connection, thereby changing an engineering conclusion even when the segmented image appears accurate. This issue matters because carbon neutrality requires both deep emissions reductions and durable management of residual emissions. The International Energy Agency identifies carbon capture, utilization, and storage as important in pathways to net zero, while the Intergovernmental Panel on Climate Change recognizes geological storage as a mitigation option when suitable formations are selected and managed appropriately [1,2]. For saline aquifers, depleted reservoirs, and other storage formations, deployability depends not only on nominal pore volume but also on capacity limited by pressure, injectivity, trapping efficiency, reactive evolution, and containment integrity.
Digital rock physics (DRP), also termed digital core analysis, combines 3D imaging and numerical modeling to estimate the structure and transport behavior of porous materials. Laboratory micro-computed tomography (micro-CT), synchrotron tomography, nano-computed tomography (nano-CT), scanning electron microscopy (SEM), backscattered electron imaging (BSE), and focused ion beam–SEM (FIB-SEM) resolve rock fabrics over scales from nanometers to centimeters. Pore-network, lattice-Boltzmann, finite-volume, and finite-element models then use the segmented images to predict porosity, permeability, capillary behavior, fluid displacement, reactive transport, and mechanical response [3,4,5]. These outputs can inform reservoir characterization, injection design, trapping assessment, and containment evaluation.
Segmentation is therefore not simply an image cleaning step; it is the measurement model that connects grayscale data to physical predictions. It assigns labels to pore space, minerals, fractures, brine, and CO2, thereby defining pore volume, throat geometry, connectivity, interfacial curvature, reactive surface area, and the solid framework that carries mechanical loads in downstream simulations [6,7,8]. A visually plausible mask may remain physically misleading if it seals a critical throat, joins isolated pores, merges separate CO2 ganglia, removes a cement bridge, or overlooks a fracture that could contribute to leakage.
The problem is especially consequential in heterogeneous carbonates, clay-bearing sandstones, organic-rich shales, fractured caprocks, dynamic CO2–brine experiments, and multiresolution datasets. Overlapping grayscale distributions, beam hardening, noise, partial-volume effects, motion, and subresolution porosity make phase boundaries intrinsically ambiguous. Segmentation uncertainty therefore propagates from the voxel scale into decisions about storage capacity, injectivity, residual trapping, reactive transport, pressure management, and containment.
1.2. Review Gap, Questions, and Contribution
Recent reviews cover rock segmentation based on artificial intelligence and the broader intelligent digital rock workflow, including super-resolution, reconstruction, and surrogate flow simulation [9,10,11]. These syntheses are valuable, but they do not center the question addressed here: whether segmentation uncertainty changes the properties and decisions associated with geological CO2 storage. Storage applications require a synthesis tailored to the task that identifies which methods preserve the features controlling capacity, injectivity, trapping, reactivity, and containment; how uncertainty propagates into those quantities; and how method selection should change with lithology, imaging condition, data availability, and decision consequence.
This review addresses four questions. First, which imaging, lithological, and experimental characteristics determine segmentation difficulty in geological CO2 storage studies? Second, what evidence supports classical, machine learning, and deep learning methods for pore, mineral, fracture, and CO2–brine phase segmentation? Third, how do segmentation errors propagate into storage capacity, permeability and injectivity, capillary and residual trapping, reactive evolution, and geomechanical or leakage assessments? Fourth, what validation and uncertainty framework is required for reproducible storage characterization that is relevant to decisions?
The distinctive contribution is a shift from ranking algorithms to evaluating storage properties and decisions. The review organizes evidence by storage task, lithology, validation basis, and downstream consequence; distinguishes direct evidence from CO2 storage, analogous evidence from porous media, and transferable evidence from computer vision; consolidates uncertainty sources and propagation pathways; and formalizes a quality control framework with seven dimensions: class accuracy, boundary fidelity, topology, morphology, calibrated uncertainty, sensitivity of physical properties, and expected decision consequence. This focus differentiates the article from broader reviews of intelligent digital rock workflows by treating segmentation as an auditable stage of measurement and risk control for geological storage.
2. Review Framework and Evidence Synthesis
2.1. Review Design, Search Transparency, and Scope
This review uses 154 references, comprising empirical investigations, methodological papers, reviews, policy reports, and data resources. The reference count is therefore not a count of independent experimental studies. Sources were considered relevant when they addressed (i) segmentation or preprocessing of rock or porous-material images; (ii) validation, benchmarking, uncertainty, or explainability in phase delineation; or (iii) the influence of segmented geometry on quantities relevant to CO2 storage.
A targeted publisher and repository search on 8 September 2026 assessed seven selected recent candidates and included three full-text sources [12,13,14]. A subsequent Scopus update used an author-supplied export dated 18 September 2026. The title–abstract–keyword query combined CO2 terms, rocks or porous analogs, and tomography, pore-scale imaging or segmentation. The exact query, export provenance and record-level decisions are provided in Supplementary Material S2.
The Scopus export contained 2271 records. Removing 14 repeated DOI or Scopus identifiers left 2257 unique records: 8 already cited, 590 potentially relevant candidates, 431 adjacent or contextual records, and 1228 exclusions. All titles were screened, with 1118 supplied abstracts consulted. Sixteen candidates were prioritized for distinct contributions to segmentation sensitivity, direct CO2 imaging or image-to-property assessment; 11 were assessed in full text and included [15,16,17,18,19,20,21,22,23,24,25], while five remained unavailable in full text. The other 574 candidates were retained without full-text assessment. These counts describe the supplied export, not an independently confirmed total of database hits.
This critical review uses purposive selection. AI assisted the initial screening of Scopus records and evidence extraction. A second screening pass, conducted by an author using code to process the exported CSV records, refined the selection and checked whether the AI-assisted screening had retained studies relevant to the review. The screening outputs were subsequently reviewed manually, and any discrepancies between the two selections were assessed. This check identified no inconsistencies that materially affected the final selection of studies. No year, language or document-type limits were requested for this query; its CO2 requirement can miss otherwise relevant segmentation methods. Historical retrieval logs before the documented updates remain incomplete. The review was not prospectively registered. Table 1 summarizes the design.
Table 1.
Review design and evidence synthesis summary.
2.2. Evidence Classification and Extraction
Supplementary Material S1 covers all 154 cited sources: 132 evidence entries in Table S1 and 22 contextual entries in Table S2. Extraction records source role, tier, material, imaging, task, validation, physical outputs, findings and limitations. The 132 evidence entries comprise 67 extracted from full text (FT), 42 from abstracts (AB), 16 from abstracts with partial excerpts (MX), and 7 from metadata (MD). Thus, 49 rely on abstracts or metadata alone; 64 contain a field marked “not verified”. These categories overlap. “Not verified” denotes an access or extraction gap; “not reported” denotes an omission in an inspected source. Access codes accompany the comparative evidence tables.
Evidence is organized into three relevance tiers, with contextual sources identified separately. Tier A comprises studies reporting CO2 displacement, trapping or related processes in porous media, including storage studies and explicitly identified CO2-enhanced-oil-recovery analogs. Furthermore, a distinction is made among natural rocks, engineered media, and numerical models. Tier B comprises geological or analogous porous-material imaging, pore-structure and physical-property evidence without an established direct CO2 investigation. Tier C comprises original transferable segmentation, learning, uncertainty or interpretability methods demonstrated in other imaging domains. Reviews, policy reports, background theory and repositories are recorded as Context. Classification follows the substantive contribution: a chapter reporting original case-study evidence can belong to Tier B. Tiers identify relevance, not methodological quality. The greatest weight is given to common-image comparisons, known geometry, independent measurements, held-out samples and a common physical solver.
2.3. Limits of Comparison Across Studies
Differences in lithology, voxel size, phase count, class balance, annotation, data partitions, metric definitions and physical solvers preclude pooled estimates or universal algorithm rankings. Uneven source access and purposive selection limit assessment of benchmark independence and literature coverage. Abstract- and metadata-based evidence supports only the inspected claims. Comparisons are interpreted within each study’s task, validation and access basis, as identified in the comparative evidence tables.
2.4. Figure Preparation and AI Assistance
The six figures are conceptual syntheses of segmentation methods, uncertainty propagation, and proposed digital-rock workflows. Rock-image panels, masks, comparison maps, distributions, architecture blocks, and property curves serve illustrative purposes and do not constitute new experimental measurements, benchmark results, or validated flow simulations.
OpenAI’s image-generation and editing tool was used to refine all six figures. Figure citations identify the methodological sources informing the conceptual illustrations. All figures were developed specifically for this review as original conceptual illustrations and do not reproduce or adapt previously published figures or third-party visual material. Accordingly, third-party reproduction permissions were not required. Following refinement with the generative image tool, the authors manually checked all labels, numerical values and schematic elements in all six figures for internal consistency and agreement with the manuscript text, captions and intended conceptual representations. Identified inconsistencies were corrected.
3. Digital Rock Imaging Across the Geological CO2 Storage Workflow
3.1. Imaging Modalities, Scale, and Measurements Relevant to Storage
The fidelity of a geological CO2 storage DRP workflow begins with the information content of the acquired image. Laboratory micro-CT commonly supports pore-network, injectivity, and studies of multiphase flow at core subvolume scale; synchrotron tomography enables rapid imaging of dynamic CO2–brine displacement; nano-CT, SEM, and FIB-SEM resolve microporosity and pores associated with minerals that control storage and transport in tight rocks. No modality is universally optimal because spatial resolution, representative field of view, acquisition speed, pressure–temperature compatibility, phase contrast, and cost trade against one another [26,27,28,29,30]. Table 2 compares the principal modalities on resolution, application, and limitations.
Table 2.
Comparison of imaging modalities used in digital rock analysis for geological CO2 storage.
The representative elementary volume (REV) is the minimum domain over which a structural or petrophysical quantity becomes acceptably stable and less dependent on the selected subvolume [38]. For storage characterization, the resolution–REV tradeoff is consequential: high resolution improves pore-throat, fluid interface, and delineation of reactive minerals but may omit heterogeneity controlling injectivity at the plug scale or capacity; lower resolution captures a larger domain but increases partial-volume bias and can suppress microporosity. Multiscale integration is therefore often required to relate pore-scale observations to effective properties relevant to storage.
Voxel size describes spatial sampling; effective spatial resolution describes distinguishable image detail. Both depend on acquisition conditions. Table 2 reports them separately for a geological nano-XRM example. Polymer-membrane imaging [39] demonstrates transferable capability, not validation for shale or tight rocks.
3.2. Imaging Artifacts, Preprocessing, and Storage Bias
Raw 3D images are imperfect representations of attenuation and are affected by detector noise, ring artifacts, beam hardening, motion, blur, and partial-volume effects [40,41,42]. In storage studies, these artifacts can mimic or obscure small CO2 ganglia, narrow pore throats, clay-filled microporosity, reactive mineral boundaries, or fracture apertures. The resulting histogram overlap directly affects threshold selection and can bias porosity, permeability, residual saturation, interfacial curvature, reactive surface area, and leakage path connectivity.
Preprocessing commonly applies denoising, artifact correction, contrast enhancement, registration, and intensity normalization before segmentation. Median and nonlocal means filters may suppress noise while preserving boundaries, whereas unsharp masking can improve local contrast [42,43,44]. These operations are not neutral: filter type, kernel size, registration method, and contrast agent correction can open or close throats, smooth CO2–brine interfaces, remove thin fractures, or alter apparent mineral volume. Studies focused on storage should therefore report the complete preprocessing chain and test whether physically important outputs remain stable under plausible parameter variation. Figure 1 illustrates the complete rock imaging workflow.
Figure 1.
Conceptual digital-rock workflow from image acquisition to conditional CO2-storage interpretation, with feedback from image evaluation and simulation to processing [3,4,5,6,7,8]. The masks, comparison map, and qualitative velocity patterns are schematic representations of the processing, evaluation, and simulation stages. In the segmented volume, blue, green and gray denote pore, fluid and solid matrix, respectively; the qualitative flow scale runs from blue (low) to red (high). Red and blue patches distinguish schematic comparison regions. Solid arrows indicate workflow progression, and dashed arrows indicate feedback.
4. Segmentation Methods and Evaluation for Storage Applications
4.1. Definition, Objectives, and Algorithm Taxonomy
Image segmentation converts a continuous grayscale image into discrete labels representing pore space, mineral phases, fractures, brine, CO2, or other fluids. In geological storage, the resulting phase map defines the geometry used to estimate connected pore volume, flow pathways, capillary interfaces, reactive surface area, and mechanical continuity. The required task may be binary pore–solid segmentation, multiclass mineral segmentation, temporally consistent CO2–brine–rock segmentation, or instance-level separation of individual ganglia, grains, pores, or fracture segments.
The authors organize segmentation methodologies into six broad families for this review; this synthesis is not a mutually exclusive or exhaustive taxonomy. The first three encompass classical computer vision techniques: (1) threshold methods, which separate phases through grayscale intensity distributions and histogram characteristics [45]; (2) edge methods, which identify phase boundaries through sharp gradient discontinuities; and (3) region methods, which group neighboring voxels into contiguous structural domains according to predefined similarity criteria [10]. The subsequent three represent the shift toward artificial intelligence driven by data: (4) clustering and unsupervised machine learning (ML); (5) supervised ML, which learns classification rules from annotated data; and (6) deep learning architectures, which use convolutional neural networks (CNNs) to learn hierarchical multiscale features directly from images. Rock-image studies support both clustering and conventional supervised-learning approaches [46]. Hybrid workflows combine these families, for example, by using deep features with a conventional classifier or by adding attention and domain adaptation [10]. Figure 2 illustrates the six (6) segmentation method families as identified by the authors.
Figure 2.
Synthesis of six families of segmentation methods relevant to digital rock physics [9,10,45,46,47]. The grouping organizes commonly used approaches; hybrid workflows may combine categories, which are not mutually exclusive or exhaustive. Image examples, feature plots, and class colors illustrate the method families and do not establish performance rankings. Example class colors are black (pore/void), gray (solid matrix), blue/green (fluids 1/2), red/yellow (minerals 1/2) and purple (other phases). Blue circles, green squares and red triangles denote example feature-space groups; dashed separators illustrate class boundaries. Red circles in the edge panel mark gradient peaks, and arrows indicate processing direction.
4.2. Evaluation Framework with Seven Dimensions
Evaluation for storage applications must extend beyond image overlap. A mask can achieve a high Dice coefficient or intersection over union (IoU) while incorrectly closing a critical throat, joining isolated pore clusters, merging separate CO2 ganglia, shifting a fluid interface, or missing a fracture. The proposed framework therefore evaluates segmentation through seven dimensions: accuracy at the voxel and class levels, boundary fidelity, topology, morphology, calibrated uncertainty, sensitivity of physical properties, and engineering decision consequence [6,48].
where TP denotes true-positive voxels correctly classified as the target phase, FP denotes false-positive voxels incorrectly assigned to the target phase, and FN denotes false-negative voxels belonging to the target phase but incorrectly classified as another phase. Both Dice and IoU range from 0 to 1, with values closer to 1 indicating greater agreement between the predicted and reference segmentations.
Equations (1) and (2) summarize volumetric agreement but do not encode where an error occurs. Equation (3) connects a segmented geometry to an independently measured or accepted property.
where εX is the absolute relative percentage error in the property X, Xseg is the property computed from the segmented geometry, and Xref is the corresponding experimentally measured or otherwise accepted reference value. The vertical bars |·| denote the absolute value, ensuring that the reported error magnitude is nonnegative. X may represent porosity, permeability, capillary pressure, residual CO2 saturation, interfacial area, reactive surface area, fracture aperture, conductivity, or elastic modulus. Because Equation (3) reports only the magnitude of the error, the signed bias should also be reported when distinguishing overestimation from underestimation is important to the storage decision.
The comparative analysis in Section 9 uses the seven dimensions in Table 3 to distinguish visually accurate masks from storage models that are physically reliable and appropriate for decisions.
Table 3.
Evaluation framework with seven dimensions for segmentation in geological CO2 storage.
5. Classical and Conventional Machine Learning Segmentation for Storage Rocks
5.1. Threshold, Edge, and Region Methods
Classical methods remain useful because of their simplicity, low computational cost, and interpretability [45,47].
Global thresholding identifies an optimal intensity cutoff to separate void space from solid matrix by analyzing the image histogram [45]. Otsu’s method is the standard approach, maximizing variance between classes, a criterion that is statistically equivalent to finding the threshold that maximizes the magnitude of the pooled-variance two-sample t-statistic between two groups [49,50]. Its computational efficiency makes it a useful baseline for histogram-based phase delineation [47,49].
Global Otsu thresholding is most effective when phase intensities are well separated; overlapping distributions can reduce segmentation accuracy [47]. When class variances differ, Otsu’s threshold can shift toward the class with the larger variance and misclassify some pixels from that class [51]. Multilevel extensions permit more than two intensity classes [52,53], while locally adaptive methods use spatial information when a single global threshold is inadequate [47]. Yu et al. [54] combined HSV-based adaptive Otsu thresholding and connected-component refinement for pore extraction from colored cast thin sections.
Methods based on edge detection, including Sobel, Prewitt, and Canny operators, localize phase boundaries through spatial intensity gradients [55]. Although precise at boundary localization, they cannot guarantee continuous boundary closure because subtle intensity transitions at contacts between pores and grains produce disconnected edge segments, causing distinct pores or grains to merge during downstream analysis. These operators are also hypersensitive to noise and reconstruction artifacts, generating spurious false edges that confound pore network extraction [55].
Region methods overcome the closure problem by iteratively grouping neighboring voxels into explicitly closed regions [55]. The watershed algorithm treats image intensity as a 3D topography, forming segments at drainage divides between catchment basins [56,57]. However, noise and surface irregularities generate numerous spurious local minima, causing severe oversegmentation of individual pores and grains [56,57]. Region growing aggregates voxels outward from seed points according to homogeneity criteria but is highly sensitive to initialization; poor seed selection or threshold calibration can cause premature halting or boundary leakage and distort pore topology [55]. Ye et al. [15] combined supervoxels with intensity thresholding without training annotations, assessing noise, topology and interfaces in rock oil–water images and a gas-diffusion-layer analog.
Table 4 summarizes these methods. Comparisons show that relative performance depends on imaging conditions and the property evaluated [58,59].
Table 4.
Conditional strengths and limitations of classical segmentation methods.
5.2. Machine Learning Methods
Unsupervised approaches include k-means and fuzzy c-means (FCM), which partition voxel features using distance-based objectives [46,60]. FCM assigns partial membership to multiple clusters, allowing uncertain classifications to be represented. Their performance depends on phase contrast and feature selection; comparisons across rock images show that the most suitable method is dataset-dependent [46]. Intensity-based clustering alone does not explicitly enforce pore-network topology.
Supervised ML methods, including RF and SVM, classify phases from engineered image features [46,61,62]. The bibliographic record of Wu and Misra [63] identifies a random-forest approach using wavelet and Hessian features for shale images. Comparisons [46,64] show dataset-dependent phase classification, while representative annotations remain necessary for training [62].
Common DRP feature extraction strategies include texture measures derived from Gray Level Co-occurrence Matrices (GLCM) and Local Binary Patterns (LBP) [65], as well as multiscale filter responses such as Hessian features [66]. CobWeb 1.0 workflows can combine image filtering with local training vectors [67]. The performance of manually engineered features depends on the image properties and training data, which can limit generalization across rock types or imaging conditions [66]. These constraints motivate approaches that learn spatial features directly from image data [68,69].
5.3. Critical Assessment and Continuing Role of Conventional Methods
In two fractured sandstone datasets, Reinhardt et al. [62] found that RF and CNN segmentation handled imaging artifacts better than the conventional methods tested. RF required less training effort and computation and provided interactive uncertainty feedback. Segmentation without prior filtering was feasible under those acquisition conditions.
Geological information can strengthen conventional segmentation: Balcewicz et al. [70] combined micro-CT, optical microscopy, SEM, mineralogy, and laboratory measurements to guide segmentation of complex Ruhr sandstone. Method choice, therefore, depends on image quality, labels, geological context, and target properties. Figure 3 compares classical, supervised Machine Learning and Deep Learning.
Figure 3.
Conceptual differences between rule-based segmentation, conventional supervised learning with engineered features, and deep learning with learned features [46,61,62,63,68,69]. The conventional machine-learning panel represents supervised methods; machine learning also includes unsupervised approaches. The inputs, feature representations, and segmentation outputs are illustrative examples rather than results of a controlled comparison. Blue, green and purple arrows indicate progression through classical, supervised-learning and deep-learning workflows, respectively. Feature-space circles, squares and triangles represent example classes. Output class colors are black (pore/void), gray (solid matrix), dark/light blue (fluids 1/2), green/red/yellow (minerals 1/2/3) and purple (other phases).
6. Deep Learning Segmentation for Imaging in Geological CO2 Storage
6.1. Emergence of Deep Learning in DRP
Deep learning (DL) methods learn hierarchical spatial features directly from image data, reducing reliance on manual feature engineering [68]. Convolutional models have been used for pore–solid segmentation and for distinguishing pore and mineral classes in sandstone images [68,69]. Encoder–decoder architectures and data augmentation support segmentation with limited annotated rock images [68,71], while multitask models combine segmentation with property prediction [72].
6.2. Convolutional Neural Networks
CNNs apply learnable kernels, nonlinear activations, and pooling to build hierarchical representations of spatial relationships and rock textures [73].
Patch-based CNNs classify each target voxel using its local image context. Niu et al. [69] used a modified LeNet-5 network with 81 × 81 pixel patches to segment sandstone micro-CT images into pores and two mineral-density classes. Evaluating overlapping neighborhoods repeatedly increases inference work, while 2D inputs provide limited information about through-plane connectivity. Dense encoder–decoder networks predict labels for multiple pixels in a single pass. Liang et al. [74] used a U-Net for multi-mineral segmentation of Bentheimer sandstone micro-CT images, while Manzoor et al. [75] applied SegNet to rock micro-CT segmentation.
6.3. U-Net and Architectures with Encoders and Decoders
U-Net [76] has become the widely used baseline for DRP segmentation. Its contracting encoder captures contextual information through convolution and pooling, while a symmetric decoder recovers spatial resolution through upsampling. Skip connections preserve fine-grained spatial detail across corresponding encoder and decoder levels. These connections are essential for precisely delineating thin pore throats, intergranular contacts, and microcracks while maintaining both global context and local spatial fidelity [76]. Originally developed for biomedical segmentation with limited training data, its efficiency under conditions with limited data aligns directly with geoscientific imaging constraints.
Architectural variants address attention, feature depth and boundary representation. The bibliographic record of Yasin et al. [77] identifies Attention U-Net for shale FIB-SEM analysis, without a verified performance assessment here. The inspected excerpts of Sun et al. [78] describe residual U-Net for multi-mineral segmentation. Wang et al. [79] trained UNet++ with IK-EBM-derived labels; Wang et al. [80] integrated a pretrained edge-aware path. Both evaluated boundary-sensitive segmentation and properties against reference labels.
Recent implementations extend the U-Net to 3D datasets with complex lithologies. Zhu et al. [81] applied a full 3D U-Net to karst reservoir CT images to segment karst features and characterize their spatial structure. Suo et al. [82] combined semi-supervised U-Net segmentation with synthetic-image augmentation to reconstruct sandstone pore structures and compare pore-volume and throat-length characteristics. Mahmoudi et al. [83] addressed class imbalance in micro-CT segmentation through pixel-level weighting, improving segmentation of minority classes such as clay and feldspar.
High global accuracy can conceal missed micropores, clay-filled throats, and thin fractures [83,84]. Two-dimensional training risks leakage between adjacent slices; memory-limited 3D patches may truncate connectivity. The validation protocol in Section 8.4 addresses label quality, domain transfer, and physical-property sensitivity. Figure 4 shows the U-Net architecture.
Figure 4.
Generic same-padding 2D U-Net-style encoder–decoder with skip connections [76]. Encoder feature-channel counts are 64, 128, 256, and 512, followed by a 1024-channel bottleneck and mirrored decoder stages. The diagram illustrates the U-Net architectural concept through a same-padding variant; feature maps, block dimensions, and the example output are schematic. Gray dashed arrows denote skip connections that concatenate encoder and decoder features at matching spatial resolutions.
6.4. Semantic and Instance Segmentation
DL architectures perform dense prediction in two paradigms. Semantic segmentation assigns a categorical class label to every pixel or voxel, producing phase maps that distinguish pore space, grain matrix, or individual mineral identities; Bihani et al. [85] applied this for automated delineation of silt-grain, clay, and pore phases in mudrock SEM images. Instance segmentation additionally discriminates individual objects within the same class, enabling identification of discrete grains, pore bodies, or fracture segments as unique entities. Grain-scale characterization can also use direct property prediction: Bordignon et al. [86] trained a 3D convolutional network to estimate local grain-size and porosity distributions from micro-CT subvolumes. For instance segmentation, Ferreira et al. [87] identified individual quartz grains in iron ore optical microscopy. Semantic pore–solid maps can support porosity, permeability, and pore-network extraction. Maximal-ball, watershed, or related geometric algorithms can identify pore bodies and throats during network extraction from a binary pore-space image; a separate learned instance-segmentation model is not a prerequisite [88]. Explicit instance labels are useful when individual grains, contacts, or particles are the analysis targets [87].
Zhao et al. [89] used ResUNet-CBAM for thin-section segmentation, adding channel and spatial attention to emphasize relevant image features. Boundary fidelity and connectivity require validation for the acquisition and task.
6.5. Transformer and Attention Models
The bibliographic record of Sun et al. [90] identifies Swin-UNETR for sedimentary-rock pore segmentation; its input dimensionality and training implementation were not verified. In general, global attention compares all positions, while windowed attention extends local context through successive layers. A model name or assembled 3D output does not establish volumetric training or preserved connectivity. Comparisons should specify patch geometry, memory demand, external tests and property sensitivity. ResUNet-CBAM [89] is a convolutional attention model.
Foundation models such as the Segment Anything Model (SAM) and DINOv2 inherit representations from corpora of natural images whose boundaries and semantics differ from X-ray attenuation, partial-volume mixing, and topology-critical grayscale features in rocks [91,92]. Promptable output can depend on operator input: point and box placement, mask selection, and postprocessing reintroduce human discretion. Geological demonstrations are expanding, including CT segmentation based on DINOv2 and petrographic workflows derived from SAM, but the evidence remains small relative to the diversity of lithologies, imaging modalities, and 3D tasks [93,94]. Foundation models should therefore be treated as proposal generators, feature initializers, or few-shot adaptation tools rather than automatic geological ground truth.
6.6. Self-Supervised and Weakly Supervised Learning
Mamode et al. [95] evaluated semi-supervised core-image classification; Ma et al.’s preprint [96] used diffusion-generated image–mask pairs for rock segmentation. Classification does not establish pore-boundary accuracy, and augmentation requires independent geological and property validation. Wang et al. [16] applied an unsupervised CNN with region merging to Bentheimer CO2–water images and contact-angle measurement. Its overlap scores came from a synthetic benchmark; the natural-rock comparison used manually measured contact angles.
Transfer learning initializes encoders with representations from external datasets, improving convergence when labels specific to rock images are limited [97,98]. However, generic edges and textures may transfer while mineral attenuation relationships, subvoxel pore mixing, and noise specific to the scanner do not. Consequently, a transferred network may converge quickly to a biased solution. Claims of reduced label demand should report the full adaptation protocol, number and diversity of labeled samples, performance on independent rocks, and calibration of minor phases. Transfer learning is best viewed as an initialization strategy whose geological validity must still be demonstrated independently.
6.7. Computational Challenges and Evidence Synthesis
Deployment tests should assess continuity across inference patches, transfer across scanners and rocks, and separation of related training and test samples [9]. Table 5 compares architecture families; Section 8.4 specifies reproducibility and validation records.
Table 5.
Evidence-based comparison of deep learning architecture families used in DRP.
Current evidence does not support a universal hierarchy in which architectural complexity guarantees reliability. U-Net variants have the strongest representation in the deep learning literature, but gains from attention, residual blocks, transformers, and foundation models are usually specific to the dataset and rarely tested across lithologies with a common physical solver. Models with higher capacity are most defensible when spatial context is essential and representative labels, external tests, and property validation are available; otherwise, a reproducible random forest or thresholding workflow may be more appropriate [9,10,62].
7. Segmentation Challenges Specific to CO2 Storage and Multiscale Imaging
7.1. Reservoir Pore, Mineral, and Microporosity Segmentation
Carbonate storage rocks present some of the most difficult segmentation targets because bimodal to trimodal pore size distributions, pervasive subresolution microporosity, and diagenetic mineral heterogeneity undermine simple thresholding. Microporous regions produce intermediate grayscale values that overlap with dense minerals, while resolvable vugs and fractures coexist with subvoxel pores that contribute to capacity, flow, and reactive surface area [99,100]. Imaging at a single resolution can therefore misrepresent both connected storage volume and injectivity. Multiresolution or super-resolved approaches may improve representation, but inferred microporosity must be constrained by independent porosity, permeability, or mineralogical measurements [101,102]. Carbonate thin-section segmentation also encounters strong class imbalance among mineral, pore, fossil, and opaque phases [103].
Clean quartz sandstones are generally more amenable to pore–solid segmentation because histograms that are well separated can support reproducible thresholding. Reservoir sandstones, however, commonly contain cements, clays, and compositional heterogeneity that create intermediate grayscale populations and partial-volume ambiguity. Misclassifying clay-filled microporosity as solid can reduce connected pore volume and close flow paths, biasing permeability and injectivity; falsely assigning cement or grain contacts to pore space can have the opposite effect. Even in lithologies favorable for segmentation, storage characterization should therefore test topology and property sensitivity rather than relying on porosity agreement alone [32,104,105].
Shales and fine-grained caprocks require nano-CT, FIB-SEM, or related methods to resolve nanometer-scale pores and microstructures associated with phases. The segmentation task must distinguish organic matter, clay and other minerals, and nanopore space, often under strongly overlapping grayscale distributions. These labels affect estimates of storage or leakage pathways, diffusion, elastic response, and the continuity of low-permeability sealing fabrics. Learning-based approaches can improve discrimination, but their geological validity must be tested across independent images and against mineralogical or physical measurements [36,106,107].
7.2. Segmentation of CO2 and Brine Fluid Phases
Dynamic multiphase experiments add two challenges to static rock segmentation: low phase contrast and temporal consistency. Water, oil, brine, and CO2 can have overlapping X-ray attenuation, so simple thresholds may fail. Contrast agents such as potassium-iodide-doped brine improve phase separation [108,109,110]. Their effects on image quality and fluid behavior should be checked under the experimental conditions. Time-resolved studies must also distinguish real interface motion from frame-to-frame segmentation variation. Fast synchrotron imaging has shown that Haines jumps and related displacement events can occur on millisecond timescales, requiring rapid acquisition, accurate registration, and stable segmentation across sequential volumes [33,34]. Under in situ pressure and temperature, segmentation must distinguish rock, brine and CO2 while preserving the phase boundaries needed to characterize trapping [111].
CO2–brine segmentation is therefore one of the most demanding digital rock tasks. At representative storage conditions, the grayscale separation between supercritical CO2 and brine may approach the noise level of laboratory micro-CT, making differential imaging, monochromatic synchrotron data, or contextual learning methods preferable to a single global threshold. Accurate phase boundaries are essential because residual saturation, cluster size, connectivity, curvature, and interfacial area all depend on the segmented CO2 geometry. A few interface voxels can merge separate ganglia or remove a snap-off neck, changing the inferred trapping mechanism even when total saturation changes little. Pore-scale studies of residual CO2 and dynamic CO2–brine displacement demonstrate that useful interpretation requires both spatial boundary accuracy and temporal consistency [112,113].
Recent experiments further show why temporal phase connectivity must be distinguished from segmentation accuracy. Chai et al. [12] used differential imaging and watershed segmentation to track CO2 ganglia in reservoir sandstone. After a 58 h static interval, renewed brine flow reduced CO2 saturation from 22.8% to 15.6%. This observation concerns physical remobilization following Ostwald ripening; it does not quantify uncertainty between segmentation algorithms or establish a field-scale containment outcome.
Purswani et al. [13] provide a complementary supercritical CO2–brine benchmark in synthetic sintered glass, with 25 μm raw and segmented volumes, pressure records, and scans at different noise levels. Their threshold-sensitivity checks changed estimated porosity and Euler characteristic, while removal of small apparent CO2 clusters could change the sign of the Euler characteristic. The dataset supports tests of segmentation and topology sensitivity, but its synthetic medium and laboratory scale limit direct transfer to natural reservoirs.
7.3. Reactive Mineral, Fracture, and Caprock Segmentation
Reactive storage requires labels that distinguish minerals, open pores and partially dissolved material [5,114]. In Ketton, limestone exposed to CO2-saturated brine, oil invasion and FIB-SEM revealed a porous mineral skeleton within apparently dissolved regions [17]. In reservoir sandstone, CO2–brine flow increased porosity while measured permeability decreased, alongside connectivity loss and mineral or fines redistribution [18]. Ex situ imaging of field-recovered Wallula basalt extended the evidence to carbon mineralization, but attenuation overlap impeded carbonate quantification in some cores [19]. These studies link phase interpretation to reactive evolution across different experimental settings.
Fracture aperture and connectivity require hydraulic sensitivity checks [62]. Deng et al. [20] used ternary CT segmentation of natural carbonate caprock exposed to CO2-acidified brine. Treating porous degraded zones as open fracture rather than impermeable rock changed calculated transmissivity by approximately 2–4 times. These were bounding single-phase simulations; experimental permeability was unavailable.
7.4. Multiscale Integration, Partial-Volume Effects, and Upscaling
Rock pore systems span nanometer-scale organic and clay-hosted pores, micrometer-scale intergranular pores, and millimeter-scale vugs and fractures; no single imaging method resolves this range over a representative volume. Multiscale DRP, therefore, combines micro-CT, nano-CT, SEM, and FIB-SEM data acquired with different fields of view and contrast mechanisms. The key challenge is reconciliation: a microporous zone that appears as one phase with intermediate gray values in micro-CT must be assigned subresolution structure or effective properties from observations at higher resolution. Multiscale pore networks and hierarchical workflows provide practical routes for this integration [115,116,117,118,119]. Super-resolution and subresolution models can reduce, but not remove, uncertainty in registration, scale transfer, and the effective properties assigned to unresolved domains [120,121].
At the voxel scale, a boundary voxel may contain both pore and solid, producing an intermediate attenuation value that belongs uniquely to neither class. These partial-volume effects dominate boundary uncertainty when feature size approaches image resolution. A conservative threshold tends to classify mixed voxels as solid and underestimate porosity; a liberal threshold can overestimate porosity and create false connections. The bias grows as resolution becomes coarse relative to pore throats, fracture apertures, or fluid interfaces [42]. Studies of low-quality images show that local-threshold and watershed methods can improve pore delineation [122], while structural criteria can guide the selection of denoising filters before segmentation [123]. No deterministic rule can recover information that is absent from the image. Probabilistic labels are therefore more defensible near the resolution limit.
Multiresolution carbonate studies show that no single scale necessarily combines adequate pore detail and a representative volume [124]. Higher-resolution data can constrain microporosity and permeability within larger micro-CT volumes [35]. Saxena et al. [125] estimated three-dimensional permeability from two-dimensional thin sections using calibrated transforms without reconstructing the pore space; sandstones performed more favorably, while carbonates required additional calibration. In CT-derived sandstone models, Xie et al. [21] found stronger resolution sensitivity in brine relative permeability than in CO2 relative permeability, illustrating phase-dependent numerical effects.
Jeon et al. [14] combined multiscale CT characterization of natural conglomerate cores with pore-scale Stokes-flow calculations and core-scale CO2–water modeling. Their multiphase simulations used representative two-dimensional sections extracted from three-dimensional CT volumes and examined how clast permeability and spatial arrangement influence exsolution and residual trapping. This links image-derived rock properties to CO2-flow interpretation but does not establish the effect of competing segmentation algorithms or validate full-volume three-dimensional multiphase predictions.
8. Segmentation Uncertainty and Consequences for Geological CO2 Storage
8.1. Sources of Segmentation Uncertainty
Segmentation uncertainty has three interacting sources. Imaging uncertainty arises from noise, reconstruction artifacts, partial-volume effects, and unresolved structures; preprocessing cannot uniquely recover boundaries absent from the acquisition [6]. Operator and methodological uncertainty arises from filtering, algorithm selection, parameter tuning, and annotation. Baveye et al. [126] showed that trained operators analyzing identical images produced different pore-structure characterizations. Algorithmic uncertainty includes variability from initialization, stochastic training, augmentation, and sensitivity to geological or acquisition domain shifts. Krygier et al. [127] demonstrated that segmentation variability propagates into uncertainty in simulated macroscopic properties.
These sources interact: noisy images permit more operator interpretations, and models inherit ambiguity in their training labels. Their effects may reinforce or offset one another through geometry and physics, so combined uncertainty requires explicit evaluation [6,126,127]. Table 6 summarizes the sources and mitigation.
Table 6.
Sources, character, and mitigation of segmentation uncertainty.
8.2. Propagation into Storage Capacity, Injection Pressure, Migration, Trapping, and Containment
Storage capacity is affected first through the volume and accessibility of segmented pore space. Mislabeling microporosity or connecting isolated pores can bias the pore-volume contribution to a capacity calculation even when bulk porosity agrees with a measurement. Translation to deployable storage additionally requires formation volume, CO2 density, fluid displacement, pressure communication and operational limits. A segmentation-induced porosity change, therefore, does not imply the same percentage change in formation-scale capacity; unresolved pore regions require multiscale treatment [118,121].
Injectivity depends on directional permeability and the connectivity of pores and fractures. False throat closure can reduce simulated flow, while a false bridge can create a nonphysical pathway [8,110]. For a fixed flow rate in a single-phase Darcy calculation with other inputs unchanged, overestimated permeability underestimates the required pressure drop [128]. Actual CO2 injection pressure additionally depends on relative permeability, fluid properties, formation boundaries and the injection schedule. Pressure or rate limits must therefore be tested in the relevant reservoir model rather than inferred from image overlap.
Migration and residual trapping depend on phase mobility and capillary connectivity as well as pore volume. Errors that merge CO2 ganglia, remove a snap-off neck or change entry-throat geometry alter the inputs used to predict displacement and immobilization [112,129,130]. Their effect on plume migration must be evaluated after spatial upscaling of permeability, capillary-pressure and relative-permeability relationships. Jeon et al. [14] demonstrate heterogeneity-dependent pressure and trapping behavior in core-scale models; those results do not quantify a segmentation-induced change in a field-scale plume.
Reactive and geomechanical predictions depend on mineral boundaries, load-bearing contacts and fracture geometry [5,131,132]. An uncertain connected fracture warrants hydraulic sensitivity analysis, but its appearance in a segmented subvolume does not establish leakage. A containment assessment must additionally establish the pathway’s continuity beyond the image, its capillary entry behavior, the pressure driving flow and its mechanical response. The relevant validation targets include mineral-volume or porosity–permeability evolution, stiffness, and measured flow, through the tested fracture, with project-level leakage remaining a conditional assessment.
To isolate the segmentation contribution, propagate each plausible geometry through the same physical solver and retain its joint property outputs, rather than combining independently sampled marginal property ranges. Then repeat the upscaling and project calculation for each realization, separately accounting for geological, fluid, solver and operational uncertainties. Report the resulting spread in accessible storage, injection pressure, migration extent or arrival time, and any specified containment threshold. Connectivity changes can generate discontinuities and asymmetric outcomes [127]; scale averaging may attenuate some local errors while connected bottlenecks preserve others [118]. This is a proposed assessment workflow, not field validation conducted here.
Property uncertainty can be strongly non-normal [127]. Study-specific distributions and the geometry changes governing their tails, therefore, matter more than a universal percentage range. Figure 5 traces uncertainty propagation from imaging to engineering decisions.
Figure 5.
Conceptual propagation of imaging, processing, and model uncertainty into geometry, pore-scale properties, and conditional engineering consequences [6,7,8,110,126,127,133]. Propagated uncertainty may increase or decrease depending on geometry and governing physics. Field decisions additionally require geological upscaling and project-specific inputs. Histograms, uncertainty maps, and property curves are schematic; the relative-permeability panel illustrates water/oil relationships as functions of water saturation. Multicolored segmentations distinguish example phases. Purple-to-yellow shading denotes low-to-high illustrative voxel uncertainty (0–1); orange and purple curves illustrate geometry and property distributions, respectively. In the relative-permeability plot, red denotes oil (k_ro) and blue denotes water (k_rw).
8.3. Sensitivity Analysis and Uncertainty Quantification
Uncertainty quantification treats a segmentation as one plausible interpretation of an image. Vary declared thresholds, preprocessing choices, model parameters or training configurations, then evaluate each realization with a common physical solver [127]. Ensemble spread is conditional on the perturbations, sampling and model; confidence or credible intervals additionally require a justified statistical interpretation. Bayesian approaches can condition on image and physical constraints, while observations used for calibration must remain separate from independent validation.
Sensitivity analysis varies processing choices while retaining a common physical solver. Leu et al. [110] showed that threshold and seed changes alter Berea pore-throat connectivity and permeability. Purswani et al. [58] found property-dependent differences among thresholding, Fast Random Forest and clustering in air–brine glass frit. Aljaberi et al. [22] demonstrated that segmentation and interface treatment influence contact-angle distributions in oil/brine and hydrogen/brine rock images. Gray et al. [23] showed that carbonate segmentation can create artificial stagnant regions in single-phase transport simulations. Together, these findings support property-specific checks beyond bulk phase fractions.
8.4. Independent Physical Validation, Benchmarking, and Auditability
Voxel-level ground truth is rarely available for natural rock images. Bulk measurements such as helium porosity or capillary pressure measured by mercury injection can test overall properties but cannot show whether individual voxels are correct; a mask can match bulk porosity while containing spatially compensating errors that distort transport. Synthetic images provide prescribed reference geometry and controlled noise for voxel-level benchmarking [59,134]; reference masks may themselves originate from operator-trained segmentation [59]. Their limitation is realism: synthetic textures and artifacts do not fully reproduce natural mineral heterogeneity. Community benchmarks such as those by Andrä et al. [7,8], therefore, remain valuable but still rely partly on agreement among methods and property consistency rather than absolute ground truth.
Physical validation should combine complementary measurements. Leu et al. [110] compared image-derived porosity, permeability and capillary pressure with laboratory measurements on larger Berea sandstone plugs of the same material. A segmentation could agree with permeability while overpredicting capillary pressure; unresolved microporosity also prevented direct agreement with bulk porosity. Their decane–brine study supports joint validation, not direct CO2–brine validation. Calibration must be distinguished from testing: a porosity value used to select a threshold cannot independently validate that threshold. Ruspini et al. [118] illustrate this distinction by anchoring multiscale models to capillary-pressure measurements and testing predicted waterflood relative permeability against withheld experimental data. Chai et al. [24] combined reservoir-sandstone CO2 core flooding, micro-CT and pore-network modeling; comparison across plug sizes and explicit unresolved porosity constrained interpretation, while matching model parameters remained calibration.
Accordingly, studies should document the imaged volume’s location within the tested specimen, quantify variation among subvolumes, and separate resolved, connected and laboratory-accessible porosity. Permeability comparisons should match flow direction and effective stress, report the test fluid and pressure regime, and distinguish single-phase from relative permeability. Capillary-pressure comparisons should match the saturation path, wettability, interfacial tension, temperature and fluid composition. Mercury-intrusion data require stated fluid-property scaling and correction assumptions; they are not direct CO2–brine measurements [110,118]. Freeze segmentation and solver choices before evaluating held-out measurements or samples, report measurement uncertainty alongside prediction error, and investigate disagreement across properties rather than retuning to every observed value. These are recommended validation steps; no new laboratory validation is performed in this review.
An auditable workflow should link every reported property to a persistent sample identifier and a versioned processing record. Archive raw or losslessly reconstructed images, voxel size, orientation and regions of interest; preprocessing parameters; label definitions and annotator decisions; sample-level training, tuning and test partitions; code, software versions, weights and random seeds; and postprocessing and physical-solver settings [7,8,126,127,134]. Record each manual override with its location, author, reason and before/after labels. Link each segmentation realization to its simulated outputs and independent measurements. Where data cannot be shared, state the access restriction and provide sufficient metadata and scripts to identify what can be reproduced.
Uncertainty reporting should separate image/segmentation variability, physical measurement uncertainty, solver/model discrepancy and uncertainty from sampling and upscaling. State the ensemble size, sampling rule, dependence assumptions, weighting, convergence checks and failed runs. Report signed bias, distributions or stated quantiles, and connectivity changes alongside overlap scores [127,133]. Quantiles from selected plausible masks describe conditional sensitivity; they do not establish calibrated confidence intervals or field-event probabilities. Probability claims require a justified probabilistic model and validation on held-out observations. Report calibration checks at the voxel and property levels separately, because reliable voxel probabilities need not imply reliable property intervals.
8.5. Reliability, Explainability, and Quality Control Based on Physical Properties
8.5.1. Segmentation with Uncertainty Quantification
A deterministic phase map suppresses the ambiguity that is most important near partial-volume boundaries, low-contrast minerals, microporosity, and imaging artifacts. Monte Carlo dropout, ensembles, Bayesian neural networks, and partially Bayesian architectures can instead generate per-voxel confidence or predictive entropy maps. These maps separate regions that are consistently classified from regions where alternative plausible labels should be propagated into physical calculations [135,136,137,138,139,140,141].
For segmentation with C classes, a convenient per-voxel uncertainty measure is predictive entropy:
where H(x) is the predictive entropy at voxel x, representing the uncertainty associated with its class assignment; x denotes the voxel being evaluated; C is the total number of segmentation classes; pc(x) is the predicted probability that voxel x belongs to class c; and ln denotes the natural logarithm, so H(x) is expressed in nats. For C ≥ 2, H(x)/ln(C) is a dimensionless normalized entropy in the interval [0, 1]. Higher values of H(x) indicate greater classification uncertainty, whereas lower values indicate greater model confidence. High entropy identifies ambiguous labels, but entropy must be calibrated against observed errors; an overconfident out-of-distribution network may assign low entropy to an incorrect phase.
The distinction between epistemic and aleatoric uncertainty is operationally useful. Epistemic uncertainty reflects limited model knowledge and may be reduced through broader training data, domain adaptation, or ensemble learning; aleatoric uncertainty reflects ambiguity already present in the image and may require improved acquisition, multimodal imaging, or probabilistic phase assignment. Reporting only a single uncertainty score obscures these different mitigation pathways. Prabhudesai et al. [141] demonstrate that partial Bayesian architectures, making only a strategically selected layer stochastic, achieve meaningful uncertainty estimates at a fraction of the computational cost of fully Bayesian networks, a practically important result for volumetric DRP workflows at large scale.
8.5.2. Explainability and Human Review
Explainable artificial intelligence (XAI) identifies image features influencing a classification. In DRP, it should distinguish responses to pore, grain, mineral, and interface features from responses to ring artifacts, beam hardening, volume edges, and scanner noise.
Zhao et al. [89] used gradient-weighted class activation mapping (Grad-CAM) for ResUNet-CBAM thin-section segmentation. Inspected source excerpts describe feature and occlusion analysis of DINOv2 rock-CT representations [93]. Wang et al. [94] used learned activation and texture maps to generate SAM prompts for paired polarized-light grain images. These tools support inspection and segmentation but do not independently validate topology or petrophysical predictions.
Relevant XAI methods can be grouped into gradient-based attribution, perturbation and occlusion analysis, feature inspection, and counterfactual explanation. Their geological usefulness depends on whether they remain stable across model runs and whether the highlighted regions correspond to independently defensible petrographic features. Methods transferred from medical imaging should therefore be evaluated under constraints specific to rock images rather than assumed to be valid because they perform well in another imaging domain [142,143,144,145,146,147].
The principal unresolved gap is quantitative, 3D validation that accounts for property effects. Attribution maps should be tested across seeds, scanners, lithologies, and resolutions; compared with phase boundaries, registered images with higher resolution, or expert petrography; screened for sensitivity to acquisition artifacts; and linked to changes in porosity, connectivity, permeability, capillary response, or elastic properties. SHapley Additive exPlanations (SHAP), counterfactual explanation, and volumetric attribution remain sparsely explored in DRP segmentation, and no consensus benchmark yet defines a physically meaningful explanation.
8.5.3. Prioritization and Propagation Based on Property Sensitivity
An uncertain label at a spanning throat, CO2 snap-off neck, reactive boundary, or caprock fracture may matter more than one in a dead-end pore. Quality control should combine classification uncertainty with sensitivity of the target property. Section 10 proposes a property impact index for testing this approach.
Ensemble propagation should retain asymmetric or non-normal property distributions that extreme-mask comparisons may miss [127] and compare predicted properties with independent measurements.
For an ensemble of N plausible segmentations S(n), uncertainty is propagated by evaluating the same physical operator F for every realization:
The resulting set of X(n) values, rather than a single preferred mask, defines the empirical distribution used to report means, quantiles, threshold exceedance probabilities, and non-normal tails. This formulation is a propagation framework; its credibility depends on how the ensemble of plausible segmentations is generated and calibrated.
8.5.4. Remaining Reliability Gaps
Remaining gaps concern validated volumetric attribution, geological domain transfer, and links between model confidence and independent physical measurements. The benchmark priorities in Section 10.3 address these requirements.
9. Evidence Synthesis and Decision Framework for Geological CO2 Storage
9.1. Evidence from Individual Studies and Limits of Comparison
Comparative studies [46,58,59,62] show that method preference changes with image characteristics and evaluation target. Shared images, reference labels and downstream analysis provide the strongest basis for comparison.
9.1.1. Conditions for Valid Comparison Across Studies
A defensible comparison begins by defining the independent experimental unit. Pixels and adjacent slices from one volume are correlated; random slice-level splits can place nearly identical textures in training and test sets. Claims of geological transfer should therefore be split by core, sample, well, lithology, or acquisition campaign and, where possible, use a fully held-out external dataset. The source of the reference labels, whether a single operator, a consensus panel, a registered image with higher resolution, synthetic geometry, or an indirect property constraint, must also be reported because each source imposes a different uncertainty ceiling.
Task complexity must also be aligned. Binary pore–solid segmentation of a clean sandstone is not comparable with low-contrast multiclass segmentation of pore, carbonate, quartz, clay, pyrite, and organic matter. Class prevalence, voxel size, field of view, signal-to-noise ratio, partial-volume fraction, preprocessing, dimensionality, and compute budget all affect attainable performance. A method should be called superior only within a controlled comparison using common images, labels, splits, and tuning resources; otherwise, conclusions should be conditional.
Where common data are available, report paired sample-level changes in class-wise Dice or IoU, boundary distance, porosity error, and the logarithmic ratio of predicted permeability to an experimental or high-fidelity reference. Confidence intervals or bootstrap distributions should be based on independent samples, not millions of correlated voxels. Meta-analysis is appropriate only when tasks and validation protocols are sufficiently aligned.
Strong baselines are essential: at least one reproducible threshold, one conventional supervised classifier when labels are available, and one encoder–decoder model trained under the same augmentation and tuning budget. Report variability among operators, failed transfer cases, prompt sensitivity, calibration error, inference time, memory demand, and postprocessing. This turns performance reporting into an auditable test of when a method improves geological and petrophysical reliability.
Reporting normalized by resource use should include annotation hours, prompt interactions, training and inference time, peak memory, energy use or hardware class where feasible, and manual correction time. Throughput should be stated per independent volume and include preprocessing, stitching, uncertainty estimation, and property validation. These quantities allow Pareto comparisons among reliability, human effort, computation, and turnaround time.
Table 7 draws on Supplementary Material S1; Supplementary Material S2 documents the Scopus screening. The 154 sources comprise 16 Tier A, 92 Tier B, 24 Tier C and 22 contextual entries. Six cited reports document pore-scale imaging of free-phase CO2–brine distributions in natural rocks under reported storage-relevant pressure and temperature [12,18,24,25,111,112], including five sandstone and carbonate types in Andrew et al. [25]. These reports need not represent independent experiments. Other Tier A evidence includes reactive CO2-rich brine [17,20], field-recovered basalt imaged ex situ [19], CO2-phase images without verified acquisition pressure and temperature [16,79], engineered media [13,113], medical CT [108] and modeling [14,21]. The synthesis supports task-specific interpretation rather than general rankings.
Table 7.
Selected evidence by relevance tier (A: direct CO2 process; B: analogous rock/porous-material evidence; C: transferable method) and access basis (FT: full text; AB: abstract; MX: partial text; MD: metadata).
9.1.2. Quantitative Signals from Controlled Studies
Wang and Zai [148] used 500 training and 100 test slices from one sandstone core, with reference labels generated by manual thresholding in ImageJ (version not reported in [148]). They reported binary pixel accuracy of 99.87% (0.9987) and binary IoU of 0.9986. Three-class accuracy was 96.77%, with mean IoU approximately 0.73 and pore, matrix and mineral IoUs of 0.63, 0.96 and 0.58, respectively. High global accuracy thus coexisted with weaker minority-class overlap. The class assignment and aggregation underlying the binary IoU were insufficiently specified for further comparison. Their flow predictor reduced computation time from 210.94 to 2.97 s per image relative to the lattice–Boltzmann simulation, a reported 98.59% reduction. Chung et al. [149] reported a 13.8% mean permeability error against their original finite-volume solver, with approximately tenfold faster inscribed-radius-map estimation than iterative scanning. These numerical comparisons apply to their respective datasets and pipelines.
Krygier et al. [127] demonstrated non-normal property distributions for which simple bounding can fail. Zhao et al. [133] quantified permeability uncertainty in stochastic pore reconstructions constrained by porosity and two-point spatial correlation. For CO2-reacted Ketton limestone, Singh et al. [17] obtained calculated absolute permeabilities of 6.0 × 10⁻¹¹ to 1.10 × 10⁻¹⁰ m2 across three assignments of partially dissolved regions. This is segmentation sensitivity, not measured permeability validation. Table 8 traces these property-level effects.
Table 8.
Evidence trace for property-level effects. Access codes follow Table 7.
9.2. Conditional Method Selection for Tasks in CO2 Storage
Method selection should begin with the storage decision and the feature controlling it, not with architectural novelty. A reproducible threshold may be adequate for clean sandstone pore–solid segmentation, whereas heterogeneous carbonates, reactive mineral maps, thin fractures, or dynamic CO2–brine images usually require contextual machine learning or deep learning methods. In every case, the selected method must be tested against the property and decision it is intended to support.
Table 9 is a conditional guide rather than a universal ranking. The starting method reflects the reviewed evidence; the alternative requiring fewer resources identifies a defensible fallback. Final selection should account for phase complexity, label availability, imaging quality, computational budget, acceptable property uncertainty, and the consequence of a false storage interpretation.
Table 9.
Conditional guide to method selection for digital rock applications in geological CO2 storage.
9.3. Metrics for Decision and Economic Consequences in Storage
The following project-level consequences are conceptual pathways from image-derived properties to decisions, not validated outcomes of this review. A segmentation may contribute to decisions when its outputs are combined with geological upscaling and project-specific evidence to rank storage intervals, estimate capacity or injectivity, select a model of relative permeability or capillary pressure, define a limit on the injection rate, interpret residual trapping, evaluate a fracture pathway, or assess caprock integrity. The relevant metric is therefore not only property error but also the probability that the error changes the selected storage action. A generic expected-loss formulation is presented as a research direction in Section 10, because project-specific probabilities and consequences have not been calibrated here.
Practical storage metrics include the probability that connected porosity, permeability, fracture aperture, residual saturation, reactive surface area, or elastic response crosses a design threshold; rates of false acceptance and false rejection for candidate samples or intervals; expected regret relative to the decision under the unknown true geometry; and value of information from additional scanning, labeling, core analysis, or flow testing. Additional characterization is justified when its expected reduction in decision loss exceeds its cost.
9.4. Implications for Carbon Neutrality Deployment
Segmentation reliability can affect pore-scale inputs used to distinguish theoretical pore volume from technically deployable storage. Quantifying that effect at formation scale requires representative sampling, geological upscaling, fluid and geomechanical models, and operational constraints beyond the segmented subvolume. Total porosity alone does not establish accessible capacity: connectivity, pressure communication, microporosity, capillary behavior, and fracture networks determine how much of the imaged pore space can be used safely. Uncertainty in these features should therefore accompany capacity statements and site rankings rather than being collapsed into a single deterministic estimate.
The following cost and deployment effects are plausible consequences rather than project outcomes demonstrated in the reviewed pore-scale evidence. A false low-permeability interpretation can lead to an unnecessary well count or rejection of a viable interval, whereas a false high-permeability interpretation can underestimate pressure buildup and monitoring needs. Repeated rescanning, manual correction, model reruns, and late redesign are also costs of poorly documented segmentation. Evaluation normalized by resource use should report annotation time, computation, expert correction, and the value of additional physical measurements alongside accuracy.
Auditable segmentation can provide more transparent technical evidence for regulatory review and public communication; an increase in regulatory or public confidence is not measured by this review. Reproducible preprocessing, sample-level validation, uncertainty envelopes, independent property measurements, and documented human overrides provide a traceable chain from image acquisition to storage decision. This does not eliminate geological uncertainty, but it makes the contribution of image interpretation visible and testable. For external review, a concise uncertainty statement should identify the evidence supporting each prediction, the unresolved assumptions, and whether a decision remains stable across the tested scenarios, with links to the technical record in Section 8.4. Traceability can make an assessment easier to scrutinize; it does not itself demonstrate regulatory compliance, containment safety, or public acceptance.
Digital rock segmentation does not directly remove CO2. Its contribution to carbon neutrality lies in reducing uncertainty in the characterization, design, and risk assessment of geological storage resources required for decarbonization at large scale. Table 10 lists representative failure modes and their consequences.
Table 10.
Examples of segmentation failure modes and their consequences for decisions about geological CO2 storage.
10. Emerging Trends and Future Directions for DRP in Storage Applications
Proposed property impact and decision loss measures:
The following constructs are proposed research directions, not validated components of the review’s evaluation framework. The property impact index should be tested on a public benchmark such as Berg et al. [134] or Andrä et al. [7,8] by comparing voxel rankings with entropy alone and measuring the property-error reduction achieved under the same review budget. No dataset-based ranking or expected-loss calibration is performed in this review.
For this review, we propose a transition-specific property impact index using a finite change in a categorical phase label. For a baseline segmentation S in which voxel x has label a, let S(x:a→b) be identical except that x is assigned an admissible alternative label b:
Here F is the same physical operator applied to both segmentations, X = F(S), and Xscale > 0 is a fixed reference scale for the property. Use an independent positive benchmark, or a stated nonzero baseline magnitude, and keep that scale unchanged across all compared voxels and transitions. The factor H(x)/ln(C) normalizes predictive entropy; the second factor measures the absolute property change relative to Xscale. The index is dimensionless but is not a probability of failure. For binary segmentation there is one alternative label. For multiclass segmentation, evaluate admissible a→b transitions separately and state the classes considered; numerical class identifiers are not continuous physical variables.
For each perturbation, use the same voxel size, phase properties, boundary conditions, connectivity convention, and solver tolerances. Recompute the property on the changed geometry so that throat closure, reconnection, or loss of percolation can produce a finite jump. Record infeasible or nonconvergent simulations rather than assigning a silent zero. If correlated boundary errors or multi-voxel bridges matter, replace the single-voxel change by a declared region perturbation and report its size and sampling rule. Single-voxel scores do not capture all interactions. This proposed index requires empirical testing against entropy-only prioritization before operational use.
Illustrative application of the property impact index (hypothetical):
Consider two hypothetical masks that both achieve Dice = 0.96. A single ambiguous voxel at a critical throat has predictive entropy H = 0.65 nats in a binary task (C = 2). Assigning it to pore space gives permeability of 120 mD; changing its label to solid gives 35 mD. With the fixed scale Xscale = 120 mD, the normalized property change is |120 − 35|/120 = 0.7083, and normalized entropy is 0.65/ln(2) = 0.9378. Equation (6) therefore gives I = 0.9378 × 0.7083 ≈ 0.66. A hypothetical 80 mD sample-screening threshold is crossed. These assumed numbers demonstrate the calculation only; they are not measurements, a validation of the ranking, or evidence of a real storage-site acceptance decision.
For future decision analysis, a generic expected-loss formulation can combine independently estimated failure probabilities and consequences:
where R(d) is the expected risk or expected loss associated with decision d, obtained by summing the consequences after weighting each by its probability. Fj denotes failure mode j, P(Fj | d, D) is its probability given decision d and available evidence D, and Cj is the associated consequence. Consequences may include additional imaging or core analysis, unnecessary computation, lost production, underused storage capacity, excessive injection pressure, completion redesign, monitoring burden, regulatory delay, or containment and safety exposure. Equation (7) is a generic expected-loss expression, not a new validated economic model. No project-specific calibration or validation is performed here. Failure probabilities and consequences require independent reservoir, operational, monitoring, and cost information; they cannot be inferred from an overlap score or voxel entropy alone.
10.1. Approaches Guided by Physics and Property Effects
10.1.1. Physics as a Constraint and Validation Layer
Physics can enter a workflow through governing-equation constraints, analytical upscaling or simulation-based training. A porous-flow physics-informed neural-network application is identified by bibliographic metadata [150]; its implementation was not verified. Examples include analytical upscaling [151], Stokes-trained CNNs with graph maximum-flow inputs [152], and learned pore-radius maps supplying conductivity to a conventional solver [149]. A generic composite objective is:
where Ldata measures agreement with labeled or observed data, Lphys penalizes violation of a governing equation or physical constraint, LBC enforces boundary conditions, and the lambda terms control their relative influence. Physics directly informs segmentation only when these terms influence the predicted phase labels. When they act solely after segmentation, they provide validation based on property effects or surrogate training rather than a segmentation algorithm.
For resolved, incompressible creeping flow within a segmented pore space, a property-sensitive validation may solve the stationary Stokes equations [128]:
where u is velocity, p is pressure, and μ is dynamic viscosity. For a specimen of length L and cross-sectional area A subjected to a pressure difference Δp, the absolute permeability inferred from flow rate Q is:
Equations (9)–(11) make segmentation physically testable: two masks with similar Dice scores can produce different K values because one preserves a connected throat and the other closes it. For rocks containing unresolved microporous regions, a binary pore–solid geometry may be replaced or supplemented by a Stokes-Brinkman representation:
where Km is the effective permeability assigned to the microporous phase and μeff is an effective viscosity. Equation (12) provides a continuum bridge between resolved open pores and Darcy like flow through unresolved material [35]. Graph connectivity and maximum flow features offer complementary tests of bottlenecks that porosity alone cannot detect [152].
10.1.2. Integrated Models from Segmentation to Property Prediction
Integrated pipelines couple segmentation with property prediction to reduce computational cost or optimize the complete workflow. Examples include U-Net segmentation followed by learned flow field or permeability surrogates and conductivity derived from CNN-predicted pore-radius maps for finite-volume simulation [148,149]. Such systems can be efficient, but they also create compound uncertainty: an apparently accurate property prediction may conceal compensating errors in segmentation and the surrogate model. Evaluation should therefore report segmentation, property, and out-of-distribution performance separately.
10.1.3. Limits and Research Need
Current demonstrations are concentrated in sandstones and relatively small subvolumes. Sharp multiphase interfaces, moving contact lines, full representative elementary volumes, and complex carbonate microporosity remain difficult. Physics constraints do not recover information absent from the image, and they can introduce their own model-form assumptions. The most promising direction is therefore not to replace image evidence with governing equations, but to combine probabilistic segmentation, property-sensitive simulation, and independent experiments so that each source of information constrains the others.
10.2. Foundation Models, Explainability, and Processing in Real Time
Foundation-model research should test whether the feature initialization and mask proposals demonstrated in geological studies [93,94] reduce annotation effort while preserving property-relevant structures.
Evaluation should separate zero-shot, prompted, few-shot, and fine-tuned modes; repeat prompts and users; compare with threshold, random forest, and U-Net baselines on identical images; test independent lithologies, resolutions, and scanners; report boundary, topology, calibration, and resource metrics; and propagate masks into physical properties. Use in real time should remain human-in-the-loop, with mass balance and property checks able to reject fast but unreliable outputs.
10.3. Open Datasets, CO2 Storage Benchmarks, and Research Priorities
Reproducibility is limited by proprietary images, missing labels or code, incomplete preprocessing records, slice-level data leakage, and physical measurements disconnected from published volumes. Public resources also vary in lithology, pressure–temperature conditions, fluid phases, and measured storage properties. Table 11 lists resources relevant to reproducing the acquisition-to-property workflow.
Table 11.
Open and partly open resources relevant to CO2 storage and DRP segmentation benchmarking.
A community benchmark focused on storage should combine real and synthetic data; include sandstones, carbonates, shales, caprocks, and fractured rocks; span laboratory micro-CT, synchrotron, SEM, FIB-SEM, and multiple resolutions; provide repeated expert labels or probabilistic reference maps; and link images to measured porosity, permeability, capillary pressure, residual saturation, mineralogy, or mechanical properties. Dynamic subsets should include registered dry volumes, volumes saturated with brine, and volumes containing CO2 under documented pressure and temperature conditions. Training, validation, and hidden test partitions should be defined at the sample level.
Four priorities follow: provide segmentation uncertainty; benchmark topology, calibration, generalization, resource demand and property effects alongside overlap metrics; archive the processing and validation records specified in Section 8.4; and evaluate decision thresholds and the value of additional information using calibrated models. Figure 6 illustrates this proposed ecosystem.
Figure 6.
Proposed workflow linking multiscale acquisition, probabilistic segmentation, ensemble simulation, independent validation, upscaling and conditional storage decisions [7,8,12,13,14,35,118,124,127]. Images, plots and digital-twin elements illustrate a research framework whose autonomous operation and field performance remain unvalidated. RMSE: root-mean-square error; MAE: mean absolute error; CRPS: continuous ranked probability score. Table 2 distinguishes voxel size from effective spatial resolution. Multicolored segmentations distinguish example phases, and blue-to-red shading denotes increasing illustrative voxel uncertainty. Solid arrows indicate workflow progression; dashed arrows link the enabling foundations to the stages they support.
11. Conclusions
Segmentation for geological CO2 storage has no universally optimal algorithm. Method performance is conditional on lithology, image quality, phase contrast, task complexity, label availability, computational resources, and the storage quantity being predicted. Classical methods remain defensible for binary pore–solid systems with well-resolved phases; conventional machine learning is valuable when limited representative annotations and interpretable features are available; and deep learning methods are most useful where heterogeneous texture, thin structures, or temporal context defeats rules based only on intensity. Greater architectural complexity is not itself evidence of greater storage reliability.
The central conclusion is that image accuracy and storage reliability are not equivalent. High overlap scores can coexist with incorrect pore connectivity, merged CO2 ganglia, omitted microporosity, biased mineral maps, or false fracture continuity. These local errors can propagate nonlinearly into capacity, injectivity, pressure buildup, residual trapping, reactive evolution, mechanical response, and containment. The meaningful result is therefore a distribution of plausible storage properties and decision outcomes, not a single preferred mask.
A credible DRP focused on storage requires a validation chain with seven dimensions: accuracy at the voxel and class levels, boundary fidelity, topology, morphology, calibrated uncertainty, sensitivity of physical properties, and engineering decision consequence. Segmentation uncertainty should be localized, sampled to generate plausible geometries, propagated through a common physical model, and compared with independent measurements. Physics and tests based on graph connectivity should constrain consequences rather than substitute for image information that is absent.
For carbon neutrality, segmentation can improve the traceability of pore-scale inputs to site screening, injection design, trapping and containment assessment. Demonstrating reductions in false site decisions, well count, monitoring burden or containment risk additionally requires validated upscaling and project-specific evidence.
Supplementary Materials
The following supporting information can be downloaded at: https://www.mdpi.com/article/10.3390/acn1020006/s1. Supplementary Material S1: Evidence Inventory. Table S1. Evidence inventory (132 cited sources). Table S2. Contextual sources and their contribution to the review (22 cited sources). Supplementary Material S2: Scopus search and screening for this review. The workbook includes the search summary, screening decisions and original Scopus records. References cited in the supplementary files are included in the main reference list [1,2,3,4,5,6,7,8,9,10,11,12,13,14,15,16,17,18,19,20,21,22,23,24,25,26,27,28,29,30,31,32,33,34,35,36,37,38,39,40,41,42,43,44,45,46,47,48,49,50,51,52,53,54,55,56,57,58,59,60,61,62,63,64,65,66,67,68,69,70,71,72,73,74,75,76,77,78,79,80,81,82,83,84,85,86,87,88,89,90,91,92,93,94,95,96,97,98,99,100,101,102,103,104,105,106,107,108,109,110,111,112,113,114,115,116,117,118,119,120,121,122,123,124,125,126,127,128,129,130,131,132,133,134,135,136,137,138,139,140,141,142,143,144,145,146,147,148,149,150,151,152,153,154].
Author Contributions
Conceptualization, W.A.M.; investigation, C.R.O.; writing, original draft preparation, W.A.M. and C.R.O.; writing, review and editing, W.A.M., C.R.O., G.A., K.O.D., E.A.A., S.A. and J.M.A.; supervision, W.A. and H.R. All authors have read and agreed to the published version of the manuscript.
Funding
This research was funded by the U.S. Department of Energy, Office of Fossil Energy and Carbon Management, grant number DE-FE0032363.
Institutional Review Board Statement
Not applicable.
Informed Consent Statement
Not applicable.
Data Availability Statement
This review generated no new rock-imaging datasets, physical flow simulations, or trained segmentation models. The figures are conceptual illustrations. Published datasets are accessible through their cited records, including the Digital Porous Media Portal [153] and the phase-trapping dataset of Purswani et al. [13] (https://doi.org/10.26208/S97R-HZ89). The hypothetical calculation accompanying Equation (6) is reproducible from the stated assumptions and arithmetic. The evidence inventory and Scopus screening record are provided in Supplementary Materials S1 and S2.
Acknowledgments
The authors thank the New Mexico Institute of Mining and Technology (New Mexico Tech) for institutional support. The authors acknowledge the use of OpenAI’s image-generation and editing tool in ChatGPT (OpenAI; image-generation tool; exact model version unavailable; https://chatgpt.com/ (accessed on 30 July 2026)) to assist with the generation, refinement, and visual enhancement of figures in this manuscript. AI assistance was also used for literature screening and evidence extraction, as described in Section 2.1. The authors have reviewed and edited the output and take full responsibility for the content of this publication.
Conflicts of Interest
The authors declare no conflicts of interest. The funders had no role in the design of the review; in the collection, analysis, or interpretation of the literature; in the writing of the manuscript; or in the decision to publish the results.
References
- International Energy Agency (IEA). Net Zero Roadmap: A Global Pathway to Keep the 1.5 °C Goal in Reach—2023 Update; IEA: Paris, France, 2023; Available online: https://www.iea.org/reports/net-zero-roadmap-a-global-pathway-to-keep-the-15-c-goal-in-reach (accessed on 16 August 2026).
- Intergovernmental Panel on Climate Change (IPCC). Climate Change 2022: Mitigation of Climate Change. Contribution of Working Group III to the Sixth Assessment Report of the Intergovernmental Panel on Climate Change; Shukla, P.R., Skea, J., Slade, R., Al Khourdajie, A., van Diemen, R., McCollum, D., Pathak, M., Some, S., Vyas, P., Fradera, R., et al., Eds.; Cambridge University Press: Cambridge, UK, 2022. [Google Scholar] [CrossRef] [Scilit]
- Wildenschild, D.; Sheppard, A.P. X-ray imaging and analysis techniques for quantifying pore-scale structure and processes in subsurface porous medium systems. Adv. Water Resour. 2013, 51, 217–246. [Google Scholar] [CrossRef] [Scilit]
- Blunt, M.J.; Bijeljic, B.; Dong, H.; Gharbi, O.; Iglauer, S.; Mostaghimi, P.; Paluszny, A.; Pentland, C.H. Pore-scale imaging and modelling. Adv. Water Resour. 2013, 51, 197–216. [Google Scholar] [CrossRef] [Scilit]
- Sadeghnejad, S.; Enzmann, F.; Kersten, M. Digital rock physics, chemistry, and biology: Challenges and prospects of pore-scale modelling approach. Appl. Geochem. 2021, 131, 105028. [Google Scholar] [CrossRef] [Scilit]
- Iassonov, P.; Gebrenegus, T.; Tuller, M. Segmentation of X-ray computed tomography images of porous materials: A crucial step for characterization and quantitative analysis of pore structures. Water Resour. Res. 2009, 45, W09415. [Google Scholar] [CrossRef] [Scilit]
- Andrä, H.; Combaret, N.; Dvorkin, J.; Glatt, E.; Han, J.; Kabel, M.; Keehm, Y.; Krzikalla, F.; Lee, M.; Madonna, C.; et al. Digital rock physics benchmarks—Part I: Imaging and segmentation. Comput. Geosci. 2013, 50, 25–32. [Google Scholar] [CrossRef] [Scilit]
- Andrä, H.; Combaret, N.; Dvorkin, J.; Glatt, E.; Han, J.; Kabel, M.; Keehm, Y.; Krzikalla, F.; Lee, M.; Madonna, C.; et al. Digital rock physics benchmarks—Part II: Computing effective properties. Comput. Geosci. 2013, 50, 33–43. [Google Scholar] [CrossRef] [Scilit]
- Li, X.; Li, B.; Liu, F.; Li, T.; Nie, X. Advances in the application of deep learning methods to digital rock technology. Adv. Geo-Energy Res. 2023, 8, 5–18. [Google Scholar] [CrossRef] [Scilit]
- Zhao, Z.; Zhou, X.-P. A comprehensive review of various AI-based segmentation algorithms for multiscale rocks: Principles, evaluations, simple applications and future directions. Rock Mech. Rock Eng. 2025, 58, 10541–10576. [Google Scholar] [CrossRef] [Scilit]
- Li, X.; Zhu, L.; Gao, F.; Liang, X.; Cao, Z. Intelligent digital rock physics: Advances and perspectives from imaging reconstruction to pore-scale multiphase flow simulation. Appl. Sci. 2026, 16, 6118. [Google Scholar] [CrossRef] [Scilit]
- Chai, R.; Foroughi, S.; Goodarzi, S.; Patmonoaji, A.; Yow, F.Y.; Bijeljic, B.; Blunt, M.J. Pore-Scale Imaging to Quantify the Evolution and Reduction in Trapped CO2 due to Ostwald Ripening. Environ. Sci. Technol. 2025, 59, 26419–26427. [Google Scholar] [CrossRef] [Scilit] [PubMed]
- Purswani, P.; Herring, A.; Borate, P.; Shokouhi, P.; Karpyn, Z. Multi-Stage X-Ray Imaging Dataset of Phase Trapping in Porous Media. Sci. Data 2026, 13, 1276. [Google Scholar] [CrossRef] [Scilit] [PubMed]
- Jeon, H.; Han, W.S.; Yang, W.; Han, G.; Kim, K.-Y.; Soltanian, M.R.; Dai, Z. CO2 Exsolution and Residual Trapping Influenced by Heterogeneity During Imbibition in Conglomerates: A Core-Scale Multiphase Flow. Water Resour. Res. 2026, 62, e2025WR041879. [Google Scholar] [CrossRef] [Scilit]
- Ye, S.; Song, X.; Ma, Z.; Gao, Y.; Zhu, L.; Zhou, M.; Xiao, L.; Wen, G.; Bijeljic, B.; Blunt, M.J. A noise-resistant and annotation-free supervoxel-based algorithm for rapid segmentation of multiphase X-ray images. Adv. Geo-Energy Res. 2025, 16, 50–59. [Google Scholar] [CrossRef] [Scilit]
- Wang, H.; Dalton, L.; Guo, R.; McClure, J.; Crandall, D.; Chen, C. Application of unsupervised deep learning to image segmentation and in-situ contact angle measurements in a CO2-water-rock system. Adv. Water Resour. 2023, 173, 104385. [Google Scholar] [CrossRef] [Scilit]
- Singh, K.; Anabaraonye, B.U.; Blunt, M.J.; Crawshaw, J. Partial dissolution of carbonate rock grains during reactive CO2-saturated brine injection under reservoir conditions. Adv. Water Resour. 2018, 122, 27–36. [Google Scholar] [CrossRef] [Scilit]
- Chai, R.; Ma, Q.; Goodarzi, S.; Yow, F.Y.; Bijeljic, B.; Blunt, M.J. Multiphase Reactive Flow During CO2 Storage in Sandstone. Engineering 2025, 48, 81–91. [Google Scholar] [CrossRef] [Scilit]
- Battu, A.K.; Miller, Q.R.S.; Cao, R.; Owen, A.T.; Schaef, H.T. 3D Quantification of Pore Networks and Anthropogenic Carbon Mineralization in Stacked Basalt Reservoirs. Environ. Sci. Technol. 2024, 58, 3747–3754. [Google Scholar] [CrossRef] [Scilit] [PubMed]
- Deng, H.; Ellis, B.R.; Peters, C.A.; Fitts, J.P.; Crandall, D.; Bromhal, G.S. Modifications of carbonate fracture hydrodynamic properties by CO2-acidified brine flow. Energy Fuels 2013, 27, 4221–4231. [Google Scholar] [CrossRef] [Scilit]
- Xie, J.-F.; He, S.; Zu, Y.Q.; Lamy-Chappuis, B.; Yardley, B.W.D. Relative permeabilities of supercritical CO2 and brine in carbon sequestration by a two-phase lattice Boltzmann method. Heat Mass Transf. 2017, 53, 2637–2649. [Google Scholar] [CrossRef] [Scilit]
- Aljaberi, F.; Belhaj, H.; Foroughi, S.; Blunt, M.J.; Al Kobaisi, M. Spatially distributed wettability characterization in porous media. Sci. Rep. 2026, 16, 12643. [Google Scholar] [CrossRef] [Scilit] [PubMed]
- Gray, F.; Cen, J.; Shah, S.M.; Crawshaw, J.P.; Boek, E.S. Simulating dispersion in porous media and the influence of segmentation on stagnancy in carbonates. Adv. Water Resour. 2016, 97, 1–10. [Google Scholar] [CrossRef] [Scilit]
- Chai, R.; Ahmed, S.; Foroughi, S.; Akai, T.; Esteban, L.; Clennell, M.B.; Koyama, M.; Takabayashi, K.; Blunt, M.J.; Bijeljic, B. Combined Multiscale Core Flooding and Digital Rock Workflow to Determine CO2 Relative Permeability and Capillary Trapping in a Reservoir Sandstone. Transp. Porous Media 2026, 153, 75. [Google Scholar] [CrossRef] [Scilit]
- Andrew, M.; Bijeljic, B.; Blunt, M.J. Pore-scale imaging of trapped supercritical carbon dioxide in sandstones and carbonates. Int. J. Greenh. Gas. Control 2014, 22, 1–14. [Google Scholar] [CrossRef] [Scilit]
- Ketcham, R.A.; Carlson, W.D. Acquisition, optimization and interpretation of X-ray computed tomographic imagery: Applications to the geosciences. Comput. Geosci. 2001, 27, 381–400. [Google Scholar] [CrossRef] [Scilit]
- Maire, E.; Withers, P.J. Quantitative X-ray tomography. Int. Mater. Rev. 2014, 59, 1–43. [Google Scholar] [CrossRef] [Scilit]
- Bultreys, T.; Boone, M.A.; Boone, M.N.; De Schryver, T.; Masschaele, B.; Van Hoorebeke, L.; Cnudde, V. Fast laboratory-based micro-computed tomography for pore-scale research: Illustrative experiments and perspectives on the future. Adv. Water Resour. 2016, 95, 341–351. [Google Scholar] [CrossRef] [Scilit]
- Withers, P.J.; Bouman, C.; Carmignato, S.; Cnudde, V.; Grimaldi, D.; Hagen, C.K.; Maire, E.; Manley, M.; Du Plessis, A.; Stock, S.R. X-ray computed tomography. Nat. Rev. Methods Primers 2021, 1, 18. [Google Scholar] [CrossRef] [Scilit]
- Claro, P.I.C.; Borges, E.P.B.S.; Schleder, G.R.; Archilha, N.L.; Pinto, A.; Carvalho, M.; Driemeier, C.E.; Fazzio, A.; Gouveia, R.F. From micro- to nano- and time-resolved x-ray computed tomography: Bio-based applications, synchrotron capabilities, and data-driven processing. Appl. Phys. Rev. 2023, 10, 021302. [Google Scholar] [CrossRef] [Scilit]
- Cnudde, V.; Boone, M.N. High-resolution X-ray computed tomography in geosciences: A review of the current technology and applications. Earth-Sci. Rev. 2013, 123, 1–17. [Google Scholar] [CrossRef] [Scilit]
- Lindquist, W.B.; Venkatarangan, A.; Dunsmuir, J.; Wong, T.F. Pore and throat size distributions measured from synchrotron X-ray tomographic images of Fontainebleau sandstones. J. Geophys. Res. Solid Earth 2000, 105, 21509–21527. [Google Scholar] [CrossRef] [Scilit]
- Berg, S.; Ott, H.; Klapp, S.A.; Schwing, A.; Neiteler, R.; Brussee, N.; Makurat, A.; Leu, L.; Enzmann, F.; Schwarz, J.-O.; et al. Real-time 3D imaging of Haines jumps in porous media flow. Proc. Natl. Acad. Sci. USA 2013, 110, 3755–3759. [Google Scholar] [CrossRef] [Scilit] [PubMed]
- Berg, S.; Armstrong, R.T.; Ott, H.; Georgiadis, A.; Klapp, S.A.; Schwing, A.; Neiteler, R.; Brussee, N.; Makurat, A.; Leu, L.; et al. Multiphase flow in porous rock imaged under dynamic flow conditions with fast X-ray computed microtomography. Petrophysics 2014, 55, 304–312. [Google Scholar]
- Menke, H.P.; Gao, Y.; Linden, S.; Andrew, M.G. Using Nano-XRM and High-Contrast Imaging to Inform Micro-Porosity Permeability During Stokes–Brinkman Single and Two-Phase Flow Simulations on Micro-CT Images. Front. Water 2022, 4, 935035. [Google Scholar] [CrossRef] [Scilit]
- Klaver, J.; Desbois, G.; Littke, R.; Urai, J.L. BIB-SEM characterization of pore space morphology and distribution in postmature to overmature samples from the Haynesville and Bossier Shales. Mar. Pet. Geol. 2015, 59, 451–466. [Google Scholar] [CrossRef] [Scilit]
- Curtis, M.E.; Sondergeld, C.H.; Ambrose, R.J.; Rai, C.S. Microstructural investigation of gas shales in two and three dimensions using nanometer-scale resolution imaging. AAPG Bull. 2012, 96, 665–677. [Google Scholar] [CrossRef] [Scilit]
- Al-Raoush, R.; Papadopoulos, A. Representative elementary volume analysis of porous media using X-ray computed tomography. Powder Technol. 2010, 200, 69–77. [Google Scholar] [CrossRef] [Scilit]
- Lee, S.-H.; Chang, W.-S.; Han, S.-M.; Kim, D.-H.; Kim, J.-K. Synchrotron X-ray nanotomography and three-dimensional nanoscale imaging analysis of pore structure-function in nanoporous polymeric membranes. J. Membr. Sci. 2017, 535, 28–34. [Google Scholar] [CrossRef] [Scilit]
- Münch, B.; Trtik, P.; Marone, F.; Stampanoni, M. Stripe and ring artifact removal with combined wavelet—Fourier filtering. Opt. Express 2009, 17, 8567–8591. [Google Scholar] [CrossRef] [Scilit] [PubMed]
- Kaestner, A.; Lehmann, E.; Stampanoni, M. Imaging and image processing in porous media research. Adv. Water Resour. 2008, 31, 1174–1187. [Google Scholar] [CrossRef] [Scilit]
- Schlüter, S.; Sheppard, A.; Brown, K.; Wildenschild, D. Image processing of multiphase images obtained via X-ray microtomography: A review. Water Resour. Res. 2014, 50, 3615–3639. [Google Scholar] [CrossRef] [Scilit]
- Sheppard, A.P.; Sok, R.M.; Averdunk, H. Techniques for image enhancement and segmentation of tomographic images of porous materials. Physica A Stat. Mech. Its Appl. 2004, 339, 145–151. [Google Scholar] [CrossRef] [Scilit]
- Ferreira, T.R.; Cássaro, F.A.M.; Zhou, H.; Pires, L.F. X-ray computed tomography image processing & segmentation: A case study applying machine learning and deep learning-based strategies. In X-Ray Imaging of the Soil Porous Architecture; Mooney, S.J., Young, I.M., Heck, R.J., Peth, S., Eds.; Springer Nature: Cham, Switzerland, 2022; pp. 57–80. [Google Scholar] [CrossRef] [Scilit]
- Sezgin, M.; Sankur, B. Survey over image thresholding techniques and quantitative performance evaluation. J. Electron. Imaging 2004, 13, 146–168. [Google Scholar] [CrossRef] [Scilit]
- Chauhan, S.; Rühaak, W.; Anbergen, H.; Kabdenov, A.; Freise, M.; Wille, T.; Sass, I. Phase segmentation of X-ray computer tomography rock images using machine learning techniques: An accuracy and performance study. Solid Earth 2016, 7, 1125–1139. [Google Scholar] [CrossRef] [Scilit]
- Tuller, M.; Kulkarni, R.; Fink, W. Segmentation of X-Ray CT Data of Porous Materials: A Review of Global and Locally Adaptive Algorithms. In Soil-Water-Root Processes: Advances in Tomography and Imaging; SSSA Special Publication; Soil Science Society of America: Madison, WI, USA, 2013; Volume 61, pp. 157–182. [Google Scholar] [CrossRef] [Scilit]
- Taha, A.A.; Hanbury, A. Metrics for evaluating 3D medical image segmentation: Analysis, selection, and tool. BMC Med. Imaging 2015, 15, 29. [Google Scholar] [CrossRef] [Scilit] [PubMed]
- Otsu, N. A threshold selection method from gray-level histograms. IEEE Trans. Syst. Man Cybern. 1979, 9, 62–66. [Google Scholar] [CrossRef] [Scilit]
- Xue, J.-H.; Titterington, D.M. t-Tests, F-Tests and Otsu’s Methods for Image Thresholding. IEEE Trans. Image Process. 2011, 20, 2392–2396. [Google Scholar] [CrossRef] [Scilit] [PubMed]
- Xu, X.; Xu, S.; Jin, L.; Song, E. Characteristic analysis of Otsu threshold and its applications. Pattern Recognit. Lett. 2011, 32, 956–961. [Google Scholar] [CrossRef] [Scilit]
- Cai, H.; Yang, Z.; Cao, X.; Xia, W.; Xu, X. A New Iterative Triclass Thresholding Technique in Image Segmentation. IEEE Trans. Image Process. 2014, 23, 1038–1046. [Google Scholar] [CrossRef] [Scilit] [PubMed]
- Huang, D.-Y.; Wang, C.-H. Optimal multi-level thresholding using a two-stage Otsu optimization approach. Pattern Recognit. Lett. 2009, 30, 275–284. [Google Scholar] [CrossRef] [Scilit]
- Yu, C.; Wu, W.; Zheng, J.; Zeng, W.; Zheng, D.; Li, Z.; Chen, C.; Wang, S. A multi-stage adaptive Otsu thresholding algorithm for pore segmentation in rock thin-section images. Earth Sci. Inform. 2025, 18, 239. [Google Scholar] [CrossRef] [Scilit]
- Zhou, Y.; Starkey, J.; Mansinha, L. Segmentation of petrographic images by integrating edge detection and region growing. Comput. Geosci. 2004, 30, 817–831. [Google Scholar] [CrossRef] [Scilit]
- Guo, Q.; Wang, Y.; Yang, S.; Xiang, Z. A method of blasted rock image segmentation based on improved watershed algorithm. Sci. Rep. 2022, 12, 7143. [Google Scholar] [CrossRef] [Scilit] [PubMed]
- Leonti, A.; Fonseca, J.; Valova, I.; Beemer, R.; Cannistraro, D.; Pilskaln, C.; DeFlorio, D.; Kelly, G. Optimized 3D Segmentation Algorithm for Shelly Sand Images. In Proceedings of the 6th World Congress on Electrical Engineering and Computer Systems and Sciences (EECSS’20), Virtual, 13–15 August 2020. [Google Scholar] [CrossRef] [Scilit]
- Purswani, P.; Karpyn, Z.T.; Enab, K.; Xue, Y.; Huang, X. Evaluation of image segmentation techniques for image-based rock property estimation. J. Pet. Sci. Eng. 2020, 195, 107890. [Google Scholar] [CrossRef] [Scilit]
- Andrew, M. A quantified study of segmentation techniques on synthetic geological XRM and FIB-SEM images. Comput. Geosci. 2018, 22, 1503–1512. [Google Scholar] [CrossRef] [Scilit]
- Liu, D.; Yu, J. Otsu method and K-means. In Proceedings of the 2009 Ninth International Conference on Hybrid Intelligent Systems, Shenyang, China, 12–14 August 2009; pp. 344–349. [Google Scholar] [CrossRef] [Scilit]
- Breiman, L. Random forests. Mach. Learn. 2001, 45, 5–32. [Google Scholar] [CrossRef] [Scilit]
- Reinhardt, M.; Jacob, A.; Sadeghnejad, S.; Cappuccio, F.; Arnold, P.; Frank, S.; Enzmann, F.; Kersten, M. Benchmarking conventional and machine learning segmentation techniques for digital rock physics analysis of fractured rocks. Environ. Earth Sci. 2022, 81, 71. [Google Scholar] [CrossRef] [Scilit]
- Wu, Y.; Misra, S. Intelligent image segmentation for organic-rich shales using random forest, wavelet transform, and Hessian matrix. IEEE Geosci. Remote Sens. Lett. 2020, 17, 1144–1147. [Google Scholar] [CrossRef] [Scilit]
- Chauhan, S. Phase Segmentation and Analysis of Tomographic Rock Images Using Machine Learning Techniques. Ph.D. Thesis, Technische Universität Darmstadt, Darmstadt, Germany, 2019. [Google Scholar] [CrossRef]
- Guntoro, P.I.; Ghorbani, Y.; Koch, P.-H.; Rosenkranz, J. X-ray Microcomputed Tomography (µCT) for Mineral Characterization: A Review of Data Analysis Methods. Minerals 2019, 9, 183. [Google Scholar] [CrossRef] [Scilit]
- Rubo, R.A.; Carneiro, C.D.C.; Michelon, M.F.; Gioria, R.d.S. Digital petrography: Mineralogy and porosity identification using machine learning algorithms in petrographic thin section images. J. Pet. Sci. Eng. 2019, 183, 106382. [Google Scholar] [CrossRef] [Scilit]
- Chauhan, S.; Sell, K.; Rühaak, W.; Wille, T.; Sass, I. CobWeb 1.0: Machine learning toolbox for tomographic imaging. Geosci. Model Dev. 2020, 13, 315–334. [Google Scholar] [CrossRef] [Scilit]
- Varfolomeev, I.; Yakimchuk, I.; Safonov, I. An Application of Deep Neural Networks for Segmentation of Microtomographic Images of Rock Samples. Computers 2019, 8, 72. [Google Scholar] [CrossRef] [Scilit]
- Niu, Y.; Mostaghimi, P.; Shabaninejad, M.; Swietojanski, P.; Armstrong, R.T. Digital rock segmentation for petrophysical analysis with reduced user bias using convolutional neural networks. Water Resour. Res. 2020, 56, e2019WR026597. [Google Scholar] [CrossRef] [Scilit]
- Balcewicz, M.; Siegert, M.; Gurris, M.; Ruf, M.; Krach, D.; Steeb, H.; Saenger, E.H. Digital Rock Physics: A Geological Driven Workflow for the Segmentation of Anisotropic Ruhr Sandstone. Front. Earth Sci. 2021, 9, 673753. [Google Scholar] [CrossRef] [Scilit]
- Ar Rushood, I.; Alqahtani, N.; Wang, Y.D.; Shabaninejad, M.; Armstrong, R.; Mostaghimi, P. Segmentation of X-ray images of rocks using deep learning (SPE-201282-MS). In Proceedings of the SPE Annual Technical Conference & Exhibition, Virtual, 26–29 October 2020. [Google Scholar] [CrossRef] [Scilit]
- Cao, D.; Ji, S.; Cui, R.; Liu, Q. Multi-task learning for digital rock segmentation and characteristic parameters computation. J. Pet. Sci. Eng. 2022, 208, 109202. [Google Scholar] [CrossRef] [Scilit]
- Karimpouli, S.; Tahmasebi, P. Segmentation of digital rock images using deep convolutional autoencoder networks. Comput. Geosci. 2019, 126, 142–150. [Google Scholar] [CrossRef] [Scilit]
- Liang, J.; Sun, Y.; Lebedev, M.; Gurevich, B.; Nzikou, M.; Vialle, S.; Glubokovskikh, S. Multi-mineral segmentation of micro-tomographic images using a convolutional neural network. Comput. Geosci. 2022, 168, 105217. [Google Scholar] [CrossRef] [Scilit]
- Manzoor, S.; Qasim, T.; Bhatti, N.; Zia, M. Segmentation of digital rock images using texture analysis and deep network. Arab. J. Geosci. 2023, 16, 436. [Google Scholar] [CrossRef] [Scilit]
- Ronneberger, O.; Fischer, P.; Brox, T. U-Net: Convolutional networks for biomedical image segmentation. In Medical Image Computing and Computer-Assisted Intervention (MICCAI 2015); Lecture Notes in Computer Science; Springer: Cham, Switzerland, 2015; Volume 9351, pp. 234–241. [Google Scholar] [CrossRef] [Scilit]
- Yasin, Q.; Liu, B.; Sun, M.; Sohail, G.M.; Ismail, A.; Majdanski, M.; Golsanami, N.; Ma, Y.; Fu, X. Automatic pore structure analysis in organic-rich shale using FIB-SEM and attention U-Net. Fuel 2024, 358, 130161. [Google Scholar] [CrossRef] [Scilit]
- Sun, P.; Ge, L.; Liu, Y.; Li, B.; Nie, X. Modeling of multi-mineral-component digital core based on Res-Unet. J. Geophys. Eng. 2023, 20, 483–493. [Google Scholar] [CrossRef] [Scilit]
- Wang, H.; Dalton, L.; Fan, M.; Guo, R.; McClure, J.; Crandall, D.; Chen, C. Deep-learning-based workflow for boundary and small target segmentation in digital rock images using UNet++ and IK-EBM. J. Pet. Sci. Eng. 2022, 215, 110596. [Google Scholar] [CrossRef] [Scilit]
- Wang, Z.; Hou, Z.; Cao, D. Edge-guided segmentation of digital rock images: Integrating a pretrained edge-aware path with the main segmentation path. Comput. Geosci. 2025, 197, 105884. [Google Scholar] [CrossRef] [Scilit]
- Zhu, Z.; Wang, H.; Xu, G.; Da, X.; Li, J. Automatic segmentation of karst reservoir CT images and identification of karst spatial structure based on 3D U-Net. Sci. Rep. 2025, 15, 39094. [Google Scholar] [CrossRef] [Scilit] [PubMed]
- Suo, L.; Wang, Z.; Liu, H.; Cui, L.; Sun, X.; Qin, X. Innovative Deep Learning Approaches for High-Precision Segmentation and Characterization of Sandstone Pore Structures in Reservoirs. Appl. Sci. 2024, 14, 7178. [Google Scholar] [CrossRef] [Scilit]
- Mahmoudi, S.; Asghari, O.; Boisvert, J. Addressing class imbalance in micro-CT image segmentation: A modified U-Net model with pixel-level class weighting. Comput. Geosci. 2025, 196, 105853. [Google Scholar] [CrossRef] [Scilit]
- Mahmud, B.U.; Hong, G.Y.; Mamun, A.A.; Ping, E.P.; Wu, Q. Deep Learning-Based Segmentation of 3D Volumetric Image and Microstructural Analysis. Sensors 2023, 23, 2640. [Google Scholar] [CrossRef] [Scilit] [PubMed]
- Bihani, A.; Daigle, H.; Santos, J.E.; Landry, C.; Prodanović, M.; Milliken, K. MudrockNet: Semantic segmentation of mudrock SEM images through deep learning. Comput. Geosci. 2022, 158, 104952. [Google Scholar] [CrossRef] [Scilit]
- Bordignon, F.; de Figueiredo, L.P.; Exterkoetter, R.; Rodrigues, B.B.; Duarte, M. Deep learning for grain size and porosity distributions estimation on micro-CT images. In Proceedings of the 16th International Congress of the Brazilian Geophysical Society & Expogef, Rio de Janeiro, Brazil, 19–22 August 2019. [Google Scholar] [CrossRef] [Scilit]
- Ferreira, B.A.P.; Augusto, K.S.; Iglesias, J.C.Á.; Caldas, T.D.P.; Santos, R.B.M.; Paciornik, S. Instance segmentation of quartz in iron ore optical microscopy images by deep learning. Miner. Eng. 2024, 211, 108681. [Google Scholar] [CrossRef] [Scilit]
- Dong, H.; Blunt, M.J. Pore-network extraction from micro-computerized-tomography images. Phys. Rev. E 2009, 80, 036307. [Google Scholar] [CrossRef] [Scilit] [PubMed]
- Zhao, L.; Zhang, H.; Sun, X.; Ouyang, Z.; Xu, C.; Qin, X. Application of ResUNet-CBAM in Thin-Section Image Segmentation of Rocks. Information 2024, 15, 788. [Google Scholar] [CrossRef] [Scilit]
- Sun, M.; Yasin, Q.; Daniel, E.; Sohail, G.M.; Ismail, A.; Liu, B.; Wood, D.A. Swin-UNETR: A transformer-based model for 3D pore network segmentation in low-permeability sedimentary rocks. Int. J. Coal Geol. 2026, 315, 104951. [Google Scholar] [CrossRef] [Scilit]
- Kirillov, A.; Mintun, E.; Ravi, N.; Mao, H.; Rolland, C.; Gustafson, L.; Xiao, T.; Whitehead, S.; Berg, A.C.; Lo, W.Y.; et al. Segment Anything. In Proceedings of the IEEE/CVF International Conference on Computer Vision, Paris, France, 2–6 October 2023; pp. 4015–4026. [Google Scholar] [CrossRef] [Scilit]
- Oquab, M.; Darcet, T.; Moutakanni, T.; Vo, H.V.; Szafraniec, M.; Khalidov, V.; Fernandez, P.; Haziza, D.; Massa, F.; El-Nouby, A.; et al. DINOv2: Learning robust visual features without supervision. Trans. Mach. Learn. Res. 2024. Available online: https://openreview.net/forum?id=a68SUt6zFt (accessed on 2 August 2026).
- Brondolo, F.; Beaussant, S. DINOv2 rocks geological image analysis: Classification, segmentation, and interpretability. J. Rock Mech. Geotech. Eng. 2025, 17, 6853–6867. [Google Scholar] [CrossRef] [Scilit]
- Wang, Y.; Zheng, D.; Hou, M.; Li, H.; Zeng, W.; Chen, C.; Wu, S.; Gao, Y.; Bai, Y. An auto-prompting Segment Anything Model for dual-modal grain segmentation in rock images. Appl. Comput. Geosci. 2026, 31, 100375. [Google Scholar] [CrossRef] [Scilit]
- Mamode, H.I.; Hampson, G.J.; John, C.M. Do more with less: Exploring semi-supervised learning for geological image classification. Appl. Comput. Geosci. 2025, 25, 100216. [Google Scholar] [CrossRef] [Scilit]
- Ma, Z.; He, X.; Kwak, H.; Gao, J.; Sun, S.; Yan, B. Enhancing rock image segmentation in digital rock physics: A fusion of generative AI and state-of-the-art neural networks. arXiv 2023. [Google Scholar] [CrossRef] [Scilit]
- Boiger, R.; Churakov, S.V.; Ballester Llagaria, I.; Kosakowski, G.; Wüst, R.; Prasianakis, N.I. Direct mineral content prediction from drill core images via transfer learning. Swiss J. Geosci. 2024, 117, 8. [Google Scholar] [CrossRef] [Scilit]
- Chen, W.; Su, L.; Chen, X.; Huang, Z. Rock image classification using deep residual neural network with transfer learning. Front. Earth Sci. 2023, 10, 1079447. [Google Scholar] [CrossRef] [Scilit]
- Kalam, M.Z. Digital Rock Physics for Fast and Accurate Special Core Analysis in Carbonates. In New Technologies in the Oil and Gas Industry; InTech: Rijeka, Croatia, 2012. [Google Scholar] [CrossRef] [Scilit] [PubMed][Green Version]
- Arns, C.H.; Bauget, F.; Limaye, A.; Sakellariou, A.; Senden, T.J.; Sheppard, A.P.; Sok, R.M.; Pinczewski, W.V.; Bakke, S.; Berge, L.I.; et al. Pore scale characterisation of carbonates using X-ray microtomography (Paper SPE-90368-MS). In Proceedings of the SPE Annual Technical Conference and Exhibition, Houston, TX, USA, 26–29 September 2004. [Google Scholar] [CrossRef]
- Sun, H.; Belhaj, H.; Tao, G.; Vega, S.; Liu, L. Rock properties evaluation for carbonate reservoir characterization with multi-scale digital rock images. J. Pet. Sci. Eng. 2019, 175, 654–664. [Google Scholar] [CrossRef] [Scilit]
- Alqahtani, N.J.; Niu, Y.; Wang, Y.D.; Chung, T.; Lanetc, Z.; Zhuravljov, A.; Armstrong, R.T.; Mostaghimi, P. Super-resolved segmentation of X-ray images of carbonate rocks using deep learning. Transp. Porous Media 2022, 143, 497–525. [Google Scholar] [CrossRef] [Scilit]
- Nande, S.B.; Patwardhan, S.D. Automated Reservoir Characterization of Carbonate Rocks using Deep Learning Image Segmentation Approach. SPE J. 2024, 29, 4356–4375. [Google Scholar] [CrossRef] [Scilit]
- Sok, R.M.; Knackstedt, M.A.; Sheppard, A.P.; Pinczewski, W.V.; Lindquist, W.B.; Venkatarangan, A.; Paterson, L. Direct and stochastic generation of network models from tomographic images: Effect of topology on residual saturations. Transp. Porous Media 2002, 46, 345–371. [Google Scholar] [CrossRef] [Scilit]
- Scott, G.; Wu, K.; Zhou, Y. Multi-scale Image-Based Pore Space Characterisation and Pore Network Generation: Case Study of a North Sea Sandstone Reservoir. Transp. Porous Media 2019, 129, 855–884. [Google Scholar] [CrossRef] [Scilit]
- Goral, J.; Panja, P.; Deo, M.; Andrew, M.; Linden, S.; Schwarz, J.-O.; Wiegmann, A. Confinement Effect on Porosity and Permeability of Shales. Sci. Rep. 2020, 10, 49. [Google Scholar] [CrossRef] [Scilit] [PubMed]
- Yin, B.; Hu, Q.; Zhu, Y.; Zhao, C.; Zhou, K. Paw-Net: Stacking ensemble deep learning for segmenting scanning electron microscopy images of fine-grained shale samples. Comput. Geosci. 2022, 168, 105218. [Google Scholar] [CrossRef] [Scilit]
- Vinegar, H.J.; Wellington, S.L. Tomographic imaging of three-phase flow experiments. Rev. Sci. Instrum. 1987, 58, 96–107. [Google Scholar] [CrossRef] [Scilit]
- Porter, M.L.; Wildenschild, D. Image analysis algorithms for estimating porous media multiphase flow variables from computed microtomography data: A validation study. Comput. Geosci. 2010, 14, 15–30. [Google Scholar] [CrossRef] [Scilit]
- Leu, L.; Berg, S.; Enzmann, F.; Armstrong, R.T.; Kersten, M. Fast X-ray Micro-Tomography of Multiphase Flow in Berea Sandstone: A Sensitivity Study on Image Processing. Transp. Porous Media 2014, 105, 451–469. [Google Scholar] [CrossRef] [Scilit]
- Andrew, M.; Bijeljic, B.; Blunt, M.J. Pore-scale imaging of geological carbon dioxide storage under in situ conditions. Geophys. Res. Lett. 2013, 40, 3915–3918. [Google Scholar] [CrossRef] [Scilit]
- Iglauer, S.; Paluszny, A.; Pentland, C.H.; Blunt, M.J. Residual CO2 imaged with X-ray micro-tomography. Geophys. Res. Lett. 2011, 38, L21403. [Google Scholar] [CrossRef] [Scilit]
- Lv, P.; Song, Y.; Liu, Y.; Wang, B.; Jiang, L.; Wu, B.; Liu, S.; Chen, J. Pore-Scale Imaging and Analysis of Phase Topologies and Displacement Mechanisms for CO2-Brine Two-Phase Flow in Unconsolidated Sand Packs. Water Resour. Res. 2017, 53, 9127–9144. [Google Scholar] [CrossRef] [Scilit]
- Perez, S.; Poncet, P. Auto-weighted Bayesian Physics-Informed Neural Networks and robust estimations for multitask inverse problems in pore-scale imaging of dissolution. Comput. Geosci. 2024, 28, 1175–1215. [Google Scholar] [CrossRef] [Scilit]
- Jiang, Z.; van Dijke, M.I.J.; Sorbie, K.S.; Couples, G.D. Representation of multiscale heterogeneity via multiscale pore networks. Water Resour. Res. 2013, 49, 5437–5449. [Google Scholar] [CrossRef] [Scilit]
- Zhu, L.; Zhang, C.; Zhang, C.; Zhou, X.; Zhang, Z.; Nie, X.; Liu, W.; Zhu, B. Challenges and Prospects of Digital Core-Reconstruction Research. Geofluids 2019, 2019, 7814180. [Google Scholar] [CrossRef] [Scilit]
- Munawar, M.J.; Vega, S.; Lin, C.; Alsuwaidi, M.; Ahsan, N.; Bhakta, R.R. Upscaling Reservoir Rock Porosity by Fractal Dimension Using Three-Dimensional Micro-Computed Tomography and Two-Dimensional Scanning Electron Microscope Images. J. Energy Resour. Technol. 2021, 143, 013003. [Google Scholar] [CrossRef] [Scilit]
- Ruspini, L.C.; Øren, P.E.; Berg, S.; Masalmeh, S.; Bultreys, T.; Taberner, C.; Sorop, T.; Marcelis, F.; Appel, M.; Freeman, J.; et al. Multiscale Digital Rock Analysis for Complex Rocks. Transp. Porous Media 2021, 139, 301–325. [Google Scholar] [CrossRef] [Scilit]
- Xu, Q.; Guan, L.; Zhang, W.; Shi, L.; Shao, H.; Wang, G.; Long, W. Multiscale Digital Rock Imaging and Modeling for Measuring the Heterogeneous Carbonate and Conglomerate Permeability at the Laboratory Plug Scale. Energy Fuels 2022, 36, 11025–11039. [Google Scholar] [CrossRef] [Scilit]
- Buono, G.; Caliro, S.; Macedonio, G.; Allocca, V.; Gamba, F.; Pappalardo, L. Exploring microstructure and petrophysical properties of microporous volcanic rocks through 3D multiscale and super-resolution imaging. Sci. Rep. 2023, 13, 6651. [Google Scholar] [CrossRef] [Scilit] [PubMed]
- Foroughi, S.; Bijeljic, B.; Gao, Y.; Blunt, M.J. Incorporation of Sub-Resolution Porosity into Two-Phase Flow Models With a Multiscale Pore Network for Complex Microporous Rocks. Water Resour. Res. 2024, 60, e2023WR036393. [Google Scholar] [CrossRef] [Scilit]
- Zel, I.; Kenessarin, M.; Kichanov, S.; Nazarov, K.; Bǎlǎșoiu, M.; Kozlenko, D. Pore Segmentation Techniques for Low-Resolution Data: Application to the Neutron Tomography Data of Cement Materials. J. Imaging 2022, 8, 242. [Google Scholar] [CrossRef] [Scilit] [PubMed]
- Kokhan, V.V.; Grigoriev, M.V.; Buzmakov, A.V.; Uvarov, V.I.; Ingacheva, A.S.; Shvets, E.A.; Chukalina, M.V. Segmentation criteria in the problem of porosity determination based on CT scans. Proc. SPIE 2020, 11433, 114331E. [Google Scholar] [CrossRef] [Scilit]
- Vidal, A.D.; Neta, A.P.M.; de Castro Vargas Fernandes, J.; Medeiros, L.C.; dos Anjos, C.E.M.; Surmas, R.; Evsukoff, A.G. Multi-resolution X-ray micro-computed tomography images of carbonate rocks from brazilian pre-salt. Sci. Data 2024, 11, 1361. [Google Scholar] [CrossRef] [Scilit] [PubMed]
- Saxena, N.; Mavko, G.; Hofmann, R.; Srisutthiyakorn, N. Estimating permeability from thin sections without reconstruction: Digital rock study of 3D properties from 2D images. Comput. Geosci. 2017, 102, 79–99. [Google Scholar] [CrossRef] [Scilit]
- Baveye, P.C.; Laba, M.; Otten, W.; Bouckaert, L.; Dello Sterpaio, P.; Goswami, R.R.; Grinev, D.; Houston, A.; Hu, Y.; Liu, J.; et al. Observer-dependent variability of the thresholding step in the quantitative analysis of soil images and X-ray microtomography data. Geoderma 2010, 157, 51–63. [Google Scholar] [CrossRef] [Scilit]
- Krygier, M.C.; LaBonte, T.; Martinez, C.; Norris, C.; Sharma, K.; Collins, L.N.; Mukherjee, P.P.; Roberts, S.A. Quantifying the unknown impact of segmentation uncertainty on image-based simulations. Nat. Commun. 2021, 12, 5414. [Google Scholar] [CrossRef] [Scilit] [PubMed]
- Bear, J. Dynamics of Fluids in Porous Media; Dover: New York, NY, USA, 1988. [Google Scholar]
- Vogel, H.-J.; Tölke, J.; Schulz, V.P.; Krafczyk, M.; Roth, K. Comparison of a Lattice-Boltzmann Model, a Full-Morphology Model, and a Pore Network Model for Determining Capillary Pressure–Saturation Relationships. Vadose Zone J. 2005, 4, 380–388. [Google Scholar] [CrossRef] [Scilit]
- Ruspini, L.C.; Farokhpoor, R.; Øren, P.E. Pore-scale modeling of capillary trapping in water-wet porous media: A new cooperative pore-body filling model. Adv. Water Resour. 2017, 108, 1–14. [Google Scholar] [CrossRef] [Scilit]
- Arns, C.H.; Knackstedt, M.A.; Pinczewski, W.V.; Garboczi, E.J. Computation of linear elastic properties from microtomographic images: Methodology and agreement between theory and experiment. Geophysics 2002, 67, 1396–1405. [Google Scholar] [CrossRef] [Scilit]
- Cui, R.; Cao, D.; Liu, Q.; Zhu, Z.; Jia, Y. Vp and Vs prediction from digital rock images using a combination of U-Net and convolutional neural networks. Geophysics 2021, 86, MR27–MR37. [Google Scholar] [CrossRef] [Scilit]
- Zhao, L.; Li, H.; Meng, J.; Zhang, D. Efficient uncertainty quantification for permeability of three-dimensional porous media through image analysis and pore-scale simulations. Phys. Rev. E 2020, 102, 023308. [Google Scholar] [CrossRef] [Scilit] [PubMed]
- Berg, S.; Saxena, N.; Shaik, M.; Pradhan, C. Generation of ground truth images to validate micro-CT image-processing pipelines. Lead. Edge 2018, 37, 412–420. [Google Scholar] [CrossRef] [Scilit]
- DeVries, T.; Taylor, G.W. Leveraging uncertainty estimates for predicting segmentation quality. arXiv 2018. [Google Scholar] [CrossRef] [Scilit]
- Mukhoti, J.; Gal, Y. Evaluating Bayesian deep learning methods for semantic segmentation. arXiv 2018, arXiv:1811.12709. [Google Scholar] [CrossRef] [Scilit]
- Ghoshal, B.; Tucker, A.; Sanghera, B.; Wong, W.L. Estimating uncertainty in deep learning for reporting confidence to clinicians when segmenting nuclei image data. In Proceedings of the 2019 IEEE 32nd International Symposium on Computer-Based Medical Systems (CBMS), Cordoba, Spain, 5–7 June 2019; pp. 318–324. [Google Scholar] [CrossRef] [Scilit]
- Roy, A.G.; Conjeti, S.; Navab, N.; Wachinger, C. Bayesian QuickNAT: Model uncertainty in deep whole-brain segmentation for structure-wise quality control. NeuroImage 2019, 195, 11–22. [Google Scholar] [CrossRef] [Scilit] [PubMed]
- LaBonte, T.M.; Martinez, C.; Roberts, S.A. We Know Where We Don’t Know: 3D Bayesian CNNs for Credible Geometric Uncertainty; Report SAND2020-3269R; Sandia National Laboratories: Albuquerque, NM, USA, 2020. [CrossRef] [Scilit]
- Dechesne, C.; Lassalle, P.; Lefèvre, S. Bayesian deep learning with Monte Carlo dropout for qualification of semantic segmentation. In Proceedings of the 2021 IEEE International Geoscience and Remote Sensing Symposium (IGARSS), Brussels, Belgium, 11–16 July 2021; IEEE: Piscataway, NJ, USA, 2021; pp. 2536–2539. [Google Scholar] [CrossRef] [Scilit]
- Prabhudesai, S.; Hauth, J.; Guo, D.; Rao, A.; Banovic, N.; Huan, X. Lowering the computational barrier: Partially Bayesian neural networks for transparency in medical imaging AI. Front. Comput. Sci. 2023, 5, 1071174. [Google Scholar] [CrossRef] [Scilit]
- Natekar, P.; Kori, A.; Krishnamurthi, G. Demystifying Brain Tumor Segmentation Networks: Interpretability and Uncertainty Analysis. Front. Comput. Neurosci. 2020, 14, 6. [Google Scholar] [CrossRef] [Scilit] [PubMed]
- McCrindle, B.; Zukotynski, K.; Doyle, T.E.; Noseworthy, M.D. A Radiology-focused Review of Predictive Uncertainty for AI Interpretability in Computer-assisted Segmentation. Radiol. Artif. Intell. 2021, 3, e210031. [Google Scholar] [CrossRef] [Scilit] [PubMed]
- Saleem, H.; Shahid, A.R.; Raza, B. Visual interpretability in 3D brain tumor segmentation network. Comput. Biol. Med. 2021, 133, 104410. [Google Scholar] [CrossRef] [Scilit] [PubMed]
- Singh, R.K.; Gorantla, R.; Allada, S.G.R.; Narra, P. SkiNet: A deep learning framework for skin lesion diagnosis with uncertainty estimation and explainability. PLoS ONE 2022, 17, e0276836. [Google Scholar] [CrossRef] [Scilit] [PubMed]
- Salahuddin, Z.; Woodruff, H.C.; Chatterjee, A.; Lambin, P. Transparency of deep neural networks for medical image analysis: A review of interpretability methods. Comput. Biol. Med. 2022, 140, 105111. [Google Scholar] [CrossRef] [Scilit] [PubMed]
- Inamdar, M.A.; Gudigar, A.; Raghavendra, U.; Kaprekar, A.; Salvi, M.; Seoni, S.; Menon, G.R.; Molinari, F.; Acharya, U.R. TrustNet: A lightweight network with integrated uncertainty quantification and quantitative explainable AI for ischemic stroke detection in CT images. Sci. Rep. 2026, 16, 9861. [Google Scholar] [CrossRef] [Scilit] [PubMed]
- Wang, F.; Zai, Y. Image segmentation and flow prediction of digital rock with U-net network. Adv. Water Resour. 2023, 172, 104384. [Google Scholar] [CrossRef] [Scilit]
- Chung, T.; Wang, Y.D.; Armstrong, R.T.; Mostaghimi, P. CNN-PFVS: Integrating neural network and finite volume models to accelerate flow simulation on pore space images. Transp. Porous Media 2020, 135, 25–37. [Google Scholar] [CrossRef] [Scilit]
- Almajid, M.M.; Abu-Al-Saud, M.O. Prediction of porous media fluid flow using physics informed neural networks. J. Pet. Sci. Eng. 2022, 208, 109205. [Google Scholar] [CrossRef] [Scilit]
- Elmorsy, M.; El-Dakhakhni, W.; Zhao, B. Rapid Permeability Upscaling of Digital Porous Media via Physics-Informed Neural Networks. Water Resour. Res. 2023, 59, e2023WR035064. [Google Scholar] [CrossRef] [Scilit]
- Gärttner, S.; Alpak, F.O.; Meier, A.; Ray, N.; Frank, F. Estimating permeability of 3D micro-CT images by physics-informed CNNs based on DNS. Comput. Geosci. 2023, 27, 245–262. [Google Scholar] [CrossRef] [Scilit]
- Digital Porous Media Portal. Digital Porous Media Portal (Formerly Digital Rocks Portal); Texas Advanced Computing Center, The University of Texas at Austin: Austin, TX, USA, 2026; Available online: https://digitalporousmedia.org/ (accessed on 2 August 2026).
- Zhang, Y.; Wu, X.; You, J. A benchmark dataset and baseline methods for rock microstructure interpretation in SEM images. Sci. Data 2025, 12, 1671. [Google Scholar] [CrossRef] [Scilit] [PubMed]
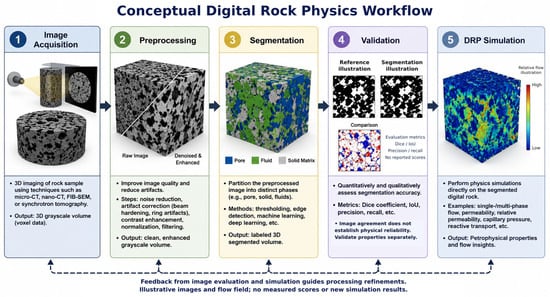
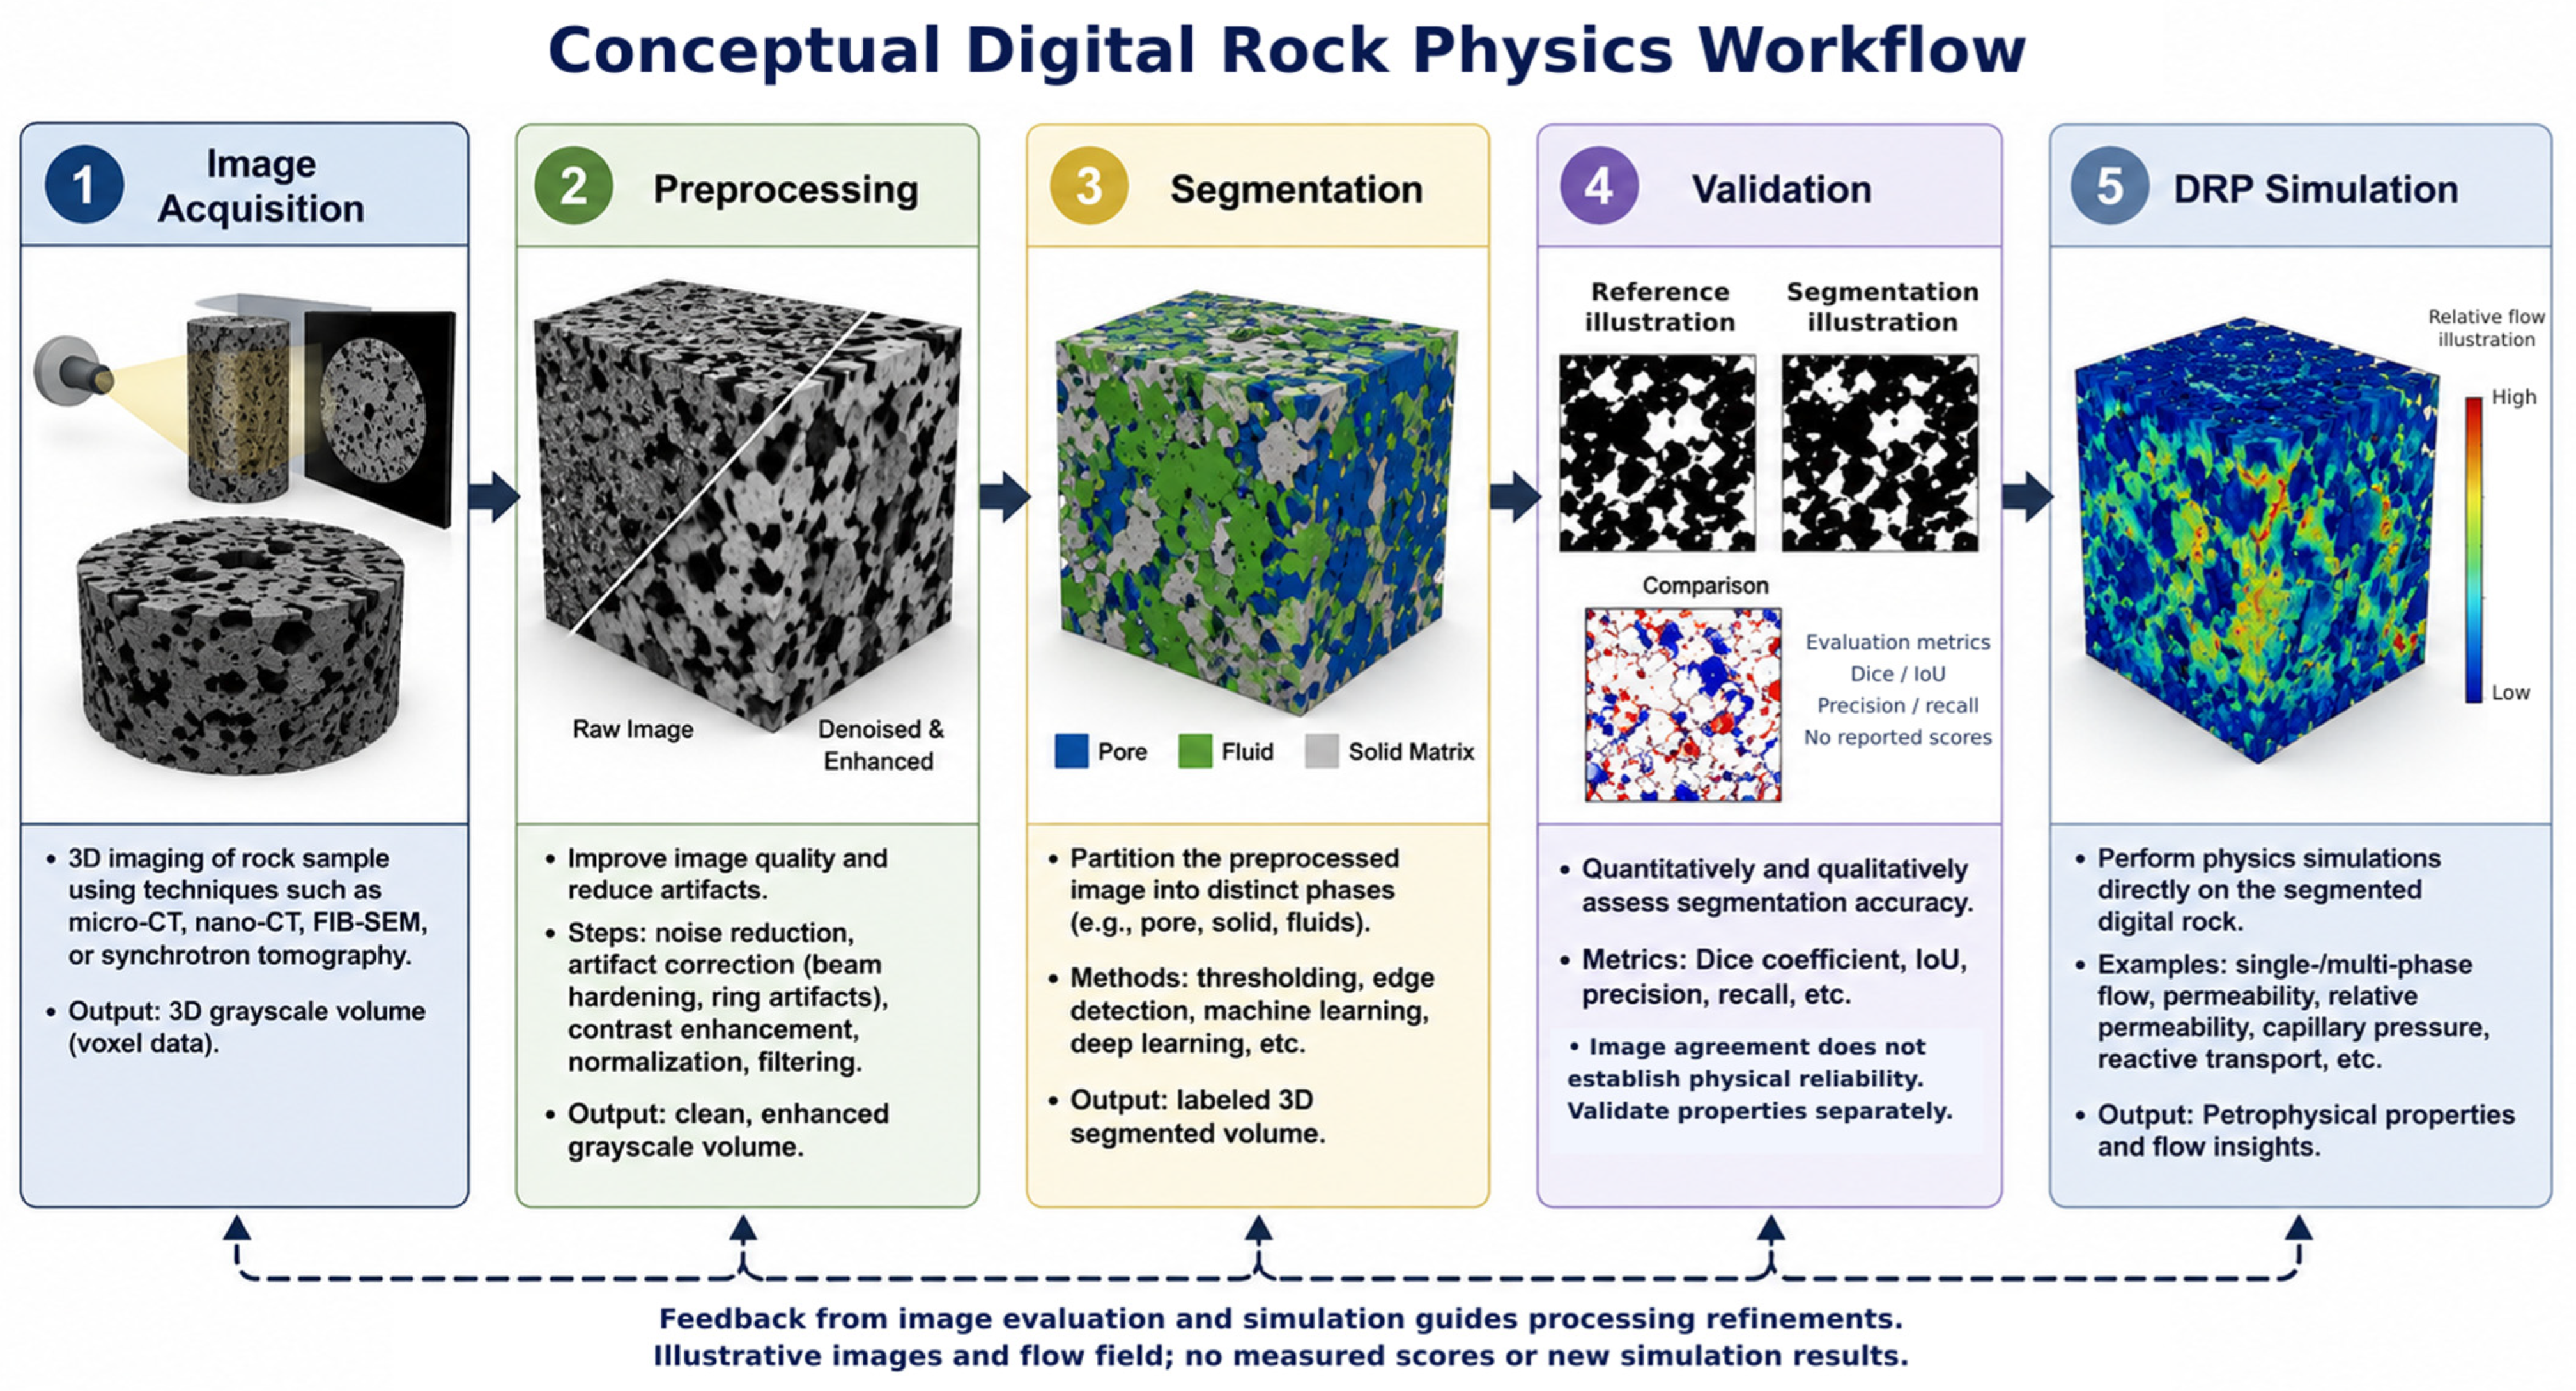
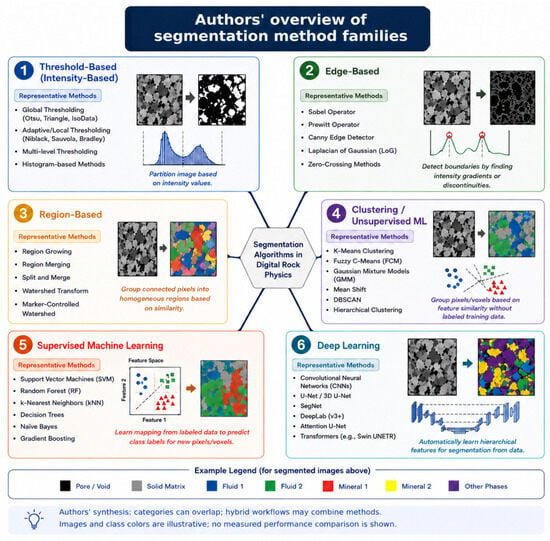
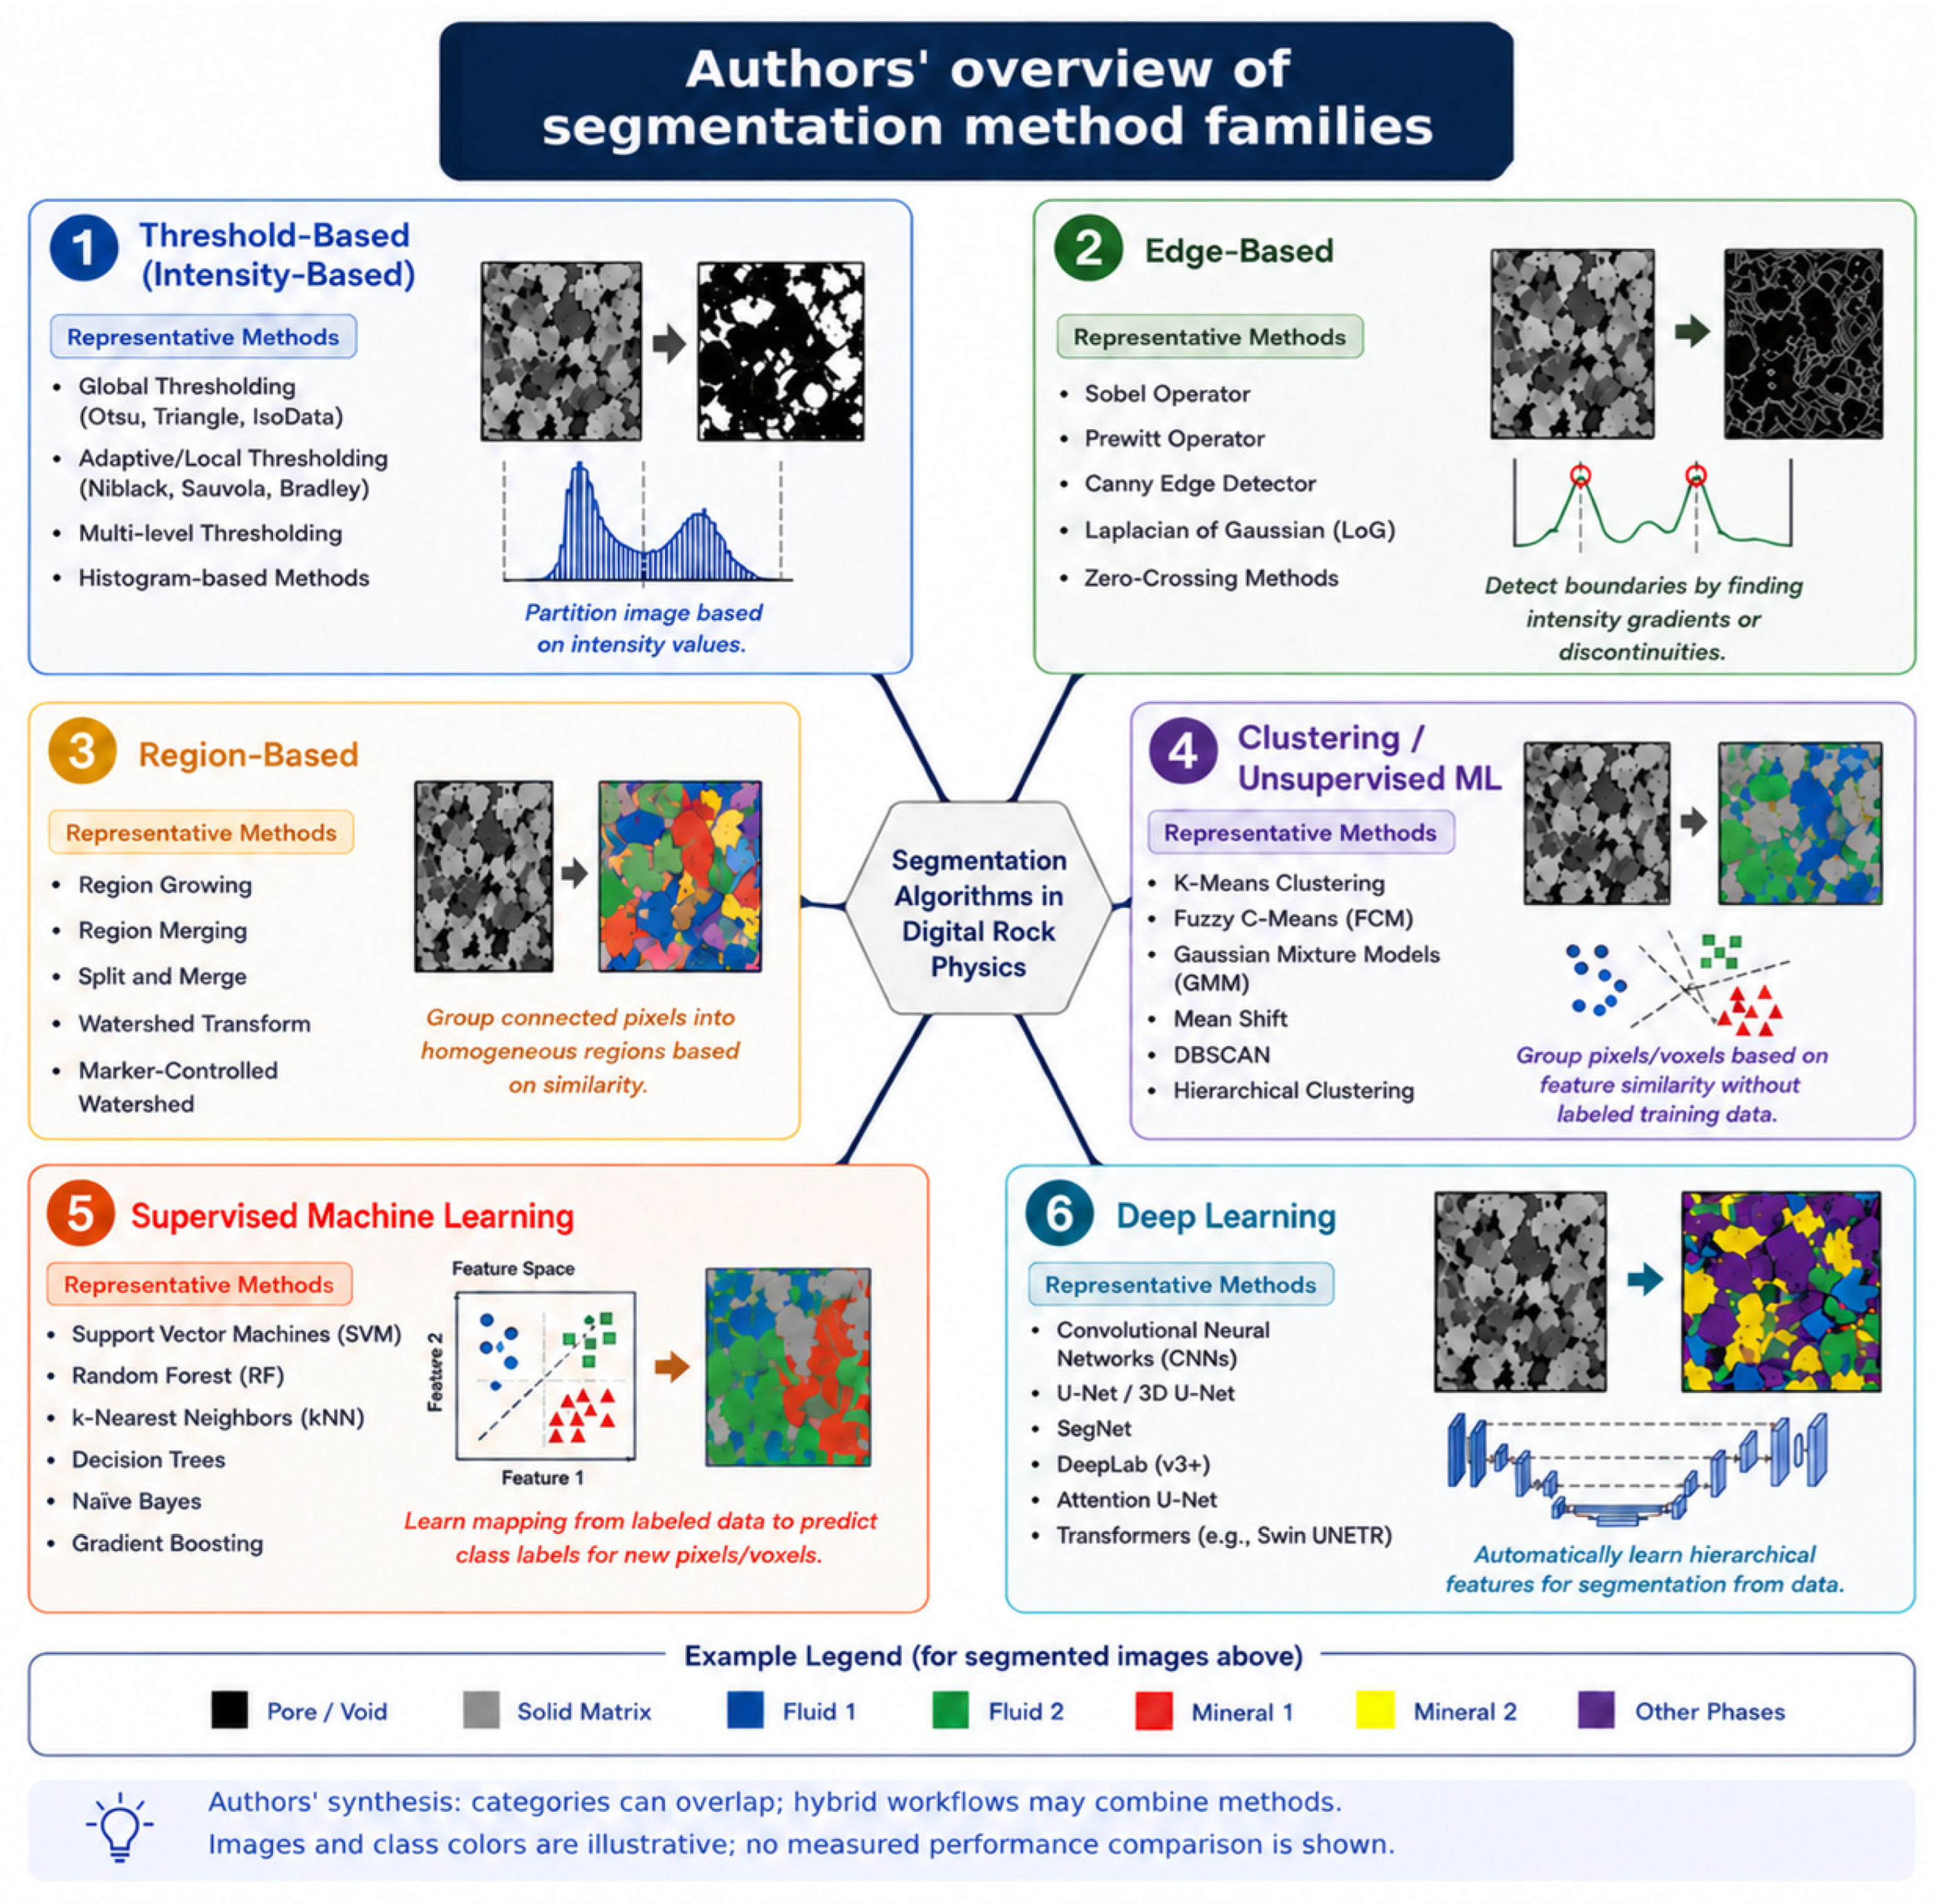
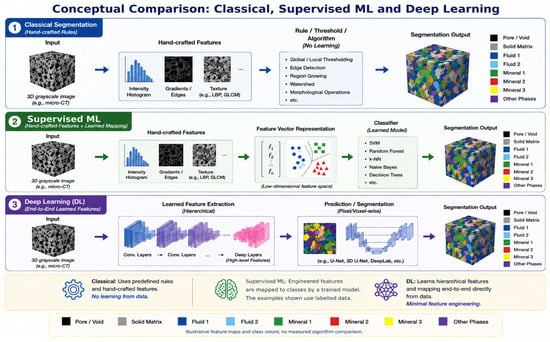
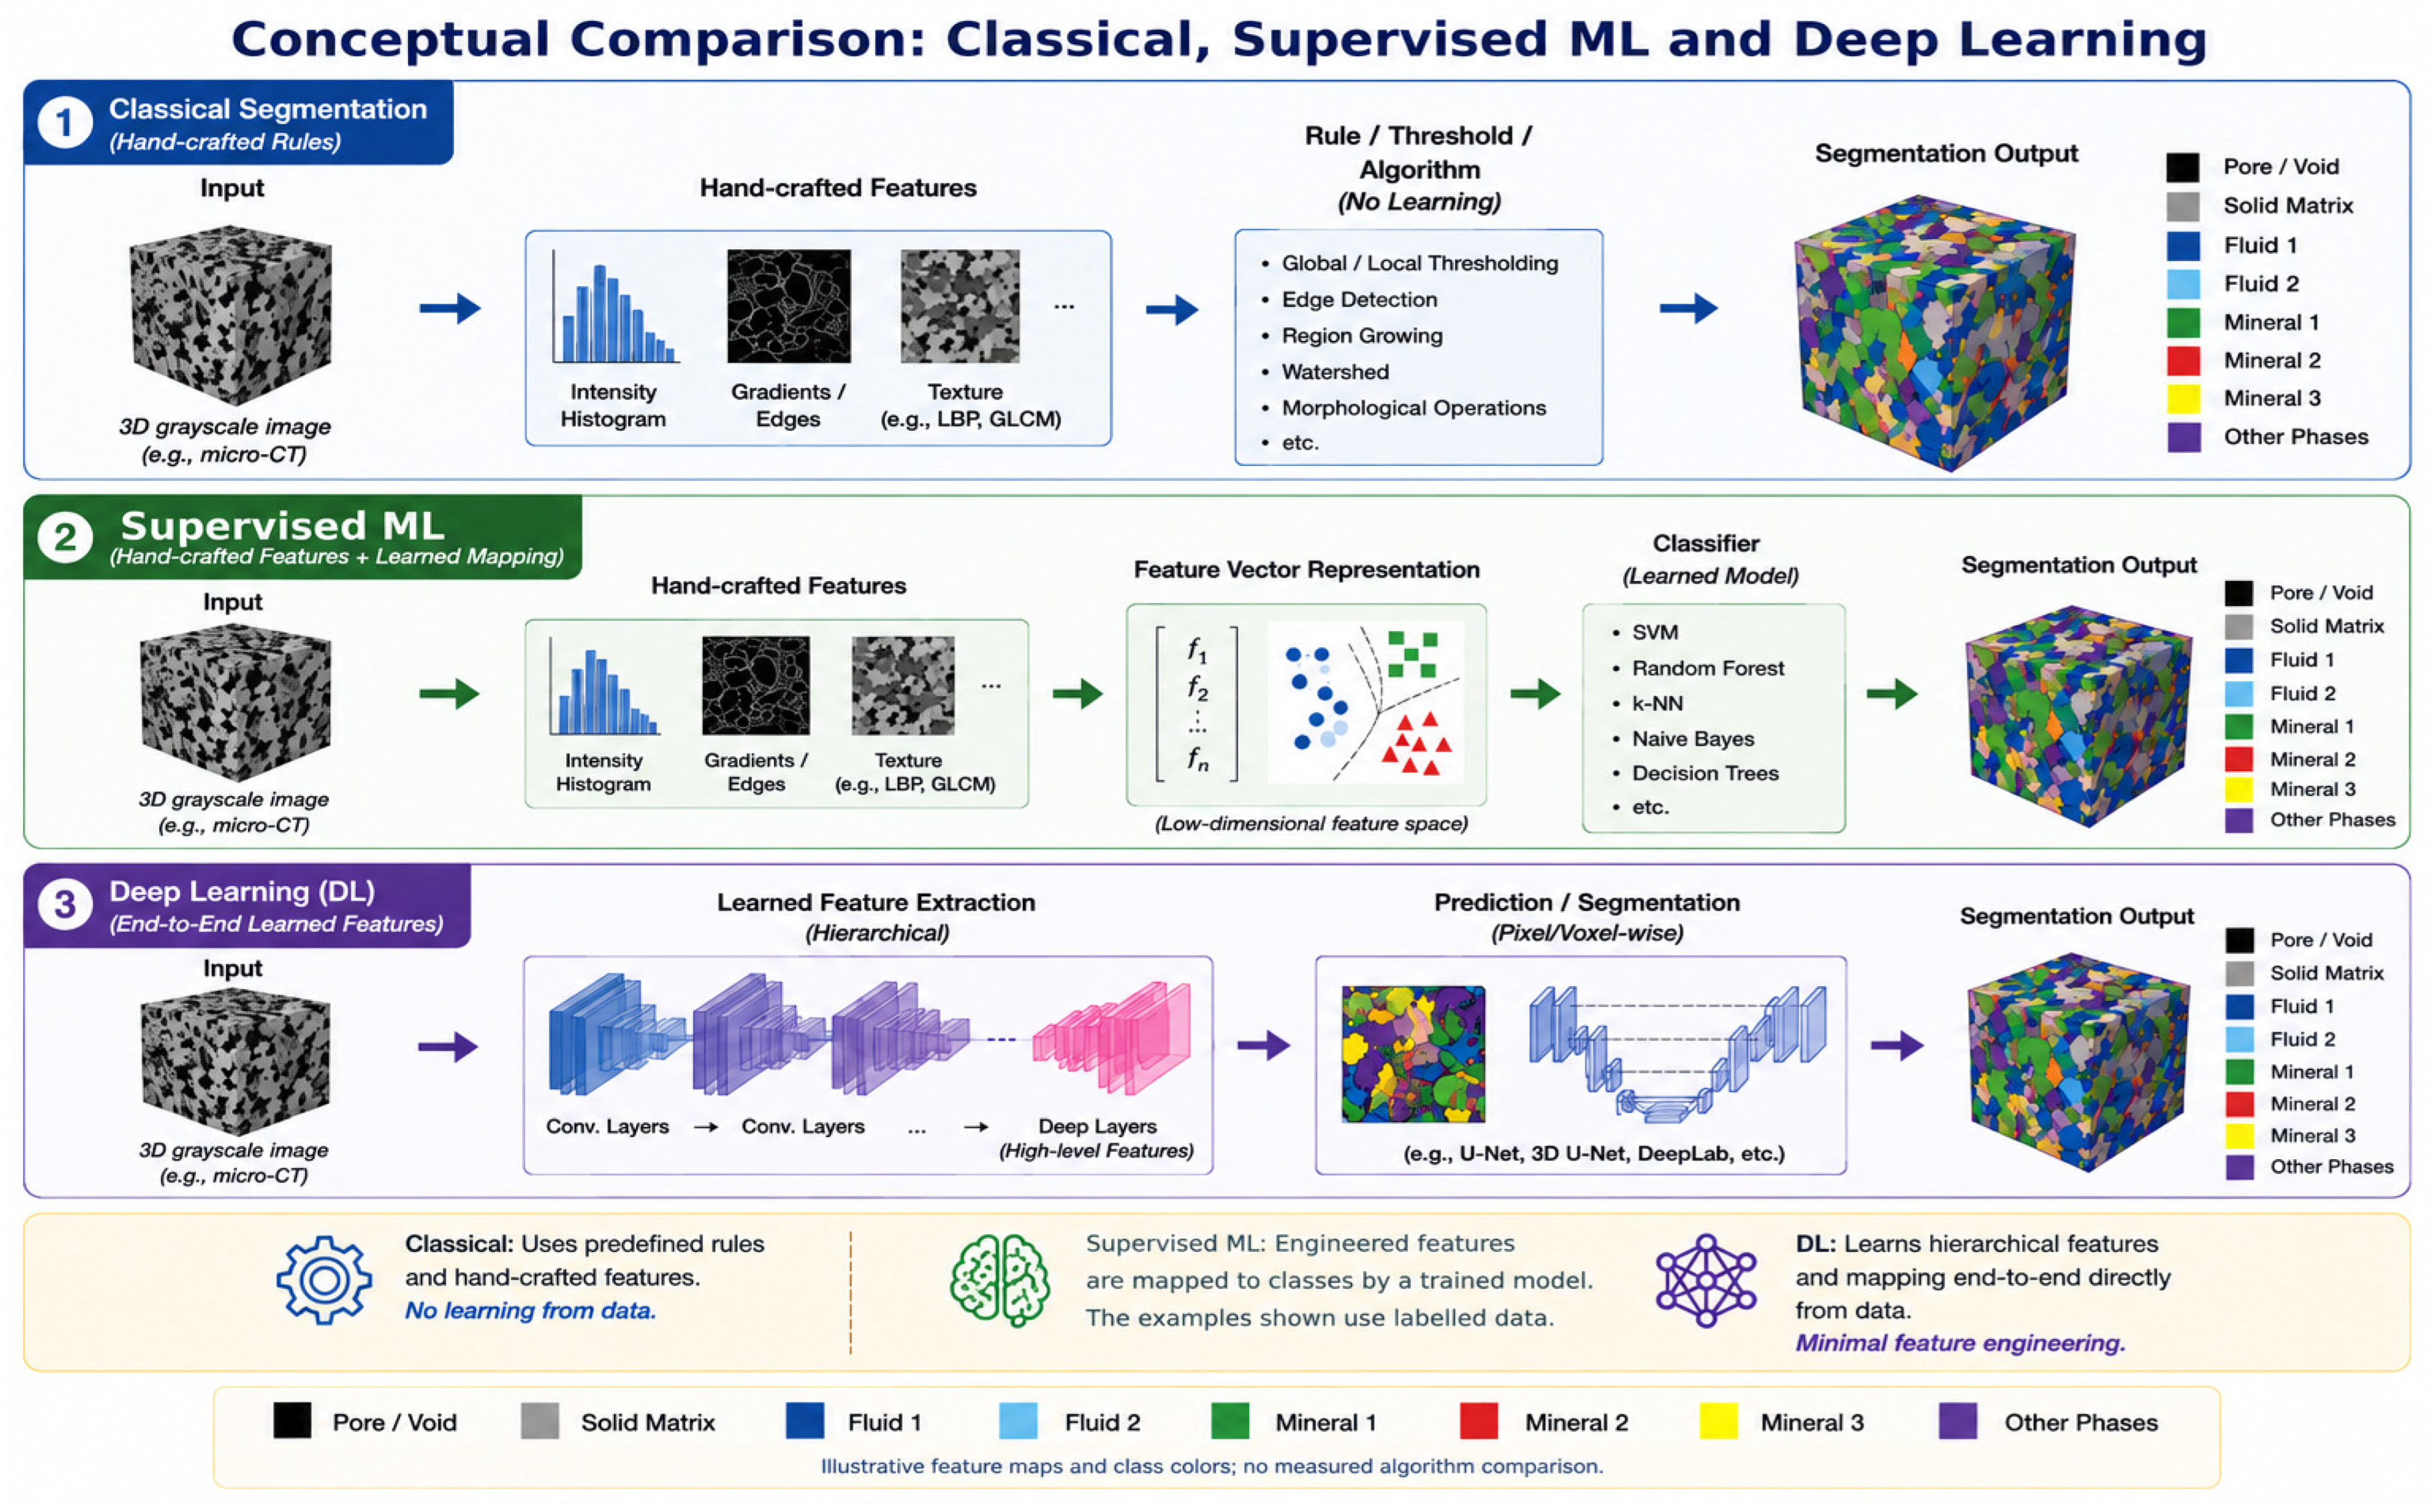
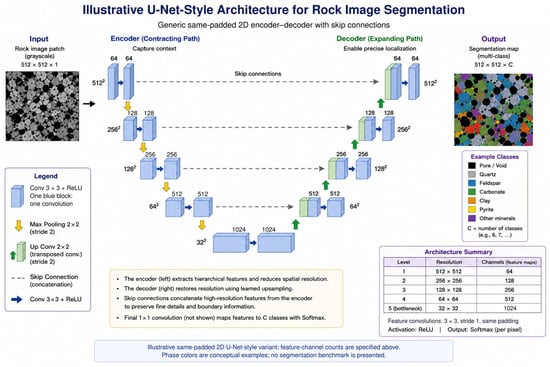
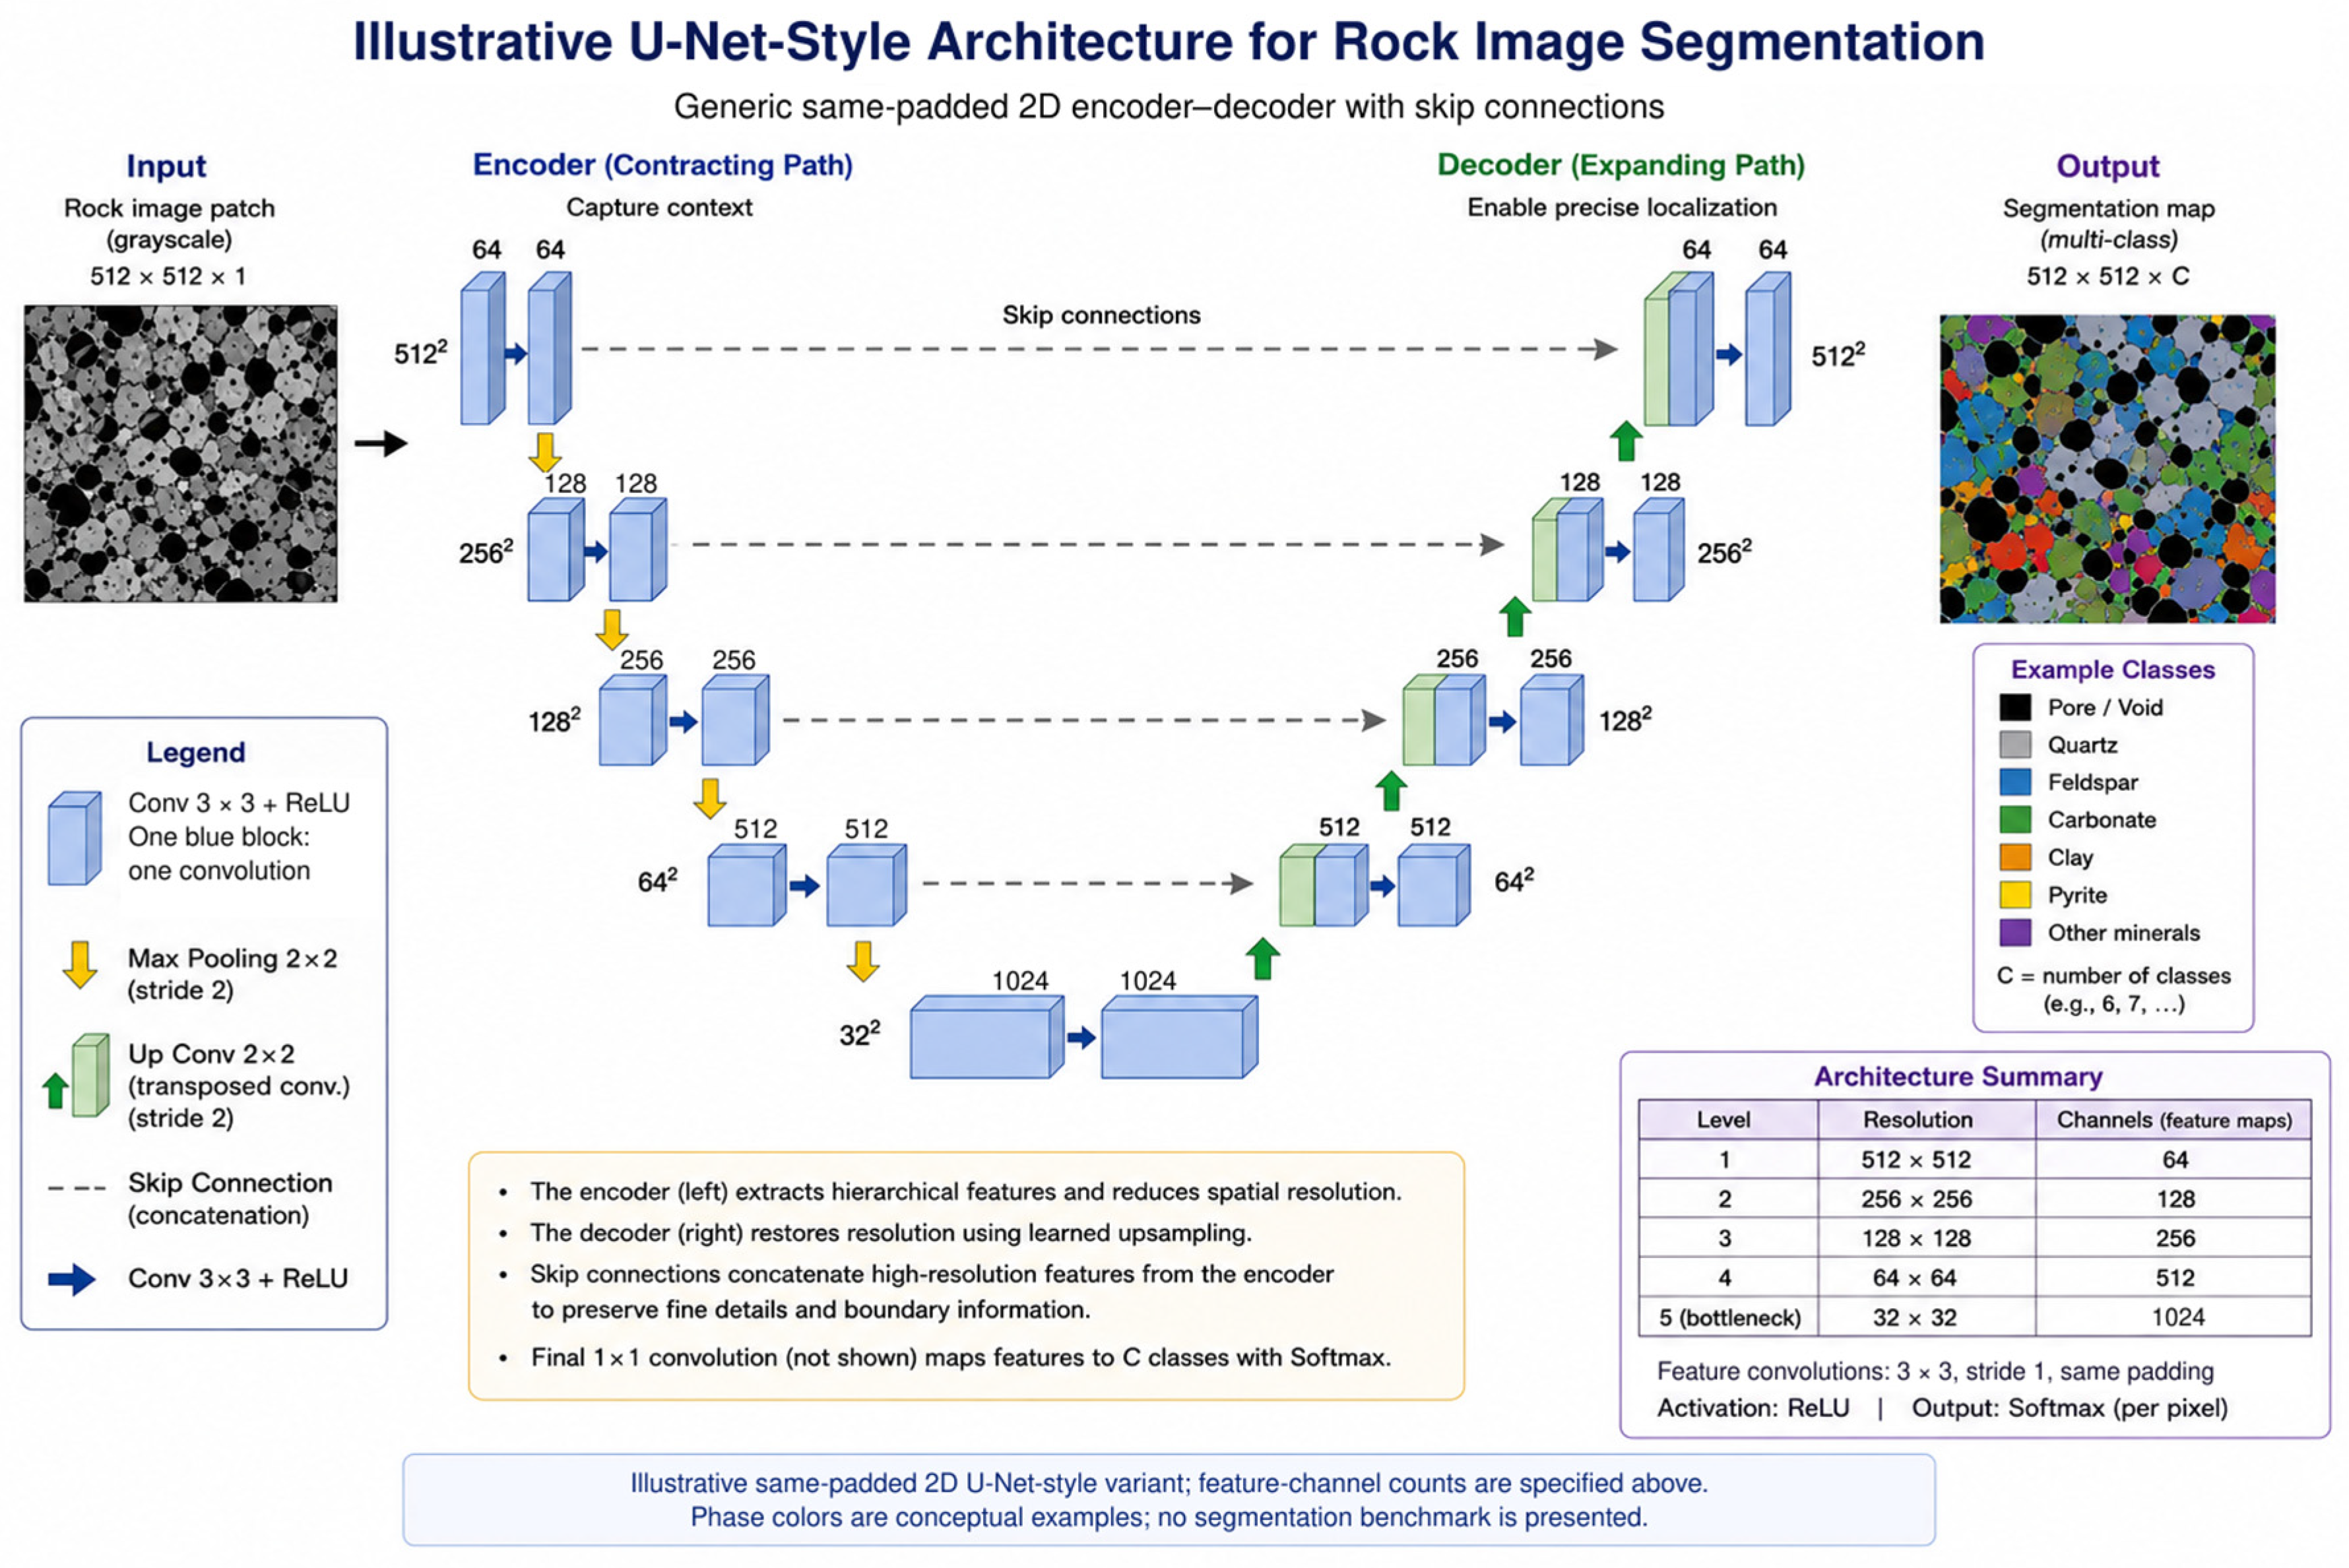
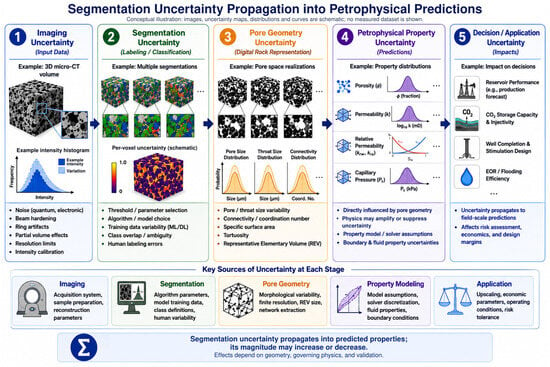
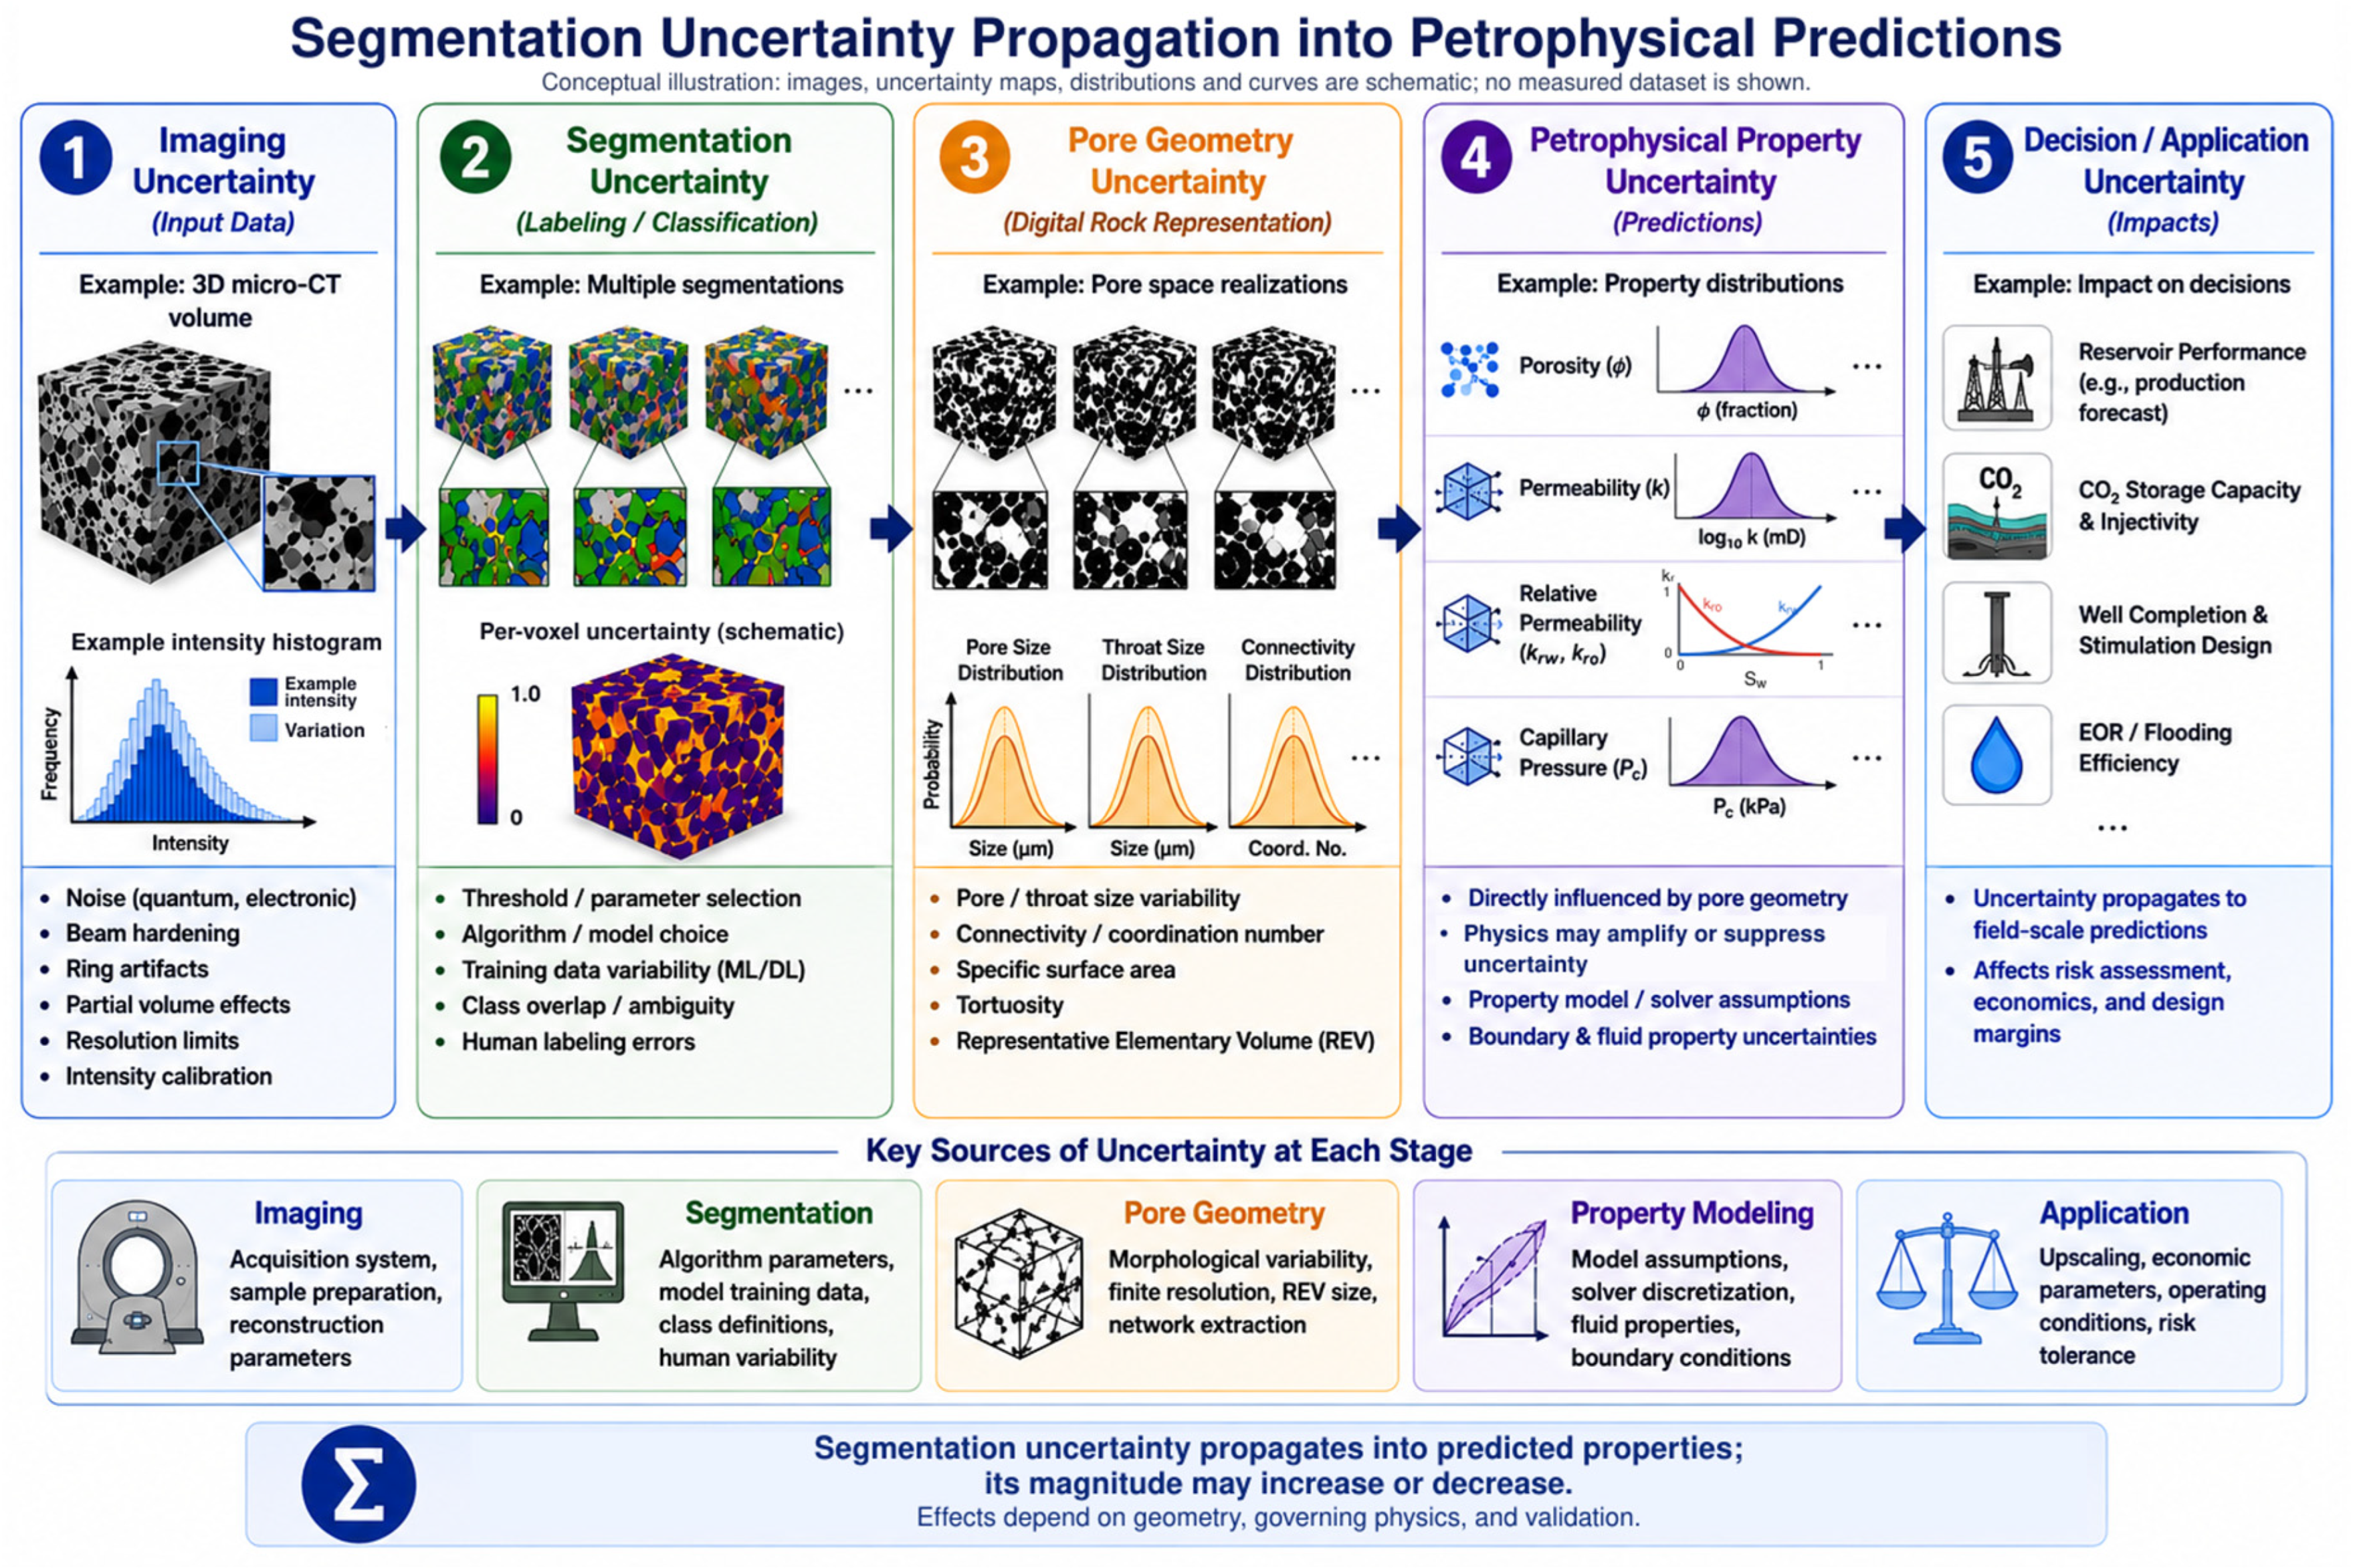
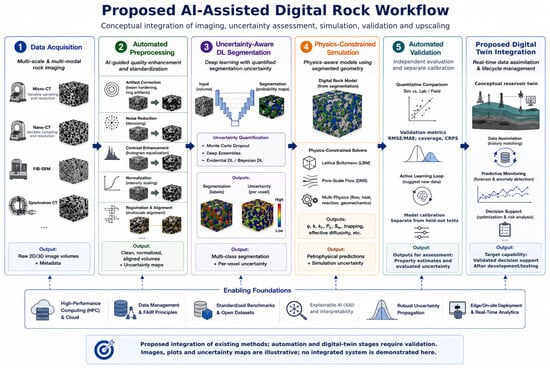
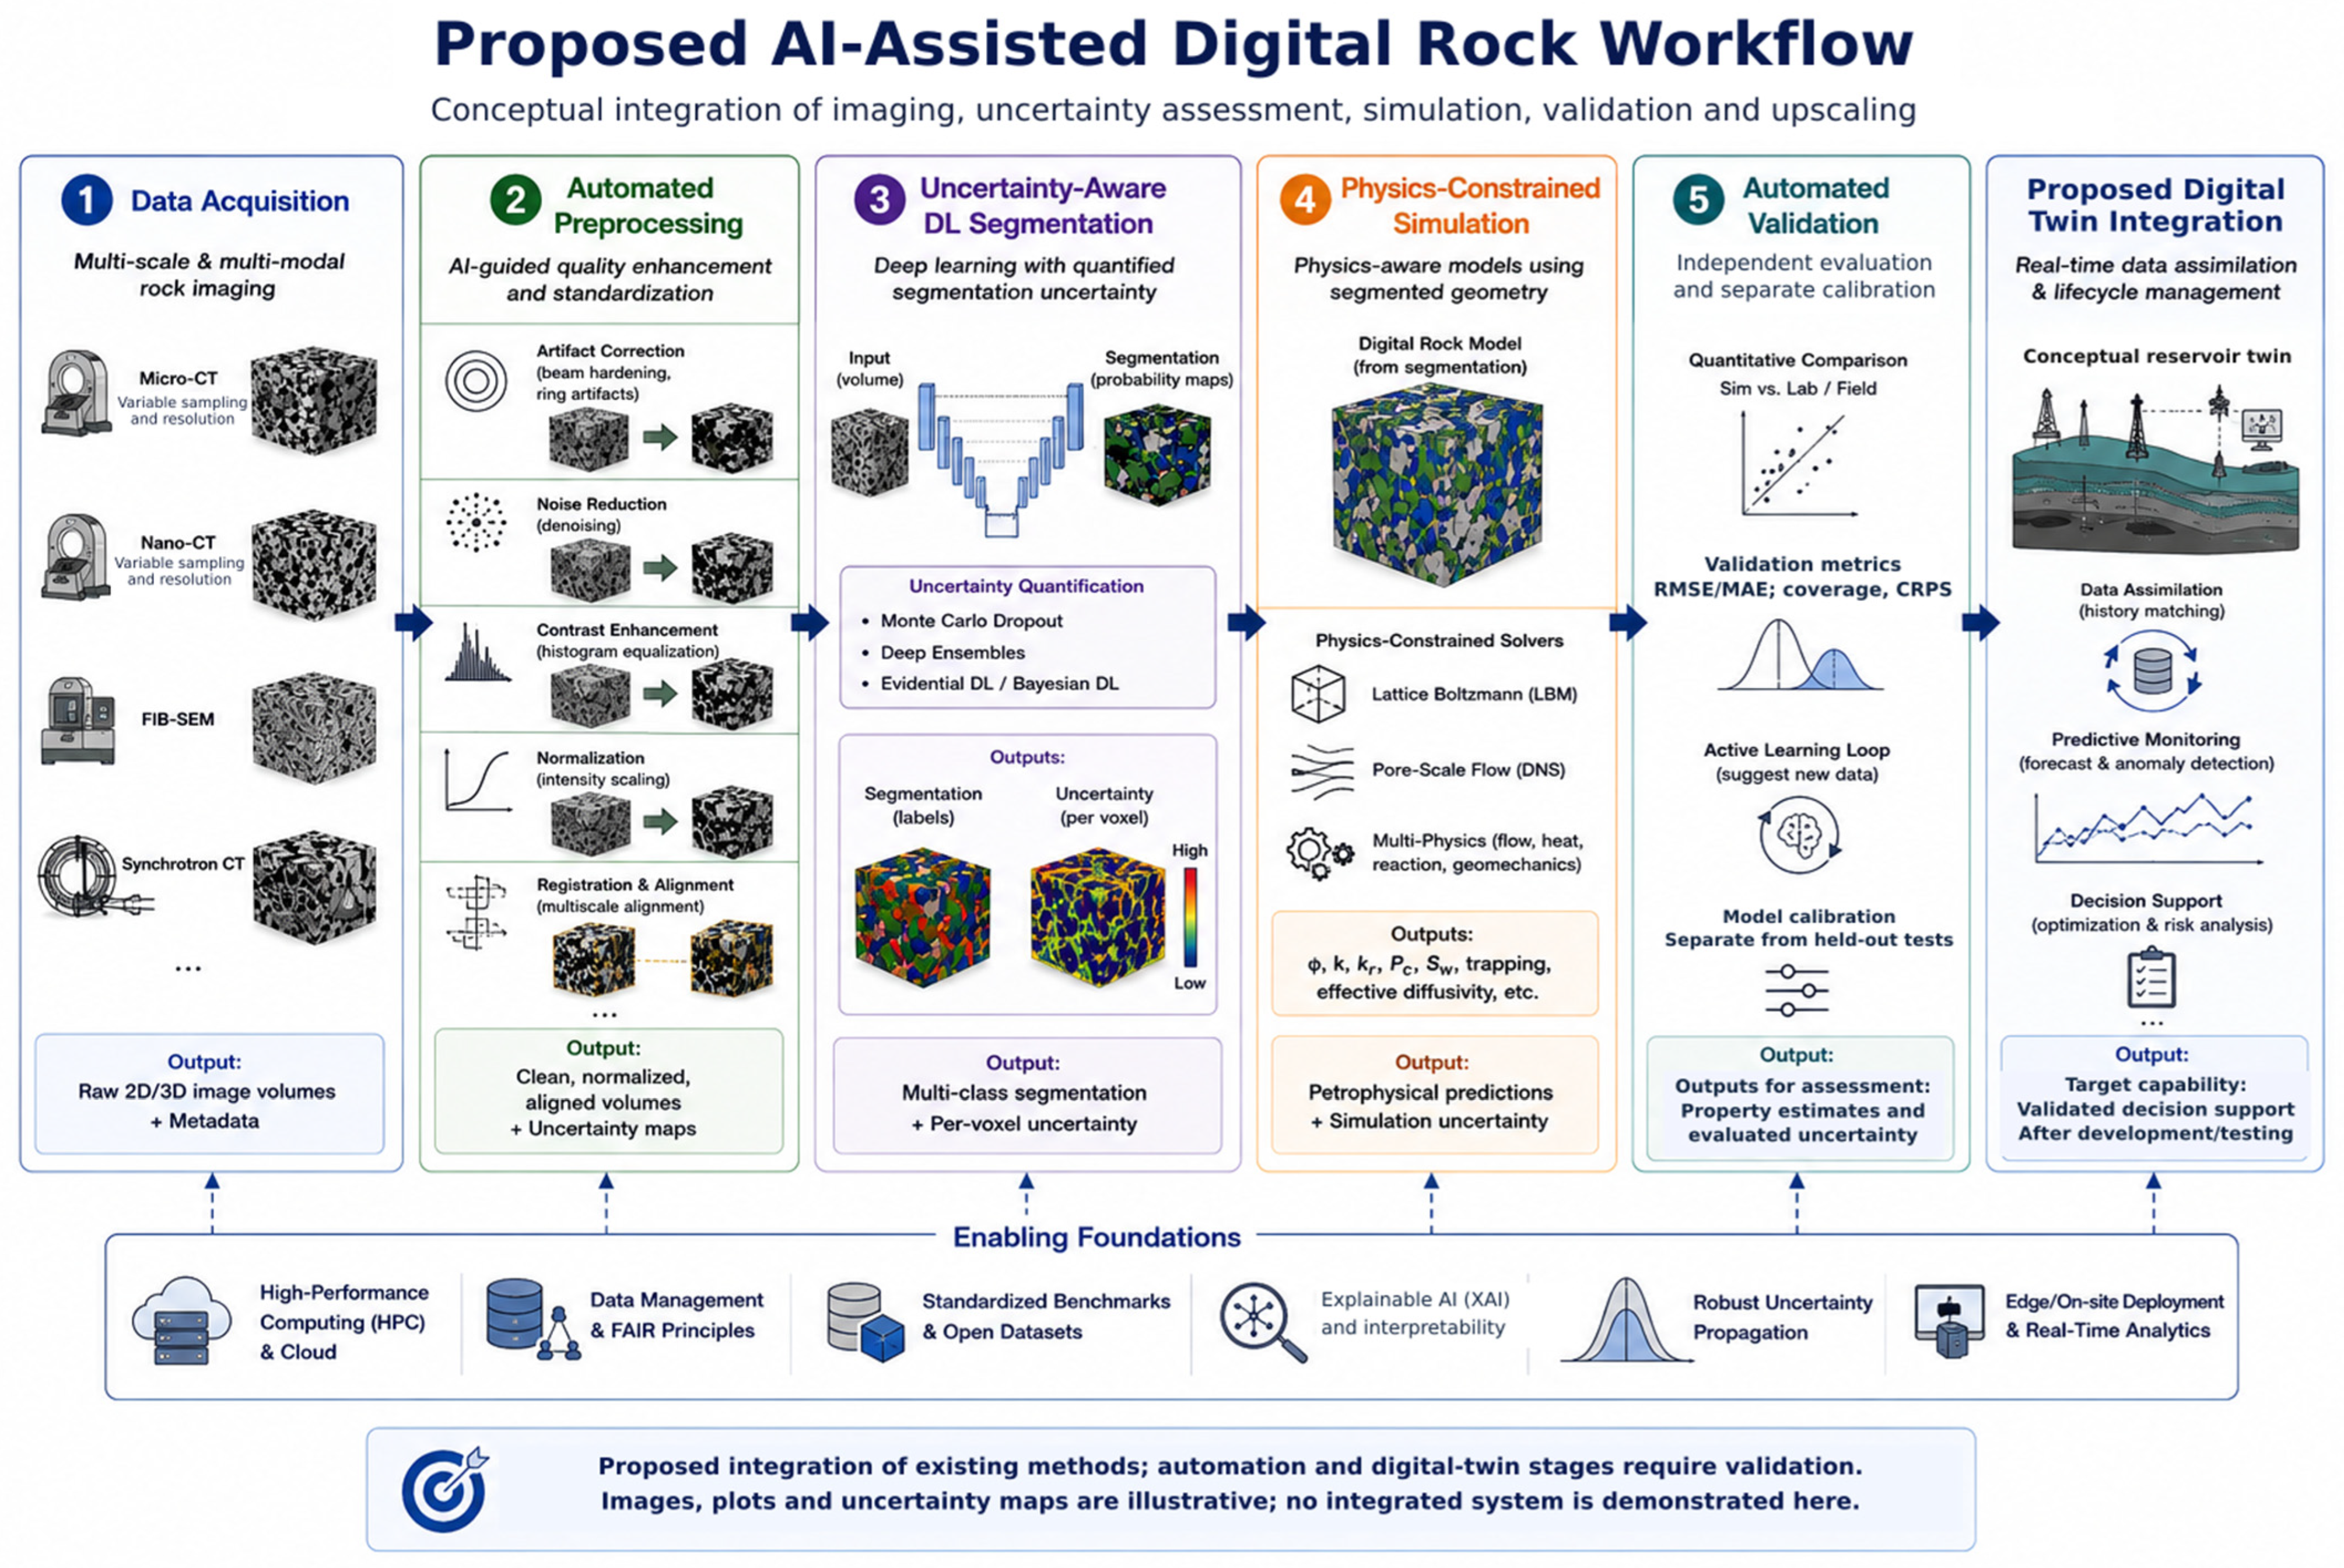

Disclaimer/Publisher’s Note: The statements, opinions and data contained in all publications are solely those of the individual author(s) and contributor(s) and not of MDPI and/or the editor(s). MDPI and/or the editor(s) disclaim responsibility for any injury to people or property resulting from any ideas, methods, instructions or products referred to in the content. |
© 2026 by the authors. Licensee MDPI, Basel, Switzerland. This article is an open access article distributed under the terms and conditions of the Creative Commons Attribution (CC BY) license.