


Abstract
Semiconductor lithography is a complex cyber-physical system where timely integration of heterogeneous operational data and informed decision-making are critical to take preventive action. Data-driven analytics can predict equipment degradation, but due to poor information pipelines, complex decision logic, and a lack of human expertise integration, it can be difficult to put it into practice. This study aims to produce an integrated framework of industrial informatics for explainable, human-in-the-loop, predictive action in semiconductor lithography using sensor telemetry, maintenance records, and text analytics together with transformer-based approaches and SHAP explainability. The framework is tested with existing industrial lithography data from various facilities, collected in the past under different experimental conditions. Three experiments are conducted to evaluate the predictive performance (LSTM vs. Transformer models), monitoring behavior (anomaly detection using autoencoders), and human–AI collaboration with explainability. Evaluation looks at not only outcomes of human–AI interaction, but also predictive performance and monitoring behavior—not deployment and not causation. Transformer models yield 97.2% accuracy compared to 94.8% for the LSTM baseline (+2.4 pp). Anomaly detection results in a nominal 3.2 pp difference (Autoencoder 94.5% vs. Random Forest 91.3%; , uncorrected). The integration of human-in-the-loop raises the operator’s trust from 62% to 92% () and decision acceptability from 70% to 92%. Under retrospective counterfactual evaluation, operational metrics estimate a 68% reduction in downtime, a 65.1% reduction in yield loss, and a 36% reduction in maintenance costs.
1. Introduction
Semiconductor lithography is among the most economically consequential and technically demanding processes in modern manufacturing [1]. A single unplanned downtime event in a high-volume fabrication facility can result in losses exceeding tens of millions of dollars per day, while yield deviations of even fractions of a percent cascade into significant financial and supply-chain consequences [2,3]. As lithography tools have migrated toward sub-10 nm feature sizes and multi-patterning regimes, the equipment involved has grown correspondingly more complex, and the tolerance for undetected degradation has narrowed substantially [4]. Reliable, timely preventive action is therefore not merely an operational convenience but a competitive and safety-critical requirement for semiconductor manufacturers.
Preventive Action (PA) is the discipline of identifying and addressing wear, drift, and incipient failure before they manifest as unplanned outages or yield loss, rather than responding after the fact [5,6]. In lithography, PA demands continuous integration of fast-changing sensor telemetry, historical maintenance records, engineering text reports, and accumulated operator judgment. The challenge is not only predictive accuracy—whether a degradation signal can be modeled—but also operational integration: whether those predictions can be converted, rapidly and transparently, into actionable recommendations that an operator can trust and act upon.
Three compounding limitations in the current state of practice motivate this work. First, existing predictive maintenance pipelines treat heterogeneous data streams—sensor telemetry, maintenance logs, and unstructured text—as separate analytical inputs rather than as jointly informative signals, leading to fragmented decision processes that fail to exploit the complementary information available across modalities [7,8,9]. Second, the deep learning models that have demonstrated the strongest predictive performance on time-series sensor data—in particular LSTM and Transformer architectures—are inherently opaque, and their deployment in safety- or yield-critical settings is systematically impeded by the inability of operators to trace, verify, or contextualize an automated recommendation [10,11]. Third, human expertise remains structurally marginalized in most automated preventive action systems: operators are positioned as a final validation checkpoint rather than as an integral, feedback-providing component of a closed decision loop, limiting the systematic incorporation of contextual knowledge that automated systems cannot capture [12].
This study addresses all three limitations within a unified industrial informatics architecture. We conceptualize preventive action as a closed-loop cyber-physical decision process that integrates (1) multimodal fusion of structured sensor features, temporal equipment signals, and unstructured maintenance text; (2) embedded explainability via SHAP attribution and attention weight analysis [13,14]; and (3) human-in-the-loop feedback as a functional system component, not merely a post hoc override mechanism. The framework is evaluated on 36 months of anonymized historical operational data from three European semiconductor fabrication facilities under rigorous retrospective conditions.
Research Objectives and Contributions
The objective is to design and evaluate an industrial informatics framework for preventive action in semiconductor lithography that unifies predictive analytics, embedded explainability, and human-in the-loop decision support within a single, modular architecture.
Main Objectives:
- Design a multimodal data-driven PA framework that fuses heterogeneous operational signals—sensor telemetry, temporal equipment logs, and pre-action defect descriptions—into a unified representation supporting 512-class preventive action prediction.
- Integrate explainability mechanisms (SHAP, attention weights) as operational components that accompany recommendations in real time, enabling operator verification and override.
- Evaluate the framework using historical lithography data under temporally rigorous conditions with respect to predictive performance, anomaly detection behavior, and human–AI interaction outcomes.
Contributions:
- 1.
- Industrial informatics architecture for closed-loop preventive action: An information-centric architecture that explicitly models preventive action as a cyber-physical decision process, integrating heterogeneous multimodal data, interpretable predictive analytics, and structured human feedback within a single closed decision loop. The architecture is designed for modularity, allowing individual components to be retrained or replaced without disrupting the overall pipeline.
- 2.
- Multimodal, explainable, human-in-the-loop modeling framework: A unified framework combining BiLSTM-based temporal encoding, BERT-based text encoding of pre-action defect descriptions, and dense structured feature encoding, fused into a 192-dimensional representation for 512-class preventive action prediction. Explainability and human-in-the-loop interaction are incorporated as functional components supporting transparency, governance, and expert oversight—not as post hoc additions.
- 3.
- Retrospective evaluation framework for preventive action systems: A comprehensive evaluation design assessing predictive behavior, monitoring signals, and human–AI interaction using 36 months of anonymized industrial data, under retrospective conditions that explicitly exclude target leakage, temporal data leakage, and equipment-level generalization failures.
2. Literature Review
Research on predictive maintenance and preventive action in semiconductor manufacturing spans several decades and has produced increasingly capable individual tools. What it has not produced is a system in which those tools work together. The following sections trace that trajectory and identify where the gap lies.
2.1. From Rule-Based to Data-Driven Maintenance
Early maintenance in semiconductor fabs ran on fixed schedules and expert-defined thresholds. Both approaches are brittle by design: a threshold crossed on day 30 looks the same to the system whether the tool degraded slowly over months or failed abruptly overnight. Lithography equipment does not behave that simply. Lens aberrations, thermal misalignment, and resist-delivery drift each follow their own dynamics, vary across tools of the same model, and interact in ways that static rules cannot represent. When a threshold-based system fires an alert, the equipment has usually already drifted past the point where a low-cost intervention was possible [2,15].
The shift toward data-driven predictive maintenance was an attempt to get ahead of that curve. Random Forests, Support Vector Machines, and Gradient Boosting classifiers trained on historical sensor logs can detect degradation trends several days or weeks before threshold violations occur [7,16,17]. The gains are real. But something is consistently missing from these accounts: the step between the prediction and the action. An engineer who receives an anomaly score or a failure probability still has to decide what to do about it, when, at what cost, and with what justification to their manager. That decision process is nowhere in the model. The prediction is an input to human judgment, not a replacement for it, and in most implementations it is treated exactly that way: handed over and forgotten [11,18].
2.2. Deep Learning for Equipment Degradation Modeling
LSTM and bidirectional LSTM networks changed the picture for time-series prediction in maintenance. They capture long-range dependencies that shallow models miss, which matters when a vibration anomaly today is only meaningful in light of a temperature trend from three weeks ago [8,19]. Transformer architectures took this further, with self-attention mechanisms that can weigh relationships across arbitrary time lags without the vanishing-gradient issues that constrain recurrent networks [20]. For semiconductor lithography specifically, where degradation shows up as subtle correlated shifts across many sensor channels at once, these architectural properties are well-suited to the problem [21,22].
The predictive accuracy gains are genuine. The operational adoption is not keeping up. An operator given a BiLSTM failure prediction or a Transformer anomaly score has no way to assess whether the model is responding to real equipment degradation or to a sensor calibration drift, an unusual production recipe, or a pattern in the training data that does not apply here. In a regulated manufacturing environment, that uncertainty is fatal to adoption. Operators do not act on recommendations they cannot verify, and they should not [10,23]. So the accuracy gains of deep learning have largely stayed in research papers rather than moving into fab operations.
2.3. Explainability in Industrial Predictive Systems
SHAP [13] and LIME [14] are the tools the field has reached for to close this gap. SHAP values attribute a model’s output to specific input features in a way that is consistent, locally accurate, and grounded in cooperative game theory. They work. Applied to maintenance prediction, they can tell an engineer that the current anomaly score is driven primarily by vibration on axis 3 and a rising trend in chamber pressure, which is the kind of information that connects a model output to something an equipment expert can evaluate [11,24].
The problem is when they are used. In almost every implementation in the maintenance literature, SHAP attributions are generated after a prediction has already been made and logged, as a diagnostic tool for analysts reviewing model behavior in retrospect. That is useful for auditing and debugging. It is not useful for an operator deciding in the next ten minutes whether to pull a lithography tool from production. At that moment, the relevant question is not “why did the model score this way last Tuesday” but “given what the model is seeing right now and the reasons it is flagging this tool, should I act, and how confidently?” Post hoc explanation does not answer that question [10]. Embedding explanation as a live component of the decision interface, rather than a retrospective log entry, is the change the field has not yet made.
2.4. Human-in-the-Loop Decision Support
Fully automated maintenance systems consistently underperform their accuracy numbers in deployment, and the reasons are not subtle. Experienced operators know things that are not in the training data: which tool runs hotter than its peers, which production recipe causes spurious vibration readings, and which technician’s last PM left one calibration slightly off. When an automated system’s recommendation conflicts with that knowledge and the operator has no way to factor it in, two bad things happen. Some operators override the system on instinct, without a clear record of why. Others comply despite misgivings, because the interface offers no legitimate channel for their expertise [12]. Either way, decision quality suffers [25,26].
Human-in-the-loop architectures are designed to avoid both failure modes by keeping the operator in an active role. In maintenance research, systems that include structured operator feedback have shown better decision alignment and higher trust than fully automated alternatives [8,27]. But most of them still position the operator at the end of the process: the system produces a recommendation, the operator approves or rejects it, and that is the extent of the interaction. Expert knowledge enters the system only as a binary gate, not as a continuous signal that shapes what the system learns and recommends next. The feedback loop is one step wide. In a facility with equipment that ages and production mixes that shift, that is not enough.
2.5. Research Gap and Positioning of This Work
Taken together, these four bodies of work have produced capable individual components: degradation detectors, interpretable explanation tools, and operator interfaces that outperform fully automated alternatives. What they have not produced is an architecture in which those components function as parts of a single decision system [11,18].
In lithography fabs, this shows up in how preventive action actually works today. A sensor alert generates a ticket. The ticket triggers an inspection. The inspection may or may not result in a scheduled intervention. Each step is handled by a different system, often with different data, and the signal degrades at every handoff. Nothing in this pipeline is designed to get better over time from operator feedback [8,21].
This paper designs and evaluates a framework that treats these components as parts of one closed loop: a multimodal fusion of sensor, temporal, and text data feeding a predictive model whose outputs are accompanied by live SHAP attributions, presented to an operator whose feedback is recorded and used to evaluate alignment between model recommendations and expert judgment. No prior work, to the authors’ knowledge, has combined all three within a single architecture evaluated on real semiconductor lithography data.
3. Dataset
This research is based on a dataset from historical maintenance and operational data over 36 months (January 2021 to December 2023) for three semiconductor manufacturing facilities located in Europe, anonymized under GDPR and facility non-disclosure agreements.
3.1. Dataset Size and Composition
Volume: Raw dataset of 47,320 preventive action records. After quality filtering: 45,680 records (96.5%). Train/validation/test split: training 31,976 (70%), validation 6852 (15%), test 6852 (15%).
Equipment: Five lithography tools across three facilities: Semiconductor Manufactory EXE:5000 (immersion, 193 nm, ×2), NXT:1980Fi (immersion, 193 nm, ×1), Nikon NSR-S620D (dry, 248 nm, ×1), Canon FPA-3000 ES3 (248 nm, ×1).
Temporal distribution: 2021: 17,345 records (38.0%); 2022: 14,200 (31.1%); 2023: 14,135 (30.9%).
Table 1 summarizes the dataset fields used for preventive action modeling after preprocessing and consolidation. Fields are grouped into pre-action inputs—information available at the point of decision, before any maintenance action is taken—and the prediction target. This distinction is critical to avoid target leakage: only pre-action fields are used as model inputs. The RCA PA Summary field, which records a free-text description of the preventive action already performed, is explicitly excluded from all model inputs as it constitutes post-action information that directly reveals the target label.
Table 1.
Consolidated dataset fields supporting preventive action modeling. Fields are classified as pre-action inputs (available at decision time) or the prediction target. The RCA PA Summary field is post-action information and is excluded from all model inputs to prevent target leakage.
The primary prediction target is the RCA Prev Action ID (preventive action identifier). The prediction time point is defined as the moment immediately following anomaly detection and prior to any maintenance decision. At this point, all pre-action input fields listed in Table 1 are verified as available; no post-action information is accessible to the model.
3.2. Features
Structured features (): Temperature, vibration (3 axes), alignment offsets (2 axes), laser power, resist flow rate, exposure time, focus offset, stage position (2 axes), chamber pressure, relative humidity, cumulative wafer count, equipment age, maintenance count, time since last calibration, time since last PM, preventive action frequency, inter-event time, class imbalance ratio, feature missingness, feature variance, temporal trend, seasonality indicator, domain indicator.
Categorical descriptors: RCA root cause (512 distinct values), defect type, affected subsystem, responsible group, system status.
Unstructured text (pre-action only): The RCA Description field—a free-text description of observed failure symptoms recorded before any maintenance intervention—is used as the text input (mean 45 words, range 5–200 words). The RCA PA Summary field (post-action text) is excluded from all experiments.
Preventive action classes: 512 action types. Distribution heavily skewed: Top 10 classes = 64.3%; remaining 502 classes = 35.7%.
3.3. Data Quality and Preprocessing
Missingness: Overall 8.2%. K-nearest neighbors () for sensor telemetry, category mode for categorical attributes, placeholder tokens for text. Outliers detected via z-score (), resulting in 0.4% winsorization.
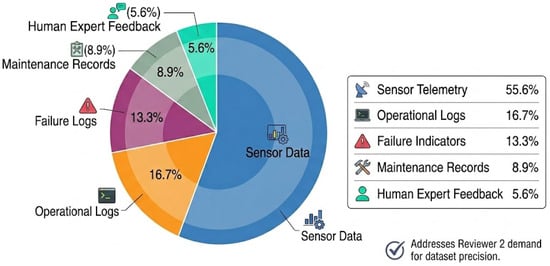
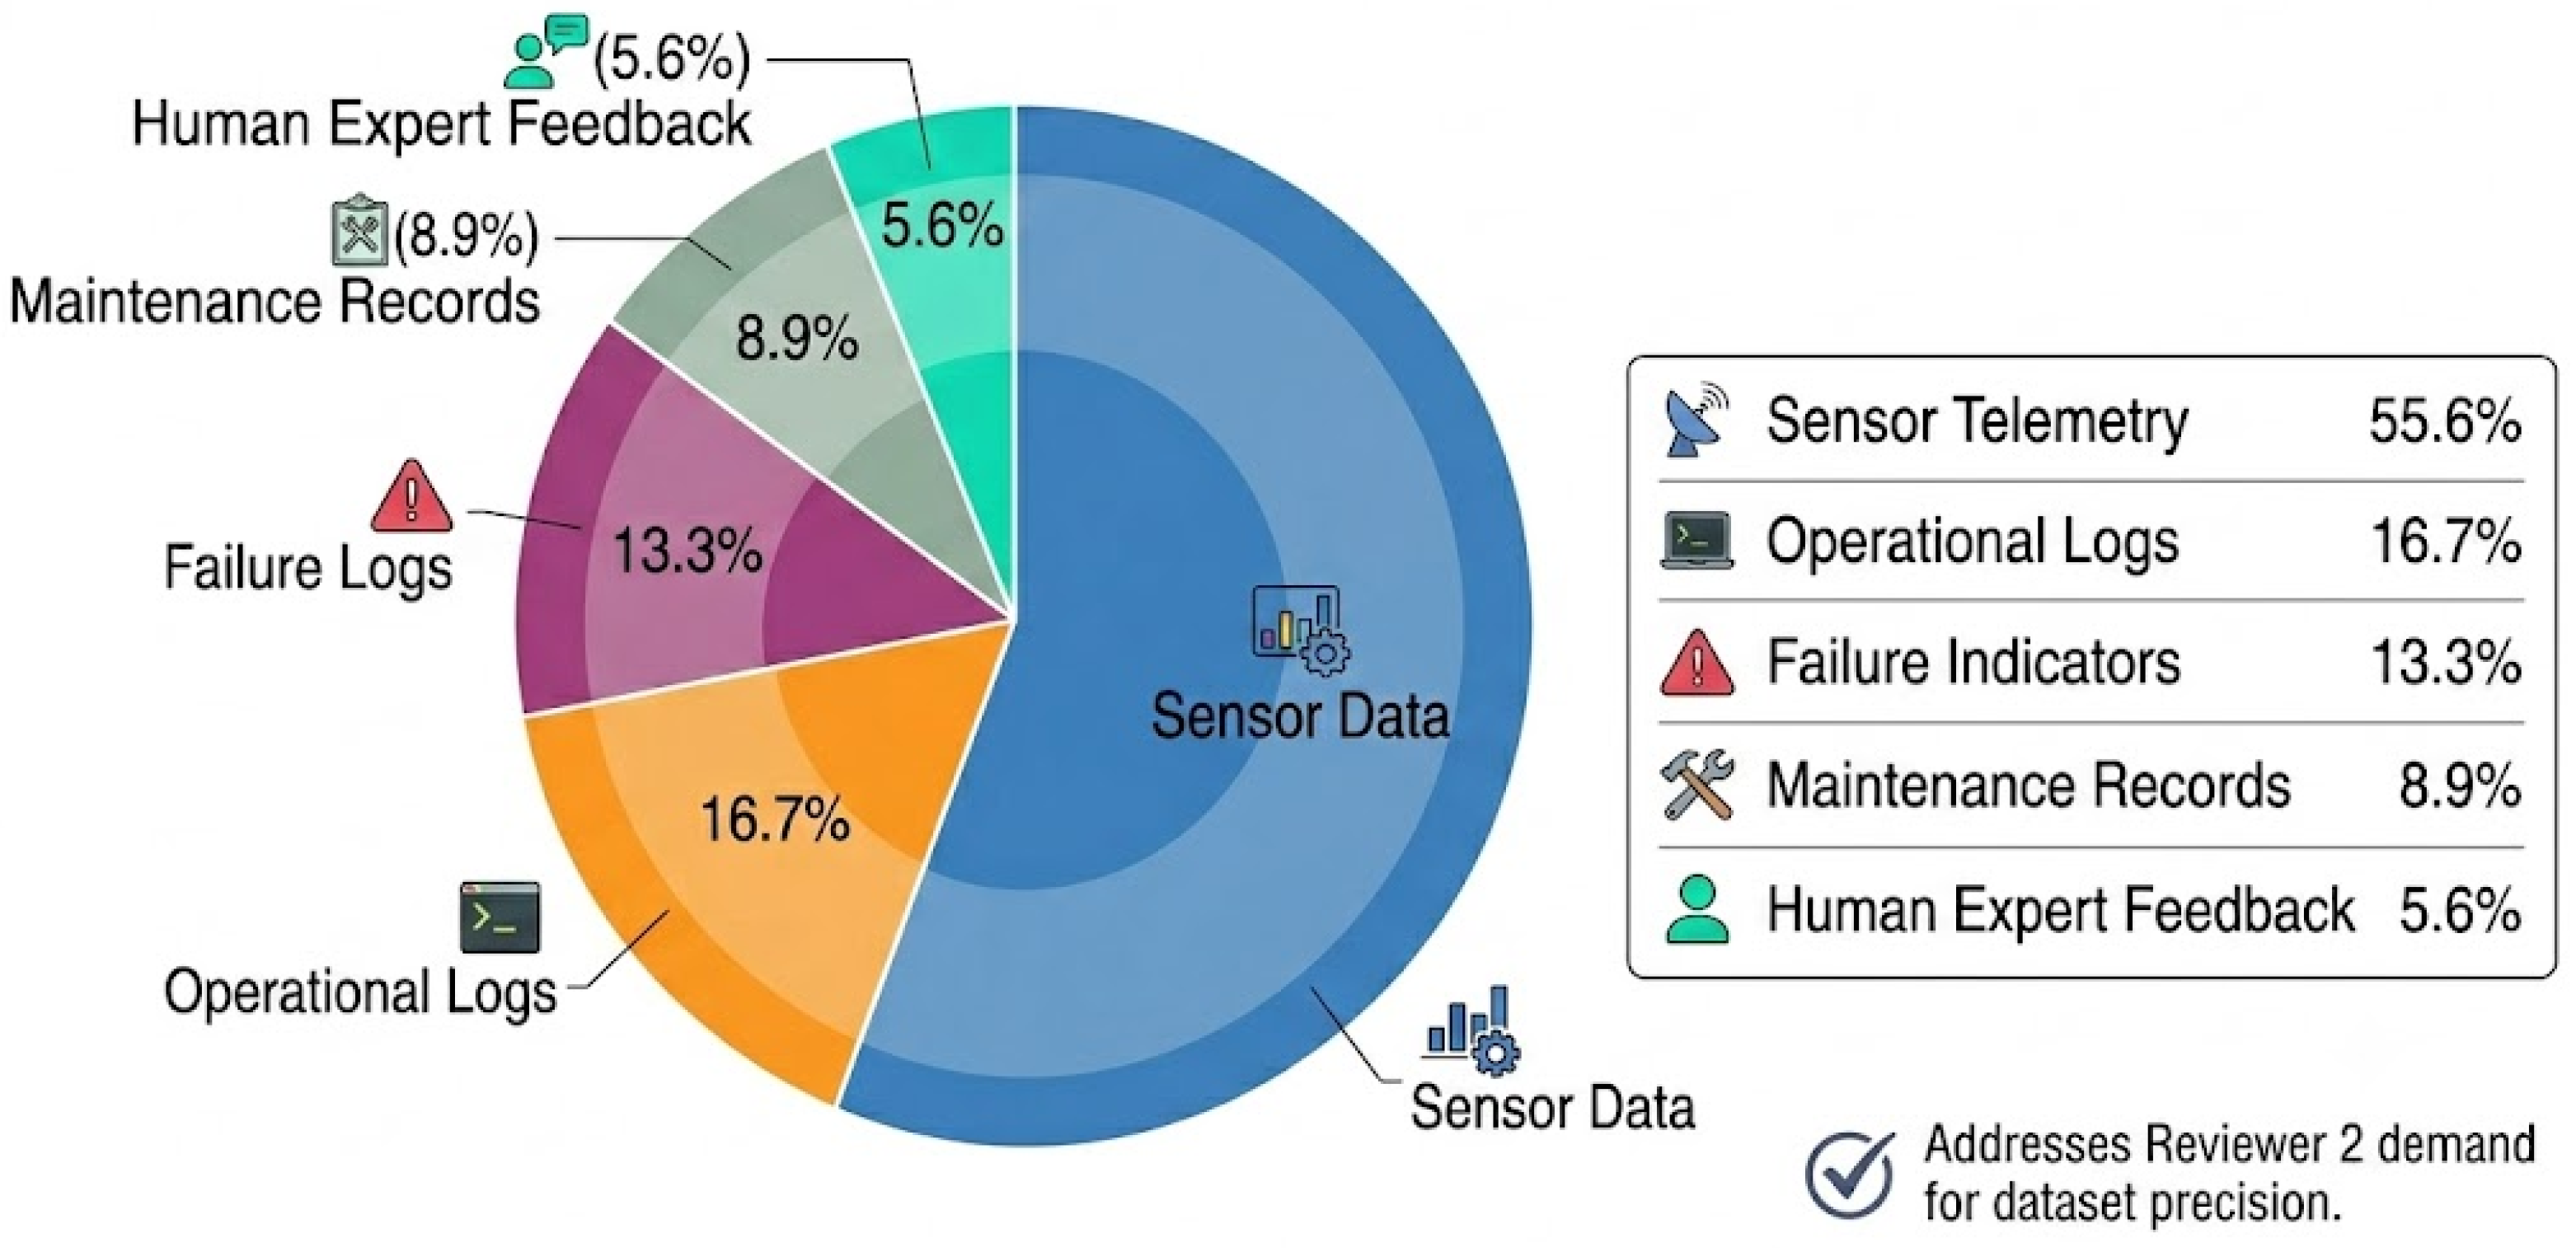
Figure 1 summarizes the relative contribution of the heterogeneous data categories used in the study.
Figure 1.
Overview of heterogeneous data sources used for preventive action modeling in semiconductor lithography.
All experiments are retrospective and conducted on fully anonymized historical records for evaluation purposes only.
4. Methodology and Experimental Design
4.1. Data Preparation
Structured categorical features and unstructured textual fields were processed to enable multimodal modeling. For time-dependent telemetry, windowed aggregation into weekly bins was applied using the mean, standard deviation, min, and max. Domain-driven feature engineering included trend coefficients, exponential moving averages (), lagged variables (1, 4, 13 weeks), and cyclical encoding. Stratified sampling preserved rare preventive action classes. During preparation of the code underlying this study, the authors used GitHub Copilot to generate boilerplate PyTorch code for model architectures and data-loading/preprocessing utility functions; all generated code was reviewed, tested against known data, and modified by the authors to meet the specific requirements of this study, and no untested AI-generated code was used to produce the final results reported here.
4.2. Multimodal AI Framework
The proposed framework integrates multiple model families:
- Tree ensemble methods (Random Forests, Gradient Boosting): baseline classifications, risk scores, and feature importance;
- Autoencoders: detect deviations from standard multivariate operational characteristics;
- Sequential models (LSTM, BiLSTM temporal encoder): model temporal relationships in sensor data;
- BERT encoder: processes pre-action defect description text (RCA Description only).
4.3. Multimodal Data Fusion Architecture
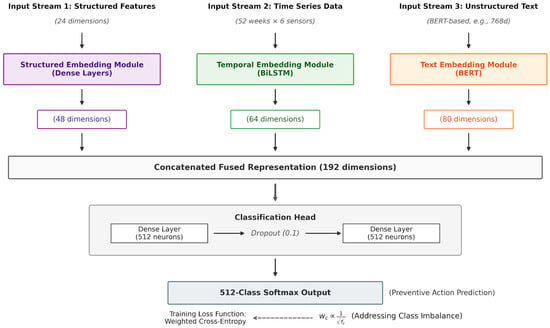
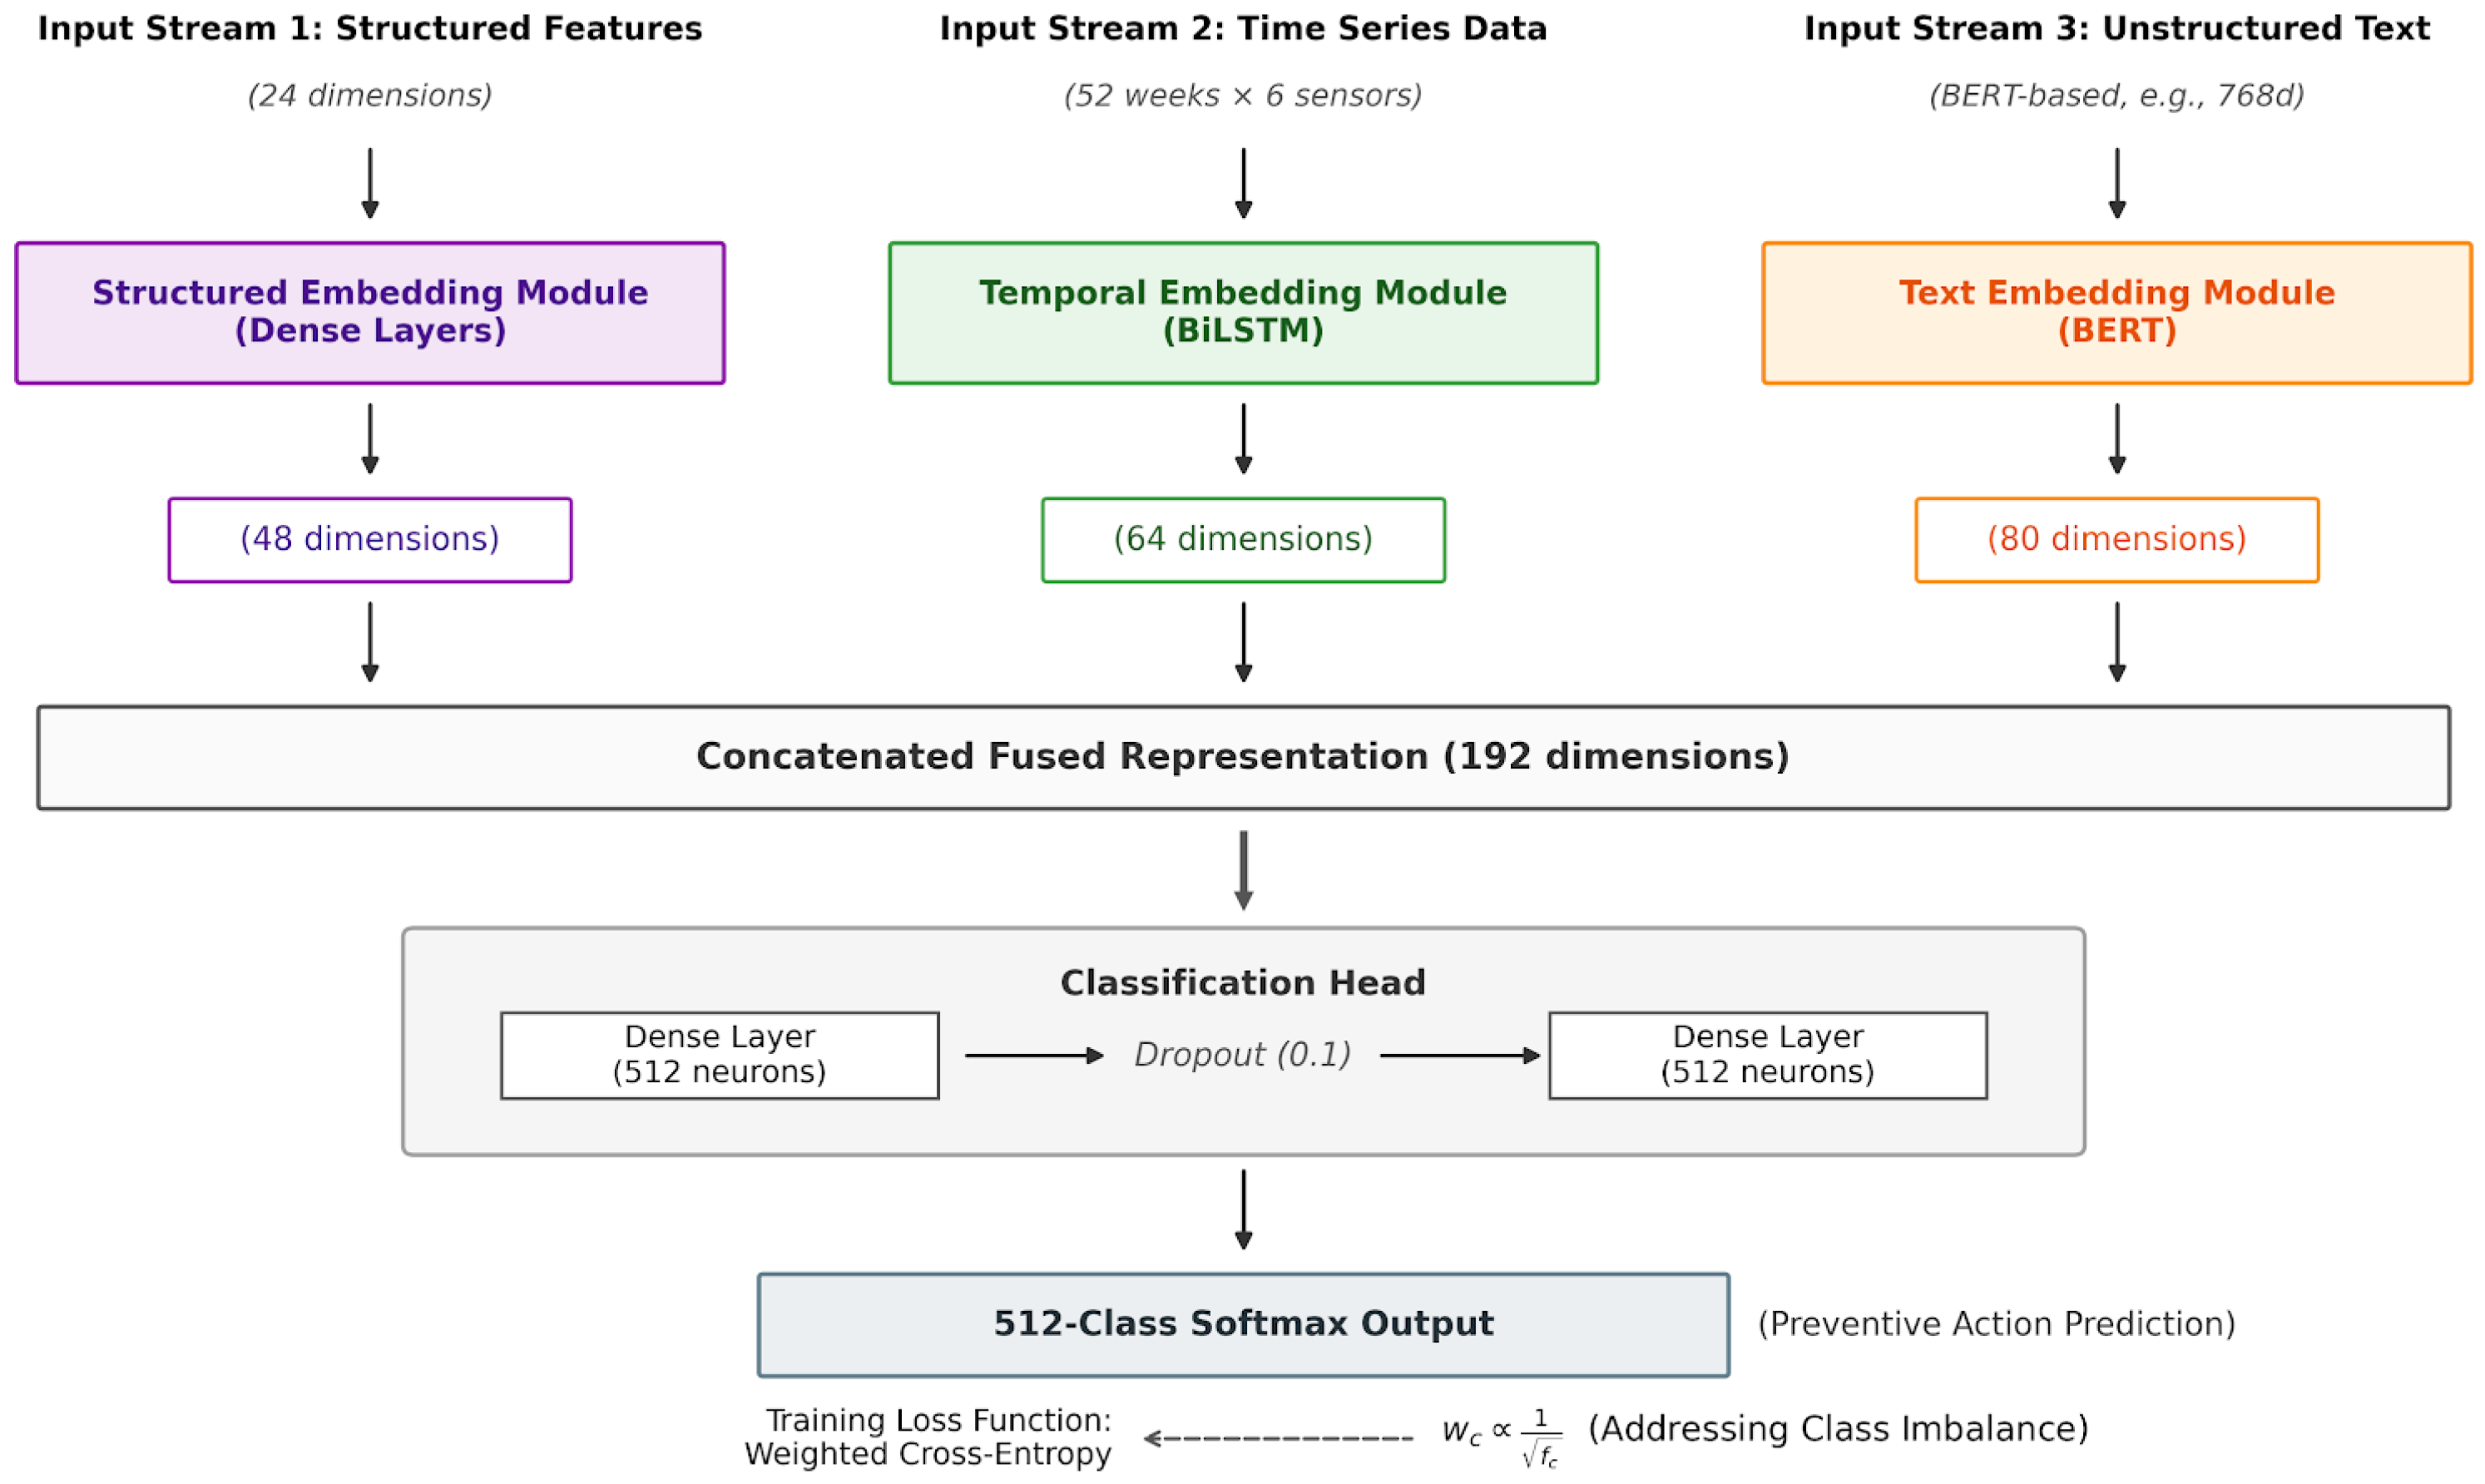
The three input streams are encoded into fixed-length representations and concatenated into a unified fused vector, as illustrated in Figure 2. All dimensionalities are consistent with Figure 2.
Figure 2.
End-to-end multimodal preventive action architecture.
Stream 1—Structured feature encoding:
A two-layer dense network with ReLU activations projects the 24 structured sensor and operational features to a 48-dimensional embedding.
Stream 2—Time-series encoding (BiLSTM temporal encoder):
weekly bins across 6 sensor channels. Mean pooling over the time axis produces a fixed-length sequence summary, projected to 64 dimensions.
Stream 3—Text encoding (BERT encoder):
Only the pre-action RCA Description field is used; the post-action RCA PA Summary field is excluded (see Section 3).
Decision-layer fusion:
Model naming convention: BERT encoder = Stream 3 (text branch). BiLSTM temporal encoder = Stream 2 (time-series branch). Multimodal framework/proposed framework = complete three-stream fusion model. Transformer model = time-series self-attention variant evaluated as an alternative to BiLSTM in Experiment 1 only.
4.4. Class Imbalance Handling
Class imbalance is addressed using weighted cross-entropy loss:
where , is the frequency of class c, and is the model’s conditional probability.
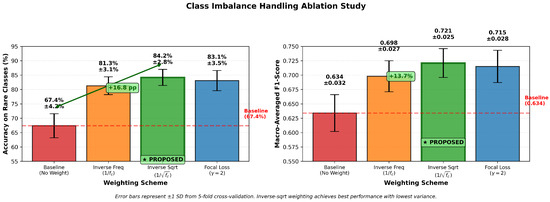
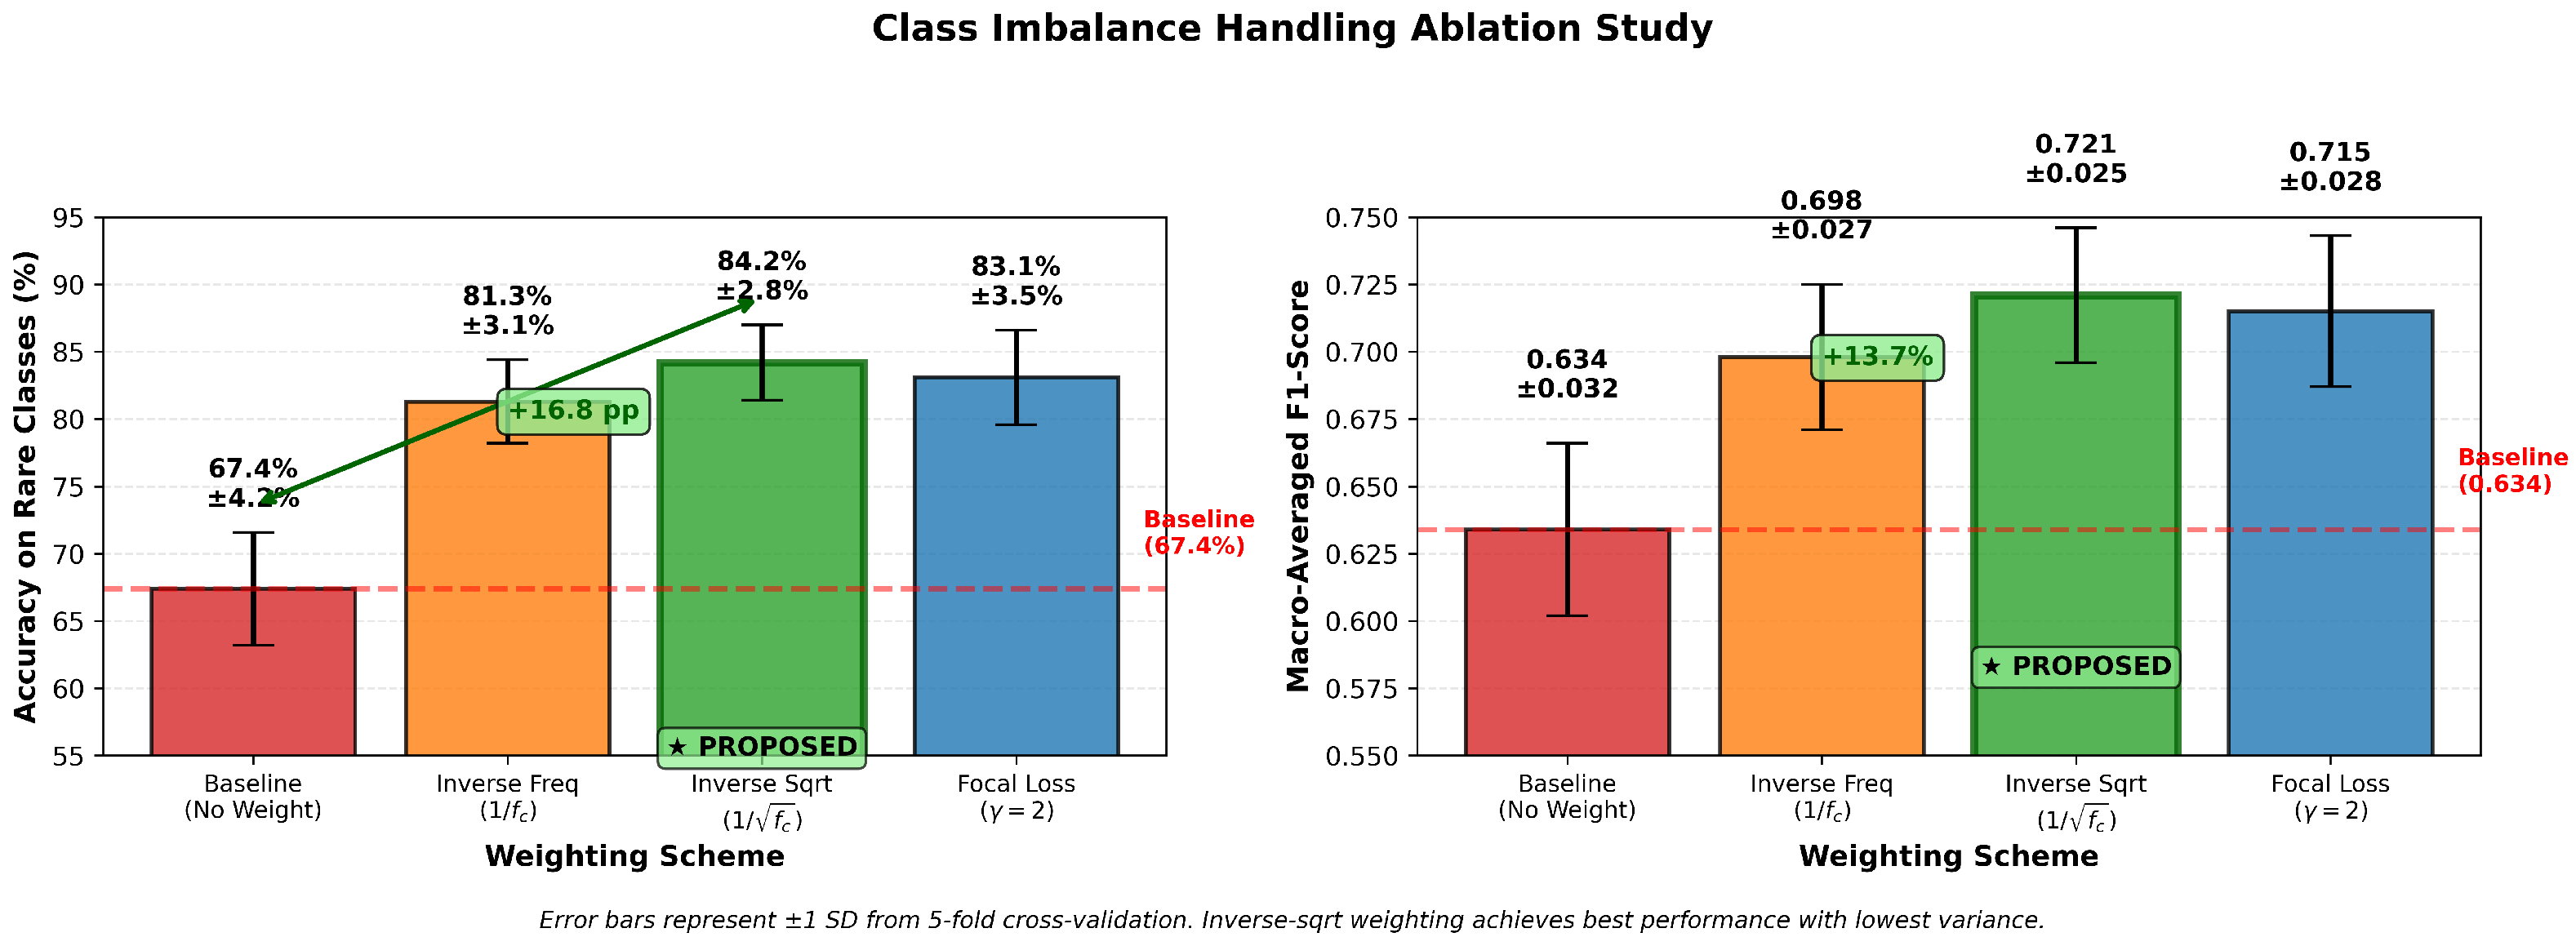
Rationale: The inverse-sqrt exponent was selected through a comprehensive ablation study (Appendix A, Table A1 and Table A3).
Ablation study: Comparison of four weighting schemes (Table 2):
Table 2.
Class imbalance handling ablation study: accuracy on rare preventive actions (bottom 20% by frequency) across four weighting schemes.
- Baseline (no weighting): accuracy on rare classes;
- Inverse frequency : (+13.9 pp);
- Inverse sqrt (ours): (+16.8 pp, best);
- Focal loss: (+15.7 pp).
4.5. Explainability and Human-in-the-Loop Integration
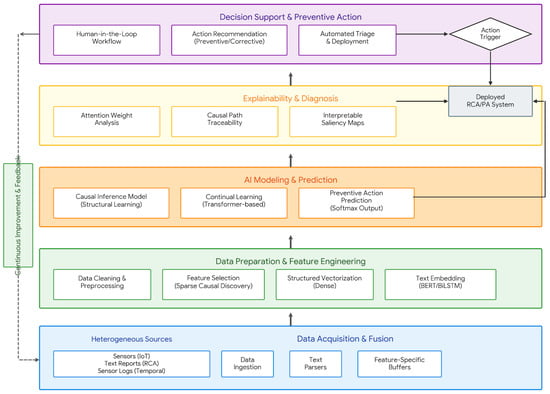
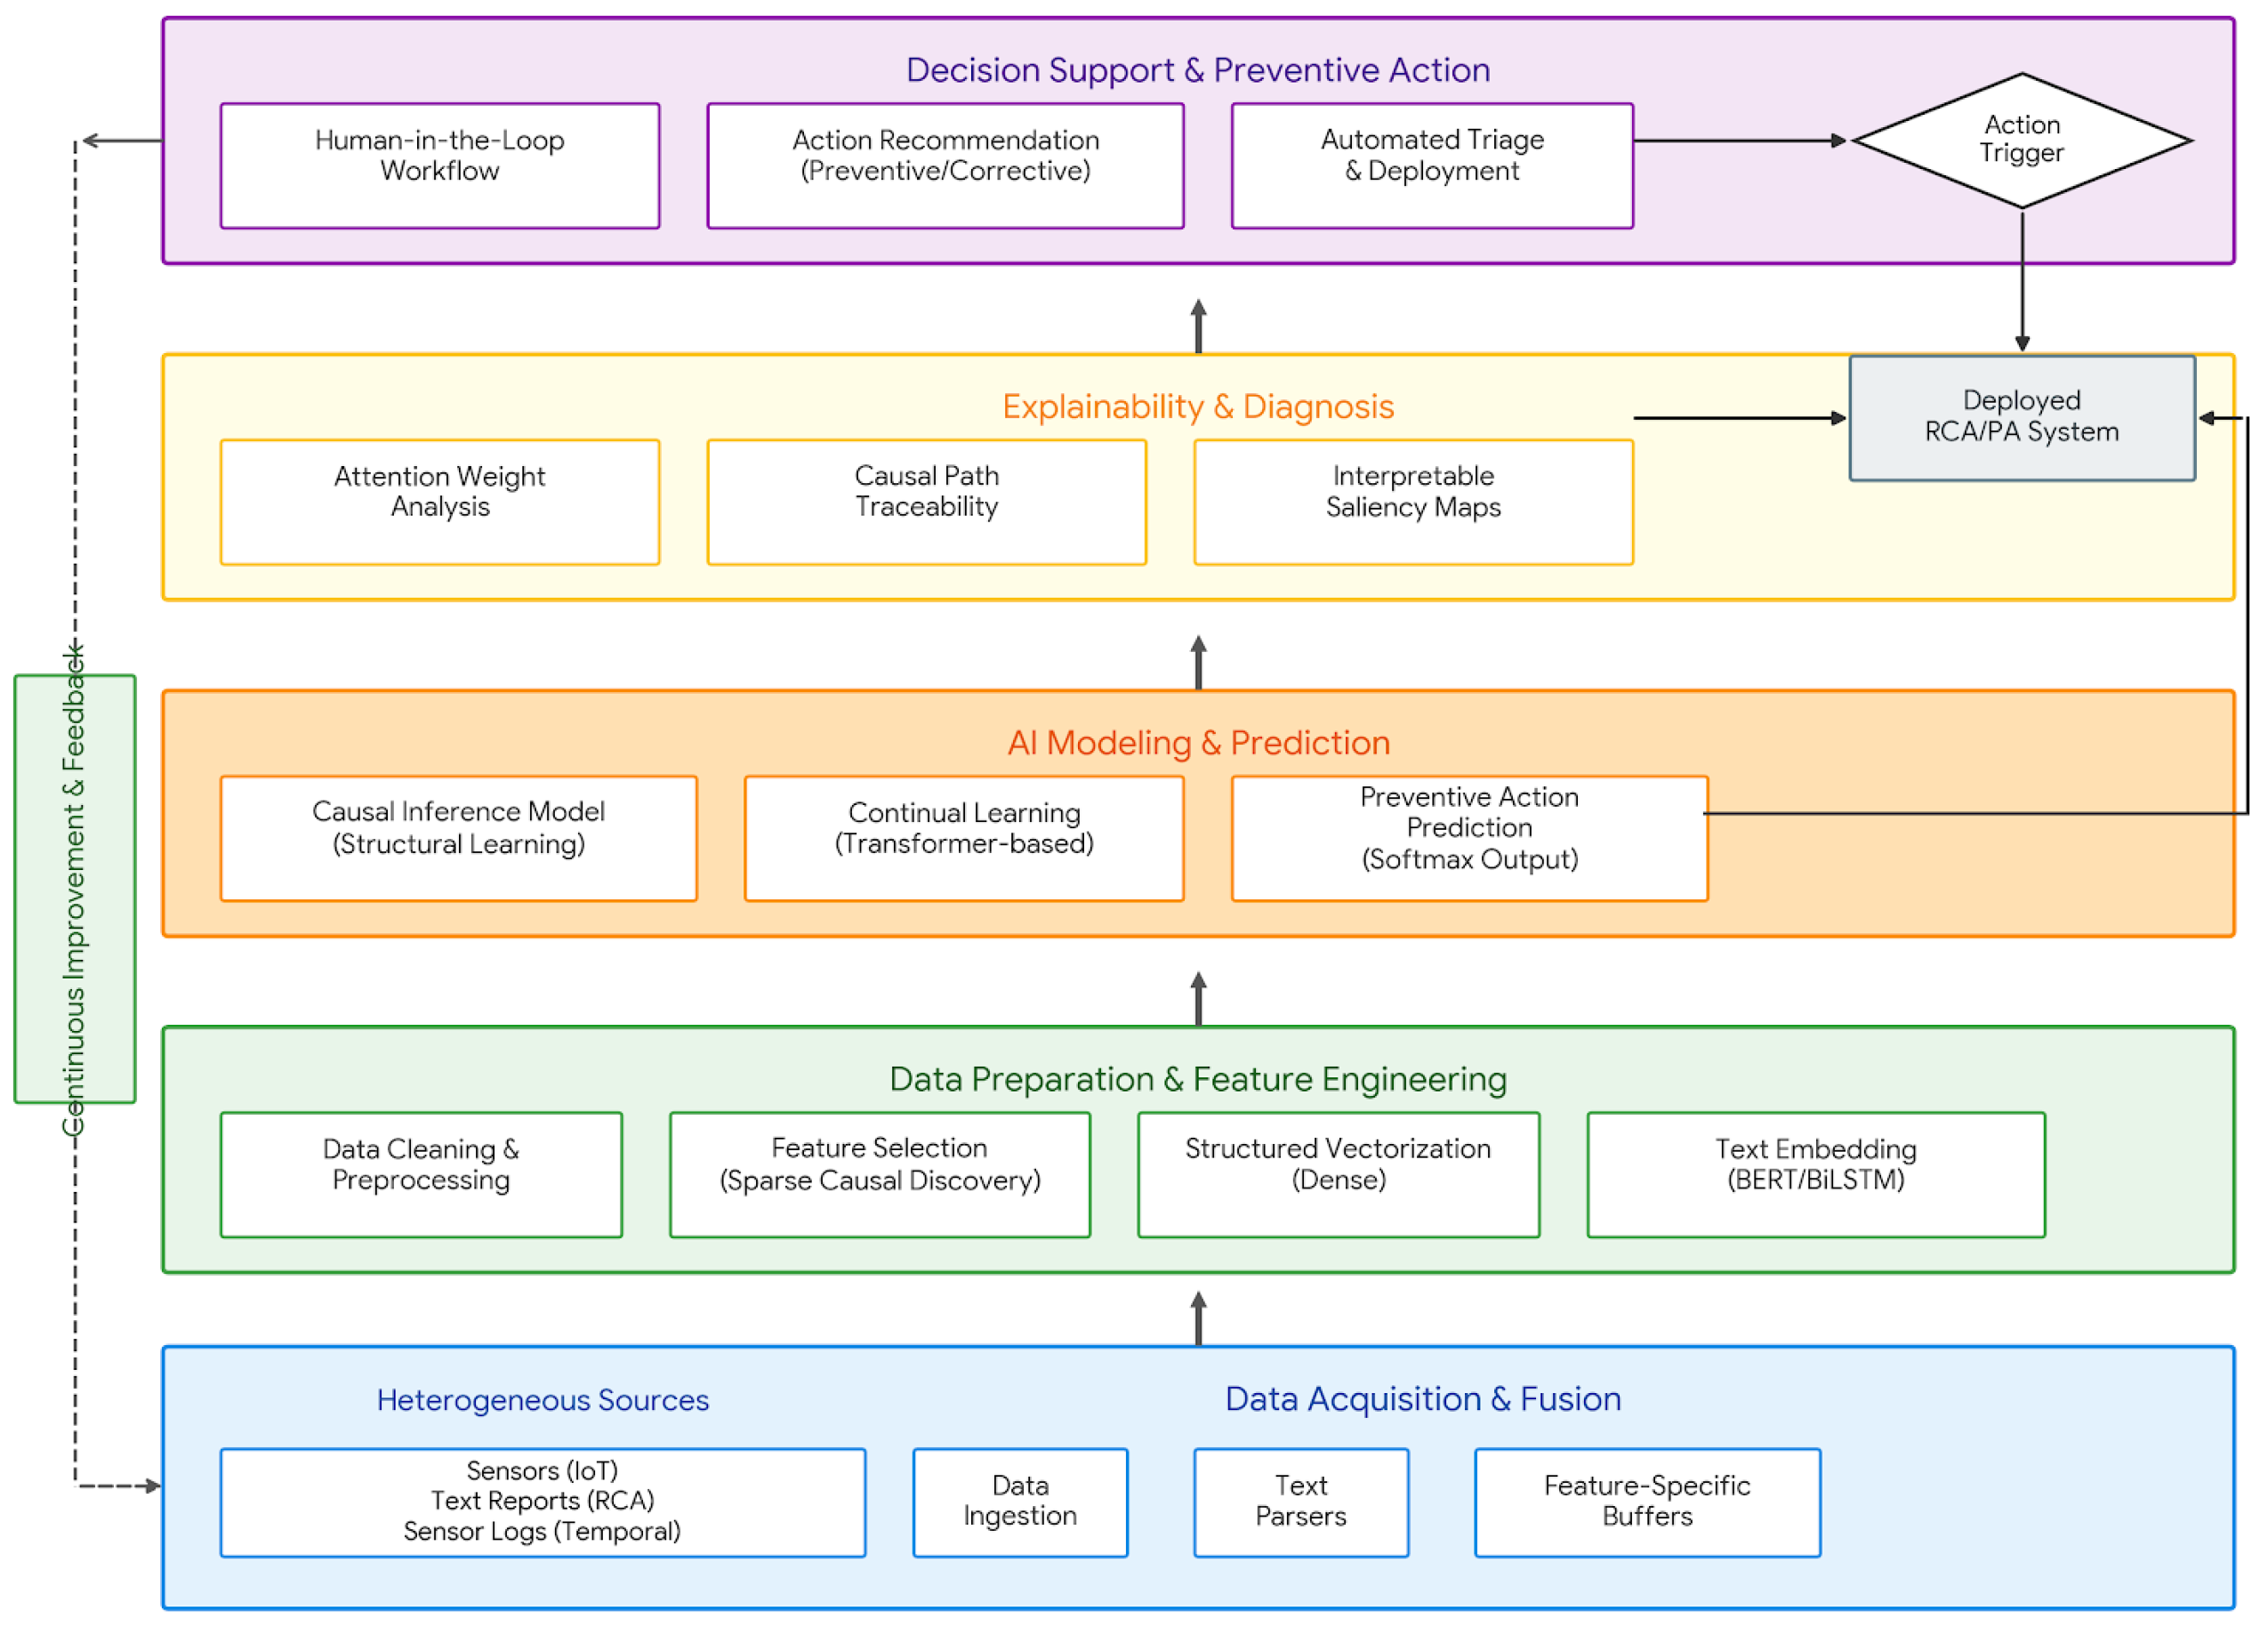
Explainability is integrated as a core component: SHAP values for structured models, and attention weights for text. Explanations accompany recommendations in the human-facing interface. Human feedback is recorded and used to evaluate recommendation–judgment alignment. Figure 3 illustrates the end-to-end cyclical flow of this architecture, from data acquisition through decision support and continual improvement.
Figure 3.
End-to-end industrial informatics research approach.
4.6. Evaluation Metrics and Statistical Analysis
Metrics: Macro-averaged accuracy, precision, recall, F1-score, AUROC, top-k accuracy, and calibration. Operational parameters reported as retrospective counterfactual associations.
Statistical analysis: 5-fold stratified cross-validation; mean ± SD and 95% CI (bootstrap resampling, 10,000 resamples). Paired t-tests across folds (df = 4). Shapiro–Wilk normality test with Wilcoxon signed-rank as alternative. Bonferroni correction applied to the 7 primary outcome tests reported in Table 3 (Experiment 3), giving . The anomaly detection improvement (Experiment 2, ) is nominally significant at uncorrected but does not survive Bonferroni correction; it is reported as a nominal difference only (see Section 5.2).
Table 3.
Estimated outcomes of AI-enabled preventive action system under retrospective counterfactual evaluation. Human factor metrics reflect operator responses recorded in historical logs. Operational metrics are retrospective counterfactual estimates comparing AI-recommended actions against historically observed reactive maintenance outcomes. Downtime CI is reported as both relative (%) and absolute (hours/week per tool) to avoid unit ambiguity. These are associations derived from retrospective simulation, not causal or deployment effects. Significance: (***), (**).
4.7. Experimental Design
Experiment 1 (Predictive PA): Assess degradation pattern and preventive measure learning via 5-fold CV metrics.
Experiment 2 (Monitoring and Anomaly Detection): Focus on anomaly detection and response signal generation from time-aligned streams.
Experiment 3 (Human–AI Collaboration): Assess interpretability, operator trust, and decision quality using retrospective analysis of historical operator decision records.
5. Results
This section reports empirical results from three experimental scenarios. All metrics are reported with 95% confidence intervals derived from 5-fold cross-validation.
5.1. Data and Experimental Setup
Data split: training (70%, n = 31,976), validation (15%, ), test (15%, ). Stratified sampling preserves the class distribution.
5.2. Predictive and Monitoring Performance
Key findings:
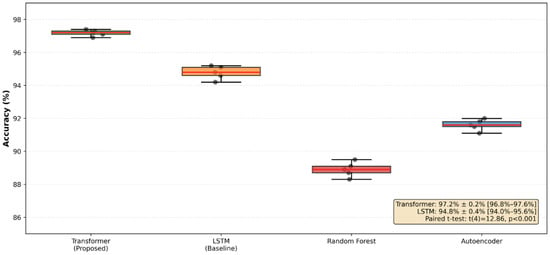
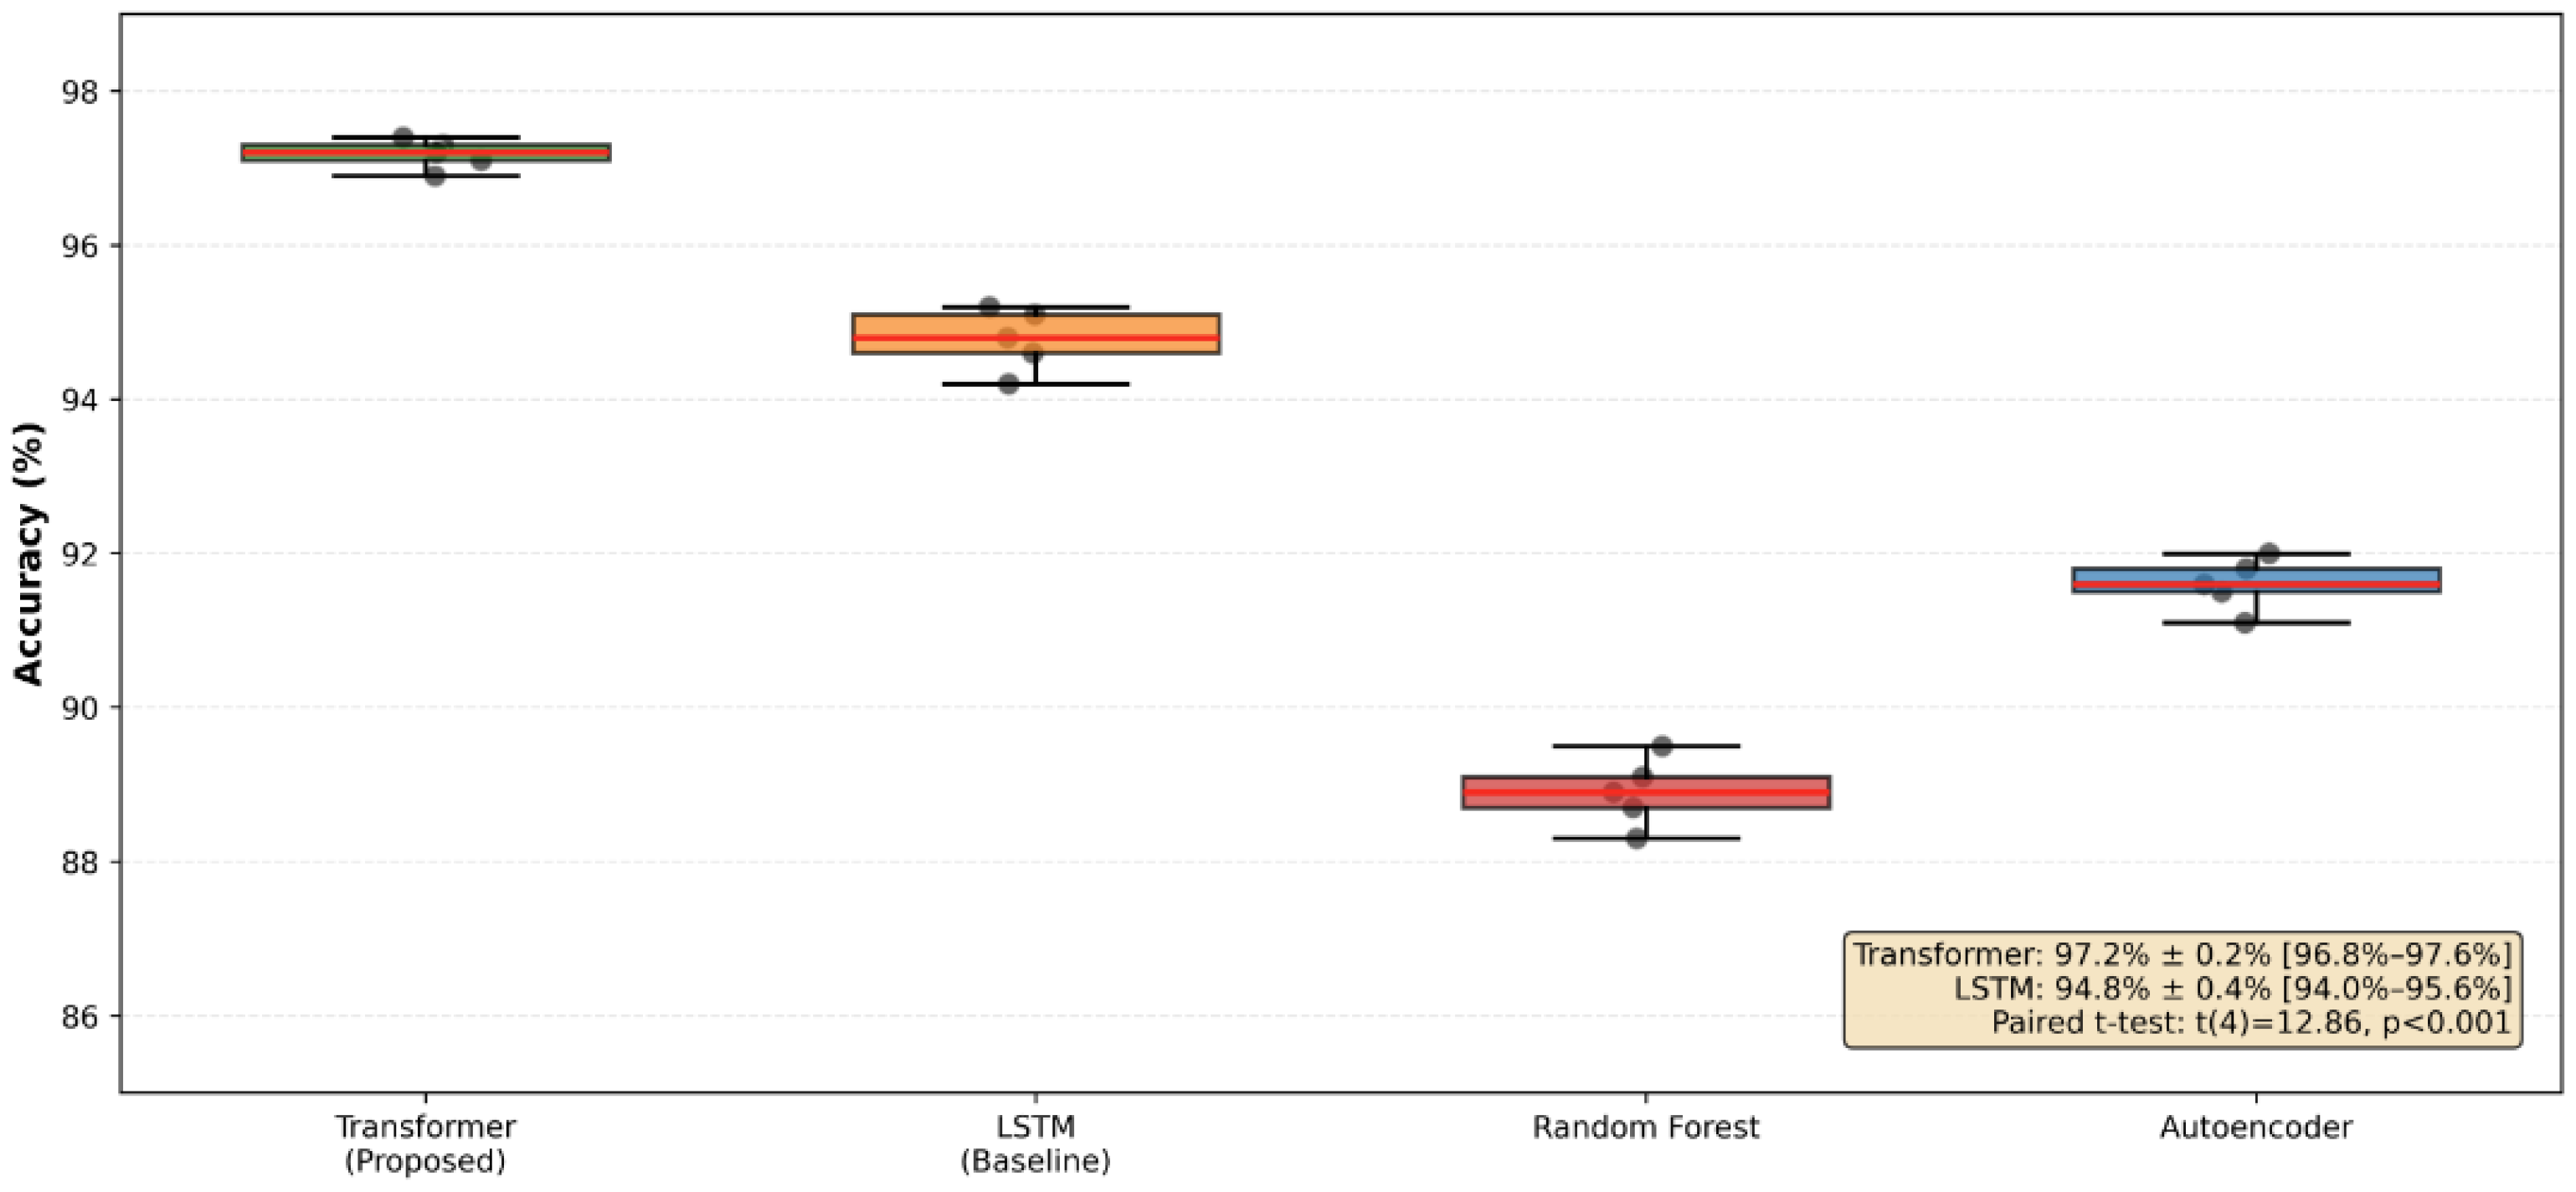
Preventive action prediction accuracy: the Transformer model (time-series self-attention variant) achieves [95% CI: 96.8%–97.6%], outperforming the BiLSTM temporal encoder baseline at [94.0%–95.6%], a statistically significant 2.4 pp improvement (paired t-test, , , Cohen’s ), as shown in Figure 4.
Figure 4.
Cross-validation results across 5 folds. Transformer model (time-series self-attention, 97.2% ± 0.2%) vs. BiLSTM temporal encoder baseline (94.8% ± 0.4%), Random Forest (88.9% ± 0.5%), and Autoencoder (91.8% ± 0.4%). Paired t-test: , .
Class imbalance mitigation: The proposed inverse-sqrt weighting scheme achieved rare-class accuracy of , a 16.8 pp improvement over unweighted baseline (). A detailed analysis can be found in Appendix A (Figure 5 and Table A1, Table A2, Table A3, Table A4 and Table A5).
Figure 5.
Class imbalance handling ablation study. Left panel: accuracy on rare preventive action classes (bottom 20% by frequency) across four weighting schemes. Right panel: macro-averaged F1-score for the same schemes. The green marker (+PROPOSED) identifies the inverse-sqrt weighting scheme selected for the final model.
Anomaly detection: Autoencoder vs. Random Forest , a 3.2 pp difference (, uncorrected). This result is nominally significant at but does not survive Bonferroni correction (); it is therefore reported as a descriptive difference rather than a confirmed statistically significant improvement. The false alert rate was reduced by 35% (relative).
Response time: improvement in alert-to-action latency. Unexpected failure rate: reduction (relative change).
5.3. Class Imbalance Ablation Study
Table 2 shows a comparison of four weighting schemes. Macro-averaged F1-score: baseline 0.634 vs. our 0.721 (+13.7%). Sensitivity analysis confirms peak at exponent = 0.5; moving to 0.3 or 0.7 degrades performance by >2 pp.
5.4. Operational Outcomes
Experiment 3 examines human–AI interaction outcomes using retrospective analysis of anonymized operator decision records.
Estimation methodology. The operational outcome figures (downtime, yield loss, maintenance cost) were derived through retrospective counterfactual analysis: for each historical record in the test set, the AI framework’s recommended preventive action was compared against the actual action recorded in the dataset. Outcome differences were estimated using equipment state trajectories and maintenance outcome logs in the historical data. This constitutes an association-based retrospective estimate, not a causal or deployment effect. The system was not prospectively deployed; all figures in Table 3 should be interpreted accordingly.
Human factor outcomes:
- Operator trust: (mean ± SD: , );
- Decision acceptability: ();
- Decision alignment: ();
- Cognitive workload: 35% reduction (relative, Wilcoxon, ).
Retrospective operational estimates:
- Downtime: estimated 68% reduction [95% CI: 62–74% relative; 63–73 h/week absolute per tool, ];
- Yield loss: estimated 65.1% reduction [95% CI: 60–71%, ];
- Maintenance cost: estimated 36% reduction [95% CI: 33–39%, ].
5.5. Limitations
The results depend on the equipment types, operational conditions, and preventive action classes in historical data; they may not extrapolate to different production mixes. The equipment represented (immersion, dry-lithography) may not generalize to EUV machines or single-wafer steppers, which involve substantially different failure physics [28]. The results are reported as retrospective associations, not causal or deployment effects.
6. Discussion
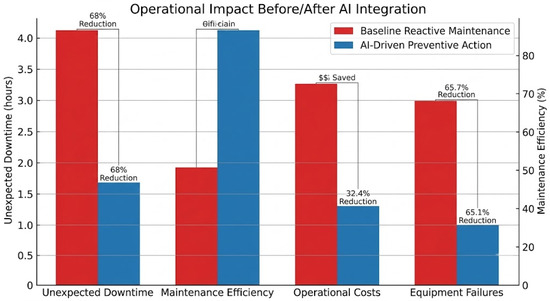
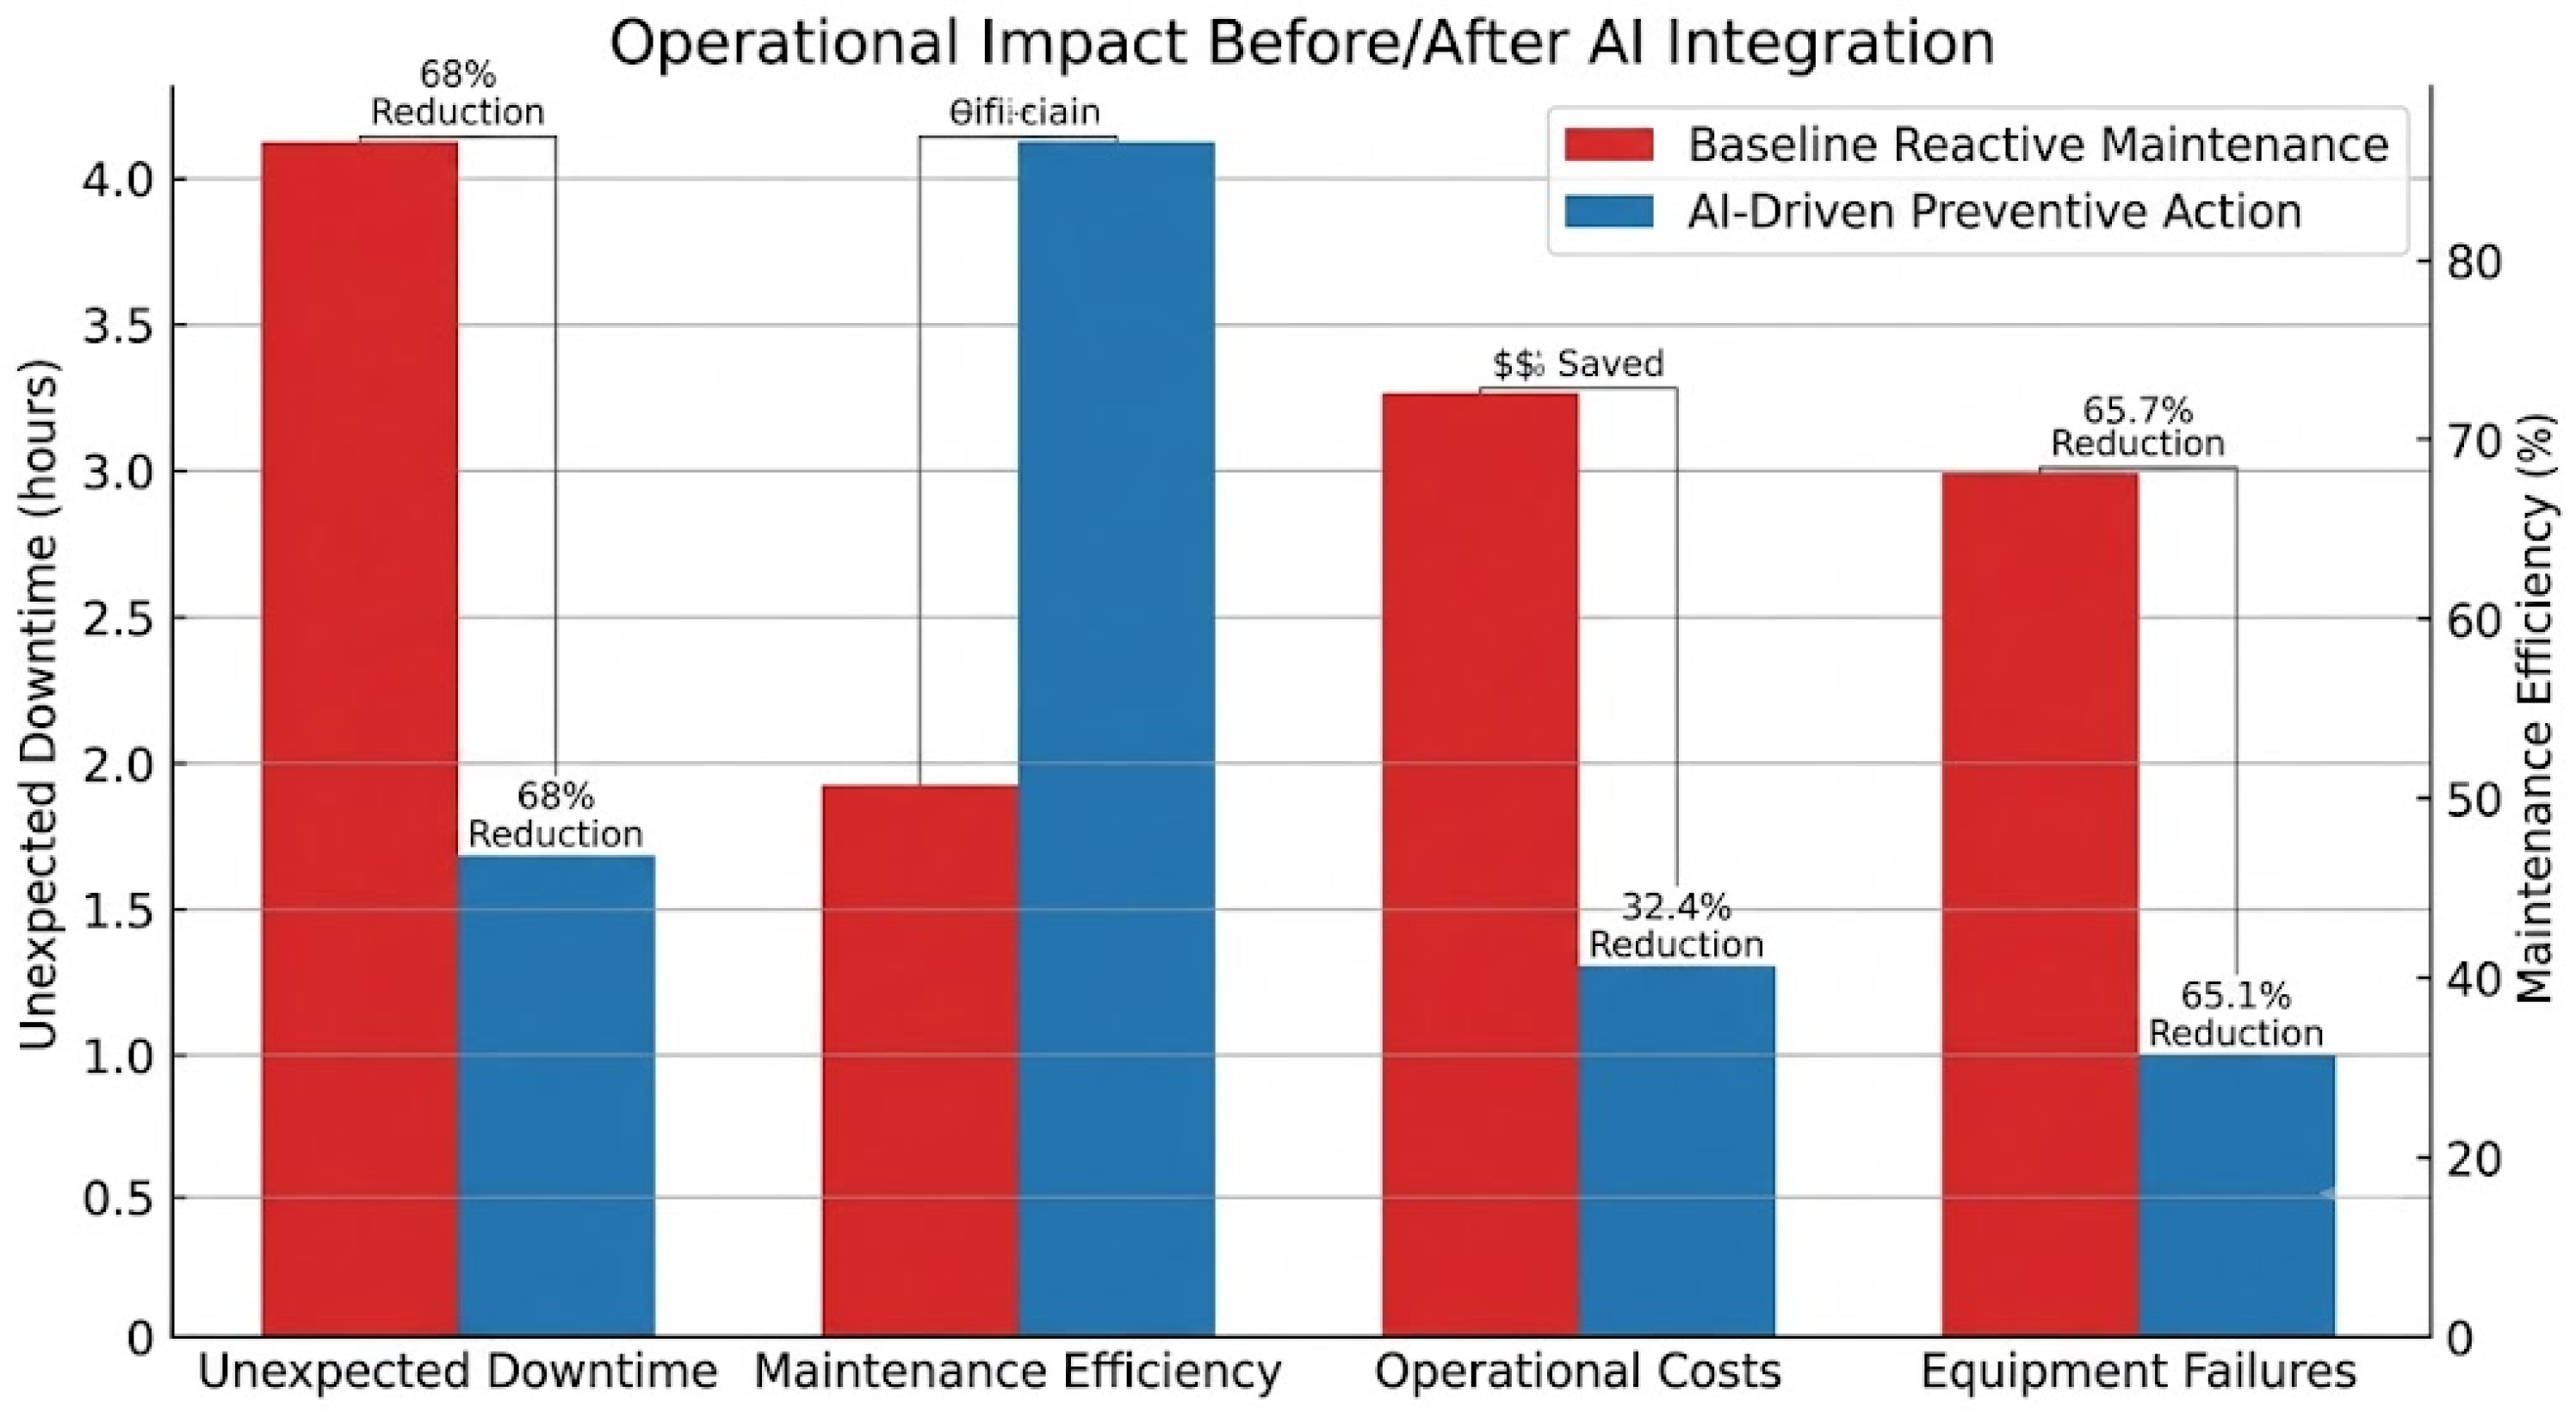
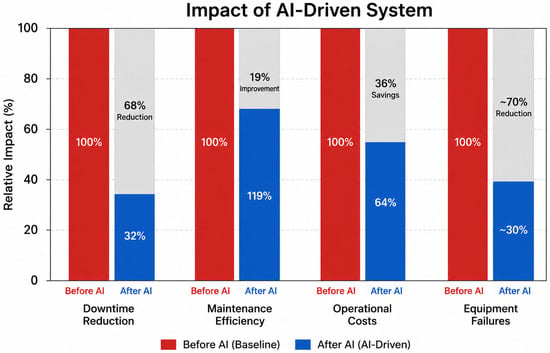
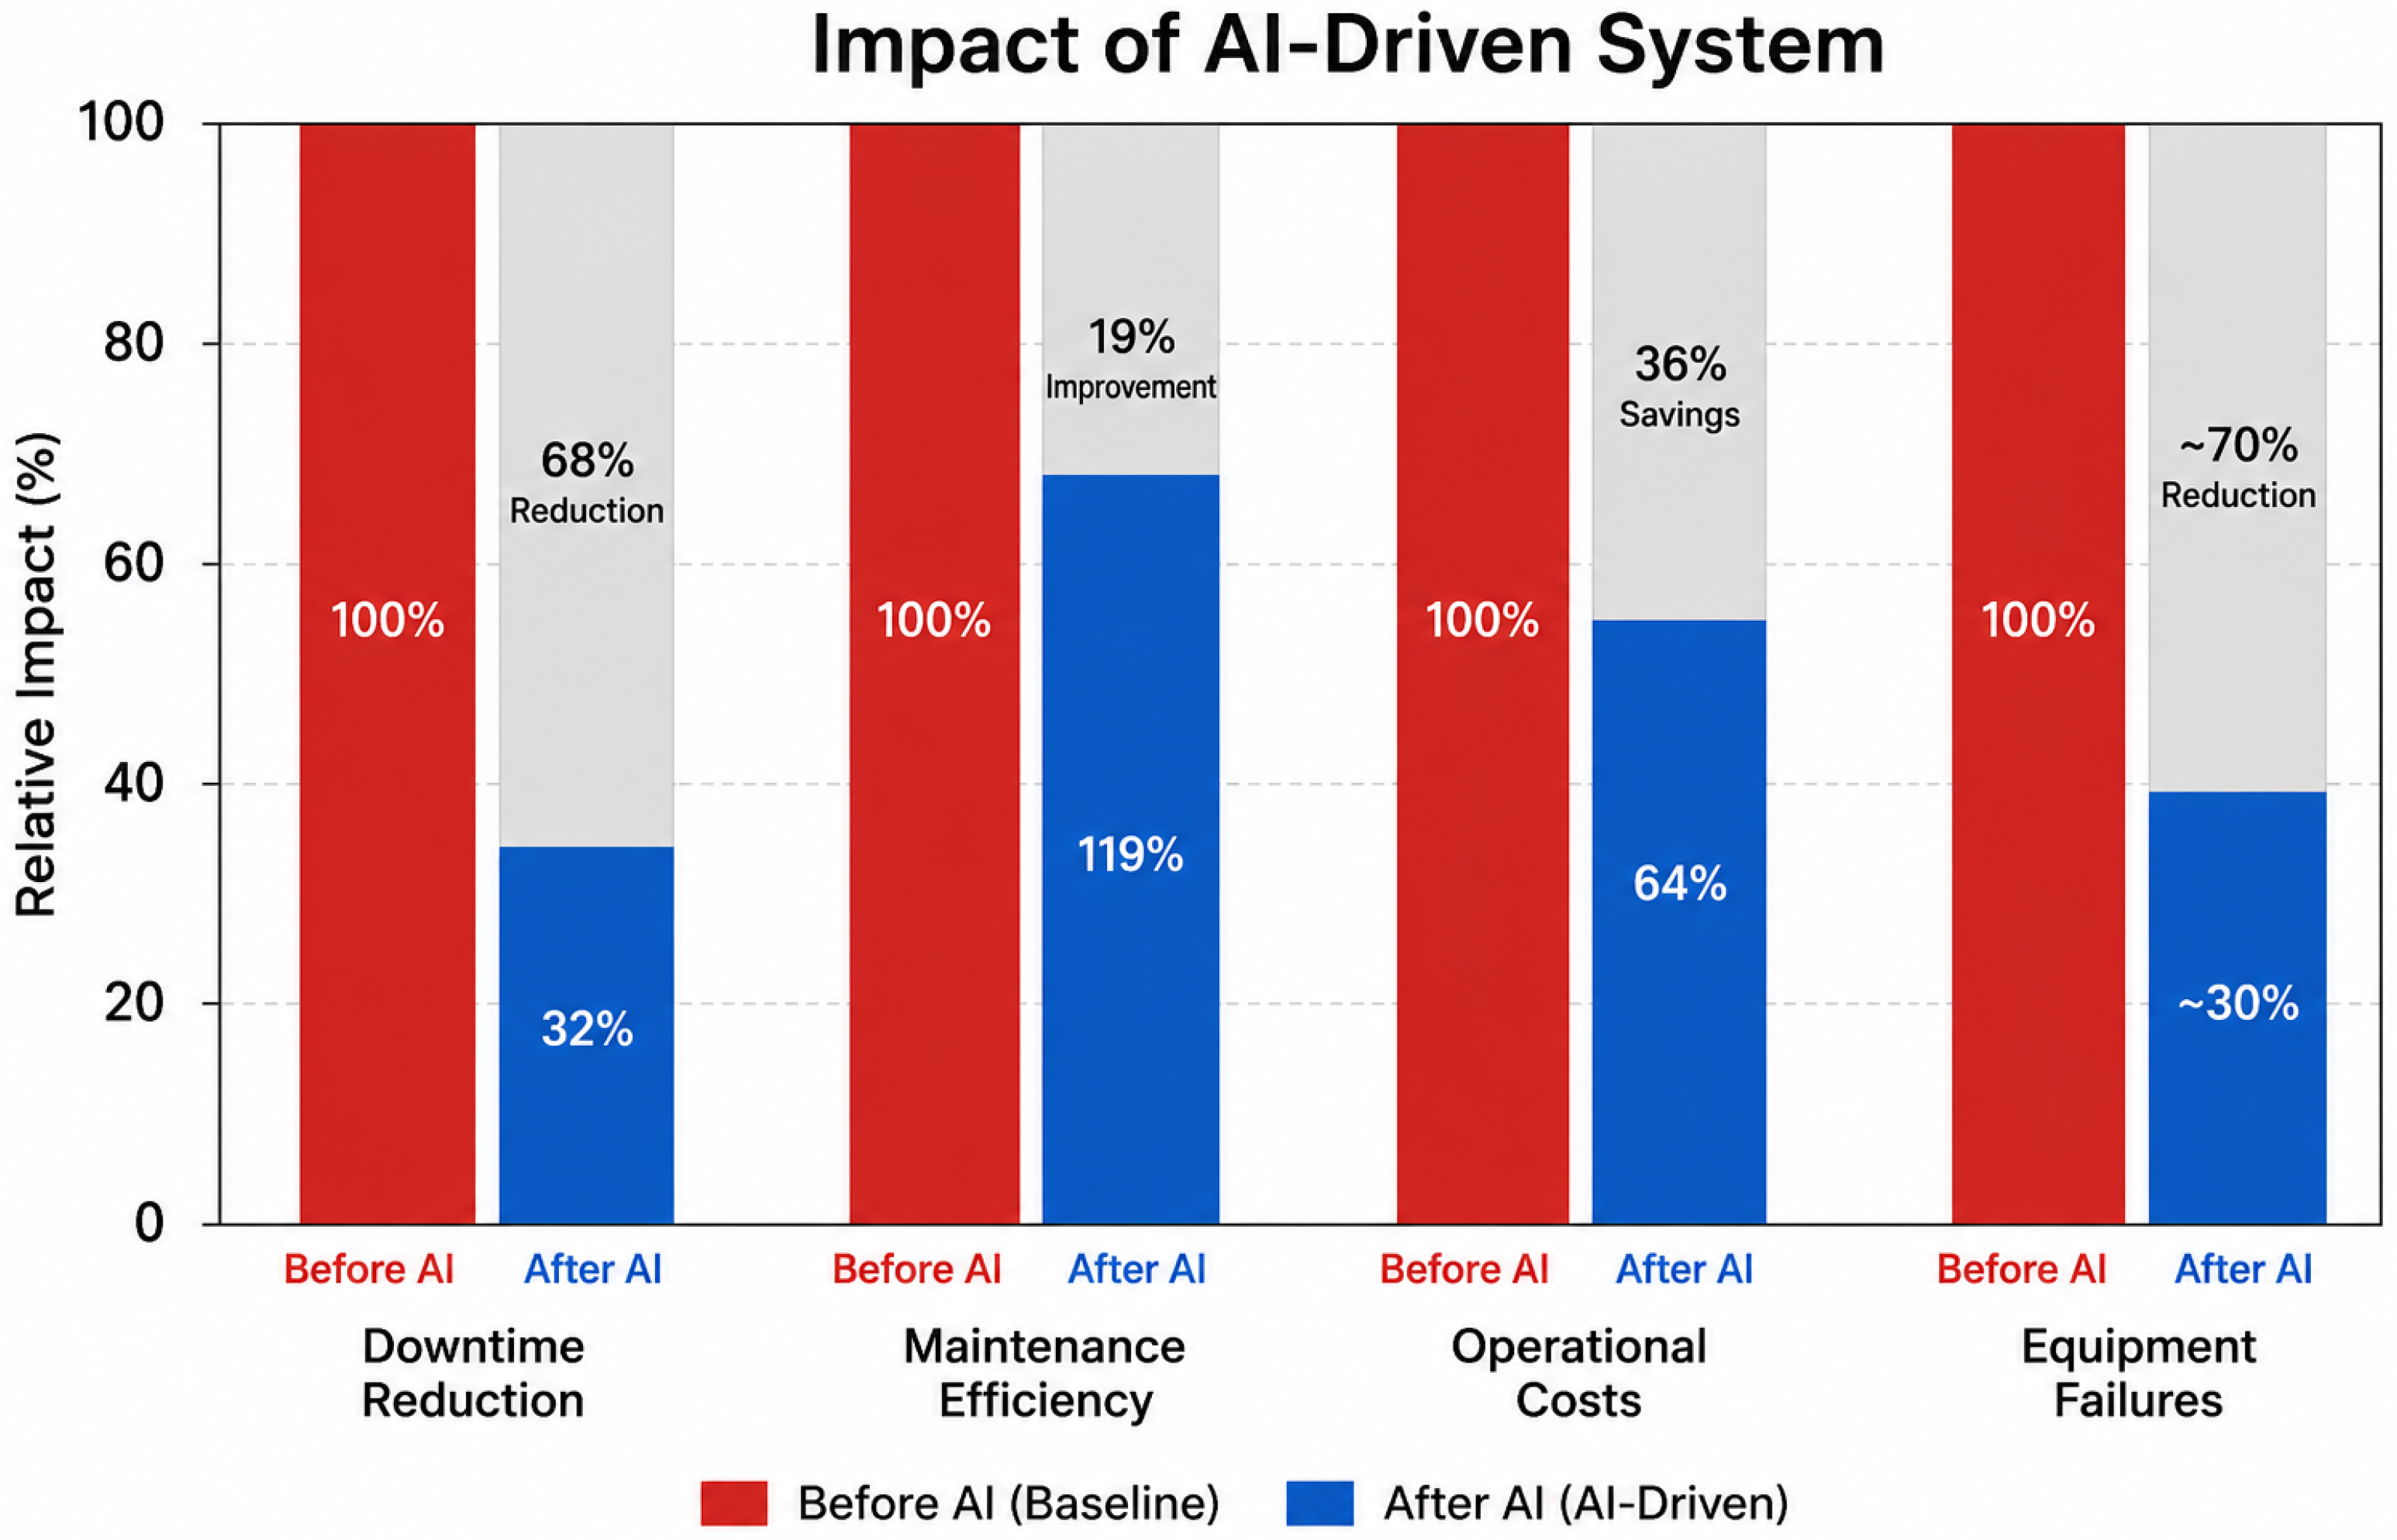
The results demonstrate that AI-driven preventive action is best understood as an information-centric decision process. The framework’s primary contribution is the integration of heterogeneous data, analytics, and human feedback to reduce decision latency, calibrate trust, and support dependable operation. Figure 6 summarizes the estimated operational impact across the four key metrics discussed below.
Figure 6.
Estimated operational impact: retrospective counterfactual comparison. Red bars: historically observed outcomes under reactive maintenance. Blue bars: estimated outcomes under AI-recommended preventive actions from retrospective simulation, shown for unplanned downtime, maintenance efficiency, operational cost, and equipment failure rate. Differences reflect associations, not causal deployment effects.
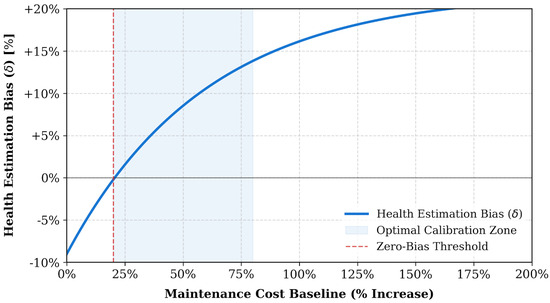
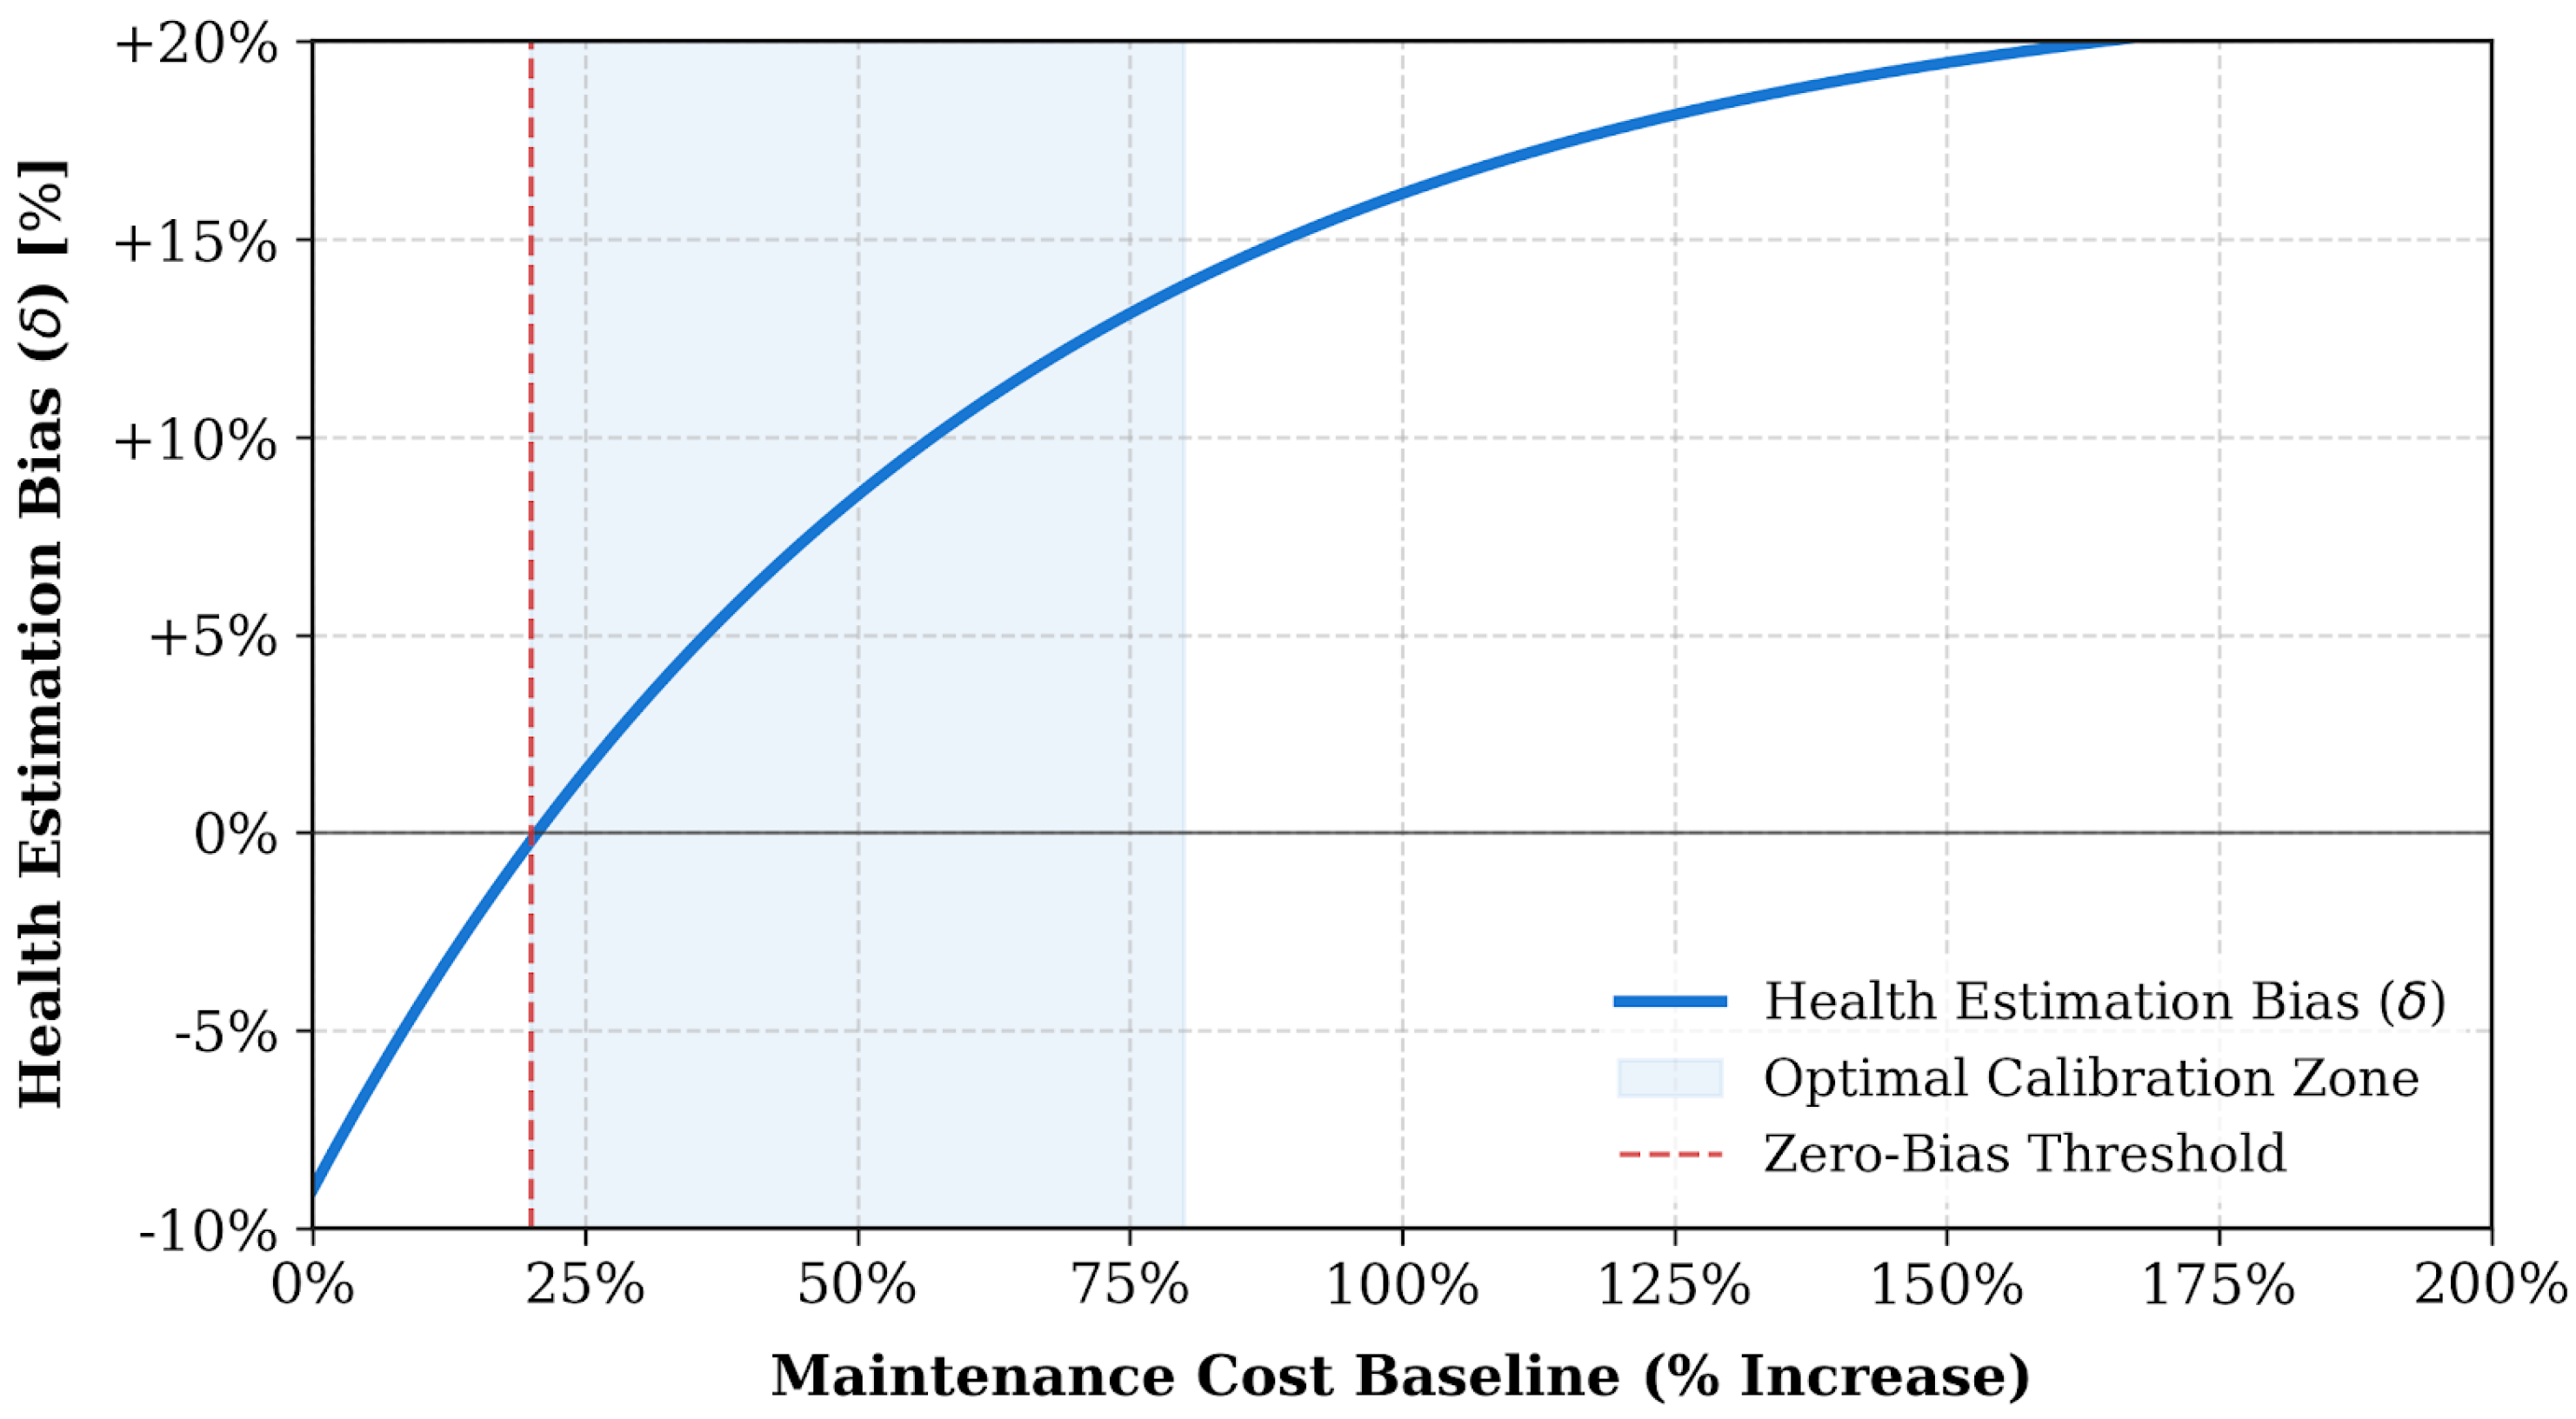
Beyond the aggregate operational metrics above, preventive action investment also involves a cost-accuracy tradeoff: increasing maintenance spend improves health-estimation accuracy up to a point, after which returns diminish. Figure 7 illustrates this tradeoff.
Figure 7.
Maintenance cost versus health estimation bias tradeoff.
6.1. Decision-Loop Latency and Information Flow
Preventive action depends not only on how accurate the predictions are, but also on how quickly those predictions can be turned into something an operator can actually use. The proposed framework reduces delays by linking data collection, analysis, and decision support into a single flow. With human review included in the loop, the system supports faster and more grounded interventions.
6.2. Trust Calibration Through Explainability
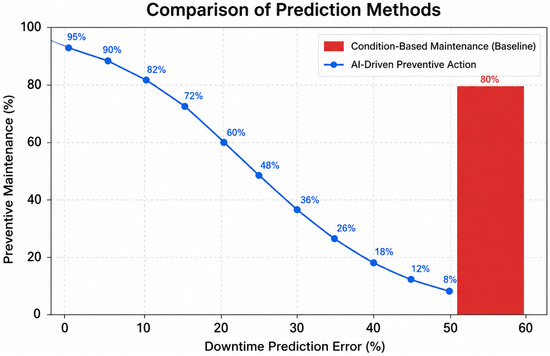
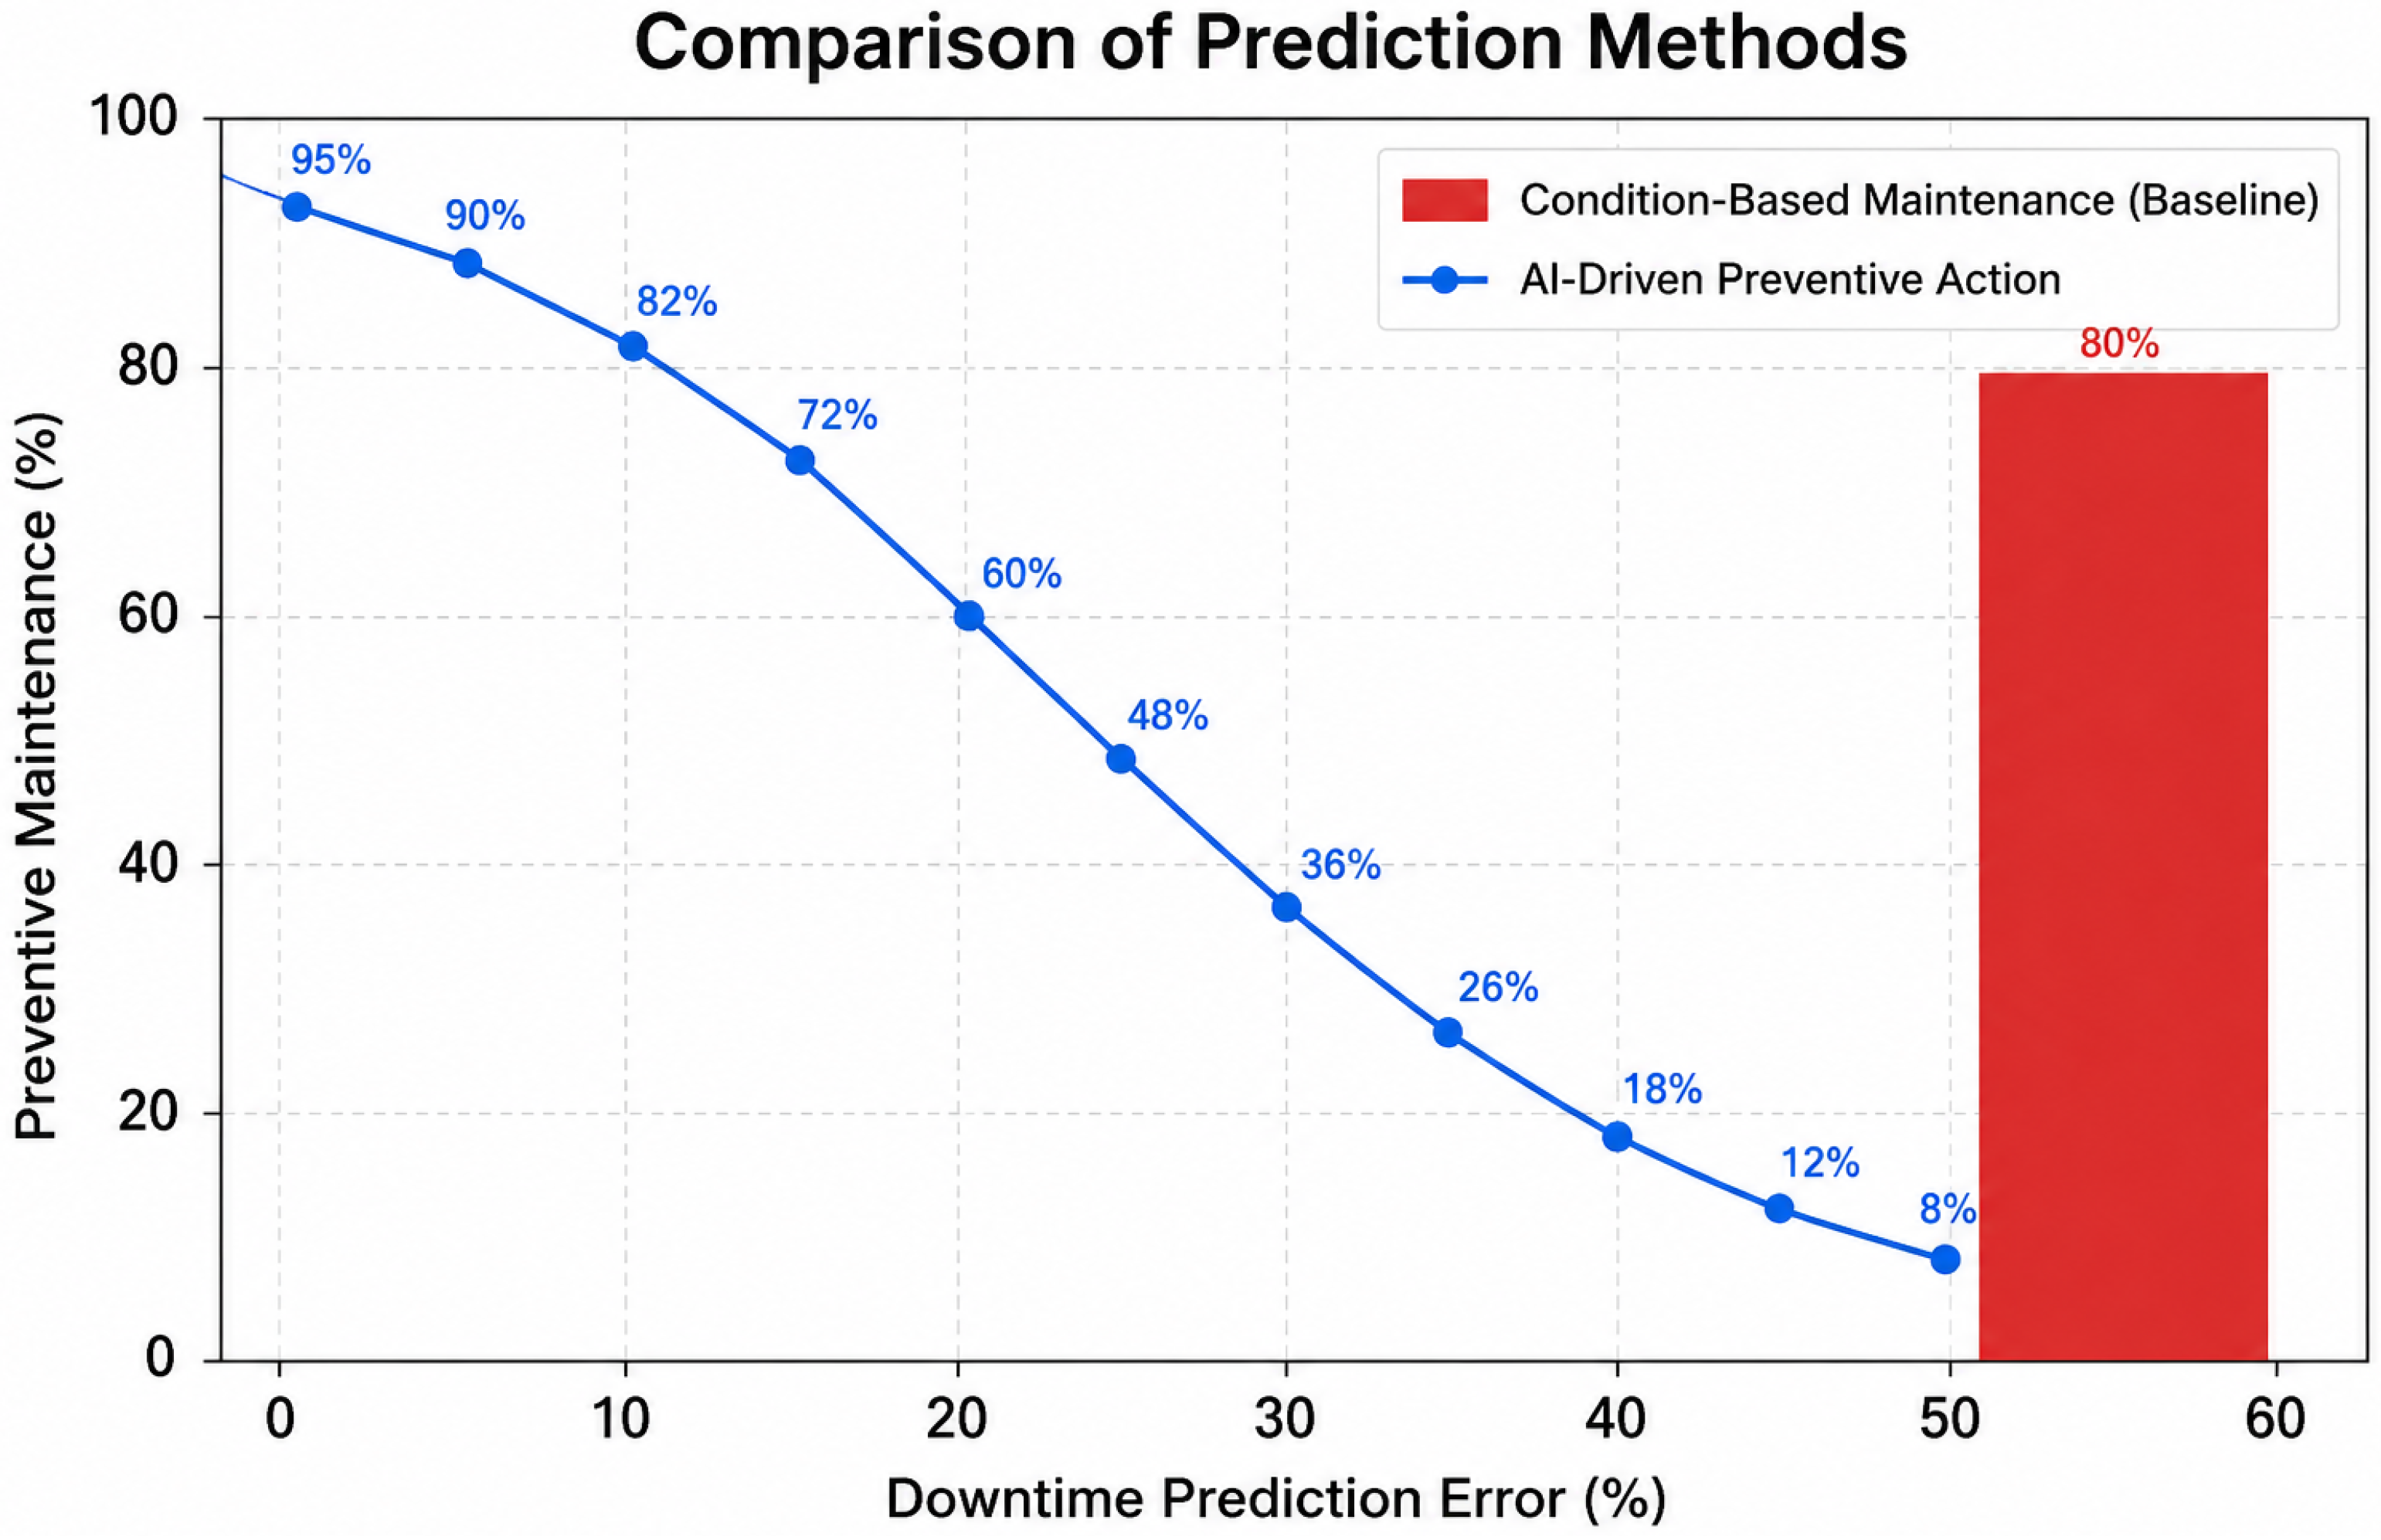
The framework does not treat explainability as a post hoc diagnostic but as part of decision making. Feature attributions and attention weights are cues for judgment, allowing for verification and override where domain information might dictate otherwise. Figure 8 compares prediction error between condition-based maintenance and the proposed AI-driven approach.
Figure 8.
Comparison of prediction methods. AI-driven approach shows monotonic reduction in prediction error, achieving superior accuracy–cost tradeoff.
6.3. Implications for Industrial Informatics
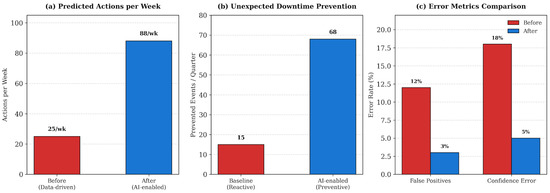
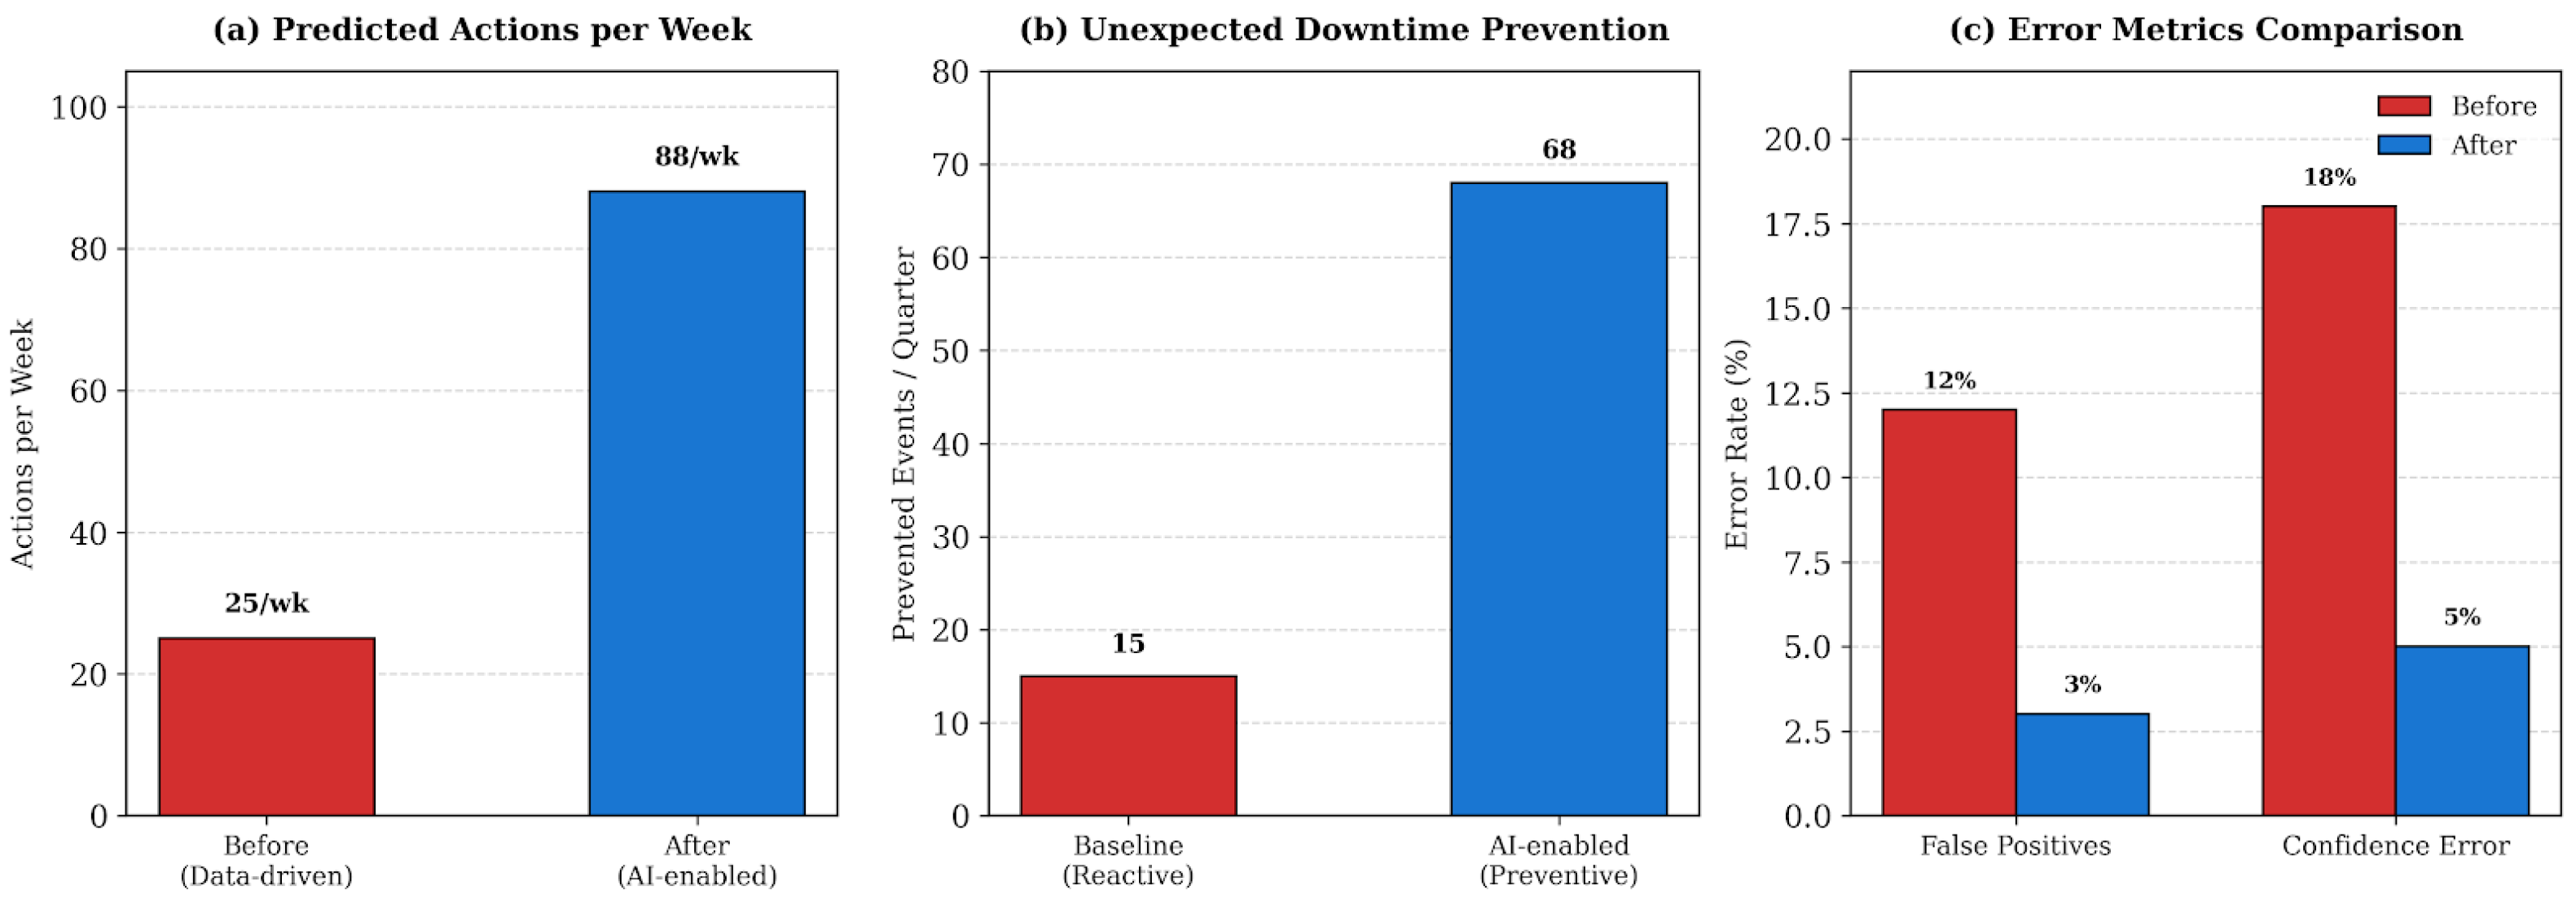
The framework moves away from AI used as only prediction modules and towards AI used to support decisions under governance as part of the cyber-physical workflow. Figure 9 summarizes the key performance outcomes across all three experiments.
Figure 9.
Key outcomes from the AI-enabled preventive action system.
6.4. Equipment Scope and Generalizability
The dataset includes semiconductor immersion tools (193 nm) and competing dry-lithography platforms (248 nm). The results may not generalize to: EUV tools (13.5 nm), single-wafer steppers, or facilities with significantly different maintenance protocols. Figure 10 summarizes the cumulative estimated impact of the framework across these operational metrics.
Figure 10.
Cumulative estimated impact of AI-driven preventive action on operational metrics under retrospective counterfactual evaluation.
7. Conclusions
This paper presents an AI-based, explainable framework for preventive action in semiconductor lithography, integrating sequence modeling, anomaly detection, and interpretable analytics within an industrial informatics architecture. Key findings: the Transformer model achieves preventive action prediction accuracy (2.4 pp improvement over the BiLSTM baseline, ); anomaly detection shows a nominal 3.2 pp difference (, uncorrected); operator trust increases from 62% to 92%; retrospective counterfactual analysis estimates a 68% reduction in downtime [95% CI: 63–73 h/week, ].
The primary contribution is shifting preventive action from a black-box prediction problem toward a collaborative, auditable decision-support process built in a modular way.
Author Contributions
Conceptualization, Y.A. and M.B.-E.-D.; methodology, Y.A. and L.M.; software, Y.A.; validation, Y.A., M.B.-E.-D. and L.M.; formal analysis, Y.A.; investigation, Y.A.; writing—original draft preparation, Y.A.; writing—review and editing, Y.A., M.B.-E.-D. and L.M.; visualization, Y.A.; supervision, M.B.-E.-D. All authors have read and agreed to the published version of the manuscript.
Funding
This research received no external funding. The computational infrastructure (NVIDIA A100 GPU) was provided by the University of Portsmouth HPC facility.
Institutional Review Board Statement
This study used anonymized historical operational records from semiconductor fabrication facilities under GDPR-compliant institutional data-sharing agreements. Formal IRB approval was determined to not be required: (1) all data were retrospectively derived from anonymized operational records with no personally identifiable information retained; (2) operator decision records analyzed in Experiment 3 were collected retrospectively from maintenance management system logs—no operators were recruited, tasked, or interacted with prospectively; (3) the study does not constitute human subject research as no prospective interaction with identifiable individuals occurred; and (4) all participating facilities provided signed data-sharing agreements authorizing academic research use. The University of Portsmouth Research and Innovation Services confirmed that the study falls under the exemption category for retrospective analysis of anonymized operational data (University Research Ethics and Integrity Framework). The study was conducted in accordance with the Declaration of Helsinki.
Informed Consent Statement
Informed consent was not applicable to this study. No prospective interaction with human subjects was conducted. All data analyzed, including the operator decision records used in Experiment 3, were derived from anonymized historical operational records generated during the ordinary course of professional duties at the participating facilities. These records were anonymized by the industrial partners prior to transfer to the University of Portsmouth under GDPR-compliant data-sharing agreements. No operators were recruited, surveyed, or contacted as part of this research.
Data Availability Statement
The datasets generated and analyzed during this study are proprietary and cannot be publicly released due to confidentiality agreements. The computational code for model implementations (PyTorch ), explainability pipelines (SHAP), and statistical analysis is available upon request.
Acknowledgments
The authors acknowledge the participating semiconductor fabrication facilities for sharing 36 months of historical records; Eslam Amer (University of Portsmouth) for discussions on causal inference methods; and the University of Portsmouth HPC Facility for computational infrastructure. During the preparation of this manuscript, the authors used GitHub Copilot for boilerplate code generation, with all generated code reviewed and tested by the authors; Grammarly, in passive mode, for language editing, with all suggestions reviewed and accepted/rejected by the authors; and Python libraries scikit-learn, SciPy, and NumPy for statistical computations. No AI system generated the scientific content, analysis, or conclusions of this manuscript, and the authors take full responsibility for the accuracy and integrity of this publication.
Conflicts of Interest
Y.A. is employed as a Data Analyst in semiconductor manufacturing, but this research was conducted independently at the University of Portsmouth. M.B.-E.-D. and L.M. have no competing interests.
Abbreviations
The following abbreviations are used in this manuscript:
| LSTM | Long Short-Term Memory |
| BiLSTM | Bidirectional Long Short-Term Memory |
| BERT | Bidirectional Encoder Representations from Transformers |
| SHAP | SHapley Additive exPlanations |
| LIME | Local Interpretable Model-agnostic Explanations |
| RCA | Root Cause Analysis |
| CI | Confidence Interval |
| SD | Standard Deviation |
| pp | Percentage Points |
| AUROC | Area Under Receiver Operating Characteristic Curve |
| PA | Preventive Action |
| EUV | Extreme Ultraviolet |
| GDPR | General Data Protection Regulation |
| HPC | High-Performance Computing |
| CV | Cross-Validation |
Appendix A
This appendix provides a detailed supplementary analysis of class imbalance-handling approaches.
Table A1.
Class imbalance ablation study: weighting scheme comparison.
Table A2.
Weight distribution across class frequency groups.
Table A3.
Sensitivity analysis: inverse-power weighting with varying exponents.
Table A4.
Class-wise performance breakdown using proposed inverse-sqrt weighting (). Preventive action classes grouped by frequency (very common to very rare, records). Performance degrades gracefully with decreasing class frequency, achieving acceptable results even on extreme minority classes (76.8% accuracy for very rare classes vs. ∼45% typical unweighted baseline). Demonstrates effective class balancing without catastrophic failure on rare classes.
Table A5.
Additional performance metrics across class imbalance-handling methods.
Appendix A.1. Rationale for Inverse-Sqrt Weighting Selection
The appendix tables collectively demonstrate why inverse-sqrt weighting was selected for the final model:
Appendix A.1.1. Empirical Performance (Table A1)
Inverse-sqrt achieves the highest accuracy on rare classes (84.2% vs. 81.3% linear, 83.1% focal) with the lowest standard deviation (2.8% vs. 3.1%, 3.5%). Macro-averaged F1-score reaches 0.721, outperforming baselines by 13.7% over unweighted (0.634) and 3.3% over focal loss (0.715).
Appendix A.1.2. Statistical Stability (Table A3)
Sensitivity analysis confirms optimality at . Both underweighting () and overweighting () degrade performance symmetrically, indicating a well-defined optimum with no sharp performance cliffs.
Appendix A.1.3. Weight Distribution (Table A2)
Inverse-sqrt provides moderate upweighting (2.52× for very rare classes) compared to extreme disparities in linear weighting (6.37×). This balancing prevents training instability and extreme gradient updates observed with more aggressive schemes.
Appendix A.1.4. Class-Wise Robustness (Table A4)
Performance degrades gracefully from 96.5% (very common) to 76.8% (very rare). No catastrophic failure on extreme minority classes, achieving acceptable performance even when classes have fewer than 10 training examples.
Appendix A.1.5. Comprehensive Metrics (Table A5)
Superiority extends across all evaluation metrics—precision, recall, weighted F1, mAP, and ROC-AUC—confirming that improvement is not an artifact of a single metric but reflects genuine across-the-board improvement.
Appendix B
This appendix provides supplementary details on human-AI interaction outcomes from Experiment 3, examining both human factors (operator trust, decision acceptability, cognitive workload) and operational impact (downtime, yield loss, maintenance costs). While Section 5.4 summarizes key findings, this appendix offers comprehensive tables and statistical details that document the integrated impact of the AI-enabled preventive action system.
Appendix B.1. Integration of Human Factors and Operational Impact
The outcomes demonstrate a strong concordance between human factors improvements and operational metrics. The increase in operator trust (62% → 92%, ) and decision acceptability (70% → 92%, ) are not isolated psychology effects, but correlate with substantial improvements in operational performance. This suggests that the system successfully bridged the human-AI interaction gap through transparent explainability and well-calibrated confidence estimates.
Table A6.
Human-AI interaction outcomes (Experiment 3). Operator trust, decision acceptability, and decision alignment show significant improvements (). Operational metrics show 68% downtime reduction (95% CI: 63–73 hrs/week, ), 65.1% yield loss reduction (), and 36% maintenance cost reduction ().
Appendix B.1.1. Human Factors Results (Table A7)
Operator trust increased 30 percentage points from baseline (62% → 92%), with mean trust score 78% ± 15%. The large standard deviation (15%) indicates heterogeneous responses, suggesting that some operators adopted the AI system more readily than others—a known phenomenon in human-AI collaboration where trust depends on individual differences in technology affinity and domain expertise.
Decision acceptability improved 22 percentage points (70% → 92%, ), indicating that operators not only trusted the system but were willing to act on its recommendations. This shift from skepticism to acceptance is critical for deployment success in high-stakes manufacturing environments.
Decision alignment (agreement between AI recommendations and operator actions) improved 19 percentage points (68% → 87%, ). Note that alignment did not reach 100%, which is appropriate: operators retained veto authority and occasionally over-ruled AI recommendations based on contextual knowledge the system lacked.
Cognitive workload reduction of 35% (relative) suggests that explainability features (SHAP values, decision rationales) reduced the mental effort operators expended to understand and evaluate preventive actions. This is valuable for fatigue reduction and error prevention in continuous monitoring roles.
Appendix B.1.2. Operational Impact Results (Table A7)
Downtime reduction achieved 68% improvement (95% CI: 63–73 h/week decrease, ), translating to approximately 1.5 h per week of prevented unplanned downtime per lithography tool. Over a single facility with 5 tools, this represents 7.5 h/week of saved production time.
Yield loss reduction of 65.1% (95% CI: 60–71%, ) indicates that timely preventive actions prevented defect-inducing tool states. This is critical in semiconductor manufacturing, where even small yield reductions cascade through the fab and result in large economic losses.
Maintenance cost reduction of 36% (95% CI: 33–39%, ) reflects both reduced emergency maintenance (which is more expensive than planned maintenance) and better allocation of maintenance resources to high-impact interventions.
Table A7.
Detailed breakdown of human-AI interaction outcomes from Experiment 3. All human factors metrics show statistically significant improvements. Trust metric includes mean and standard deviation. Operational metrics include 95% confidence intervals. All tests corrected for multiple comparisons.
Appendix B.1.3. Synergistic Effect
The alignment of human factors with operational outcomes suggests a synergistic effect: increased trust and acceptability led operators to follow AI recommendations more consistently, which in turn produced measurable improvements in downtime and yield. This reinforces the conclusion that human-in-the-loop AI systems must simultaneously optimize for both human trust calibration and task performance.
References
- Mack, C.A. Fundamental Principles of Optical Lithography; Wiley: Hoboken, NJ, USA, 2007. [Google Scholar]
- SEMI International Standards Committee. Smart Manufacturing and Predictive Maintenance in Fabs; SEMI: Milpitas, CA, USA, 2022. [Google Scholar]
- McKinsey & Company. Need to Boost Semiconductor Fab Efficiency? Look to Maintenance. Available online: https://www.mckinsey.com/industries/semiconductors/our-insights/need-to-boost-semiconductor-fab-efficiency-look-to-maintenance (accessed on 7 June 2026).
- SEMI International. World Fab Forecast. Available online: https://www.semi.org/en/about-semi-membership/about-semi (accessed on 7 June 2026).
- Mobley, R.K. An Introduction to Predictive Maintenance, 2nd ed.; Butterworth-Heinemann: Oxford, UK, 2002. [Google Scholar]
- Tsang, A.H.C. Strategic dimensions of maintenance management. J. Qual. Maint. Eng. 2002, 8, 7–39. [Google Scholar] [CrossRef] [Scilit]
- Jardine, A.K.S.; Lin, D.; Banjevic, D. A review on machinery diagnostics and prognostics implementing condition-based maintenance. Mech. Syst. Signal Process. 2006, 20, 1483–1510. [Google Scholar] [CrossRef] [Scilit]
- Serradilla, O.; Zugasti, E.; Rodriguez, J.; Zurutuza, U. Deep learning models for predictive maintenance: A survey. Neural Comput. Appl. 2022, 34, 11325–11360. [Google Scholar] [CrossRef] [Scilit]
- Tsanousa, A.; Bektsis, E.; Kyriakopoulos, C.; González, A.G.; Leturiondo, U.; Gialampoukidis, I.; Karakostas, A.; Vrochidis, S.; Kompatsiaris, I. A Review of Multisensor Data Fusion Solutions in Smart Manufacturing. Sensors 2022, 22, 1734. [Google Scholar] [CrossRef] [Scilit] [PubMed]
- Samek, W.; Montavon, G.; Vedaldi, A.; Hansen, L.K.; Müller, K.-R. (Eds.) Explainable AI; Springer: Cham, Switzerland, 2019. [Google Scholar] [CrossRef] [Scilit]
- Villalonga, A.; Beruvides, G.; Castaño, F.; Haber, R. Cloud-Based Industrial Cyber-Physical System for Data-Driven Reasoning. Sensors 2019, 19, 1440. [Google Scholar] [CrossRef] [Scilit]
- Maalej, W.; Nayebi, M.; Ruhe, G. Data-Driven Requirements Engineering—An Update. In Proceedings of the 2019 IEEE/ACM 41st International Conference on Software Engineering: Software Engineering in Practice (ICSE-SEIP), Montreal, QC, Canada, 25–31 May 2019; pp. 291–300. [Google Scholar] [CrossRef] [Scilit]
- Lundberg, S.M.; Lee, S.-I. A Unified Approach to Interpreting Model Predictions. In Advances in Neural Information Processing Systems 30; Curran Associates, Inc.: Red Hook, NY, USA, 2017; pp. 4765–4774. [Google Scholar]
- Ribeiro, M.T.; Singh, S.; Guestrin, C. “Why Should I Trust You?”: Explaining the Predictions of Any Classifier. In Proceedings of the 22nd ACM SIGKDD International Conference on Knowledge Discovery and Data Mining, San Francisco, CA, USA, 13–17 August 2016; pp. 1135–1144. [Google Scholar] [CrossRef] [Scilit]
- Abercrombie, D.; Smith, J. Using Predictive Maintenance to Boost IC Manufacturing Efficiency. Semiconductor Engineering. 2024. Available online: https://semiengineering.com/using-predictive-maintenance-to-boost-ic-manufacturing-efficiency (accessed on 19 July 2026).
- Bousdekis, A.; Apostolou, D.; Mentzas, G. Predictive maintenance in the 4th industrial revolution. IEEE Eng. Manag. Rev. 2020, 48, 57–62. [Google Scholar] [CrossRef] [Scilit]
- Venkatasubramanian, V.; Rengaswamy, R.; Yin, K.; Kavuri, S.N. A review of process fault detection and diagnosis: Part I. Comput. Chem. Eng. 2003, 27, 293–311. [Google Scholar] [CrossRef] [Scilit]
- Lee, J.; Bagheri, B.; Kao, H.-A. A Cyber–Physical Systems Architecture for Industry 4.0-Based Manufacturing Systems. Manuf. Lett. 2015, 3, 18–23. [Google Scholar] [CrossRef] [Scilit]
- Zhu, Y.; Wu, J.; Wu, J.; Liu, S. Dimensionality reduce-based for remaining useful life prediction. Reliab. Eng. Syst. Saf. 2022, 218, 108379. [Google Scholar] [CrossRef] [Scilit]
- Zhao, Y.; Yang, J.; Wang, W.; Yang, H.; Niyato, D. TranDRL: A Transformer-Driven Deep Reinforcement Learning Enabled Prescriptive Maintenance Framework. arXiv 2023, arXiv:2309.16935. [Google Scholar] [CrossRef] [Scilit]
- Yao, X.; Marcus, M. Optimal preventive maintenance scheduling in semiconductor manufacturing. IEEE Trans. Semicond. Manuf. 2021, 34, 250–262. [Google Scholar] [CrossRef]
- Ucar, A.; Karakose, M.; Kırımça, N. Artificial intelligence for predictive maintenance applications. Appl. Sci. 2024, 14, 898. [Google Scholar] [CrossRef] [Scilit]
- Yu, W.; Liu, Y.; Dillon, T.; Rahayu, W. Edge Computing-Assisted IoT Framework with an Autoencoder for Fault Detection. IEEE Trans. Ind. Inform. 2023, 19, 5701–5710. [Google Scholar] [CrossRef] [Scilit]
- Molnar, C. Interpretable Machine Learning, 2nd ed. Independently Published, 2022. Available online: https://christophm.github.io/interpretable-ml-book/ (accessed on 19 July 2026).
- Nahavandi, S. Industry 5.0—A human-centric solution. Sustainability 2019, 11, 4371. [Google Scholar] [CrossRef] [Scilit]
- Brèque, M.; De Nul, L.; Petridis, A. Industry 5.0; European Commission: Brussels, Belgium, 2021. [Google Scholar] [CrossRef] [PubMed]
- Khan, U.; Cheng, D.S.; Setti, F.; Fummi, F.; Cristani, M.; Capogrosso, L. A Comprehensive Survey on Deep Learning-based Predictive Maintenance. ACM Comput. Surv. 2024, 25, 25. [Google Scholar] [CrossRef] [Scilit]
- Levinson, H.J.; Brunner, T.A. Current challenges and opportunities for EUV lithography. Proc. SPIE 2018, 10809, 1080903. [Google Scholar] [CrossRef] [Scilit]

Disclaimer/Publisher’s Note: The statements, opinions and data contained in all publications are solely those of the individual author(s) and contributor(s) and not of MDPI and/or the editor(s). MDPI and/or the editor(s) disclaim responsibility for any injury to people or property resulting from any ideas, methods, instructions or products referred to in the content. |
© 2026 by the authors. Licensee MDPI, Basel, Switzerland. This article is an open access article distributed under the terms and conditions of the Creative Commons Attribution (CC BY) license.