


Abstract
ENZ-124, the first approved cetuximab biosimilar by Indian health authorities, was developed using the Chinese hamster ovary cell line, whereas the SP2/0 cell line was used for developing cetuximab originator (Erbitux®). Hence, this assessment aimed to evaluate the physiochemical, structural, and biological characterization of four batches each of Cetuxa®, Lupitux® and cetuximab originator. Analytical methods like peptide mapping (liquid chromatography–tandem mass spectrometry [LC-MS/MS]), glycan mapping (liquid chromatography–fluorescence detection), isoform analysis (hydrophobic interaction chromatography [HIC]-high-performance liquid chromatography), charge variant analysis (capillary electrophoresis coupled with mass spectrometry), FcγRIIIa binding assays, cell-based antibody-dependent cell-mediated cytotoxicity (ADCC) measurement, and host cell protein analysis (LC-MS/MS) were utilized for analysis. Variations in physicochemical and biological attributes were observed between cetuximab originator and its biosimilars. HIC analysis revealed C-terminal heterogeneity and increased hydrophobicity in biosimilars, that with the different N-glycan profile affected charge distribution. Charge variant analysis indicated a more acidic profile for the biosimilars. The biosimilars showed higher oxidation levels and misincorporation. The biosimilars also showed an enhanced FcγRIIIa binding affinity and in vitro ADCC activation compared with cetuximab originator. The study outcomes highlight the ability to differentiate cetuximab originator from its biosimilars Cetuxa® and Lupitux® based on the observed physicochemical and biological differences.
1. Introduction
ENZ-124, manufactured by Enzene Biosciences Ltd., is the first cetuximab biosimilar of the reference medicinal product Erbitux® (trade name of cetuximab originator), approved by India’s Drugs Controller General of India (DCGI) in January 2023 for the treatment of patients with squamous cell carcinoma of the head and neck (SCCHN) indication, following the positive results obtained in the frame of clinical trial CTRI/2019/09/021256 [1] and successively extended to metastatic colorectal cancer (mCRC) indication in November 2025 [2]. ENZ-124, with the same strength as cetuximab originator 100 mg per vial, is currently marketed in India by two companies, Alkem and Lupin, under the trade names Cetuxa® and Lupitux®, respectively. Enzene Biosciences Ltd. remains the sole manufacturer of ENZ-124 for both Alkem and Lupin, and no differences in quality are expected between the two ENZ-124 brands [1,2].
Cetuximab is a chimeric mouse/human recombinant immunoglobulin G1 monoclonal antibody (mAb) that binds to the epidermal growth factor receptor (EGFR), thereby partially occluding the ligand-binding region and sterically preventing the receptor dimerization required for signaling pathway activation [3]. Cetuximab promotes the ligand-independent internalization and degradation of EGFR, terminating tyrosine kinase activity [3]. Cetuximab plays a role in blocking cell proliferation by arresting the cell cycle in the G1 phase, and it also influences the balance of cell apoptosis and survival. In addition to the mode of action (MoA) associated with the steric inhibition of ligand binding to the receptor, cetuximab can also elicit effector functions such as antibody-dependent cell-mediated cytotoxicity (ADCC) involving natural killer (NK) cell activation via FcγRIIIa binding, T-cell recruitment to the tumor, and T-cell priming via dendritic cell maturation [4]. Cetuximab originator is a standard-of-care treatment in patients with mCRC and for locally advanced, recurrent, and metastatic SCCHN [5,6].
Drugs can be registered as biosimilars for an originator biologic product if their similarity to the reference medicinal product is demonstrated in terms of quality characteristics, biological activity, safety, and efficacy through a similarity exercise evaluating their physicochemical and biological characteristics as well as in vitro and in vivo clinical comparability studies, as specified by relevant regulatory guidelines [7,8,9]. Considering the structural complexity of mAbs due to manufacturing process-derived heterogeneity and a large set of post-translational modifications (PTMs), the production and characterization of mAb biosimilars can be quite challenging [8]. For cetuximab, the complexity is comparatively higher due to a second N-glycosylation site located within framework region 3 of the variable domain of the heavy chain, alongside the typical N-glycosylation site in the CH2 domain (HC, Asn88, fragment antigen-binding [Fab] portion and Asn299, fragment crystallizable [Fc] portion, respectively, as reported in the Supplementary Figure S1). Considering the four N-glycosylation sites in cetuximab, this dramatically increases potential glycan heterogeneity, adding a risk of failing in achieving analytical and functional biosimilarity between cetuximab originator and candidate biosimilars [10].
Cetuximab originator is manufactured using mouse myeloma cells (SP2/0), whereas Cetuxa® and Lupitux® were produced using Chinese hamster ovary (CHO) cells. The use of different cell lines could further introduce product-related impurities, e.g., PTMs, and process-related impurities [10]. SP2/0 cells express mAbs containing glycoforms with terminal galactose-alpha-1,3-galactose (α-Gal) and N-glycolylneuraminic acid (NGNA), whereas CHO cell lines primarily express mAbs containing N-acetylneuraminic acid (NANA), which is commonly observed in humans, and do not express mAbs containing the α-Gal moiety [10,11].
Biosimilar guidelines allow the use of cell lines for biosimilar production different from those used for originator production, although the critical quality attributes (CQAs) and specifically N-glycosylation profiles may be affected by the chosen cell line [8,10,11]. The scope of this manuscript is to perform for the first time a physicochemical, structural, and biological characterization of four batches of Cetuxa® and four batches of Lupitux® from CHO cell line vs. four batches of cetuximab originator from Sp2/0 cell line, with the aim to purely display the CQAs fingerprint of the two products avoiding any speculation on the potential impacts of any differences observed on efficacy and safety.
2. Materials and Methods
Erbitux® (batches G02KXH, G02KXJ, G02KXK, G01CFB) was manufactured by Merck KGaA, Darmstadt, Germany. The two Indian biosimilars used in the comparative analysis were Cetuxa® (batches M1242314A, M1242402C, M1242405B, M1242301A; Alkem Oncology, Mumbai, India) and Lupitux® (batches M1242401A, M1242405A, M1242411A, M1242303A; Lupin Ltd., Mumbai, India). The biosimilar batches tested were the only available on market at the time of the present study. All three products were used at a concentration of 5 mg/mL, with a formulation comprising 10 mM citric acid, 100 mM glycine (Gly), 100 mM sodium chloride (NaCl), and 0.01% Tween 80 (pH 5.5). Additionally, the current secondary reference house standard Erbitux® 2023/01 sample was used as reference material. The double-hierarchical clustering with average method for CQAs fingerprint evaluation of Erbitux® with respect to Cetuxa® and Lupitux® was performed using the software JMP® 18.0.1 (version 18.0.1, JMP Statistical Discovery LLC, Cary, NC, USA).
2.1. Analytical Methods
The complete characterization panel, the list of CQAs and the result of the analytical tests applied for the comparability of cetuximab originator with its biosimilars are summarized in Table 1. All the state-of-the-art methodologies applied to compare the physicochemical and biological properties of the products have been qualified following the guidelines ICH Q2(R2) and USP 1033. Specificity, linearity, accuracy and precision have been verified, and the methods are considered fit for intended use.
Table 1.
Characterization panel applied for the comparability of cetuximab originator and its biosimilars.
2.1.1. Peptide Mapping Using Liquid Chromatography–Tandem Mass Spectrometry (LC-MS/MS)
Each sample (200 μg) was diluted with Milli-Q water to a final volume of 100 μL. A measurement of 100 μL of denaturing buffer (6.3 M urea, 1 M guanidine-hydrochloric acid [HCl], 100 mM Tris, 1 mM ethylenediaminetetraacetic acid, pH 8.0) was then added. Samples were first reduced with 100 mM dithiothreitol (DTT, Merck, Darmstadt, Germany) for 30 min at 47 °C and then alkylated with 200 mM iodoacetamide (Merck) for 30 min at room temperature (RT) in the dark. Samples were split into two aliquots: one treated with chymotrypsin (Promega, Madison, WI, USA, enzyme:substrate ratio, 1:10) and the other treated with Lys-C/trypsin mixture (Promega; enzyme:substrate ratio, 1:10). Briefly, the first aliquot was diluted 1:3 with hydrolysis buffer containing 100 mM Tris-HCl pH 8.0 and allowed to react for 2 h at 47 °C. The second aliquot was hydrolyzed for 1 h at 47 °C, and then hydrolysis buffer 100 mM Tris-HCl pH 8.0 was added to dilute the sample 1:3 to activate trypsin; next, incubation was performed for an additional hour in the same working conditions. After the reaction, the second aliquot was further split to perform deglycosylation by adding peptide-N-glycosidase (PNGase) F (Agilent) at 1 mU of PNGase per 0.5 μg of protein, followed by incubation for an additional 2 h at 47 °C. At the end of all reactions, 10% formic acid (FA) in water was added for acidification to terminate enzyme activity. Samples were analyzed using a Xevo G2-XS Q-TOF mass spectrometer (Waters, Wilmslow, UK) in the MSE mode using an Acquity ethylene bridged hybrid (BEH) C18 column 1.7 μm (2.1 μm × 100 mm at a flow rate of 0.4 mL/min). The operating temperatures of the autosampler and column oven were 5 °C and 60 °C, respectively. An ultraviolet (UV) detector was set at a wavelength of 214 nm. Next, 5 μL of each preparation was injected and eluted with a mixture of 0.1% FA in water (mobile phase A) and 0.1% FA in acetonitrile (ACN, mobile phase B), employing a gradient starting at 98% of mobile phase A. The initial conditions were maintained for 1 min, followed by an 80 min gradient in which the proportion of mobile phase B was increased to 90%. The column was then washed for 4 min with 90% mobile phase B and re-equilibrated for 15 min under the initial conditions. The mass spectrometer was operated with the following parameters: capillary voltage 3 kV, sampling cone voltage 30 V, source temperature 100 °C, desolvation temperature 250 °C, cone gas flow 0 L/h, desolvation gas flow 800 L/h, scan time 1 s, scan range 100–2000 m/z, and high-energy ramp range 25–45 V. Data were processed using UNIFI software (Waters connect, 3.0, Waters, Wilmslow, UK). Peptides and related PTMs were identified using a 20 ppm mass accuracy threshold, followed by manual inspection of the mass spectra, if needed. For the evaluation of the obtained results, application of the CV% (Supplementary Table S1) resulted in the definition of minimum (Min) and maximum (Max) value which served to establish the comparability corridor for biosimilars.
2.1.2. Glycan Mapping with Liquid Chromatography–Fluorescence
Samples were diluted to a final concentration of 2 mg/mL in Milli-Q water, and 7.5 µL of the diluted samples was mixed with 15.3 µL of Milli-Q water and 6 µL of GlycoWorks Rapid Buffer with 5% (w/v) RapiGest SF (Waters). The mixture was incubated at 90 °C for 3 min. A 1.2 µL aliquot of Rapid PNGase F (Waters) was added, and the solution was incubated at 50 °C for an additional 5 min and cooled for 3 min. The released N-glycans were fluorescently labeled using RapiFluor-MS reagent (Waters, Wilmslow, UK); 9 mg of the reagent was diluted in 131 µL of anhydrous N-dimethylformamide (VWR), and 12 µL of the solution was added to each sample and incubated at RT for 5 min. The samples were then diluted with 358 µL of ACN. The derivatized N-glycan molecules were purified using a GlycoWorks µElution plate (Waters). The wells were conditioned with 200 µL of Milli-Q water and equilibrated with 200 µL of ACN and water at an 85:15 ratio. Diluted labeled glycan samples were then loaded onto wells, which were washed with two volumes of 600 µL of ACN, water, and FA at a 90:9:1 ratio. Glycans were eluted with three volumes of 30 µL of solid phase extraction elution buffer (200 mM ammonium acetate:ACN, 95:5). A Waters Acquity BEH amide column (130 Å, 1.7 µm, 2.1 × 150 mm) was used for all analyses. The operating temperatures of the autosampler and column oven were 5 °C and 60 °C, respectively. A hydrophilic interaction liquid chromatography column was installed on an ultra-performance liquid chromatography system (UPLC; Waters), and the sample injection volume was 100 µL. The fluorescence detector was set at an excitation wavelength of 265 nm and emission wavelength at 425 nm. An elution gradient was applied using 50 mM ammonium formate (pH 4.4; mobile phase A) and ACN (mobile phase B) at a flow rate of 0.4 mL/min. The applied gradient was initiated at 25% of mobile phase A, followed by a 75 min gradient in which the proportion of mobile phase A was increased to 43%. The column was then washed for 4 min with 100% of mobile phase A and then re-equilibrated for 10 min under the initial conditions. Peaks were integrated using Empower software (3.5, Waters, Wilmslow, UK). Glycan characterization was performed using an Orbitrap Fusion Lumos mass spectrometer (Thermo Scientific, Waltham, MA, USA), with a mass spectrometer scan range of 520–3000, operated in the data-dependent acquisition mode, and an Orbitrap resolution of 15,000. Data were processed using Expressionist software (18.5, Genedata, Basel, Switzerland). For the evaluation of the obtained results, application of the CV% (Supplementary Table S2) resulted in the definition of minimum (Min) and maximum (Max) values which served to establish the comparability corridor for biosimilars.
2.1.3. Isoform Analysis Using Hydrophobic Interaction Chromatography (HIC)–High-Performance Liquid Chromatography (HPLC)
Isoform analysis was performed using HIC with fluorescence detection using an Alliance HPLC system. Briefly, 25 μg of the sample (5 µL) was injected without any treatment using a TSKgel Butyl-NPR column 2.5 μm, 4.6 × 350 mm at a flow rate of 1.0 mL/min. The operating temperatures of the autosampler and column oven were 5 °C and 30 °C, respectively. The emission and excitation wavelengths were 350 nm and 278 nm. The analyte species were separated and eluted under decreasing salinity caused by the gradient with 0.1 M sodium phosphate, 1.8 M ammonium sulfate pH 7.0 (mobile phase A), and 0.1 M sodium phosphate pH 7.0 (mobile phase B), employing a 20 min gradient for mobile phase B that increased from 40% to 80%. The column was then washed for 5 min with 100% mobile phase B and re-equilibrated for 10 min under the initial conditions (40% mobile phase B).
2.1.4. Charge Variant Analysis Using Capillary Electrophoresis–MS (CE-MS)
Samples were washed and diluted to a final concentration of 1 mg/mL using the kit diluent and analyzed with a Native kit (908 devices, Native BGE and HRN chip). A ZipChip (908 device) was interfaced with Orbitrap Q-Exactive HF-X (Thermo Scientific, Waltham, MA, USA) and operated under the following parameters: Orbitrap resolution 30 K, scan range 2500–8000, trapping gas pressure 1.50 bar, and microscans 10. Data were processed using Expressionist software (18.5, Genedata, Basel, Switzerland). Species identification was performed using a 50 ppm mass accuracy threshold, followed by manual inspection of the mass spectra, if needed.
2.1.5. FcγRIIIa Receptor Binding Assay
The interaction between cetuximab samples and human FcγRIIIa was investigated using surface plasmon resonance (SPR) on a Biacore T200 system (Cytiva, Uppsala, Sweden). HEPES-buffered saline (HBS)-EP+ running buffer was prepared from HBS-EP+ 10× (Cat. BR100826; Cytiva). An anti-His-tag antibody, RRID: AB_2571551, was immobilized on a CM5 sensor chip to capture the His-tagged human FcγRIIIa reagent (Cat. 4325-FC; R&D Systems, Minneapolis, MN, USA). The receptor was injected at a flow rate of 5 µL/min for 1 min, achieving approximately 50 RU of capture level. Cetuximab, the analyte, was serially diluted (two-fold) from 2000 nM to 125 nM and injected using the single-cycle kinetic mode. The contact and dissociation times were set to 60 s and 300 s, respectively. Measurements were taken at a flow rate of 30 µL/min and a temperature of 25 °C.
Data analysis was conducted using Cytiva, and the affinity constant (KD) was calculated using a two-state reaction model algorithm. The results, derived from two independent experiments, are presented as absolute KD values in molarity, along with the corresponding percent coefficient of variation (CV%) values. Additionally, relative KD values (KD%), normalized to the reference material, are provided for comparative analysis. For the evaluation of the obtained results, application of the CV% = 9.6 resulted in the definition of minimum (Min) and maximum (Max) value which served to establish the comparability corridor for biosimilars.
2.1.6. Cell-Based ADCC Measurement
To measure ADCC, a reporter gene assay (RGA) was used for the quantitative measurement of signal activation by cetuximab originator and its biosimilars. A431 cells (Merck) and Jurkat/FcγRIIIα/NFAT-Luc reporter cells (Promega) were resuspended in an assay medium (RPMI-1640 supplemented with 0.5% ultra-low IgG fetal bovine serum) at concentrations of 0.3 × 10⁶ cells/mL and 3.75 × 10⁶ cells/mL, respectively, to achieve an effector-to-target ratio of 12.5:1. Cetuximab and the tested biosimilars were serially diluted in the assay medium at a 1:4 dilution ratio to generate 8-point concentration curves starting from 6000 ng/mL. The bioassay was performed in white 96-well plates, with each well containing 40 μL of the following components added sequentially: A431 target cells, serially diluted test antibodies, and Jurkat/FcγRIIIα/NFAT-Luc effector cells. The plates were incubated at 37 °C in humidified atmosphere with 5% carbon dioxide for 24 h. Following incubation, 120 μL of the Bio-Glo™ Luciferase Assay reagent was added to each well, and the plates were incubated at RT for 15 min with orbital shaking at 300 rpm. Luminescence signals were measured using a microplate luminometer (Infinite 200Pro, Tecan, Männedorf, Switzerland), with an integration time of 5 s per well. Luminescence data were analyzed using GraphPad Prism software (Version 10.2.1, GraphPad Software, San Diego, CA, USA) for dose–response curve fitting and statistical analyses. For the evaluation of the obtained results, application of the CV% = 15.0 resulted in the definition of minimum (Min) and maximum (Max) values which served to establish the comparability corridor for biosimilars.
2.1.7. Host Cell Protein (HCP) Analysis Using LC-MS/MS
Five microliters of 100 mM Tris (pH 8.0) native digestion buffer were added to a solution containing 1000 μg of protein, followed by the addition of 2 μL of an internal standard solution. The mixture was diluted with Milli-Q water to a final volume of 200 μL. Trypsin Gold (Promega) solution (10 μL; 1 mg/mL; enzyme-to-mAb ratio, 1:100) was added to the sample, which was incubated at 37 °C for 2 h. Samples were reduced by incubating with 100 mM DTT (Merck, Darmstadt, Germany) for 10 min at 90 °C and were centrifuged at 10,620 g for 5 min at 8 °C. After centrifugation, the supernatant was transferred to a clean UPLC vial, and 5 μL of 10% FA solution in Milli-Q water solution was added to the sample to stop the hydrolysis reaction. The samples were analyzed using an Orbitrap Q-Exactive HF-X mass spectrometer (Thermo Scientific, Waltham, MA, USA) in the data-independent acquisition mode using an Acquity column, peptide charged surface hybrid C18, 130 Å,1.7 μm, 2.1 × 150 mm, at a flow rate of 0.2 mL/min. The operating temperatures of the autosampler and column oven were 5 °C and 60 °C, respectively. The UV detector was set at a wavelength of 214 nm. Each preparation (70 μL) was injected and eluted with a mixture of 0.1% FA in water (mobile phase A) and 0.1% FA in ACN (mobile phase B), using a gradient starting at 99% of mobile phase A. The initial conditions were held for 2 min, followed by a 90 min gradient in which the proportion of mobile phase B was increased to 55% and held in these conditions for an additional 2 min. The column was then washed for 2 min with 90% mobile phase B and re-equilibrated for 22 min under the initial conditions. The mass spectrometer was operated using the following parameters: sheath gas 45 Arb, aux gas 10 Arb, sweep gas 2 Arb, capillary temp 250 °C, funnel RF level 40, aux gas heater temp 400 °C, scan range 400–900 m/z, Orbitrap resolution 60,000, automated gain control target 3.0 e6, maximum injection time 65 s, MS/MS Orbitrap resolution 30,000, and higher-energy collisional dissociation collision energy 27%. Data was processed using Spectronaut software (14.9, Biognosys, Zurich, Switzerland).
3. Results
3.1. Statistical Approach for Biosimilarity Assessment
The purpose of the study was to carry out a comprehensive physicochemical and functional characterization study for a qualitative and quantitative comparison between cetuximab originator and its biosimilars. Due to the limited number of biosimilar batches available for this study, it was not possible to apply a statistical tool to reach the optimal power of the test. For the same reason, it was not possible to properly set the acceptance criteria for the quality range based on severity assessment of each CQA.
Consequently, the acceptance criteria implemented have been established by generating ranges, representing the minimum and maximum comparability corridors, through the μ ± 3σ approach. For this purpose, the CV% of the intermediate precision (%CVIP) of analytical methods, carried out from the validation studies, and the observed mean value of cetuximab originator batches tested in the present study (MEAN) were considered.
During the validation studies, the %CVIP was obtained through the variance component from the nested ANOVA model [12].
where and are the variance components estimated by the nested ANOVA model and is the average of the CQA observed during the validation study.
The acceptance criteria mentioned above were established by using the MEAN and the standard deviation of the intermediate precision (SDIP):
where .
(Min; Max) = (MEAN – 3 × SDIP; MEAN + 3 × SDIP)
For the evaluation of each CQA comparison, the MEAN value of the four batches tested for each biosimilar has been considered with respect to the comparability corridor set. This approach has been evaluated as the most suitable taking also into account that the batch genealogy of each biosimilar analyzed was not available.
The complete characterization panel applied in the present study is reported in Table 1. The CV% applied to calculate the SD for each method are reported in the Materials and Methods section and the Min–Max of the comparability range established for each CQA analyzed is reported in the relevant table or figure of the Results or Supplementary Data sections (Supplementary Figures S2–S9 and Supplementary Tables S3–S19).
3.2. Primary Structure and PTMs
3.2.1. C-Terminal Heterogeneity
For cetuximab, C-terminal heterogeneity refers to the variation in C-terminal lysine (Lys) residue content, which occurs when carboxypeptidases, such as carboxypeptidase D in CHO cells [13], remove Lys from the C-terminus of the HC during production. This amino acid loss generates different isoforms, one with both Lys residues, the other with just one Lys residue, and the third one with none; it represents a common source of heterogeneity that should be controlled throughout the production process. C-terminal heterogeneity was assessed using intact molecule analysis by LC-MS, peptide mapping analysis by LC-MS/MS, and HIC.
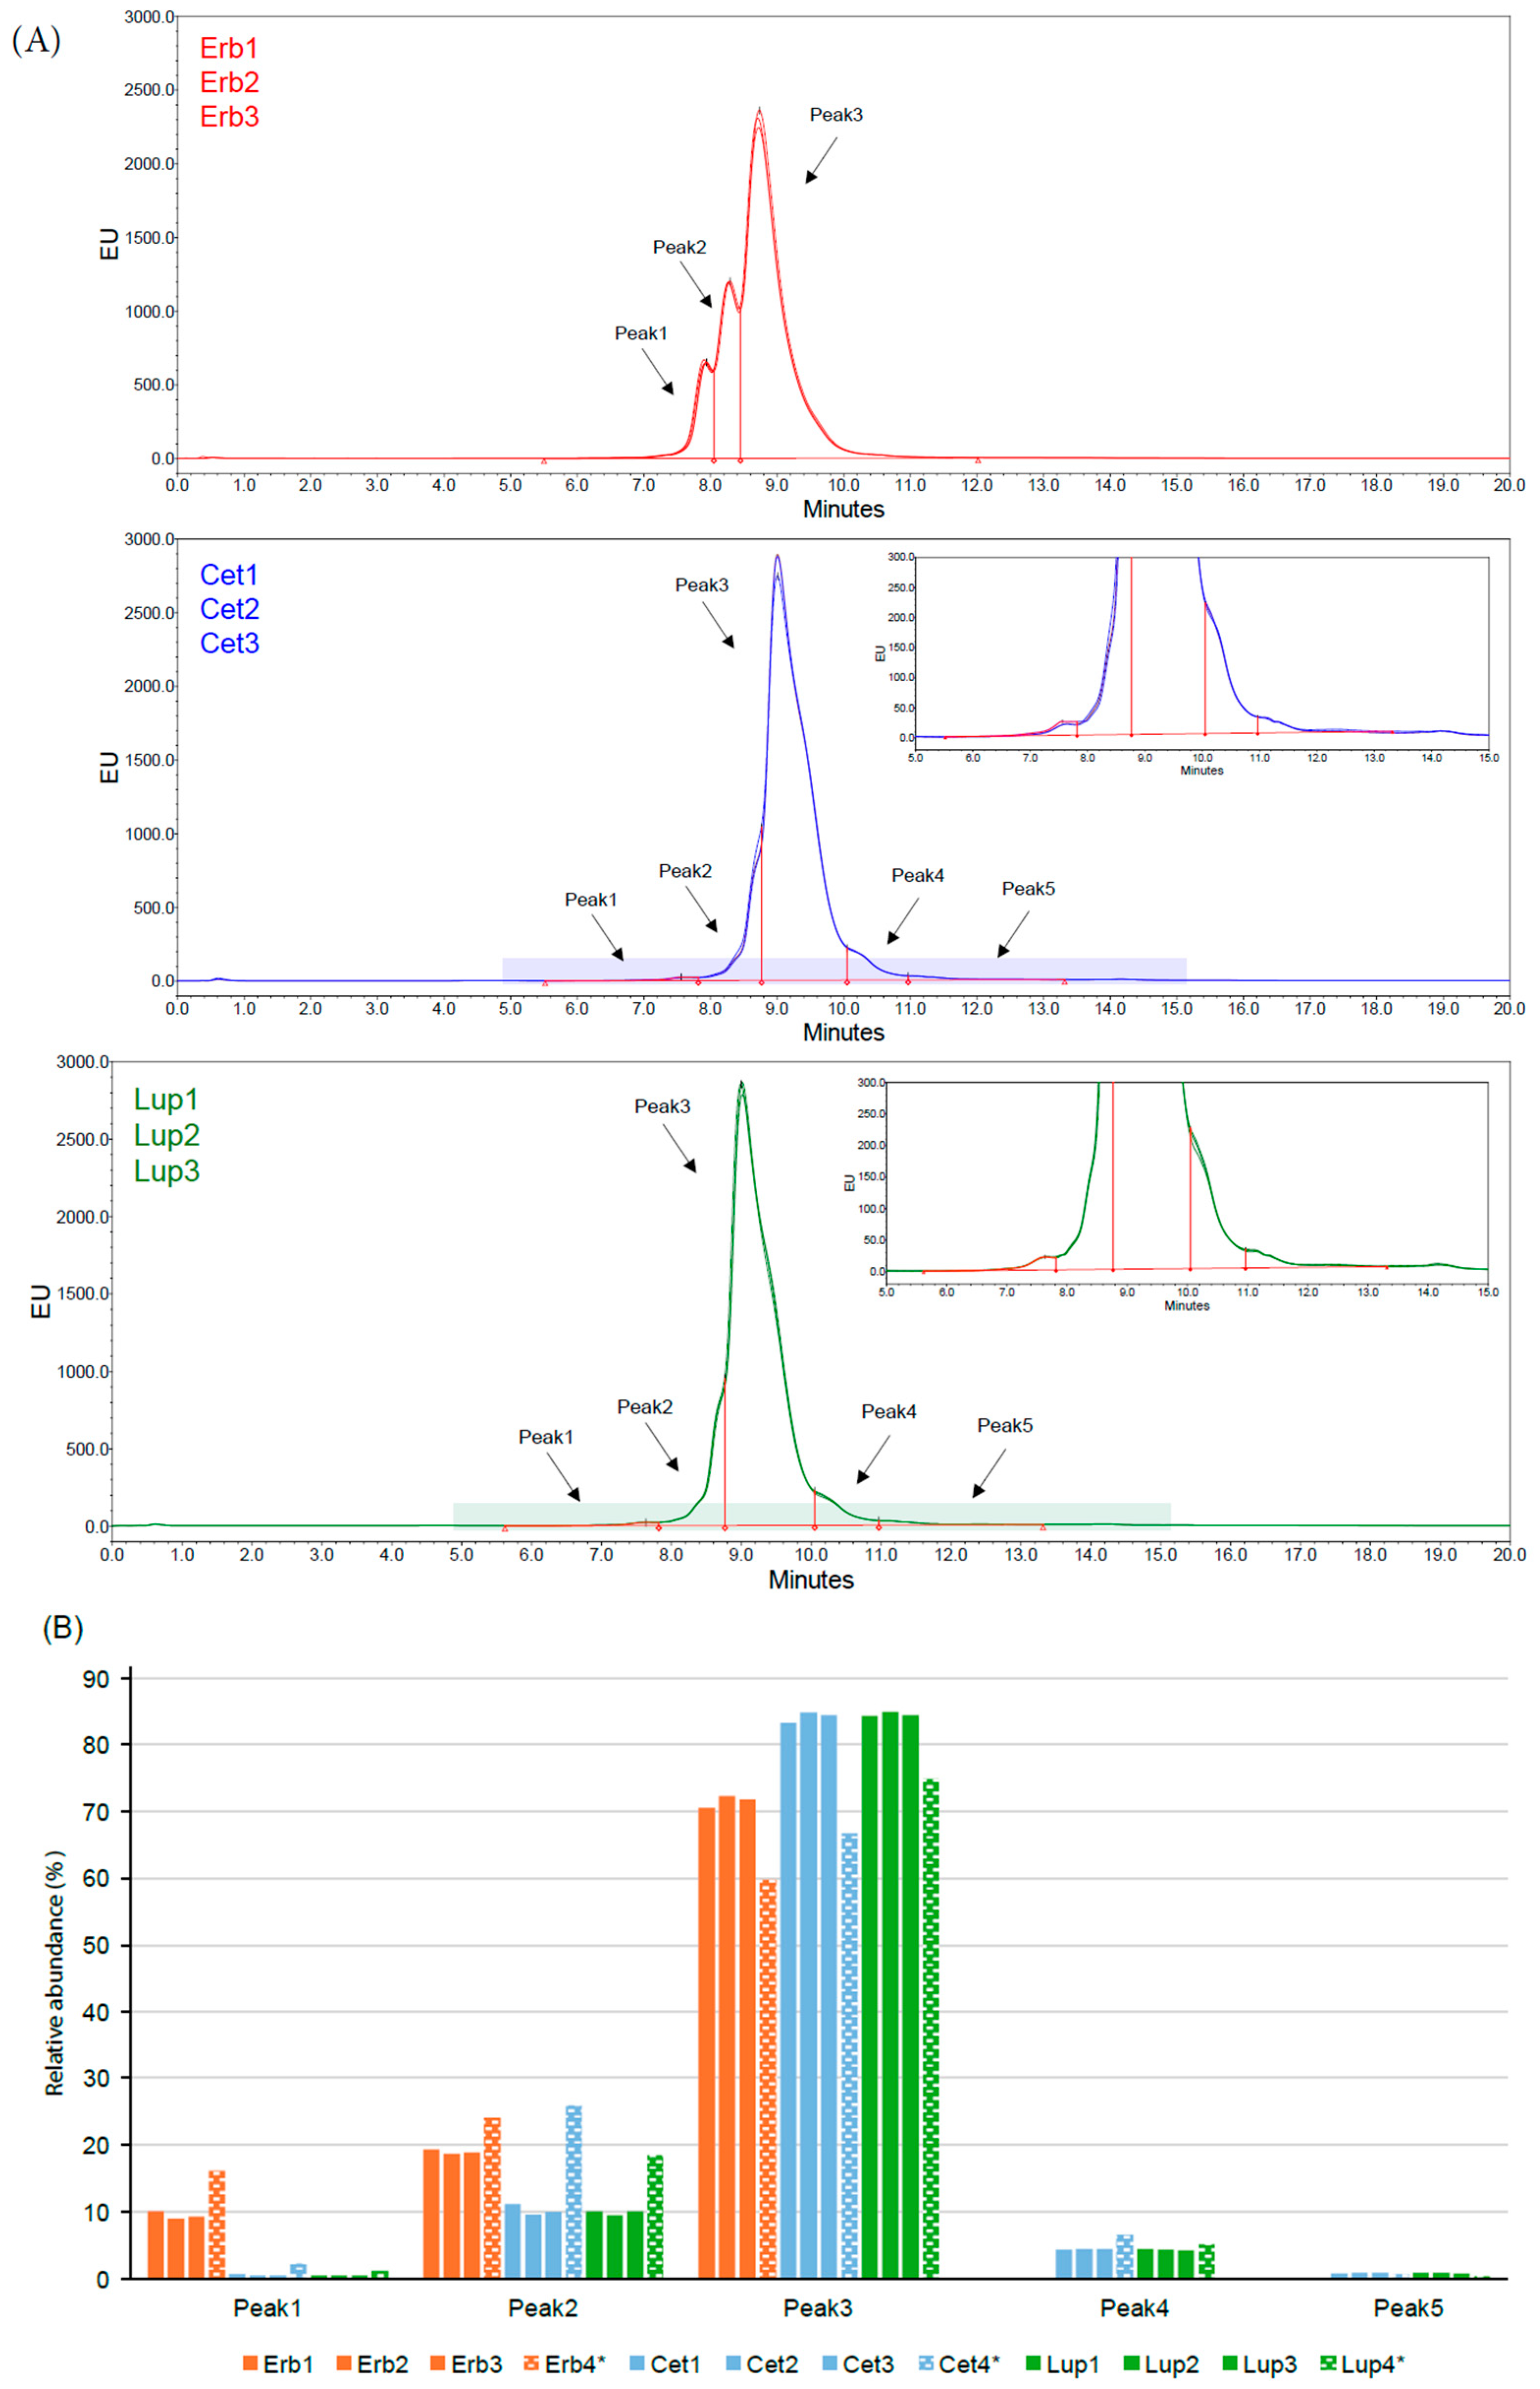
HIC was used for the identification of the three isoforms at the HC C-terminus: peak 1 refers to the molecule containing both C-terminal Lys residues, peak 2 refers to the molecule containing just one Lys residue, and peak 3 represents the molecule lacking C-terminal Lys residues on both HCs. Additionally, Cetuxa® and Lupitux® were characterized by two other peaks, which are likely associated with their different glycosylation patterns (Figure 1A,B). Indeed, the deglycosylation of cetuximab originator samples and biosimilar samples determines an alignment of the retention time in their HIC profiles, with the loss of the two additional peaks demonstrating that the source of the difference in the two profiles is mainly related to the glycosylation (Supplementary Methodology and Supplementary Figure S9).
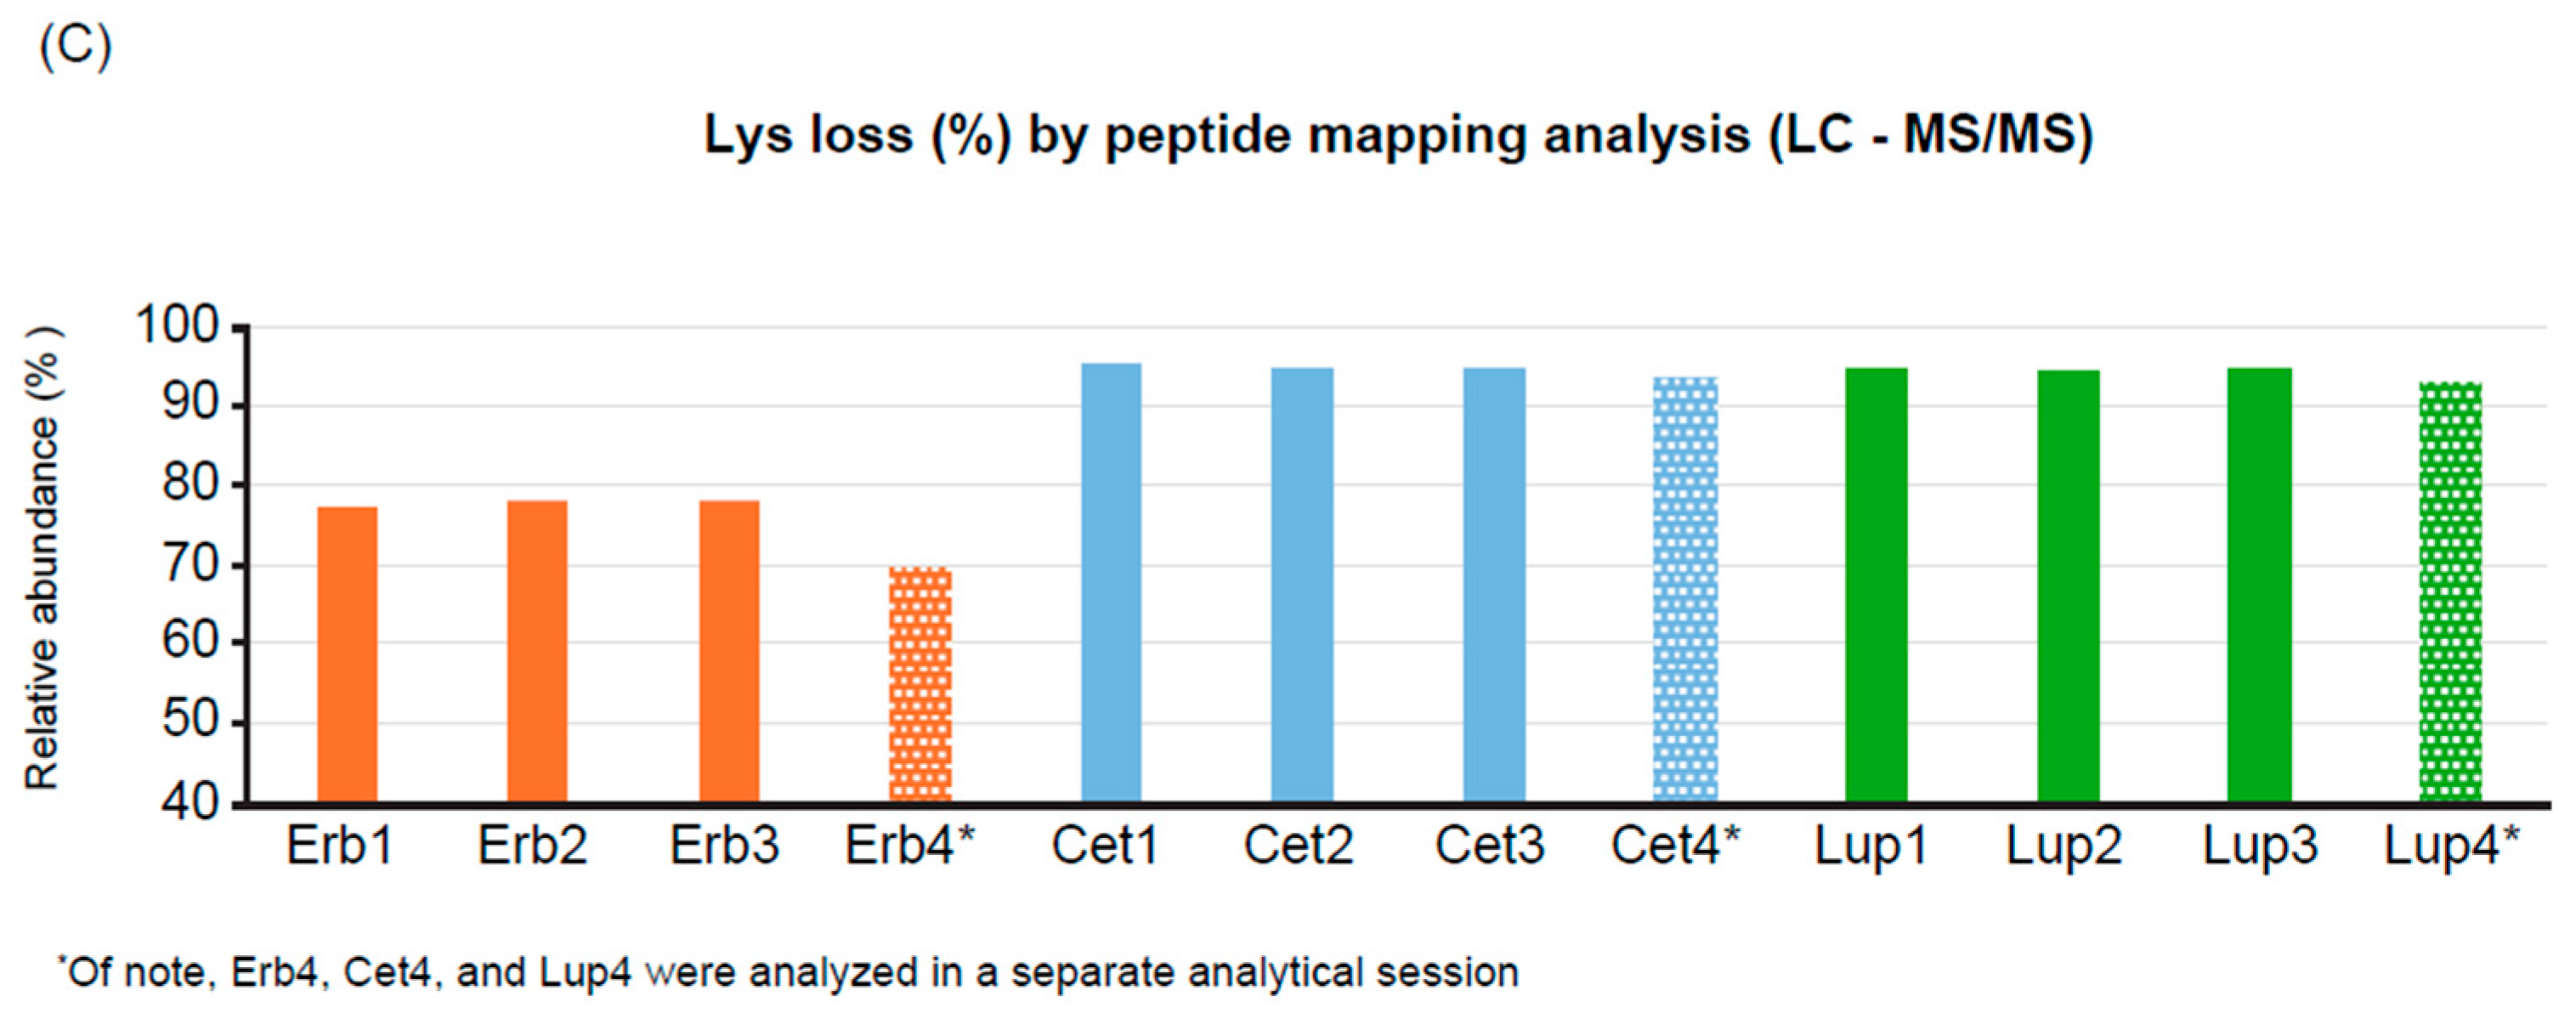
Both biosimilars showed a decrease in the species bearing two Lys residues or the partially truncated species with one Lys compared with cetuximab. Overall, this higher loss of the terminal residues, together with different glycosylation patterns, caused an increase in hydrophobicity compared with cetuximab originator. This data was also confirmed by peptide mapping analysis (Figure 1C) and intact molecule analysis (Supplementary Methodology, Supplementary Table S20, Supplementary Figure S2). Moreover, the data produced by the external laboratory confirm these observations (Supplementary Tables S21 and S22).
Figure 1.
Assessment of C-terminal heterogeneity in cetuximab originator and its biosimilars: (A) HIC profiles of Erbitux®, Cetuxa®, and Lupitux®. (B) Distribution of peaks for all analyzed species using HIC is shown. HIC data of Erb4, Cet4, and Lup4 were obtained in a separate analytical session. (C) Lys loss determined by peptide mapping analysis using LC-MS/MS. Cet, Cetuxa®; EU, emission unit of fluorescence; Erb, Erbitux® (cetuximab originator); HIC, hydrophobic interaction chromatography; LC-MS/MS, liquid chromatography–tandem mass spectrometry; Lup, Lupitux®; Lys, lysine.
3.2.2. Misincorporation
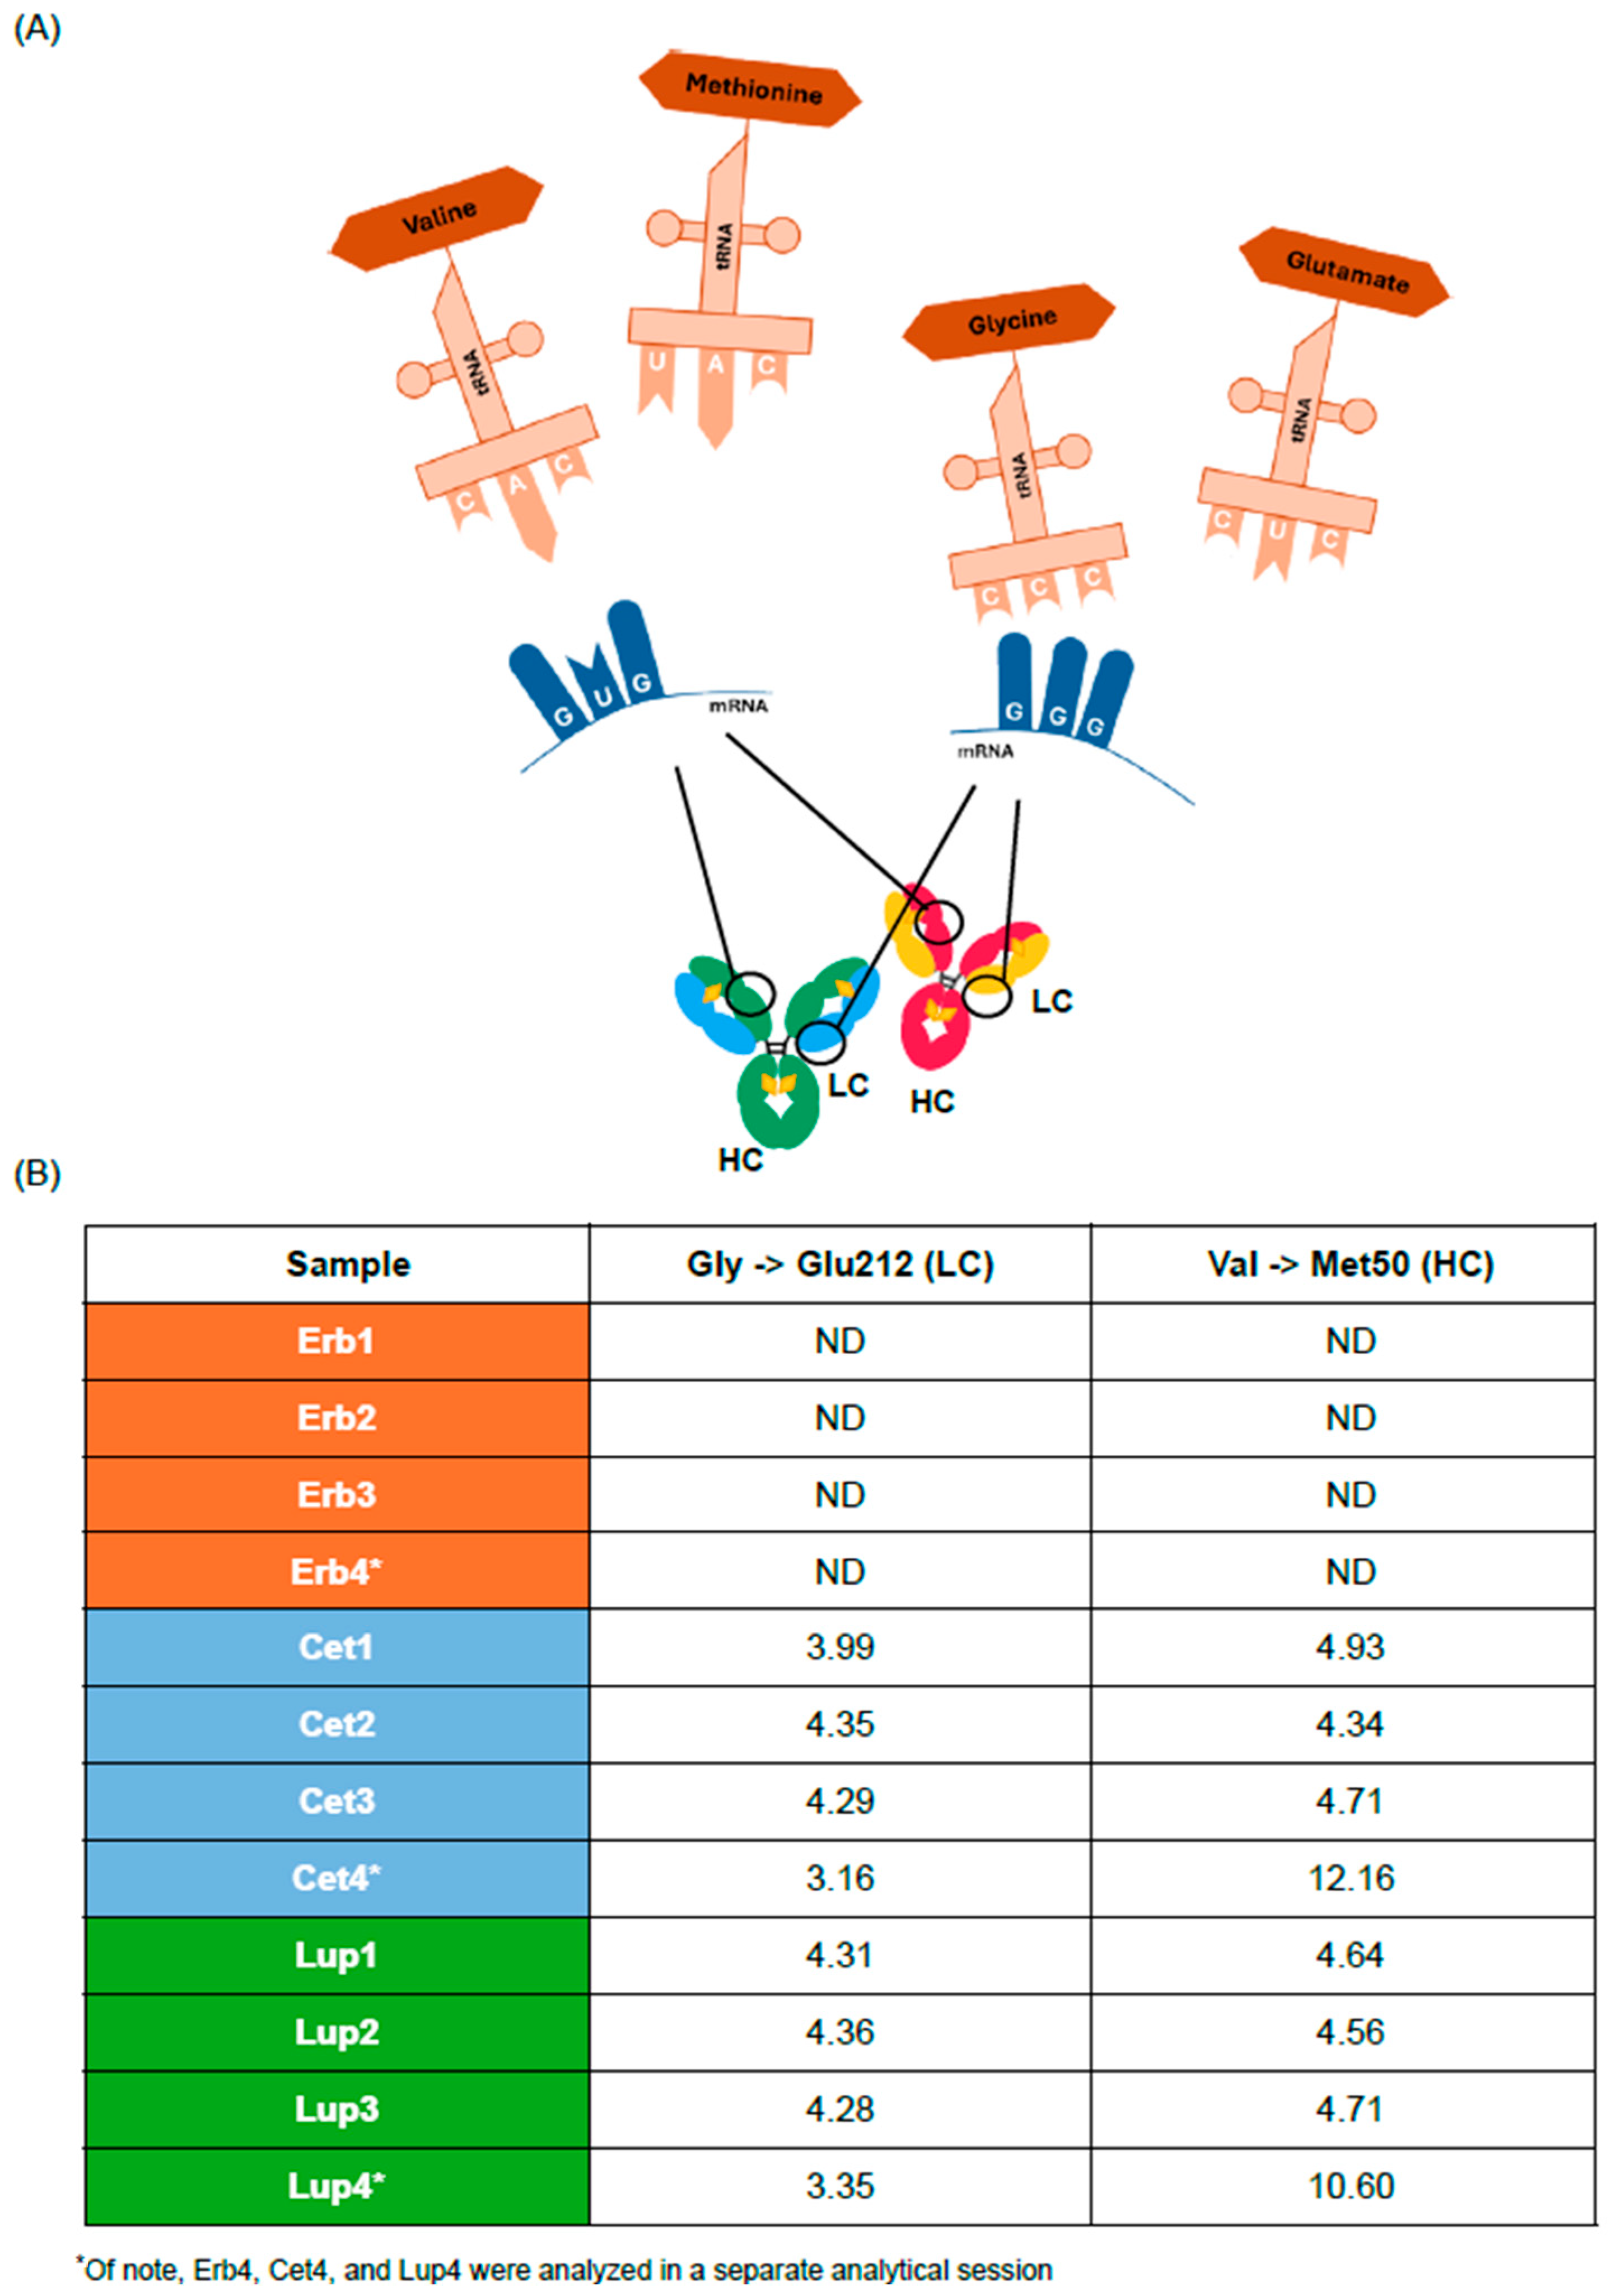
Misincorporation refers to the incorrect incorporation of an amino acid in the primary structure of a molecule, occurring in a growing peptide chain during biological processes such as DNA replication or protein synthesis. These events can occur due to errors in the template or during the enzymatic processes that facilitate these incorporations. The most common method to identify amino acid misincorporation is LC-MS/MS. Two significant amino acid misincorporations were identified in the biosimilar samples, and none were found in the cetuximab originator samples. Misincorporations of a methionine (Met) residue in place of valine (Val) 50 on HC and a glutamic acid (Glu) residue in place of glycine (Gly) 212 on the light chain (LC) were detected (Figure 2A).
Gly→Glu212 misincorporation was present with an average relative abundance of 3.95–4.08% in all biosimilar batches, whereas Val→Met50 misincorporation was detected with a relative abundance of 4.34–12.16% (Figure 2B) that was not detected in the cetuximab originator; these data were confirmed also using intact molecule analysis (Supplementary Table S20). Moreover, the data produced by the external laboratory confirm these observations (Supplementary Table S21).
The impact of these misincorporations must be evaluated carefully, as the first one potentially introduces a change in the charge distribution that might alter the mAb structure, affecting the C-terminal region of the LC (hinge region), which plays a critical role in activating effector functions [14]; the second misincorporation inserts an additional oxidizable residue in the complementarity-determining region (CDR).
Figure 2.
Assessment of misincorporations in cetuximab originator and its biosimilars: (A) Scheme of the possible mechanisms of the misincorporations found in the Cetuxa® and Lupitux® samples. (B) Relative abundance (%) of the detected misincorporations determined using peptide mapping analysis by LC-MS/MS. C, cytosine; Cet, Cetuxa®; Erb, Erbitux® (cetuximab originator); G, guanine; Glu, glutamic acid; Gly, glycine; HC, heavy chain; LC; light chain; Lup, Lupitux®; Lys, lysine; Met, methionine; ND, not detected; U, uracil; Val, valine.
3.2.3. Oxidation Level
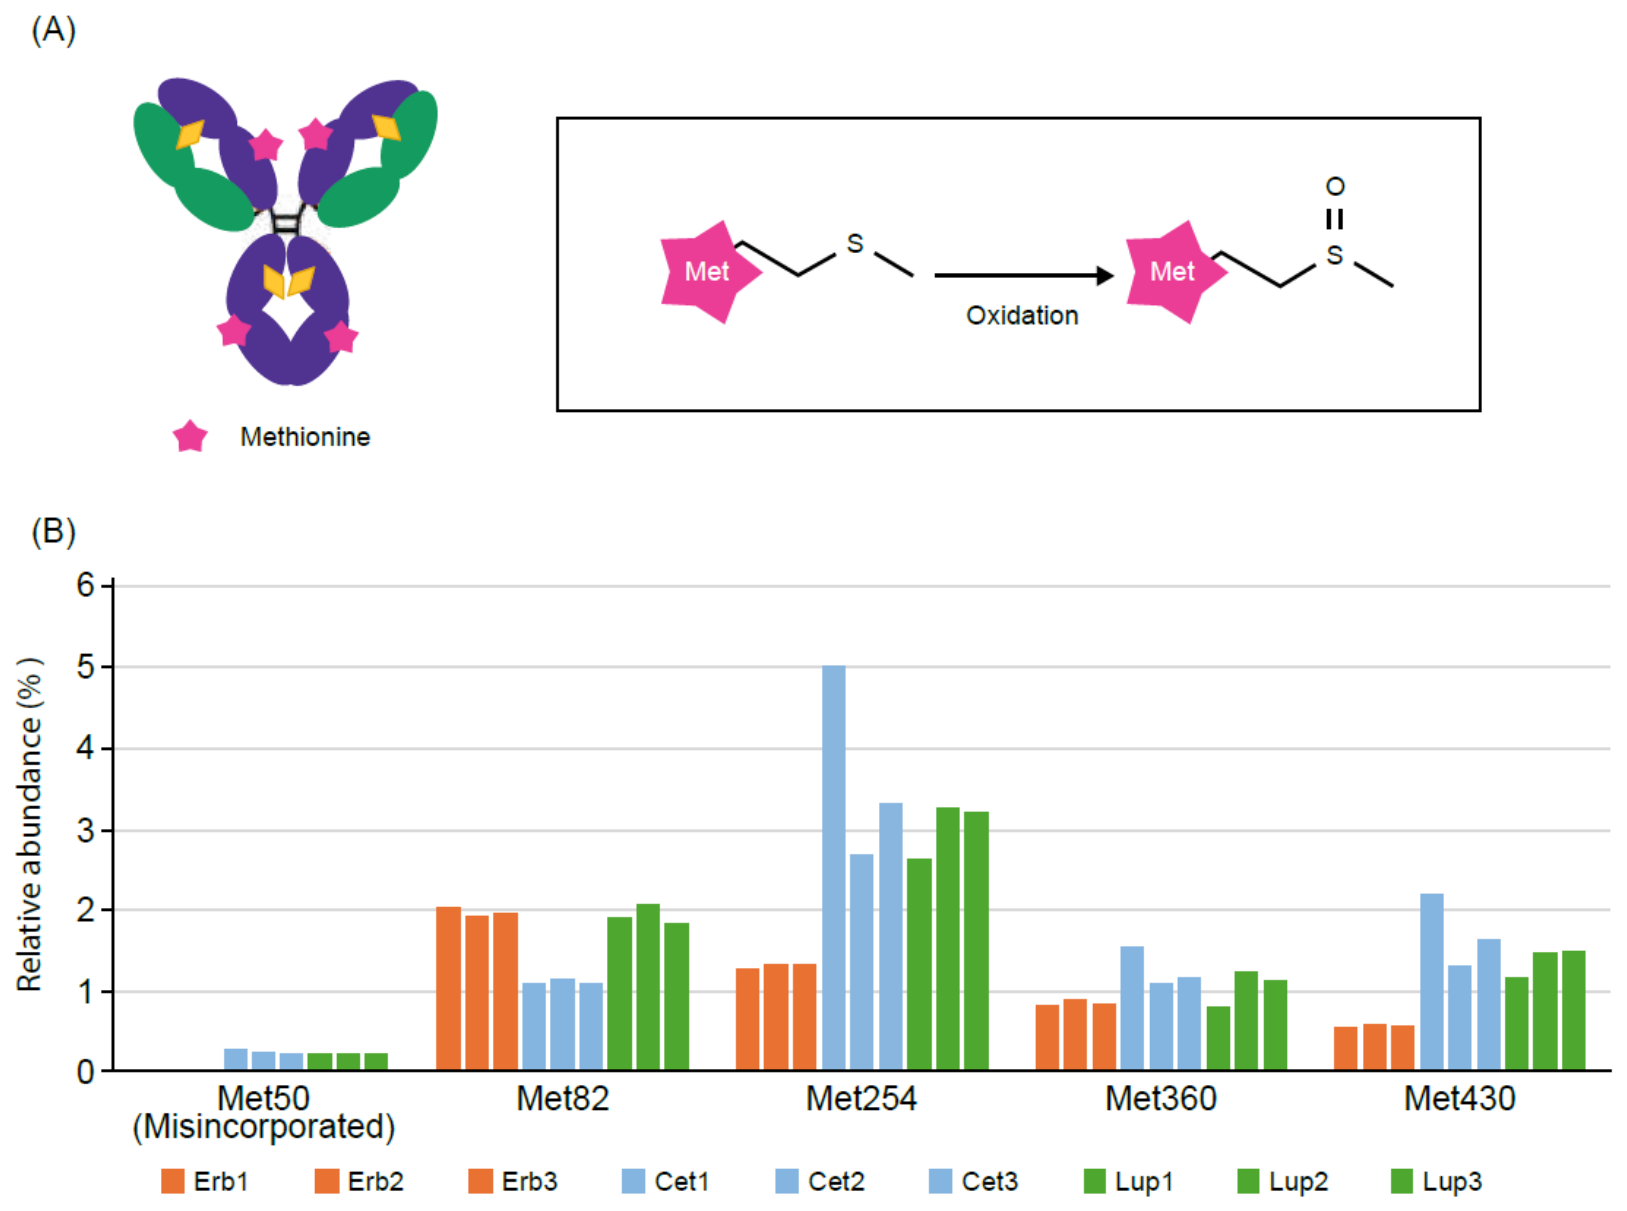
Oxidation levels were assessed using LC-MS/MS, which allows the accurate determination of the modification site (Figure 3A). The analysis revealed that oxidation levels were overall higher in the biosimilar samples than in the cetuximab originator samples (Figure 3B).
Compared with the cetuximab originator, the biosimilars contained an additional Met at position 50 due to the Val→ Met50 misincorporation that introduces another site sensitive to oxidation (Supplementary Methodology and Supplementary Table S23). In general, biosimilars present a higher level of oxidation. Notably, the data produced by the external laboratory confirm these observations (Supplementary Table S21).
Figure 3.
Assessment of oxidation level in cetuximab originator and its biosimilar: (A) Mechanism of oxidation. Peptide mapping allows accurate determination of the site of modifications, which can be crucial for assessing their biological impact. (B) Relative abundance (%) of the detected oxidation obtained by peptide mapping analysis. Cet, Cetuxa®; Erb, Erbitux® (cetuximab originator); Lup, Lupitux®; Lys, lysine; Met, methionine; ND, not detected; O, oxygen; S, sulfur.
3.3. Glycosylation Profile
As reported above, the cetuximab molecule is characterized by two different N-glycosylation sites (two for each HC), one in the Fab portion and the other in the Fc portion. Glycan mapping is the most common analysis for the characterization of this quality attribute and is based on the enzymatic release of glycans using N-glycanase from all sites of the molecule, followed by UPLC analysis, which provides a fingerprint of the total N-glycan distribution in the molecule (Figure 4A).
As expected, according to the different cell lines that are used to produce cetuximab originator and its two biosimilars, the chromatographic profiles are different, as cetuximab originator is characterized by a higher abundance of glycans containing α-Gal species, whereas the glycans of Cetuxa® and Lupitux® are mostly sialylated (Figure 4B). The abundance of each species was first calculated with respect to the total area of all glycans and are expressed in terms of relative percentage; in addition, the N-glycan species were further elaborated by grouping them considering the functions related to their structural features. Thus, grouping data are expressed in terms of fucosylation, high mannose, galactosylation, and sialylation (Figure 4C).
Figure 4.
Assessment of N-glycosylation in cetuximab originator and its biosimilars: (A) Scheme of the glycan mapping approach. Glycans are detached from the molecule, labeled and analyzed by chromatography analysis. (B) Overlay of the glycan profiles of Erbitux®, Cetuxa®, and Lupitux®. (C) Grouping data relevant to fucosylation, high mannose, galactosylation, and sialylation of the analyzed samples. Cet, Cetuxa®; Erb, Erbitux® (cetuximab originator); EU, emission unit of fluorescence; G0, a glycan structure with zero terminal galactose residues; Gal, galactose; Lup, Lupitux®; NANA, N-acetylneuraminic acid; NGNA, N-glycolylneuraminic acid.
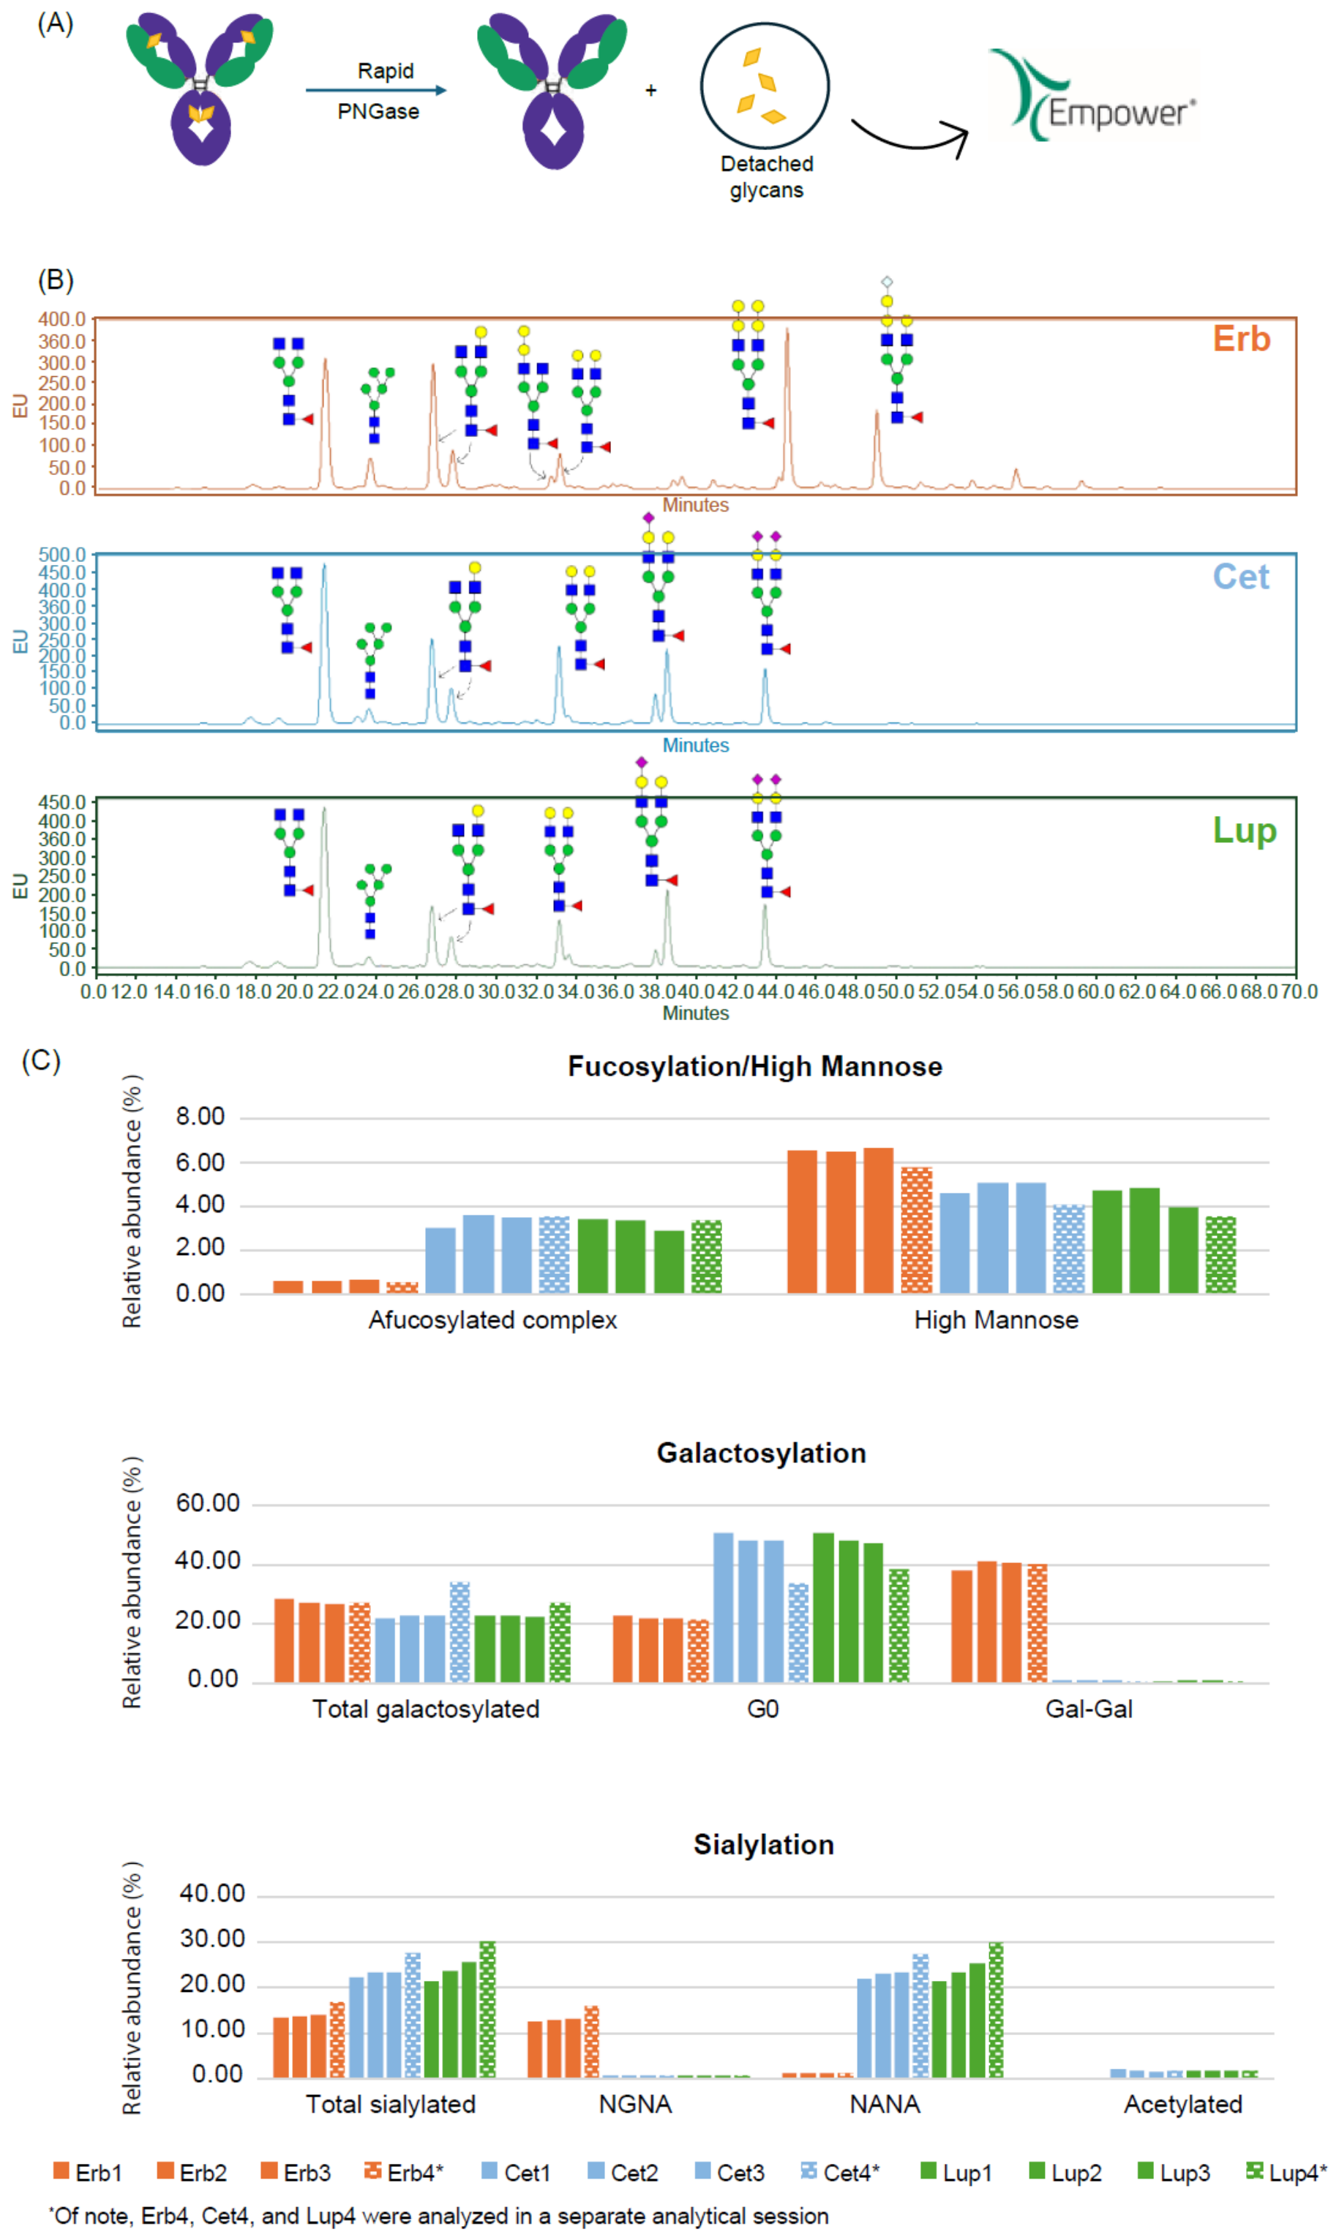
Several differences were observed between cetuximab originator and its biosimilars in terms of the detected N-glycan species and distribution. In particular, the overall levels of afucosylated, referring to the percentages of complex glycan species lacking the fucose moiety, were not comparable among samples. Indeed, cetuximab originator presented a lower level of afucosylated complex species (0.57%), compared with biosimilars (2.85–2.94%).
The distribution of galactosylated species was different between the biosimilars and cetuximab originator; as expected, cetuximab originator contained a high abundance of α-Gal species (40.06%). Moreover, the level of exposed Gal (total galactosylated) was lower in the biosimilars, whereas the levels of G0, complex species without exposed Gal, were higher. The overall sialylation level was higher in the biosimilar samples than in the cetuximab originator samples. These sialylated species mainly contain NANA with traces of NGNA in the Lupitux® and Cetuxa® samples, whereas the opposite trend was observed for the cetuximab originator samples. Nevertheless, a very low abundance of acetylated species was detected in the biosimilars, whereas they were completely absent in cetuximab originator.
Notably, significant differences were observed in the sialylation and galactosylation levels of the biosimilars; these two attributes are linked, as the decrease in sialylation levels can be related to changes in galactosylation profiles. Indeed, the levels detected in Cet4 and Lup4 were higher (27.64–30.26%) than those detected in the other biosimilar batches (22.99–23.51%); the opposite trend was observed for G0 species (N-acetylglucosamine), with their abundance being lower in Cet4 and Lup4 (33.73–38.68%) than in the other biosimilar batches (48.76–49.10%) (Supplementary Table S2).
3.4. Purity: Charge Variants
3.4.1. Charge Variant Profile
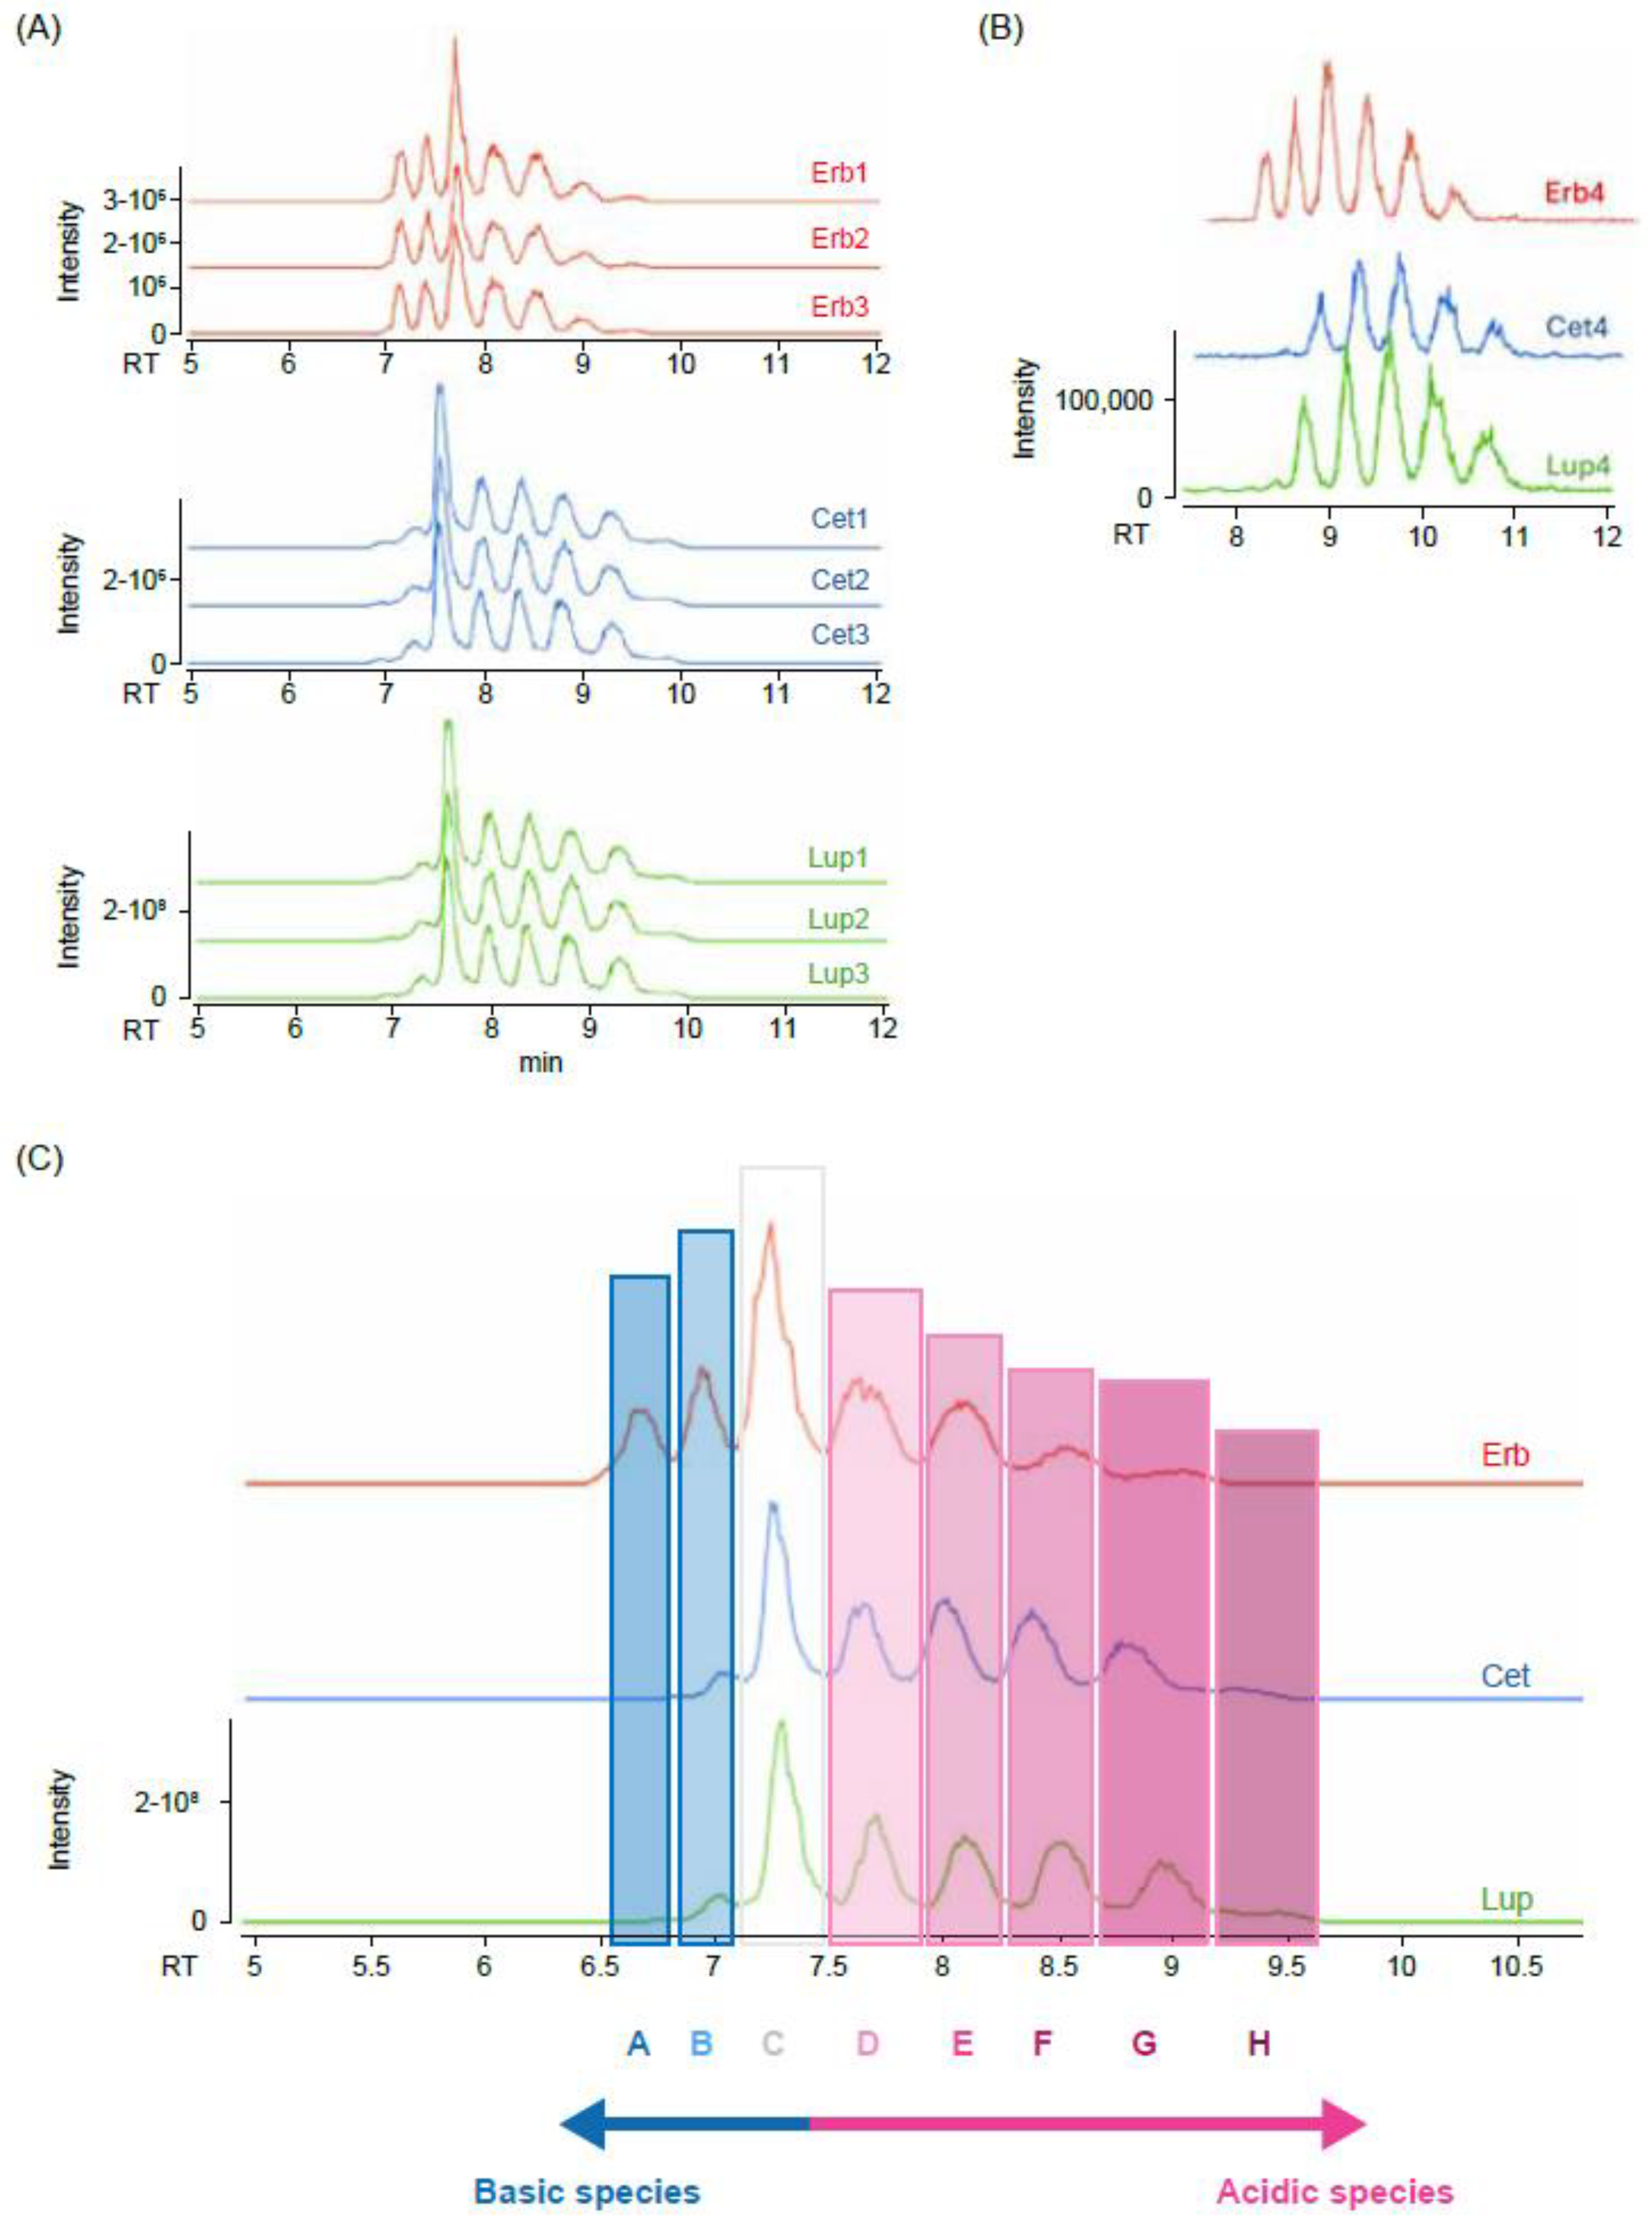
Charge variants are considered a critical quality attribute for biopharmaceuticals, as changes in charge can significantly impact not only drug safety, stability, and efficacy but also its tissue permeability and pharmacodynamic properties [15]. These variants are a common source of product heterogeneity and are affected by the contribution of several other attributes such as deamidation, C-terminal Lys clipping, fragmentation, and glycosylation. CE-MS was used for the characterization of the charge variant profile of a molecule because species are separated and eluted based on their different isoelectric points.
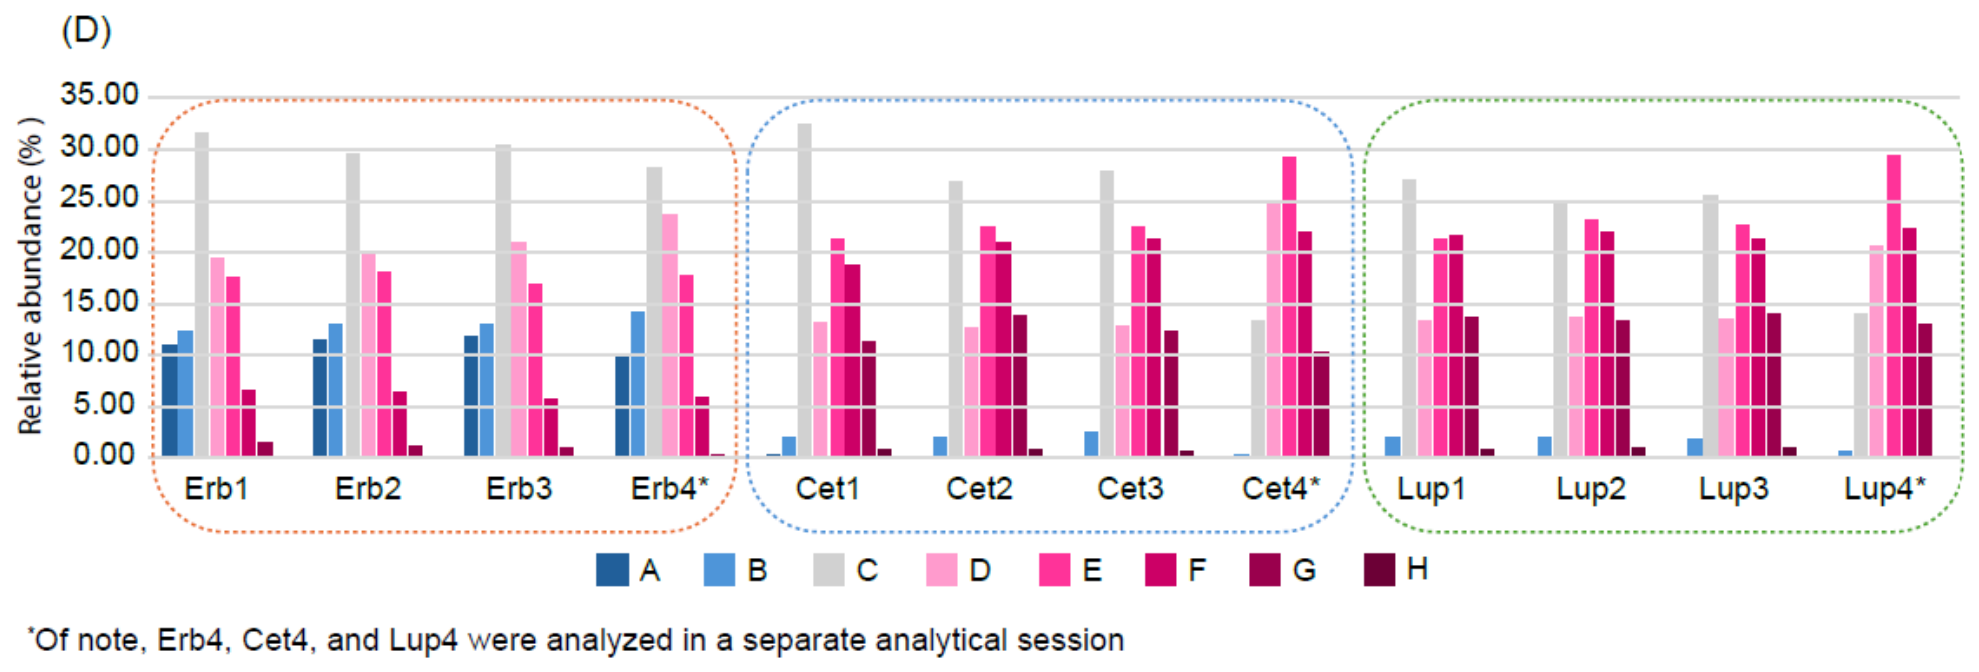
The electropherograms for cetuximab originator and its biosimilars were very different, suggesting a more acidic charge for the biosimilars (Figure 5A,B). Peaks sharing a similar migration time between cetuximab originator and its biosimilars could not be attributed to the same charge variants, although different species could show a similar isoelectric point. The detection of different species between cetuximab originator and its biosimilars was mainly due to their different glycosylation profiles (according to glycan mapping analysis) and different content of C-terminal Lys residues (according to HIC and peptide mapping analyses), where the difference in the basic peaks, highlighted in the electropherogram (Figure 5C), was caused by the varying degrees of nontruncated C-terminal Lys residues. Indeed, peak A was mainly related to the species with two Lys amino acids, whereas peak B corresponded to the species with one Lys. Peak C could be assigned to neutral species, whereas the acidic peaks were mainly related to increasing levels of exposed sialic acid, NGNA for cetuximab originator, and NANA for biosimilars. Indeed, peaks D, E, F, G, and H were mainly associated with the presence of glycans containing one, two, three, four, or five sialic acid residues, respectively (Supplementary Table S24).
As shown in panels C and D of Figure 5, cetuximab originator showed a prominently higher abundance of neutral and basic charge variant species than biosimilars. Notably, the biosimilars showed a higher content of acidic species than cetuximab originator, but with a different trend between Cet4 and Lup4 compared with the other biosimilar samples, in line with the trend observed using glycan mapping analysis. Indeed, for Cet4 and Lup4, the most intense peaks were peaks D (20.63–24.87%; other batches, 12.86–13.53%) and E (29.11–29.34%; other batches, 22.09–22.36%), whereas for the other biosimilar batches, the most intense peak was peak C (25.86–29.02%; Cet4 and Lup4, 13.38–14.00%).
Figure 5.
Assessment of charge variants in cetuximab originator and its biosimilars: (A) Overlay of the electropherogram profiles of Erbitux®, Cetuxa®, and Lupitux®. (B) Overlay of the electropherogram profiles of Erb4, Cet4, and Lup4, which were analyzed in a separate analytical session. (C) Characterization of electropherogram profiles according to the abundance of basic and acidic species. (D) Relative distribution of the detected peaks for each tested sample. Cet, Cetuxa®; Erb, Erbitux® (cetuximab originator); Lup, Lupitux®.
3.4.2. Binding Affinity FcγRIIIa and In Vitro Potency
Fcγ receptors (FcγRs) are a family of transmembrane proteins expressed on immune cells that recognize the Fc region of immunoglobulin G (IgG) antibodies. These receptors play a critical role in mediating antibody-dependent cell-mediated cytotoxicity (ADCC) and antibody-dependent cellular phagocytosis (ADCP), thereby serving as a key functional bridge between humoral and cellular immunity [16].
Among the FcγR family members, FcγRIIIa (CD16a) is the primary mediator of ADCC. Structurally, CD16a is a transmembrane receptor comprising two extracellular Ig-like domains and a short cytoplasmic tail that lacks intrinsic signaling capacity. To transduce activating signals, CD16a associates with the accessory chains CD3ζ and FcεRIγ, which bear immunoreceptor tyrosine-based activation motifs (ITAMs) [2]. CD16a is predominantly expressed on the surface of natural killer (NK) cells. Upon binding to the Fc region of IgG antibodies opsonizing target cells, CD16a triggers the formation of an immunological synapse, followed by the degranulation of lytic granules containing perforin and granzymes and the activation of cytotoxic signaling cascades, ultimately leading to target cell elimination [17].
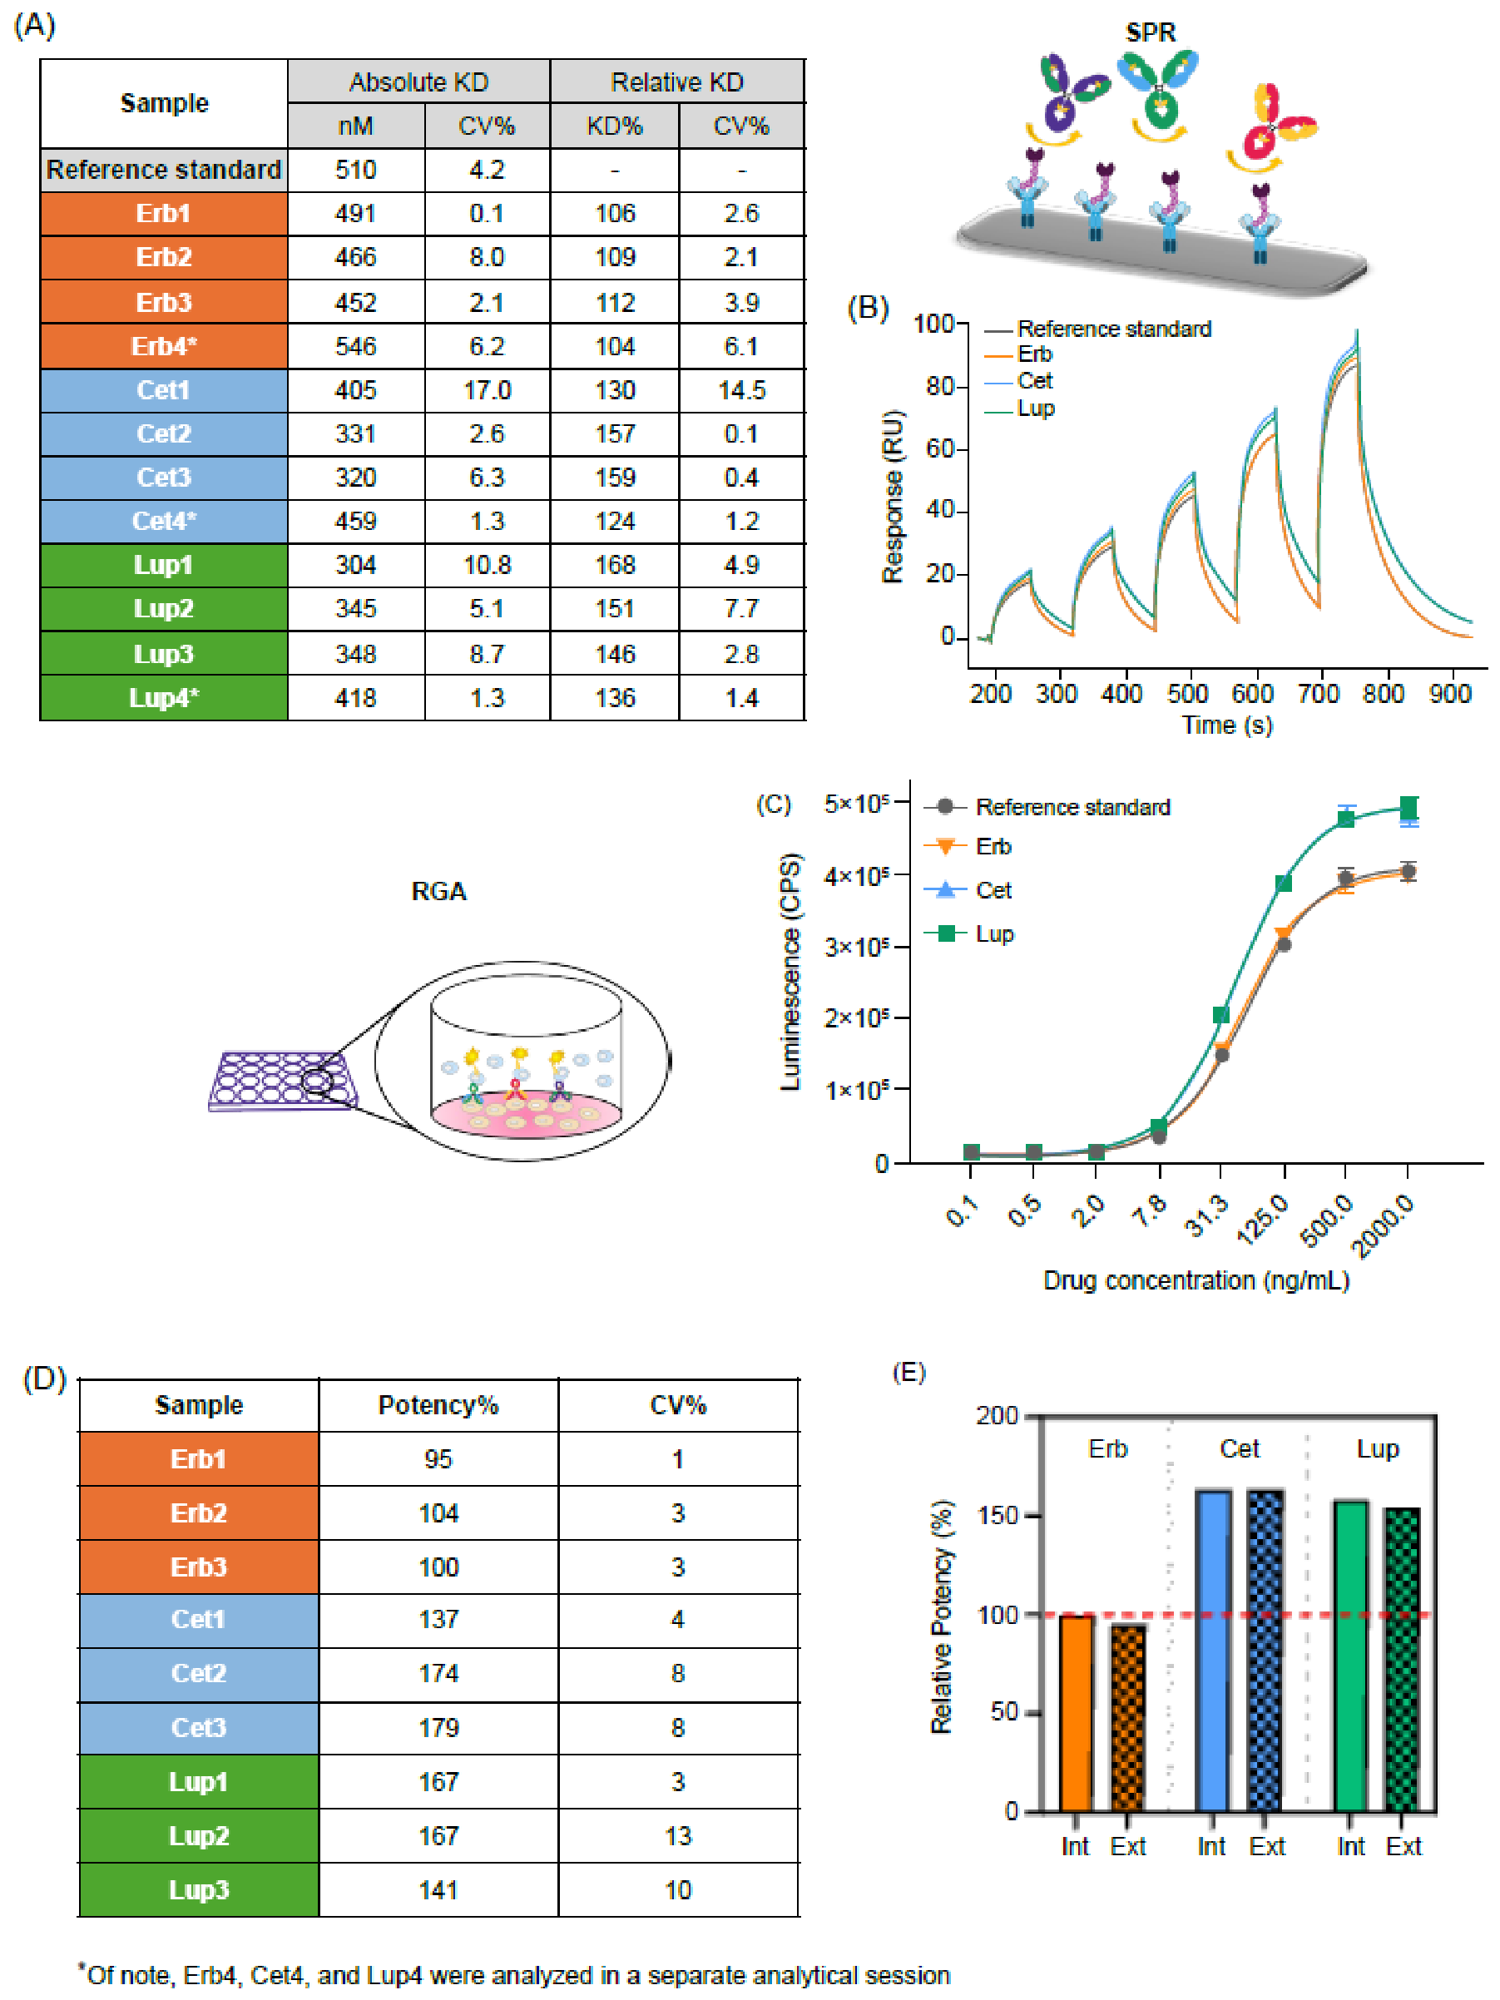
The KD between Erbitux® and FcγRIIIa was determined using SPR to quantify the binding affinity between these molecules. Comparative analysis presented in Figure 6A revealed significant differences in the binding affinity of FcγRIIIa between cetuximab originator and its biosimilars, with the latter exhibiting enhanced affinity compared with the reference product. This increased affinity was further corroborated by sensorgram data (Figure 6B), indicating that the enhanced binding strength primarily results from a slower dissociation phase, compared with the reference material and Erbitux® samples.
The ADCC activity of cetuximab originator was evaluated in a cellular model using RGA. This methodology quantified dose–response interactions between cetuximab and both EGFR expressed on the human epidermoid carcinoma cell line A431 and FcγRIIIa expressed on FcγRIIIa-positive reporter cells. This sandwich configuration ensures that the assessment of the binding activity of FcγRIIIa incorporates any potential conformational changes induced by the therapeutic binding to the primary target (EGFR).
As demonstrated in Figure 6C, the biosimilar samples exhibited a higher asymptotic maximum response (greater efficacy) than cetuximab originator. The F-test was performed to evaluate similarity with the reference standard indicating significant differences between samples. However, to quantify differences in potency, we employed the same approach used by the external laboratory for similarity evaluation. This methodology considers samples to be similar if they demonstrate a maximum response ratio relative to the standard of 80–120%. Application of this analytical strategy demonstrated that the potency values of the biosimilars were elevated compared with the cetuximab originator (Figure 6D) and that these values were consistently aligned between two independent laboratories (Figure 6E).
Figure 6.
Binding affinity to FcγRIIIa and in vitro potency: (A) Table summarizing KD and relative binding affinity (KDreference/KDsample) data obtained for cetuximab originator and its biosimilars using SPR; not comparable: biosimilar mean value < 77% or biosimilar mean value > 139%. (B) Representative SPR sensorgrams obtained for cetuximab originator and its biosimilars. (C) Dose–response curves obtained for ADCC measurement between cetuximab originator and its biosimilars. (D) Table summarizing relative potency data calculated as the ratio of reference sample EC50 value to individual sample EC50 values; not comparable: biosimilar mean value < 55% or biosimilar mean value > 145%. (E) Bar graph displaying mean data obtained for cetuximab originator and its biosimilars, comparing internally generated results (Int) with those obtained from an external laboratory. ADCC, antibody-dependent cell-mediated cytotoxicity; Cet, Cetuxa®; CPS, counts per second; CV%, percent coefficient of variation; EC50, half-maximal effective concentration; Erb, Erbitux® (cetuximab originator); Ext, external; Int, internal; KD, binding affinity; Lup, Lupitux®; RGA, reporter gene assay; RU, response unit; SPR, surface plasmon resonance.
To further investigate whether the enhanced FcγRIIIa engagement observed in the RGA translates into increased cytotoxic killing activity, a complementary cell-based cytotoxicity assay was performed. This assay evaluated ADCC-mediated killing using peripheral blood mononuclear cells (PBMCs) as effector cells and an engineered A549 cell line incorporating the HaloTag-HiBiT technology (Promega) as target cells. It should be noted that this method was not fully validated in terms of linearity range, precision, and accuracy; therefore, the results are intended to provide qualitative evidence only. As shown in Supplementary Figure S10, the biosimilar displayed a qualitatively slightly higher cytotoxic killing profile compared with the cetuximab originator, although the magnitude of this difference was less pronounced than the ADCC signal activation measured by the RGA. Raw data from independent experiments for binding affinity to EGFR, FcRn, C1q and FcγRI, are provided in Supplementary Methods and Supplementary Tables S14, S16, S17 and S18, respectively. Results for EGFR-mediated cell viability potency, antibody-dependent cellular phagocytosis (ADCP) potency and cell-based ADCC RGA (from external laboratory) are summarized in Supplementary Methods and Supplementary Tables S15, S19 and S25, respectively.
3.5. Process-Related Impurities
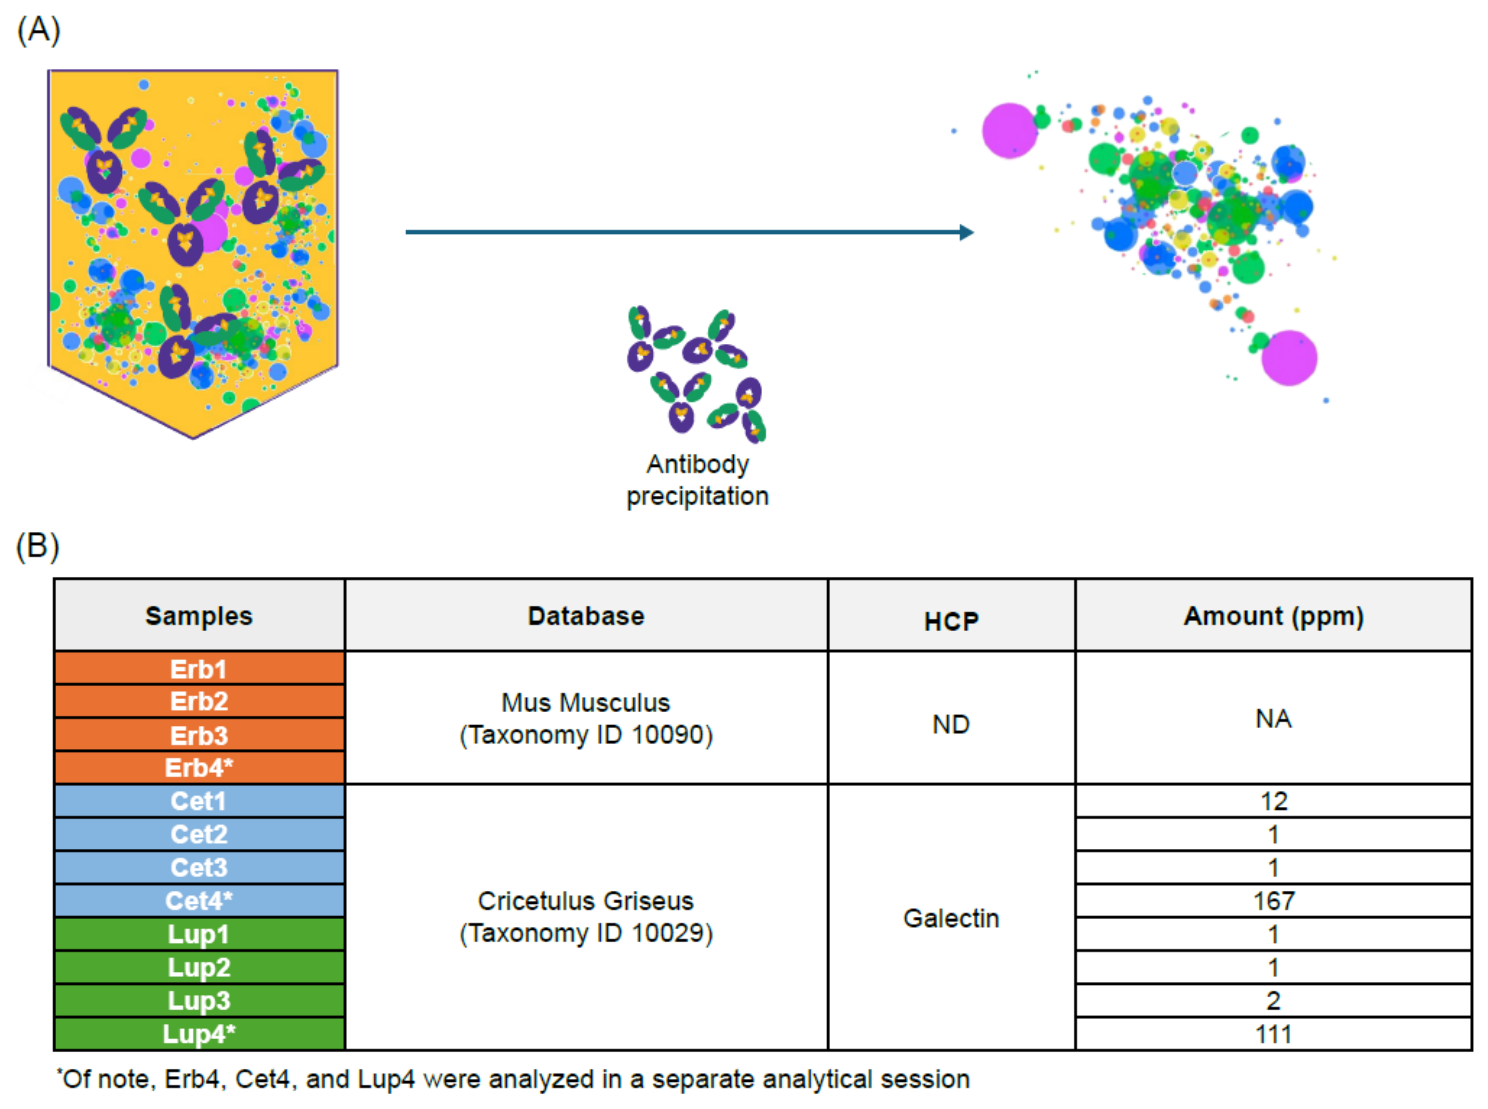
HCPs are proteins originating from the cells of the host organism that are used to produce biopharmaceutical drugs. They are considered impurities because they can remain in the final drug product, where they may negatively impact the safety and stability of the drug by causing immunogenicity or degrading the therapeutic protein [18]. HCP profiling was performed using LC-MS/MS analysis after precipitation of the antibody to characterize protein impurities using a proteomic approach, wherein the search was performed against the taxonomic file of the source cells (Figure 7A).
LC-MS/MS showed that the biosimilars exhibited a higher level of residual HCPs than cetuximab originator. Indeed, HCPs were not detected in the cetuximab originator samples, while galectin was consistently detected across all biosimilar samples. Interestingly, a relatively high variability of galectin content was observed, varying from 1 ppm to 167 ppm (Figure 7B).
Figure 7.
Assessment of HCPs in cetuximab originator and its biosimilars: (A) Proteomic approach using LC-MS/MS for the identification of HCPs. (B) The ppm amount of the HCPs detected in all tested samples. Cet, Cetuxa®; Erb, Erbitux® (cetuximab originator); HCP, host cell protein; LC-MS/MS, liquid chromatography–tandem mass spectrometry; Lup, Lupitux®; ND, not detected, no HCPs detected in the sample; NA, not available, no HCPs detected.
3.6. Overall Statistical Results
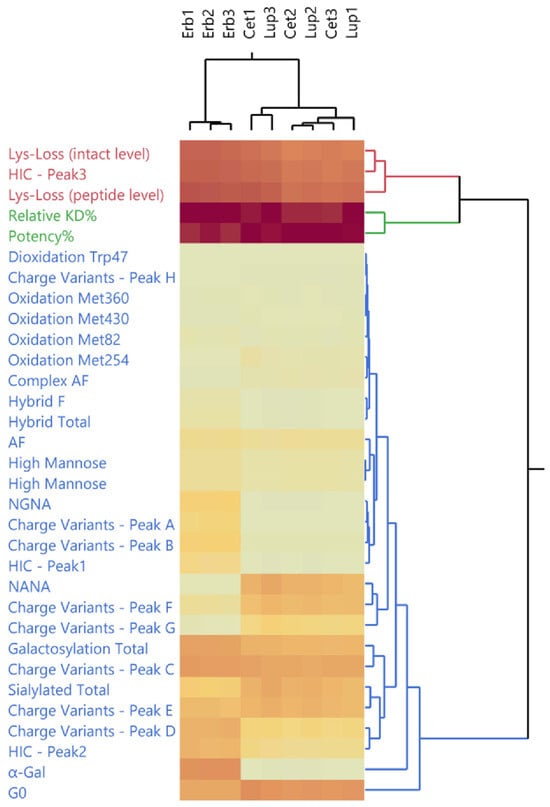
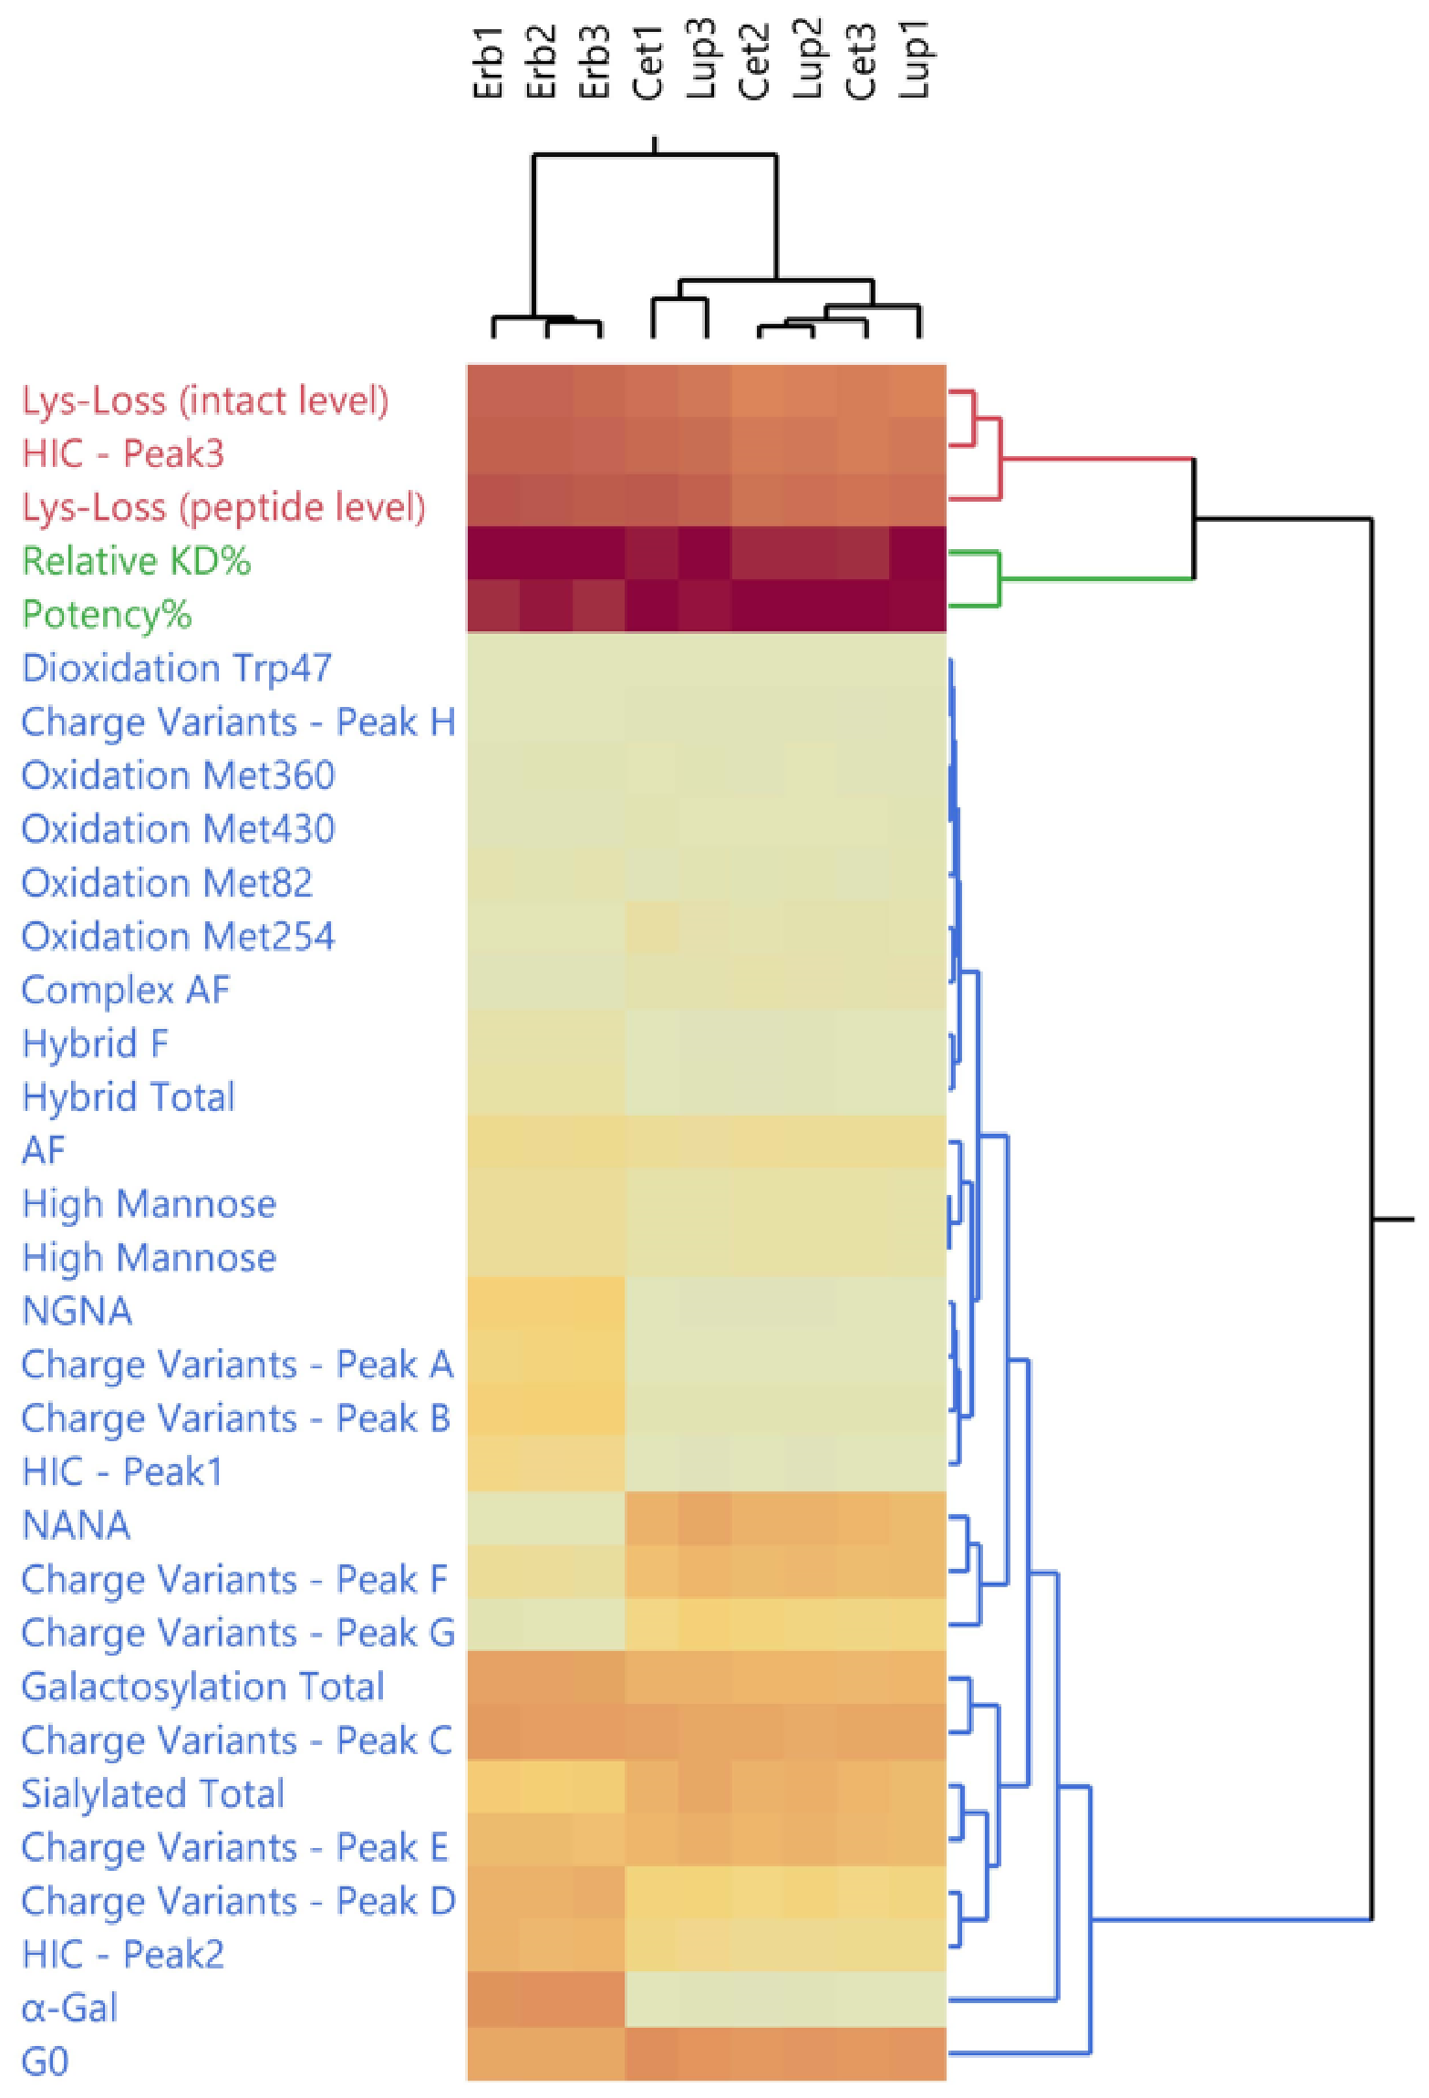
Double-hierarchical clustering with average method was performed on products and CQAs analyzed (Figure 8) with the purpose to identify CQAs that contribute more to the fingerprint of Erbitux® vs. Cetuxa® and Lupitux®.
Figure 8.
Double-hierarchical clustering results: Heatmap of double-hierarchical clustering of Erbitux®, Cetuxa®, and Lupitux® (columns) and all physicochemical and biological CQAs (rows). The colors of CQA text represent the assigned cluster, while the CQA values of products are shaded from yellow (low values) to red (high values). AF, afucosylated; Cet, Cetuxa®; Erb, Erbitux® (cetuximab originator); G0, aglycan structure with zero terminal galactose residues; Gal, galactose; HIC, hydrophobic interaction chromatography; KD, binding affinity; Lup, Lupitux®; Lys, lysine; NANA, N-acetylneuraminic acid; NGNA, N-glycolylneuraminic acid.
From the top columns of the heatmap in Figure 8, it can be seen how Erbitux® products are clustered together, while the Cetuxa® and Lupitux® products have formed a separate cluster. The heatmap clearly shows differences in CQAs across clusters such as G0, α-Gal, and NANA, with complex afucosylated profiling varying among the products, and it reveals a distinct Erbitux® fingerprint relative to its biosimilars.
4. Discussion
An in-depth characterization study comparison between cetuximab originator and its biosimilars Cetuxa® and Lupitux® demonstrated comparable results for molecular weight, sequence coverage, disulfide bridge pattern, fluorescence emission, thermal stability, majority of functional binding activity, and affinity to the main EGFR target and other effector function receptors. However, a significant difference was observed in a number of CQAs between the biosimilars and cetuximab originator.
Two sequence variants were detected in Cetuxa® and Lupitux®. The first was a Val→Met50 misincorporation on HC. Although no impact was detected on the EGFR-binding affinity it introduced an additional oxidizable residue on the CDR H2 motif of the molecule, with a potential challenge from a drug substance and drug product shelf life point of view. The second detected sequence variant was the Gly→Glu212 misincorporation on LC. The mutation introduced a net charge in the region reported to be critical for overall antibody conformation and potentially relevant to effector function activation [14]; however, at the observed level, no critical differences were detected.
The loss of the C-terminal Lys on HC was found to be higher in both biosimilars, resulting in an almost complete truncation of the molecule. Although C-terminal Lys truncation is not a critical CQA per se, considering its location being away from bioactive domains and the sites involved in Fc-related functions, it represents a major source of charge heterogeneity in mAbs and has a strong impact on basic variant levels. Indirectly, it can also affect acidic variant levels. In fact, both Cetuxa® and Lupitux® showed a prominent amount of acidic charge variants compared with cetuximab originator due to the almost complete truncation of the C-terminal on HC. This change in charge variant profiles was also largely determined by the higher abundance of sialylated species. The overall charge heterogeneity could potentially impact drug tissue permeability and pharmacodynamics [15].
Cetuximab has four Met residues, which might be subject to oxidation. All are located on HC, with the most critical (Met254) being in the Fc region involved in FcRn binding. According to structural analysis [19], Met254 is expected to have a high propensity for oxidation due to its solvent exposure and high structural flexibility. Higher oxidation level at the FcRn-binding site could impact PK due to reduced binding to FcRn [20,21,22,23]. In addition, several studies have revealed that Met oxidation possibly affects protein conformation stability and aggregation propensity [24,25,26]. As expected, the misincorporated Met50 showed a high propensity for oxidation, which increased under stress conditions (Supplementary Table S23). As reported in the Results section, the biosimilars showed a higher level of oxidized Met than the cetuximab originator. Oxidation is a stability indicating CQA and even if no impact was detected on FcRn binding affinity using SPR on samples tested, it was not possible to perform stability studies with biosimilars. The behavior of the product during stability and at the end of its shelf life in terms of kinetics of oxidation might be affected by this difference.
As widely documented in the literature, Fc glycostructures play an essential role in influencing effector functions such as ADCC, complement-dependent cytotoxicity, and ADCP by modulating the binding to FcγRs on immune cells [27]. However, no differences in FcγRI binding or ADCP activity were observed among the samples. In addition, studies on Fab glycans have identified several important roles of these glycans in IgG stability, binding characteristics and bioactivity. Specifically, the absence of terminal sialic acid exposing terminal galactose residues can result in a decrease in mAb half-life [28]. Moreover, it was hypothesized that a minor glycoforms complexity at the Fab region of the mAb determines an increase in binding affinity to FcRn [19]. The extensive characterization of the N-glycosylation patterns has shown that Cetuxa® and Lupitux® have a higher abundance of afucosylated Fc-complex species than cetuximab originator, while being compensated by a slightly higher abundance of high-mannose species in the Fc portion in cetuximab originator. Several studies have demonstrated that the absence of core fucose residues in Fc glycans dramatically improves antibody binding to FcγRIIIa and ADCC activation [29,30,31,32]. This correlates with increased FcγRIIIa-binding affinity and ADCC activation in the Cetuxa® and Lupitux® found in the present characterization results.
Differences in galactosylation and sialylation levels were also detected. The percentage of the total galactosylated species was lower in the biosimilars than in cetuximab originator, with a different distribution in the Fab and Fc portions. In contrast, cetuximab originator had a higher abundance of α-Gal species than the biosimilars, which showed a higher abundance of G0 species with no exposed Gal due to the different recombinant systems used for production. α-Gal species and terminal Gal were mostly present in Fab glycosylation, and it may impact the PK (antibody half-life in circulation) due to interactions with the asialoglycoprotein receptor. Regarding total galactosylation level, no impact was detected on C1q-binding activity.
However, the sialylation observed in the Fab portion was higher in both the biosimilars and was exclusively characterized by NANA. The different sialylation levels affected the distribution of charge variants (more acidic variants in the biosimilars), and the different glycosylation distributions contributed to the identification of the different profiles of hydrophobic species, as determined using HIC, with biosimilars having an overall higher hydrophobicity than the cetuximab originator.
From a pure process perspective, the absence of detected HCPs in the cetuximab originator compared with the presence of high variable levels of galectin in the biosimilars is notable.
5. Conclusions
For the first time, a comprehensive physicochemical and functional similarity study was carried out for an exhaustive comparison between cetuximab originator and its biosimilars Cetuxa® and Lupitux® recently approved by the DCGI authority [2]. More interestingly, the cetuximab originator and its biosimilars are expressed in two different cell lines. Results have shown a good similarity for most physicochemical attributes but also significant differences. The greatest differences were observed for some well-known CQAs of mAbs and biotherapeutics such as galactosylation and in general in the N-glycosylation profile, charge variants profile, FcγRIIIA binding affinity and ADCC activation and ultimately the presence of misincorporations. Based on the evaluation presented, these differences likely depend on two main factors: firstly, the manufacturing process (i.e., upstream and downstream conditions) that clearly might affect the characteristics of the molecule, and secondly the use of a different cell line (Sp20 vs. CHO).
Supplementary Materials
The following supporting information can be downloaded at: https://www.mdpi.com/article/10.3390/jpbi3030021/s1, Figure S1: Primary structure of cetuximab molecule; Figure S2: Deconvoluted spectra from intact molecule analysis (in deglycosylated and reducing conditions); Figure S3: Data from peptide mapping analysis by LC-MS/MS about misincorporation species; Figure S4: Extracted ion chromatograms of oxidized species by peptide mapping analysis by LC-MS/MS; Figure S5: Circular dichroism—Analytical session one; Figure S6: Circular dichroism—Analytical session two; Figure S7: Deconvoluted MS spectra from charge variants analysis (cetuximab originator); Figure S8: Deconvoluted MS spectra from charge variants analysis (cetuximab biosimilars); Figure S9: HIC profiles of cetuximab originator and its biosimilar; Figure S10: ADCC cytotoxicity assay; Table S1: Results obtained by reducing peptide mapping analysis; Table S2: Results from glycan mapping—Complete list of glycan groups; Table S3: Results from optical density; Table S4: Sequence coverage (%) obtained by peptide mapping analysis; Table S5: Results from non-reduced peptide mapping using LC-MS/MS; Table S6: Results from Ellman’s assay; Table S7: Results from FT-IR; Table S8: Results from intrinsic fluorescence spectroscopy; Table S9: Thermal transitions of the analyzed samples; Table S10: Results from DMB-UPLC; Table S11: Results from glycopeptide mapping using LC-MS/MS (Fc-Asn 299); Table S12: Results from glycopeptide mapping using LC-MS/MS (Fab-Asn 88); Table S13: Results from AUC; Table S14: Binding affinity (KD) and relative binding affinity to EGFR (KDreference/KDsample) data; Table S15: EGFR-mediated cell viability potency; Table S16: Binding affinity (KD) and relative binding affinity to FcRn (KDreference/KDsample) data; Table S17: Binding activity to C1q; Table S18: KD and relative binding affinity to FcγRI (KDreference/KDsample) data; Table S19: FcγRI-mediated ADCP potency; Table S20: Results from intact molecule analysis by LC-MS; Table S21: Peptide mapping analysis from external laboratory; Table S22: HIC analysis from external laboratory; Table S23: Oxidation level obtained after oxidative stress; Table S24: Results from charge variants analysis; Table S25: ADCC measurements obtained from the external laboratory.
Author Contributions
Conceptualization, A.C., F.D., and L.G.; methodology, formal analysis and investigation, A.C., F.D., L.B., M.F., S.P., E.B., D.B., L.C., S.S., F.C., C.F., and L.G. All authors participated in the conceptualization, data curation, formal analysis, data collection and investigation, evaluation and discussion of the results and contributed text and figures to the manuscript. All authors have read and agreed to the published version of the manuscript.
Funding
This study was sponsored/financially supported by Merck (ROR ID: https://ror.org/04vpzfb52; accessed on 21 August 2026).
Institutional Review Board Statement
Not applicable.
Informed Consent Statement
Not applicable.
Data Availability Statement
Any requests for data by qualified scientific and medical researchers for legitimate research purposes will be subject to Merck’s (ROR ID: https://ror.org/04vpzfb52; accessed on 21 August 2026) Data Sharing Policy. All requests should be submitted in writing to Merck’s data sharing portal (https://www.merckgroup.com/en/research/our-approach-to-research-and-development/healthcare/clinical-trials/commitment-responsible-data-sharing.html; accessed on 21 August 2026). When Merck has a co-research, co-development, or co-marketing or co-promotion agreement, or when the product has been outlicensed, the responsibility for disclosure might be dependent on the agreement between parties. Under these circumstances, Merck will endeavor to gain agreement to share data in response to requests.
Acknowledgments
The authors thank the investigators, coinvestigators, and study teams at each of the participating centers of Merck. The authors gratefully acknowledge the technical support and expertise provided by RIC BV, President Kennedypark 6, 8500 Kortrijk, Belgium, in replicating some testing as an external and independent laboratory to validate the results obtained. Medical writing support was provided by Satrupa Das, and Gurpreet Kaur Virya of Merck Specialities Pvt. Ltd., Bangalore, India, an affiliate of Merck KGaA, and was funded by Merck.
Conflicts of Interest
Angela Capolupo, Fabio D’Amici, Luisa Buscajoni, Mattia Forchetta, Sofia Petrocchi, Erika Birolo, Daniela Bonetti, Lucia Colarusso, Simona Saporiti, Fabio Centola, Caterina Fusilli, and Luigi Giunta report employment with Merck Serono S.p.A, Rome, Italy, an affiliate of Merck KGaA.
Abbreviations
The following abbreviations are used in this manuscript:
| α-Gal | Galactose-alpha-1,3-galactose |
| ACN | Acetonitrile |
| ADCC | Antibody-dependent cell-mediated cytotoxicity |
| ADCP | Antibody-dependent cellular phagocytosis |
| AF | Afucosylated |
| AUC | Analytical ultracentrifugation |
| BEH | Ethylene bridged hybrid |
| C1q | Complement component 1q |
| CDR | Complementarity-determining region |
| Cet | Cetuxa® |
| CE-MS | Capillary electrophoresis coupled with mass spectrometry |
| CHO | Chinese hamster ovary |
| CQAs | Critical quality attributes |
| CV | Coefficient of variation |
| DCGI | Drugs Controller General of India |
| DMB | 1,2-diamino-4,5-methylenedioxybenzene dihydrochloride |
| DSC | Differential scanning calorimetry |
| DTT | Dithiothreitol |
| EGFR | Epidermal growth factor receptor |
| ELISA | Enzyme-linked immunosorbent assay |
| Erb | Erbitux® |
| FA | Formic acid |
| Fab | Fragment antigen-binding |
| Fc | Fragment crystallizable |
| FcRn | Neonatal Fc receptor |
| FT-IR | Fourier-transform infrared |
| Gal | Galactose |
| Gly | Glycine |
| Glu | Glutamic acid |
| HBS | HEPES-buffered saline |
| HC | Heavy chain |
| HCl | Hydrochloric acid |
| HCP | Host cell protein |
| HIC | Hydrophobic interaction chromatography |
| HMW | High-molecular weight |
| HPLC | High-performance liquid chromatography |
| ICH | International Council for Harmonisation |
| IgG | Immunoglobulin G |
| KD | Affinity constant |
| LC-MS | Liquid chromatography coupled with mass spectrometry |
| LC-MS/MS | Liquid chromatography–tandem mass spectrometry |
| LO | Light obscuration |
| Lup | Lupitux® |
| Lys-C | C-terminal lysine |
| mAb | Monoclonal antibody |
| mCRC | Metastatic colorectal cancer |
| MET | Methionine |
| MoA | Mode of action |
| NaCl | Sodium chloride |
| NANA | N-acetylneuraminic acid |
| NFAT | Nuclear factor of activated T-cells luciferase |
| NGNA | N-glycolylneuraminic acid |
| NK | Natural killer |
| OD | Optical density |
| PNGase | Peptide-N-glycosidase |
| PTMs | Post-translational modifications |
| RGA | Reporter gene assay |
| RT | Room temperature |
| RU | Response units |
| SCCHN | Squamous cell carcinoma of the head and neck |
| SD | Standard deviation |
| SP2/0 | Mouse myeloma cells |
| SPR | Surface plasmon resonance |
| UPLC | Ultra-performance liquid chromatography |
| USP | United States Pharmacopeia |
| UV | Ultraviolet |
| VAL | Valine |
References
- Dhamne, N.; Jain, M.; Nagarkar, R.; Das Majumdar, S.K.K.; Deshmukh, C.D.; Dana, R.; Ganesan, P.; Chatterjee, K.; Chatterjee, S.; Prabhash, K.; et al. 353O Efficacy and safety of ENZ-124 versus innovator cetuximab in combination with platinum-based chemotherapy in patients with recurrent locoregional or metastatic squamous cell carcinoma of the head and neck (SCCHN). Ann. Oncol. 2023, 34, S1607. [Google Scholar] [CrossRef] [Scilit]
- Press Release Alkem Laboratories Launches Cetuxa. Available online: https://www.alkemlabs.com/pdf/press-release/2023/Press%20release_Cetuxa.pdf (accessed on 14 August 2026).
- Galizia, G.; Lieto, E.; De Vita, F.; Orditura, M.; Castellano, P.; Troiani, T.; Imperatore, V.; Ciardiello, F. Cetuximab, a chimeric human mouse anti-epidermal growth factor receptor monoclonal antibody, in the treatment of human colorectal cancer. Oncogene 2007, 26, 3654–3660. [Google Scholar] [CrossRef] [Scilit] [PubMed]
- Schoppy, D.W.; Sunwoo, J.B. Immunotherapy for head and neck squamous cell carcinoma. Hematol./Oncol. Clin. N. Am. 2015, 29, 1033–1043. [Google Scholar] [CrossRef] [Scilit] [PubMed]
- Erbitux FDA PI, April 2021. Available online: https://www.accessdata.fda.gov/drugsatfda_docs/label/2021/125084s277s280lbl.pdf (accessed on 14 August 2026).
- Erbitux EMA SmPC, June 2024. Available online: https://www.ema.europa.eu/en/documents/overview/erbitux-epar-summary-public_en.pdf (accessed on 14 August 2026).
- Nupur, N.; Joshi, S.; Gulliarme, D.; Rathore, A.S. Analytical similarity assessment of biosimilars: Global regulatory landscape, recent studies and major advancements in orthogonal platforms. Front. Bioeng. Biotechnol. 2022, 10, 832059. [Google Scholar] [CrossRef] [Scilit] [PubMed]
- Mascarenhas-Melo, F.; Diaz, M.; Gonçalves, M.B.S.; Vieira, P.; Bell, V.; Viana, S.; Nunes, S.; Paiva-Santos, A.C.; Veiga, F. An overview of biosimilars—Development, quality, regulatory issues, and management in healthcare. Pharmaceuticals 2024, 17, 235. [Google Scholar] [CrossRef] [Scilit] [PubMed]
- Rathore, A.S. Guidelines on similar biologics: Regulatory requirements for marketing authorization in India. PDA J. Pharm. Sci. Technol. 2012, 66, 393. [Google Scholar] [CrossRef] [Scilit] [PubMed]
- Douez, E.; D’Atri, V.; Guillarme, D.; Antier, D.; Guerriaud, M.; Beck, A.; Watier, H.; Foucault-Fruchard, L. Why is there no biosimilar of Erbitux®? J. Pharm. Biomed. Anal. 2023, 234, 115544. [Google Scholar] [CrossRef] [Scilit] [PubMed]
- Li, F.; Vijayasankaran, N.; Shen, A.; Kiss, R.; Amanullah, A. Cell culture processes in monoclonal antibody production. mAbs 2010, 2, 466–479. [Google Scholar] [CrossRef] [Scilit]
- Oliva, A.; Llabrés, M. New quality-range-setting method based on between- and within-batch variability for biosimilarity assessment. Pharmaceuticals 2021, 14, 527. [Google Scholar] [CrossRef] [Scilit] [PubMed]
- Hu, Z.; Zhang, H.; Haley, B.; Macchi, F.; Yang, F.; Misaghi, S.; Elich, J.; Yang, R.; Tang, Y.; Joly, J.C.; et al. Carboxypeptidase D is the only enzyme responsible for antibody C-terminal lysine cleavage in chinese hamster ovary (CHO) cells. Biotechnol. Bioeng. 2016, 113, 2100–2106. [Google Scholar] [CrossRef] [Scilit] [PubMed]
- Saporiti, S.; Laurenzi, T.; Guerrini, U.; Coppa, C.; Palinsky, W.; Benigno, G.; Palazzolo, L.; Ben Mariem, O.; Montavoci, L.; Rossi, M.; et al. Effect of Fc core fucosylation and light chain isotype on IgG1 flexibility. Commun. Biol. 2023, 6, 237. [Google Scholar] [CrossRef] [Scilit] [PubMed]
- Boswell, C.A.; Tesar, D.B.; Mukhyala, K.; Theil, F.-P.; Fielder, P.J.; Khawli, L.A. Effects of charge on antibody tissue distribution and pharmacokinetics. Bioconjug. Chem. 2010, 21, 2153–2163. [Google Scholar] [CrossRef] [Scilit] [PubMed]
- Nimmerjahn, F.; Ravetch, J.V. Fcγ receptors as regulators of immune responses. Nat. Rev. Immunol. 2008, 8, 34–47. [Google Scholar] [CrossRef] [Scilit] [PubMed]
- Coënon, L.; Villalba, M. From CD16a biology to antibody-dependent cell-mediated cytotoxicity improvement. Front. Immunol. 2022, 13, 913215. [Google Scholar] [CrossRef] [Scilit] [PubMed]
- Tuameh, A.; Harding, S.E.; Darton, N.J. Methods for addressing host cell protein impurities in biopharmaceutical product development. Biotechnol. J. 2023, 18, 2200115. [Google Scholar] [CrossRef] [Scilit] [PubMed]
- Saporiti, S.; Bianchi, D.; Ben Mariem, O.; Rossi, M.; Guerrini, U.; Eberini, I.; Centola, F. In silico evaluation of the role of Fab glycosylation in cetuximab antibody dynamics. Front. Immunol. 2024, 15, 1429600. [Google Scholar] [CrossRef] [Scilit] [PubMed]
- Haberger, M.; Heidenreich, A.K.; Schlothauer, T.; Hook, M.; Gassner, J.; Bomans, K.; Yegres, M.; Zwick, A.; Zimmermann, B.; Wegele, H.; et al. Functional assessment of antibody oxidation by native mass spectrometry. mAbs 2015, 7, 891–900. [Google Scholar] [CrossRef] [Scilit] [PubMed]
- Schlothauer, T.; Rueger, P.; Stracke, J.O.; Hertenberger, H.; Fingas, F.; Kling, L.; Emrich, T.; Drabner, G.; Seeber, S.; Auer, J.; et al. Analytical FcRn affinity chromatography for functional characterization of monoclonal antibodies. mAbs 2013, 5, 576–586. [Google Scholar] [CrossRef] [Scilit] [PubMed]
- Stracke, J.; Emrich, T.; Rueger, P.; Schlothauer, T.; Kling, L.; Knaupp, A.; Hertenberger, H.; Wolfert, A.; Spick, C.; Lau, W.; et al. A novel approach to investigate the effect of methionine oxidation on pharmacokinetic properties of therapeutic antibodies. mAbs 2014, 6, 1229–1242. [Google Scholar] [CrossRef] [Scilit] [PubMed]
- Wang, W.; Vlasak, J.; Li, Y.; Pristatsky, P.; Fang, Y.; Pittman, T.; Roman, J.; Wang, Y.; Prueksaritanont, T.; Ionescu, R. Impact of methionine oxidation in human IgG1 Fc on serum half-life of monoclonal antibodies. Mol. Immunol. 2011, 48, 860–866. [Google Scholar] [CrossRef] [Scilit] [PubMed]
- Walker, E.J.; Bettinger, J.Q.; Welle, K.A.; Hryhorenko, J.R.; Ghaemmaghami, S. Global analysis of methionine oxidation provides a census of folding stabilities for the human proteome. Proc. Natl. Acad. Sci. USA 2019, 116, 6081–6090. [Google Scholar] [CrossRef] [Scilit] [PubMed]
- Hu, D.; Qin, Z.; Xue, B.; Fink, A.L.; Uversky, V.N. Effect of methionine oxidation on the structural properties, conformational stability, and aggregation of immunoglobulin light chain LEN. Biochemistry 2008, 47, 8665–8677. [Google Scholar] [CrossRef] [Scilit] [PubMed]
- Rodriguez Camargo, D.C.; Tripsianes, K.; Buday, K.; Franko, A.; Göbl, C.; Hartlmüller, C.; Sarkar, R.; Aichler, M.; Mettenleiter, G.; Schulz, M.; et al. The redox environment triggers conformational changes and aggregation of hIAPP in type II diabetes. Sci. Rep. 2017, 7, 44041. [Google Scholar] [CrossRef] [Scilit] [PubMed]
- Boune, S.; Hu, P.; Epstein, A.L.; Khawli, L.A. Principles of N-Linked glycosylation variations of IgG-based therapeutics: Pharmacokinetic and functional considerations. Antibodies 2020, 9, 22. [Google Scholar] [CrossRef] [Scilit] [PubMed]
- Van de Bovenkamp, F.S.; Hafkenscheid, L.; Rispens, T.; Rombouts, Y. The emerging importance of IgG fab glycosylation in immunity. J. Immunol. 2016, 196, 1435–1441. [Google Scholar] [CrossRef] [Scilit] [PubMed]
- Kanda, Y.; Yamada, T.; Mori, K.; Okazaki, A.; Inoue, M.; Kitajima-Miyama, K.; Kuni-Kamochi, R.; Nakano, R.; Yano, K.; Kakita, S.; et al. Comparison of biological activity among nonfucosylated therapeutic IgG1 antibodies with three different N-linked Fc oligosaccharides: The high-mannose, hybrid, and complex types. Glycobiology 2007, 17, 104–118. [Google Scholar] [CrossRef] [Scilit] [PubMed]
- Okazaki, A.; Shoji-Hosaka, E.; Nakamura, K.; Wakitani, M.; Uchida, K.; Kakita, S.; Tsumoto, K.; Kumagai, I.; Shitara, K. Fucose depletion from human IgG1 oligosaccharide enhances binding enthalpy and association rate between IgG1 and FcγRIIIa. J. Mol. Biol. 2004, 336, 1239–1249. [Google Scholar] [CrossRef] [Scilit] [PubMed]
- Shinkawa, T.; Nakamura, K.; Yamane, N.; Shoji-Hosaka, E.; Kanda, Y.; Sakurada, M.; Uchida, K.; Anazawa, H.; Satoh, M.; Yamasaki, M.; et al. The absence of fucose but not the presence of galactose or bisecting N-acetylglucosamine of human IgG1 complex-type oligosaccharides shows the critical role of enhancing antibody-dependent cellular cytotoxicity. J. Biol. Chem. 2003, 278, 3466–3473. [Google Scholar] [CrossRef] [Scilit] [PubMed]
- Yamane-Ohnuki, N.; Kinoshita, S.; Inoue-Urakubo, M.; Kusunoki, M.; Iida, S.; Wakitani, M.; Niwa, R.; Sakurada, M.; Uchida, K.; Shitara, K.; et al. Establishment of FUT8 knockout chinese hamster ovary cells: An ideal host cell line for producing completely defucosylated antibodies with enhanced antibody-dependent cellular cytotoxicity. Biotechnol. Bioeng. 2004, 87, 614–622. [Google Scholar] [CrossRef] [Scilit] [PubMed]

Disclaimer/Publisher’s Note: The statements, opinions and data contained in all publications are solely those of the individual author(s) and contributor(s) and not of MDPI and/or the editor(s). MDPI and/or the editor(s) disclaim responsibility for any injury to people or property resulting from any ideas, methods, instructions or products referred to in the content. |
© 2026 by the authors. Licensee MDPI, Basel, Switzerland. This article is an open access article distributed under the terms and conditions of the Creative Commons Attribution (CC BY) license.