


Abstract
Food texture perception is an important determinant of food palatability and product quality. This study explored the applicability of DirectLiNGAM to directional relationships between instrumental texture features and the sensory perceptions of sakusaku and karikari. Baked cookie formulations and commercially available snacks were measured using a magnetic texture sensor, and seven force-derived features were paired with sensory ratings at the sample-group level. Edge stability was evaluated using 1000 bootstrap resamples. In the controlled cookie dataset, hardness and brittleness showed stable candidate direct effects on both sensory descriptors, with opposite signs for sakusaku and karikari. The commercial-product dataset produced more heterogeneous structures, reflecting differences in composition, geometry, and fracture behavior. Because the analysis used different samples for sensory and instrumental measurements and included parameters derived from the second compression, the identified directions should be interpreted as exploratory causal hypotheses rather than universal physical causality. The proposed framework may complement correlation and regression analyses by generating testable hypotheses about instrumental determinants of perceived food texture.
1. Introduction
Food texture is a major determinant of palatability, product quality, and consumer acceptance [1,2,3]. Among solid foods, crispy and crunchy textures are especially important in baked products and snack foods because they are closely associated with freshness, fracture behavior, and eating pleasure [4,5]. The loss or alteration of these textures can reduce product acceptability; therefore, objective methods that relate instrumental measurements to sensory perception are important for food design and quality control [6,7].
Instrumental texture evaluation, including Texture Profile Analysis (TPA), has been widely used to quantify mechanical characteristics of foods [3,8]. Previous studies on dry crispy foods have combined mechanical measurements with sensory evaluation and have reported associations between perceived crispness and parameters related to force magnitude, fracture events, and acoustic emissions [9,10,11,12]. The present study examined seven TPA descriptors. Rather than selecting variables beforehand, all standard TPA descriptors were retained to allow DirectLiNGAM to identify potentially important relationships among the measured variables.
Most previous instrumental–sensory studies have relied on correlation, analysis of variance, or regression to identify associations between measured features and perceived texture [10,12,13]. Although these approaches are useful for prediction and association, they do not determine the direction of statistical dependency among variables. Consequently, it remains uncertain which measured features are directly linked to sensory perception and which relationships arise indirectly through other physical features. An analytical framework that estimates directional dependency may therefore complement correlation- and regression-based analyses.
Recent developments in causal discovery enable potential causal structures to be inferred from observational data [14]. The Linear Non-Gaussian Acyclic Model (LiNGAM) estimates a directed acyclic graph under assumptions of linearity, acyclicity, and non-Gaussian independent disturbances [15,16]. Applications have been reported in chemical engineering [17], energy forecasting [18], healthcare [19], and environmental science [20]. However, its applicability to instrumental and sensory food-texture data has not been sufficiently investigated.
The purpose of this study was to examine whether causal discovery can clarify directional statistical relationships between physical features and the sensory perceptions of sakusaku and karikari. Baked cookie samples with controlled formulations and commercially available snacks with diverse structures were measured using a magnetic texture sensor and evaluated by sensory panels. DirectLiNGAM with prior knowledge was applied, and the stability of the identified links was evaluated using 1000 bootstrap resamples. In addition, association analyses and tests of the LiNGAM distributional assumption were planned to assess the robustness and interpretation of the estimated structures.
2. Methods
2.1. Causal Discovery Framework
Causal discovery estimates structural equations from data. A representative causal exploration method is the Linear Non-Gaussian Acyclic Model (LiNGAM). The generalized structural equation of LiNGAM is given by the following (1).
where represents feature values and texture, represents the causal effect from to , and p is the total number of variables. Through causal discovery, we estimate the presence and strength of causal structures between feature values and texture. This model assumes linearity in the form of the function generating the data and a non-Gaussian distribution for the exogenous variables, and does not permit closed-loop cyclic causal graphs [15]. In this study, causal relationships are estimated using the DirectLiNGAM algorithm [16]. To constrain implausible causal directions, prior knowledge matrices are incorporated [21]. Furthermore, to assess the robustness of the estimated causal links, bootstrap resampling was conducted [22].
2.2. Measurement
2.2.1. Measurement System
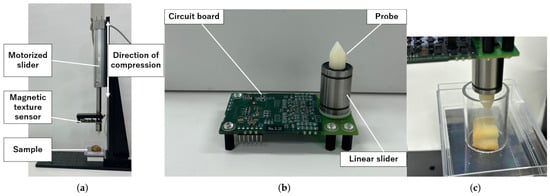
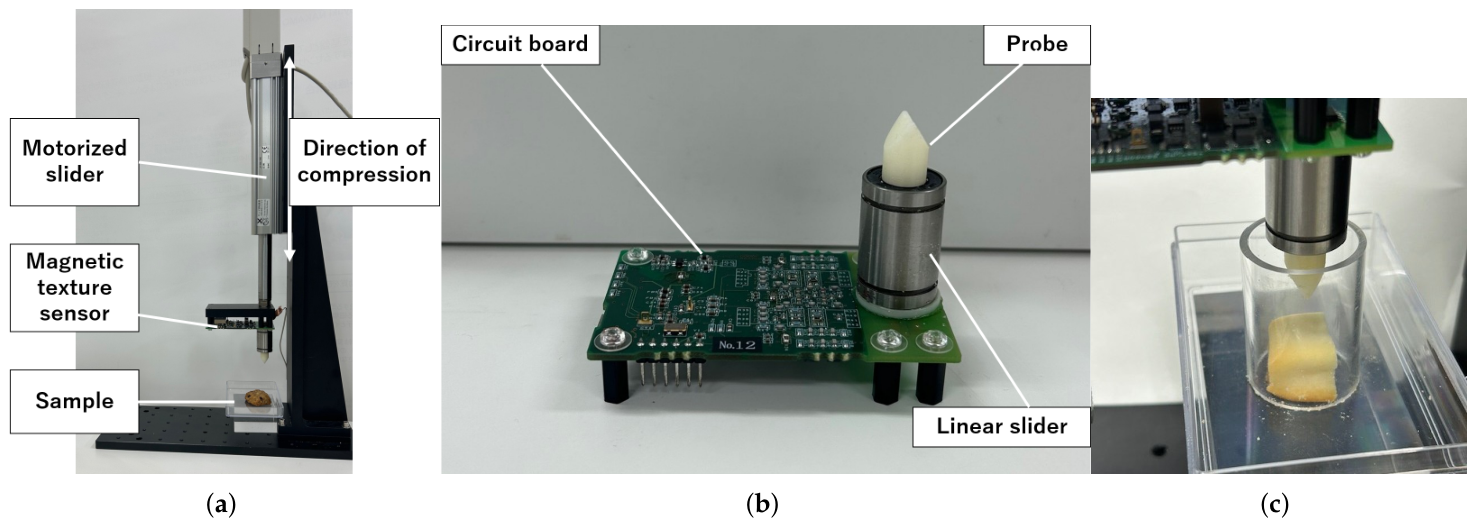
Figure 1a shows the measurement system. The measurement system mainly consists of a magnetic food texture sensor shown in Figure 1b [23], a motorized linear slider (LEY16DA, SMC Co., Ltd., Tokyo, Japan), a motor driver (LECPAN1, SMC Co., Ltd., Tokyo, Japan), and a desktop computer. The texture sensor compresses a food sample with a wedge-shaped probe with an edge angle of . The texture sensor had a sampling frequency of 10 kHz and measured force from N in tension to N in compression.
Figure 1.
Measurement system used in the experiments. (a) Overall experimental apparatus. (b) Magnetic food texture sensor equipped with a wedge-shaped probe. (c) Cylindrical holder used to stabilize the sample during compression while permitting fracture under reproducible boundary conditions.
In the experiment, samples were compressed using the texture sensor at a velocity of 10 mm/s, starting from the initial contact position. The compression length was set to 80% of the sample height, and each sample was compressed twice. To ensure positional stability during measurement, samples were placed in a cylindrical container with an outer diameter of 30 mm, an inner diameter of 28 mm, and a height of 40 mm, as shown in Figure 1c, which maintained its position and allowed the second compression to be performed reproducibly despite fragmentation. Therefore, these descriptors were retained as standard TPA variables.
2.2.2. Feature Values
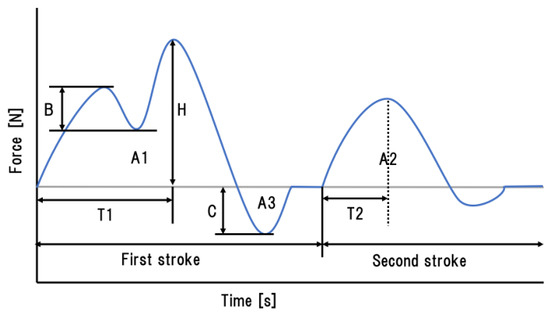
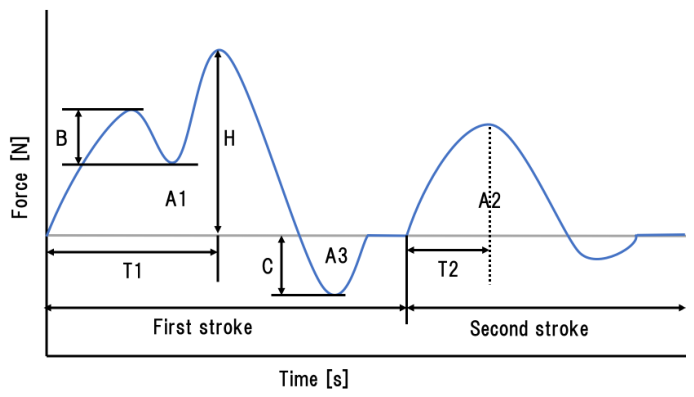
Measured force data consisted of two consecutive compression cycles. Seven features were extracted from the force–time curves: hardness, brittleness, adhesive force, adhesiveness, cohesiveness, springiness, and gumminess (Table 1 and Figure 2). Hardness and brittleness were obtained from the first compression and were selected as direct descriptors of resistance to deformation and fracture. Adhesive force and adhesiveness were calculated from the negative-force region during probe withdrawal. Cohesiveness and springiness were calculated by comparing the first and second compression cycles, and gumminess was calculated as hardness multiplied by cohesiveness. Because the wedge-shaped probe frequently fractured the brittle samples during the first cycle, second-cycle parameters were retained as TPA descriptors but interpreted cautiously.
Table 1.
Feature values calculated from force data.
Figure 2.
Representative force–time curve used to calculate the texture parameters.
2.3. Sensory Evaluation
Sensory evaluations were conducted for both cooked and commercially available samples. Based on group discussions, two representative texture attributes were selected for evaluation, as at least one texture attribute was strongly perceived in all samples except for one commercial sample. The selected textures are listed in Table 2 [24]. In comparison with the other samples, the one exhibited only weak sakusaku and karikari characteristics.
Table 2.
Definition of texture descriptor.
In the sensory evaluation, each cooked sample was assessed three times by seven university students (all male; mean age ± standard deviation: 23.6 ± 1.3 years). Each commercial sample was assessed five times by ten university students (nine males and one female; mean age ± standard deviation: 23.2 ± 1.6 years). Participants rated the intensity of the two food textures using a visual analogue scale ranging from 0 to 100 [25]. To eliminate visual bias, all evaluations were conducted with the participants’ eyes closed. This study was approved by the Ethics Committee of the Kobe University Graduate School of System Informatics (No. R05-04) in accordance with the Declaration of Helsinki.
2.4. Samples
2.4.1. Preparation of Cooked Samples
This study used baked cookies with varying physical characteristics as experimental samples. The ingredients included flour, egg, unsalted butter, and white sugar. First, melted butter, sugar, and egg were thoroughly mixed. Flour was then added to the mixture to form cookie dough. After refrigerating the dough for one hour, it was rolled out evenly to a thickness of 3 mm and rested in the refrigerator for an additional day. The dough sheet was then cut into 18-mm squares and baked in a preheated oven at 180 °C for 9 min.
Seven types of cookies were prepared for the experiment. Because the capacity of the oven was limited, two cookie formulations were baked simultaneously in each batch to maintain consistent baking conditions. Specifically, samples A and X, B and C, and D and Y were baked together, whereas sample E was baked separately.
The amounts of butter, egg, and flour were fixed at 20 g, 10 g, and 50 g, respectively. To vary the hardness of the cookies, the amount of sugar was adjusted as shown in Table 3. Prior to the main evaluation, sensory participants tested samples X and Y to calibrate their perception of texture intensity. Sample X exhibited sakusaku and karikari intensities of 80 and 20, respectively, whereas sample Y had intensities of 20 and 80, respectively. Following this calibration, participants evaluated the texture intensity of samples A through E, conducting three assessments per sample. For each cooked sample, the number of measurements was 21 (3 × 7).
Table 3.
Quantity of white sugar, unit g.
2.4.2. Selection of Commercial Samples
This study also used commercially available snack foods as samples. They are listed in Table 4. With the exception of sample S9, all samples exhibited at least moderate sakusaku and karikari characteristics. Prior to the main evaluation, sensory participants tested samples S10 and S11 to calibrate texture intensity. The sakusaku intensity of sample S10 and the karikari intensity of sample S11 were both defined as 80. Samples S1 through S9 were each evaluated five times. For each commercial sample, the number of measurements was 50 (5 × 10).
Table 4.
Commercial samples.
2.5. Data Processing
DirectLiNGAM was used to identify causal relationships using sensory evaluation values and physical feature values. The sensory evaluation data and the instrumental measurement data were independently collected for each sample type. Within each experiment (cooked cookie samples and commercial samples), the datasets for the same sample type were sequentially paired on a one-to-one basis. For example, one sensory evaluation result and one instrumental measurement were sequentially selected from sample S1 and paired as a single observation. Consequently, the datasets used for causal analysis consisted of 105 paired observations (21 observations for each of the five analyzed cookie formulations, A–E) and 450 paired observations (50 observations for each of the nine commercial samples, S1–S9). All data were standardized prior to causal discovery. Separate causal graphs were estimated for the two sensory evaluations, sakusaku and karikari. For each analysis, only the corresponding sensory evaluation scores with the physical features were included in the dataset. Thus, two independent DirectLiNGAM analyses were performed for each experiment (cooked cookie samples and commercial samples). After fitting the DirectLiNGAM model, the estimated disturbance terms (exogenous error terms in the structural equations) were extracted and examined to assess the non-Gaussianity assumption of the model.
Prior knowledge was incorporated by defining a prior knowledge matrix as
In this study, causal directions from the sensory variables to the physical variables were prohibited, whereas relationships among the physical variables and those from the physical variables to the sensory variables were left unrestricted. The robustness of the estimated causal structure was evaluated using bootstrap resampling. Following the implementation and recommendations of the DirectLiNGAM framework [16,22], 1000 bootstrap resamples were generated for each analysis. For each directed edge, the occurrence frequency among the bootstrap samples was calculated and used as an indicator of edge stability. All calculations were performed using Python (Ver. 3.12.11) and the LiNGAM Python package (lingam, Ver. 1.12.2). Confidence intervals for the individual path coefficients were not estimated because they are not directly provided by the standard LiNGAM package used in this study. Calculating such intervals would require a separate customized implementation and substantial additional computation. Therefore, the present bootstrap analysis was limited to the occurrence frequencies of the estimated causal directions.
To evaluate whether the estimated causal structures depended on the pairing strategy between independently collected sensory evaluations and physical features, an additional random-pairing sensitivity analysis was performed. This analysis differs from bootstrap resampling, which evaluates the stability of the estimated causal graph with respect to sampling variability. Instead, the random-pairing analysis specifically assesses the robustness of the estimated causal structures against different one-to-one pairings within each sample group (i.e., within each cooked sample such as A, B, C, D, and E). For the random-pairing sensitivity analysis, DirectLiNGAM was repeated 1000 times using independently generated pairings within each sample group. The occurrence frequency of each directed edge across the 1000 analyses was calculated as an indicator of robustness to the pairing strategy.
3. Results
Unless otherwise stated, the plotted points in the sensory and instrumental summary figures represent mean values, and the error bars represent standard deviations.
3.1. Cooked Samples
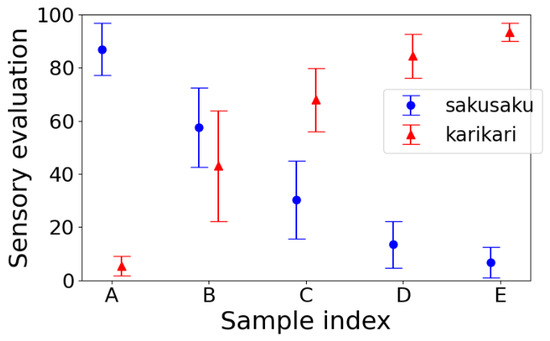
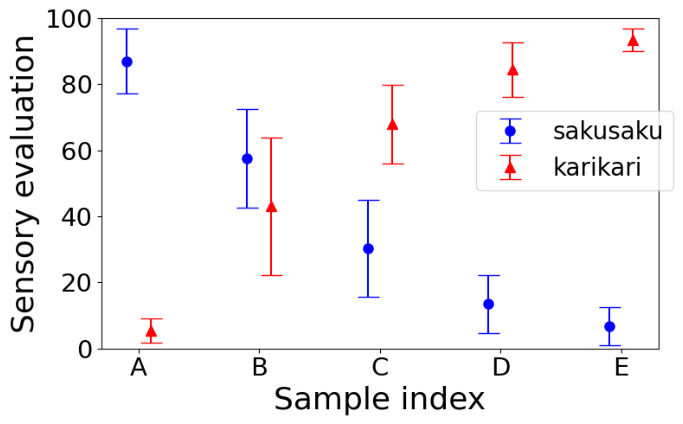
The sensory evaluation results are shown in Figure 3. Samples with higher sugar content showed lower sakusaku and higher karikari intensities. Figure 3 exhibits approximately linear relationships between sample composition and sensory intensity, with distinct trends observed for two textures.
Figure 3.
Sensory evaluation for sakusaku and karikari in the cooked samples; higher scores indicate stronger perceived intensity. The sample indexes A–E correspond to the cookie formulations listed in Table 3.
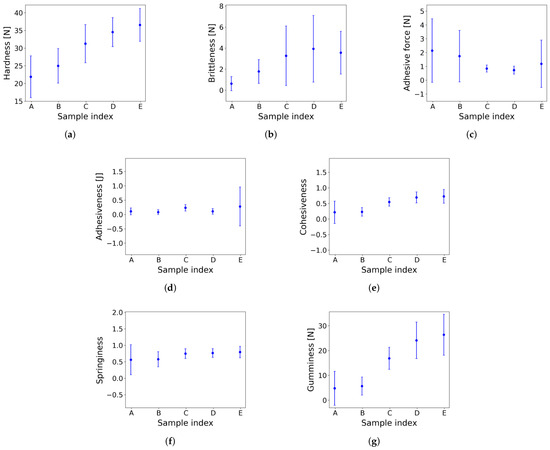
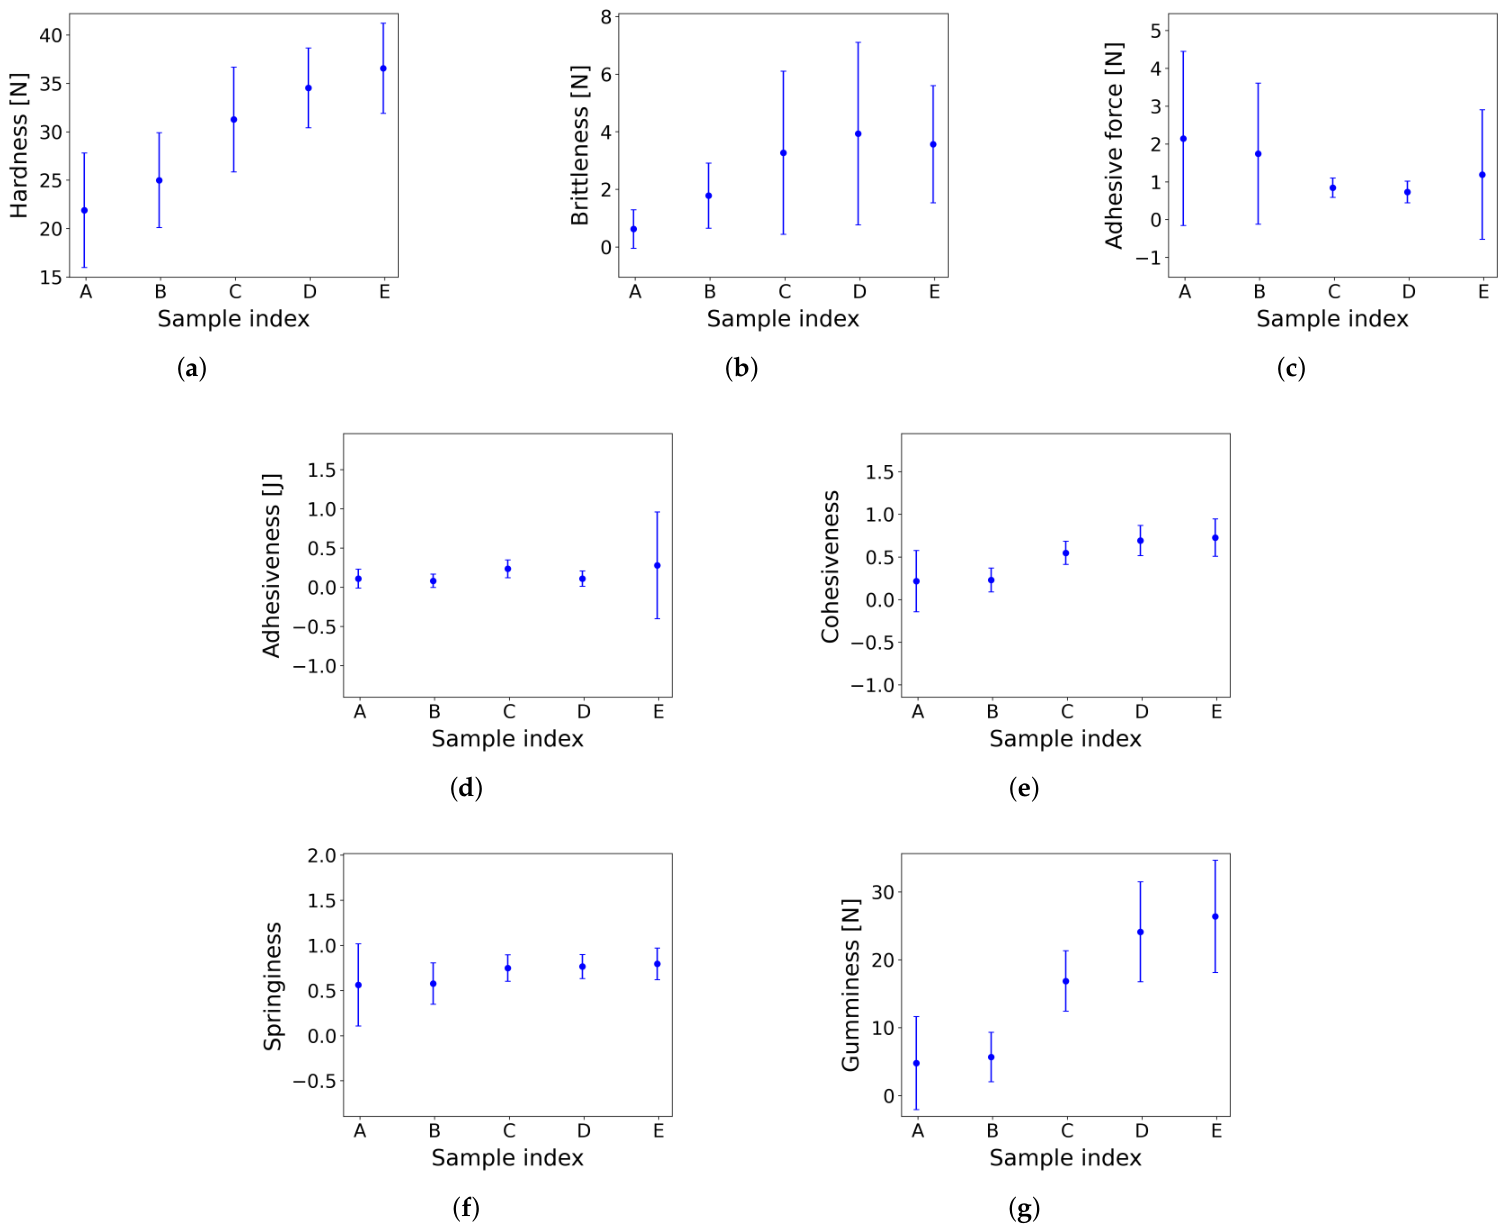
Feature values calculated from the measurement data are shown in Figure 4. Hardness, brittleness, and gumminess, shown in Figure 4a, Figure 4b, and Figure 4g, respectively, tended to increase with increasing sugar content. Other features did not exhibit any obvious trend.
Figure 4.
Physical feature values for the cooked samples. (a) Hardness. (b) Brittleness. (c) Adhesive force. (d) Adhesiveness. (e) Cohesiveness. (f) Springiness. (g) Gumminess.
Before applying DirectLiNGAM, the estimated disturbance terms for the nine variables included in the model (seven physical features, sakusaku and karikari) were examined using the Shapiro–Wilk test together with histogram and normal Q–Q plot inspections. Normality was rejected for six of the nine disturbance terms (). Based on this assessment, DirectLiNGAM was subsequently applied to the dataset.
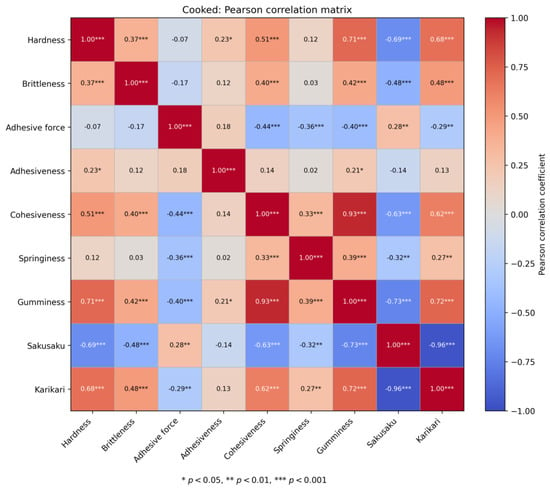
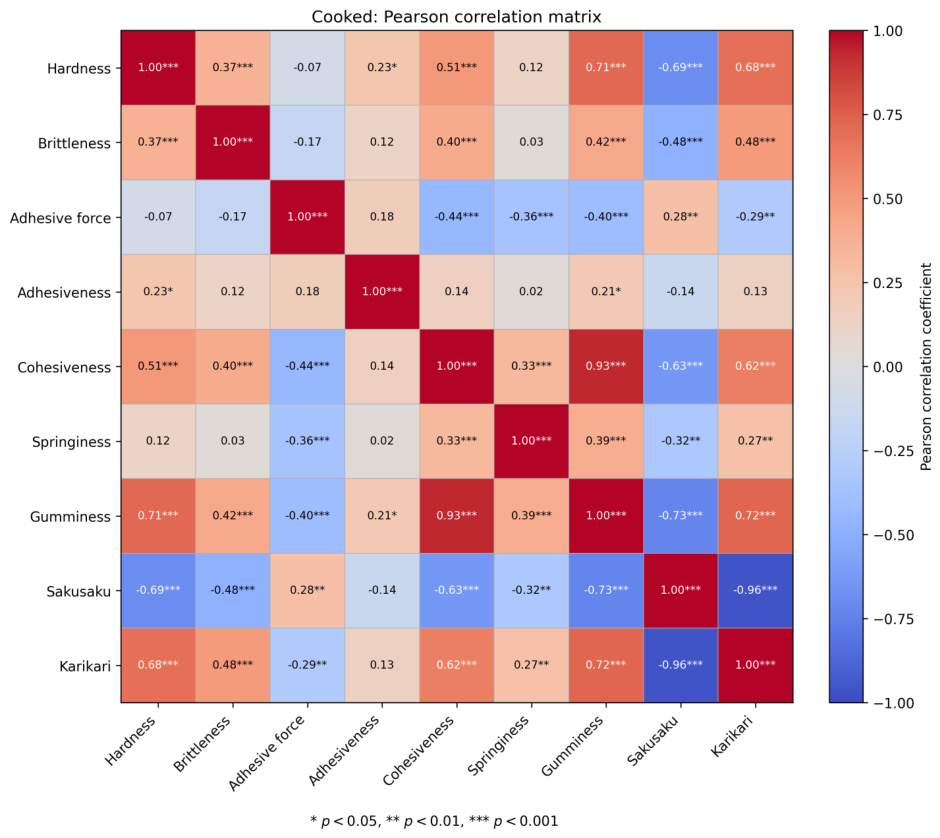
The Pearson correlation matrix for all variables is shown in Figure 5. Hardness, brittleness, cohesiveness, and gumminess were negatively correlated with sakusaku and positively correlated with karikari. In particular, gumminess showed the strongest correlations with sakusaku (, ) and karikari (, ). Hardness also showed relatively strong correlations with both sakusaku (, ) and karikari (, ).
Figure 5.
Pearson correlation matrix for the cooked samples. The cells show Pearson’s correlation coefficients among the seven physical features and the two sensory attributes.
Strong correlations were also observed among several physical features. These interrelationships indicate that some pairwise associations with the sensory evaluations may reflect shared or indirect relationships among the physical variables. DirectLiNGAM was therefore subsequently applied to examine the directional dependency structure while considering all variables simultaneously.
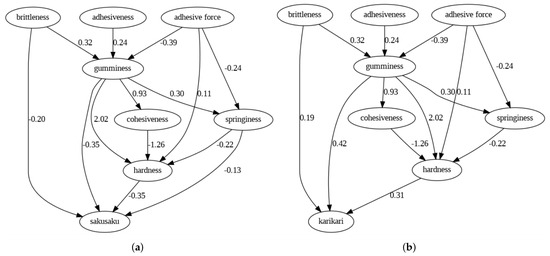
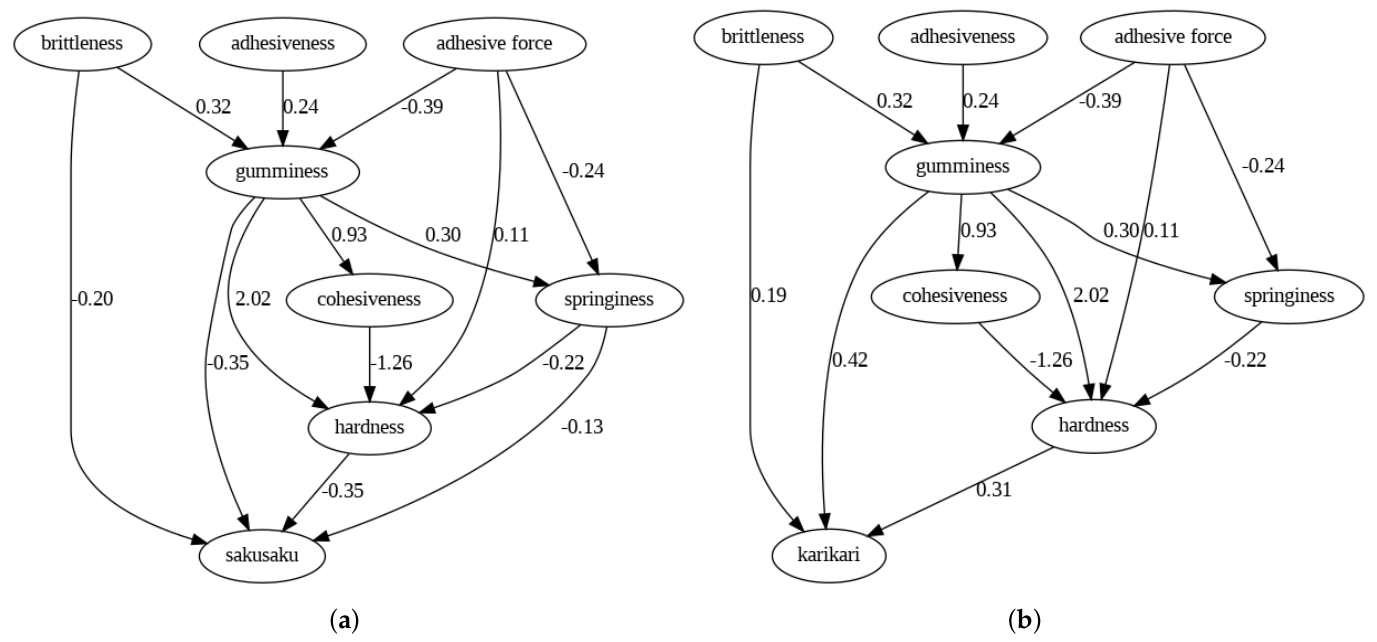
Figure 6a,b show the results of causal discovery in the form of causal graphs. Each node in the elliptical diagram represents a physical feature value or a texture attribute, and arrows between nodes indicate causal relationships, with accompanying coefficients representing the magnitude of the direct causal effects. Figure 6a used the sensory evaluation value of sakusaku as the texture variable, whereas Figure 6b used the sensory evaluation value of karikari. Figure 6a showed that the four feature values—hardness, brittleness, springiness, and gumminess—had direct effects on sakusaku. Figure 6b showed that hardness, brittleness, and gumminess directly caused karikari.
Figure 6.
DirectLiNGAM graphs for the cooked samples. Nodes represent standardized physical and sensory variables. Directed arrows represent estimated direct dependencies, and the numerical labels are standardized path coefficients; positive and negative values indicate effects in the same and opposite directions, respectively. Only the sensory target indicated in each panel was included. (a) Sakusaku. (b) Karikari.
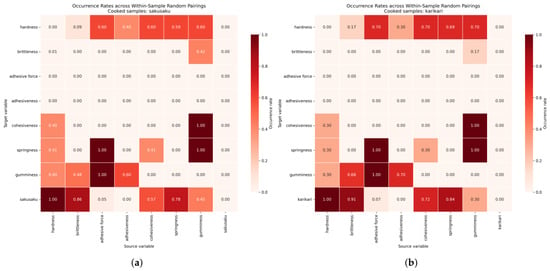
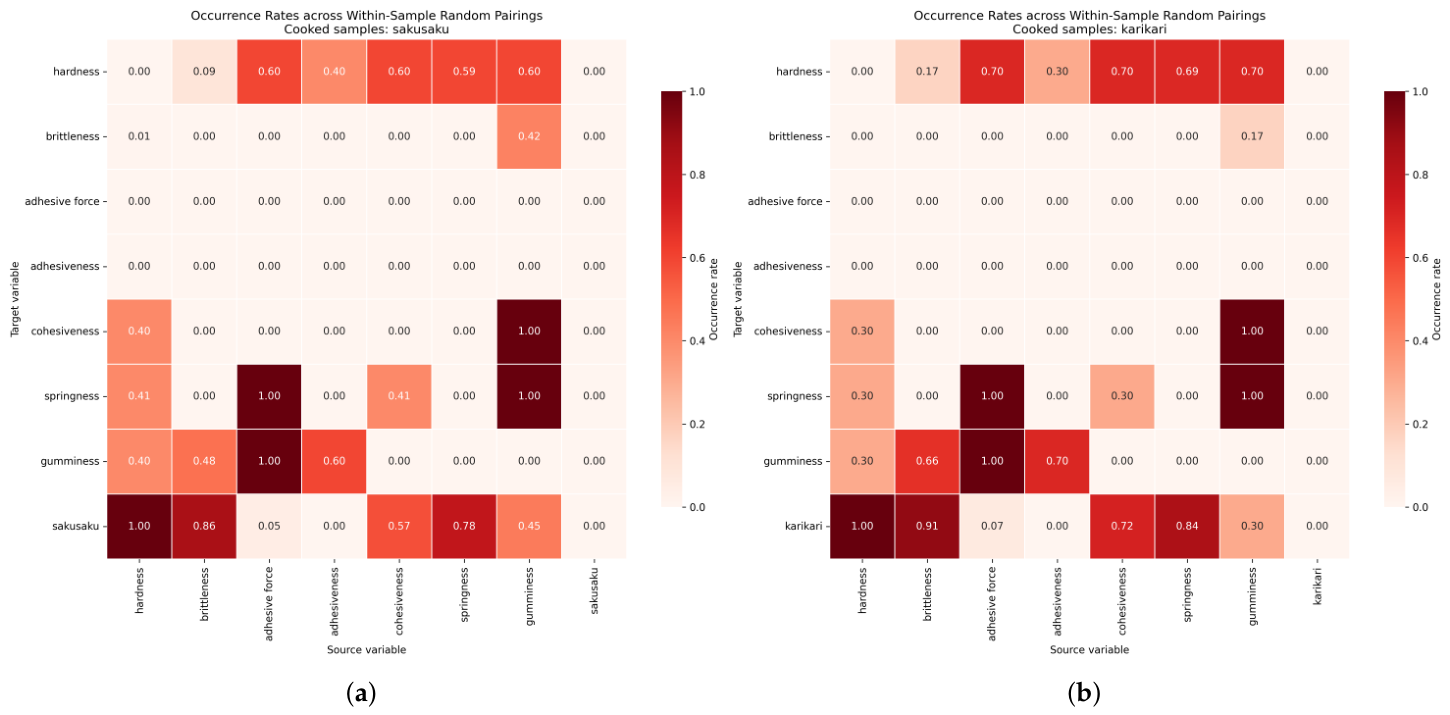
The results of the random-pairing sensitivity analysis are shown in Figure 7. The occurrence frequencies of the estimated causal edges across 1000 independently generated pairings within each sample group are presented. The principal causal relationships identified in Figure 6, particularly the direct effects of hardness and brittleness on the sensory evaluations, appeared consistently with high occurrence frequencies, whereas weaker edges showed substantially lower occurrence frequencies.
Figure 7.
Occurrence frequencies of causal edges obtained from 1000 random pairings within each sample group for the cooked sample. Each cell indicates the proportion of analyses in which the corresponding directed edge was estimated. (a) Sakusaku. (b) Karikari.
The causal relationships among the physical features were largely identical in the sakusaku and karikari graphs because the same physical features dataset was used for both analyses. The only difference between the two analyses was the sensory evaluation (sakusaku or karikari) included in the dataset. Because gumminess is calculated from hardness and cohesiveness, these three variables formed a closely connected substructure in the estimated graph. The causal role of gumminess should therefore be interpreted together with the relationships involving hardness and cohesiveness rather than as an independent physical property.
Table 5 summarizes the results of bootstrap resampling, focusing on direct arrows from physical features to sakusaku and karikari in causal graphs for the cooked samples. The count represents the frequency of occurrence of the arrows across 1000 bootstrap resampling trials. For both textures, hardness and brittleness showed higher occurrence frequencies than the other features.
Table 5.
Bootstrap stability of direct edges from physical features to sensory variables in the cooked-sample models (1000 resamples).
3.2. Commercial Samples
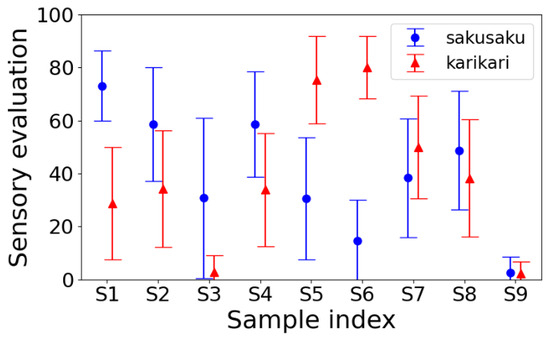
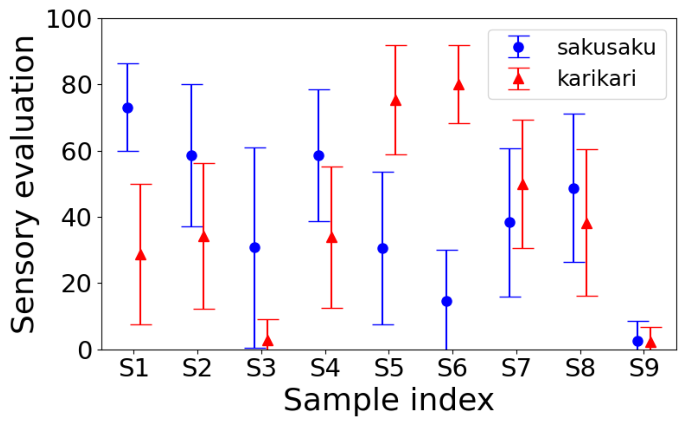
The evaluation result is shown in Figure 8. As anticipated during sample selection, the sensory evaluation intensity of sakusaku and karikari varied across samples. Compared with the cooked samples, the overall variation is larger.
Figure 8.
Sensory evaluation for sakusaku and karikari in the commercial samples; higher scores indicate stronger perceived intensity.
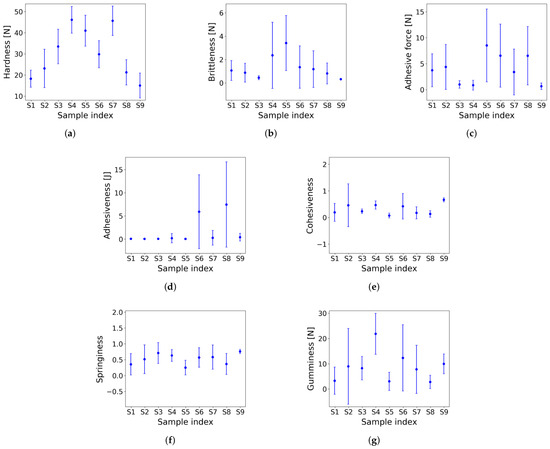
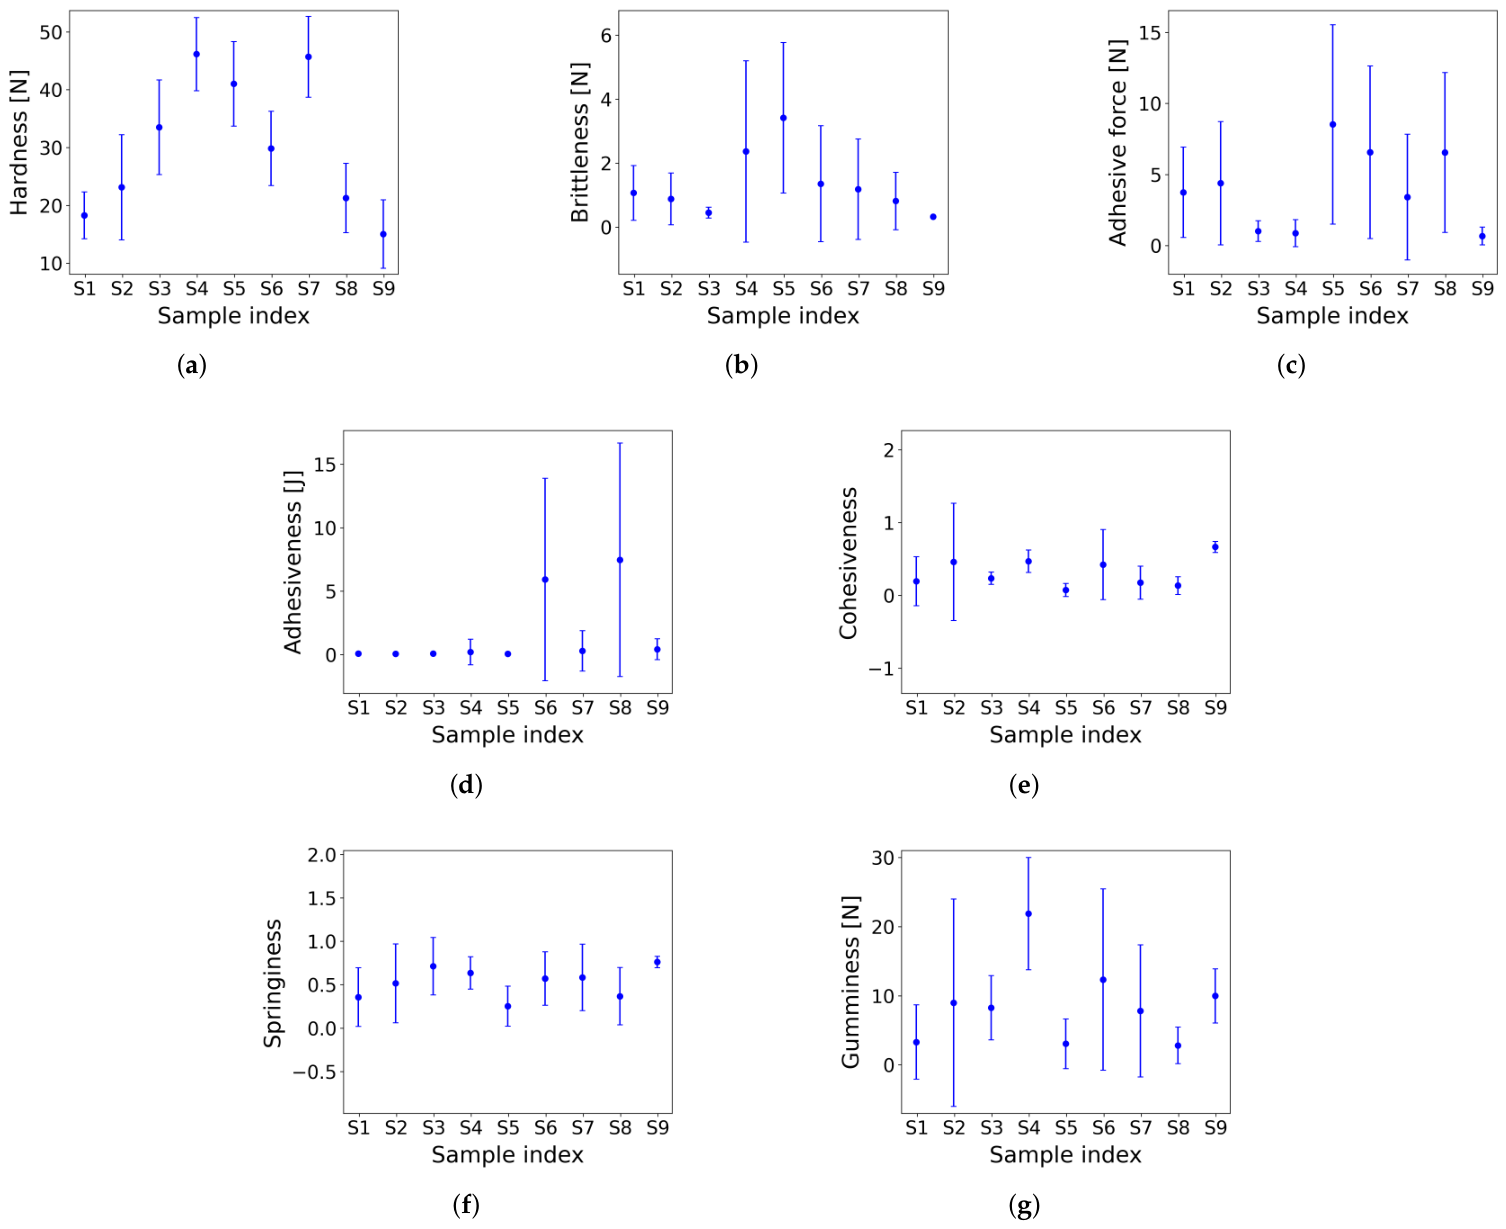
Feature values calculated from measurement data are shown in Figure 9. Unlike the cooked samples, these values did not exhibit trends similar to the sensory evaluation results or to those of other features. Furthermore, except for hardness and gumminess, the differences between samples were not particularly pronounced.
Figure 9.
Physical feature values for the commercial samples. (a) Hardness. (b) Brittleness. (c) Adhesive force. (d) Adhesiveness. (e) Cohesiveness. (f) Springiness. (g) Gumminess.
Before applying DirectLiNGAM, the estimated disturbance terms were assessed using the same procedure as for the cooked samples. The Shapiro–Wilk test rejected normality for all nine estimated disturbance terms (), indicating sufficient deviation from Gaussian distributions for the present analysis.
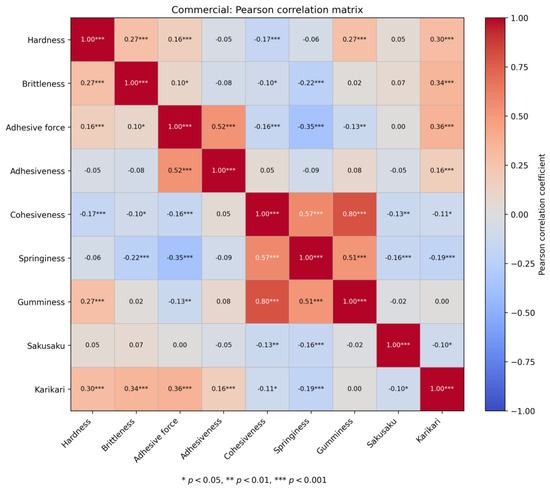
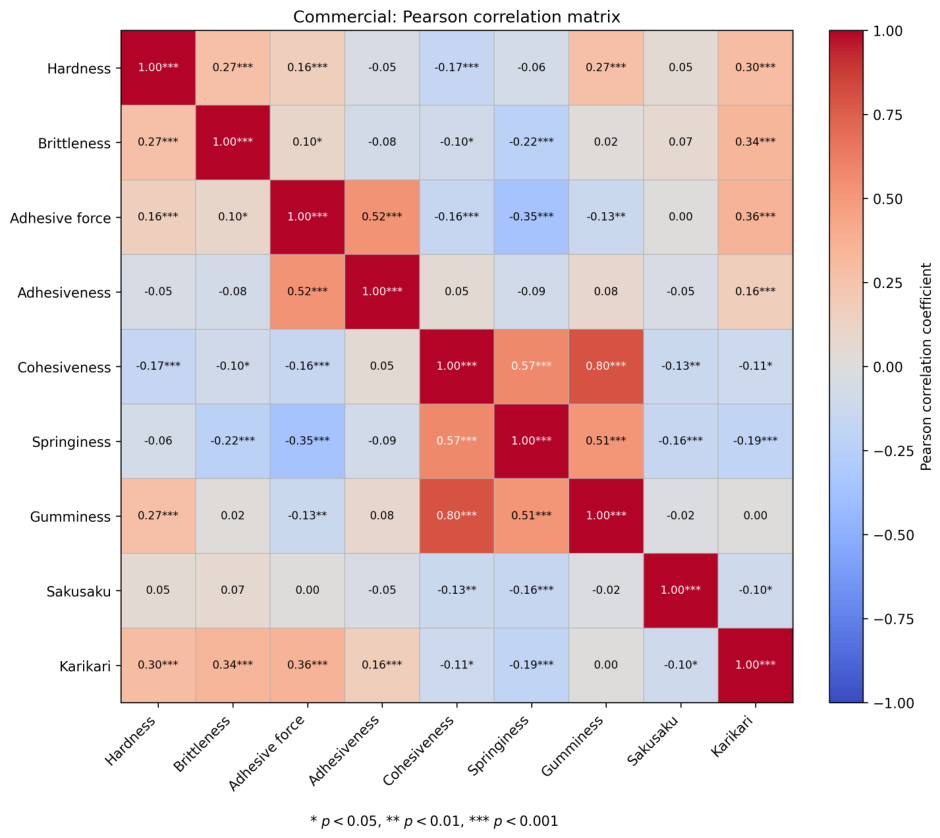
The Pearson correlation matrix for all variables is shown in Figure 10. Correlations between the physical features and sakusaku were generally weak. In contrast, karikari showed significant positive correlations with hardness (, ), brittleness (, ), and adhesive force (, ).
Figure 10.
Pearson correlation matrix for the commercial samples. The cells show Pearson’s correlation coefficients among the seven physical features and the two sensory attributes.
The correlation structure among the physical features was also more heterogeneous than that observed for the cooked samples. Because the correlation coefficients represent pairwise associations and do not distinguish direct dependencies from relationships mediated by other variables, DirectLiNGAM was subsequently applied to examine the directional structure of the full variable set.
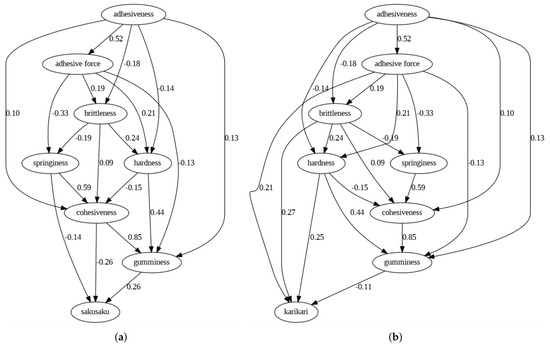
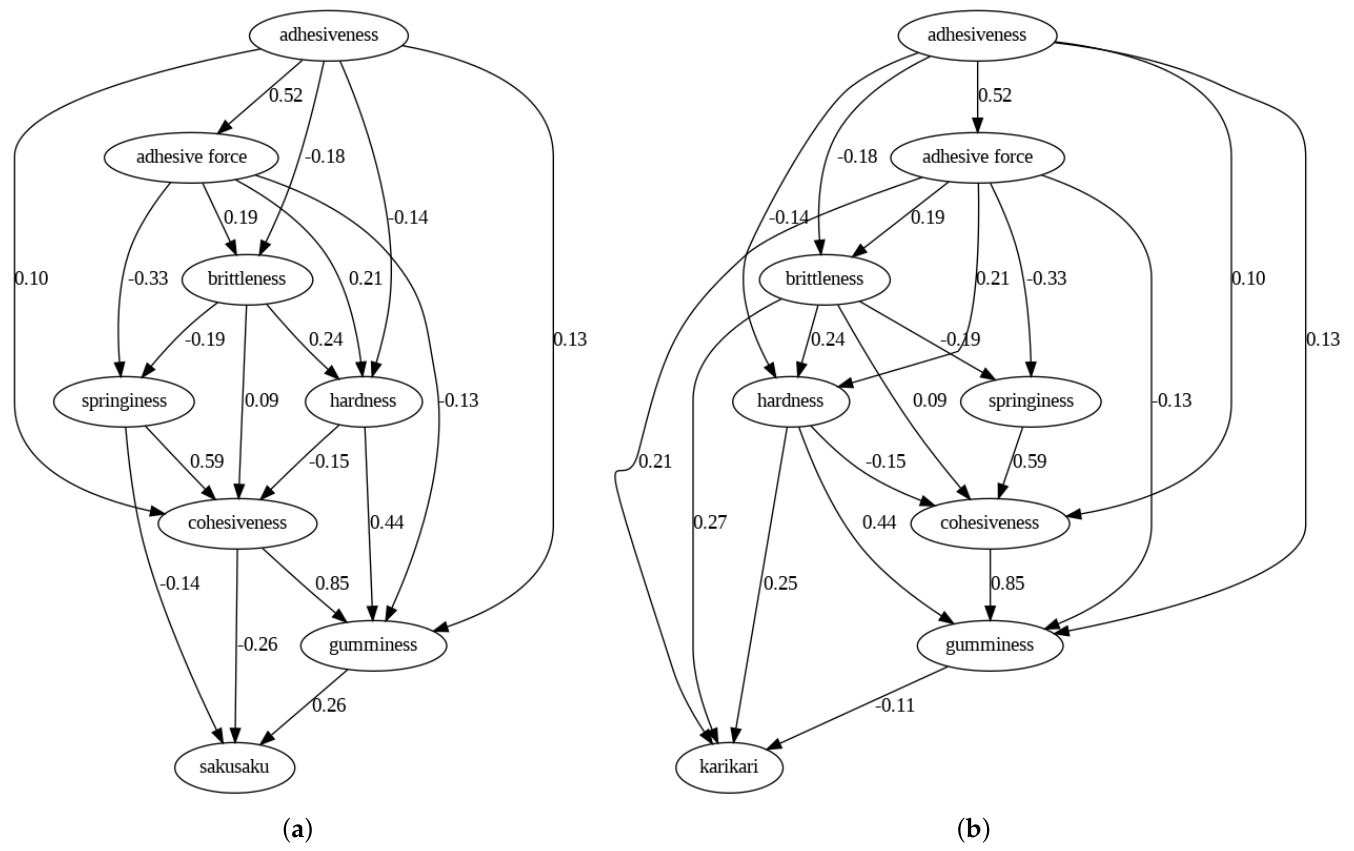
Figure 11a,b show the results of causal discovery using these data in the form of causal graphs. Figure 11a used the sensory evaluation value of sakusaku as the texture variable, while Figure 11b used the sensory evaluation value of karikari. Figure 11a indicated that three feature values—cohesiveness, springiness, and gumminess—directly caused sakusaku. Figure 11b showed that four feature values—hardness, brittleness, adhesive force, and gumminess—directly caused karikari.
Figure 11.
DirectLiNGAM graphs for the commercial samples. Nodes represent standardized physical and sensory variables. Directed arrows represent estimated direct dependencies, and the numerical labels are standardized path coefficients; positive and negative values indicate effects in the same and opposite directions, respectively. (a) Sakusaku. (b) Karikari.
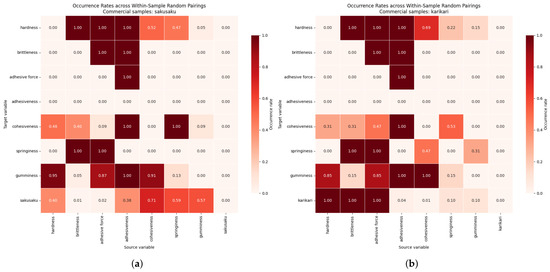
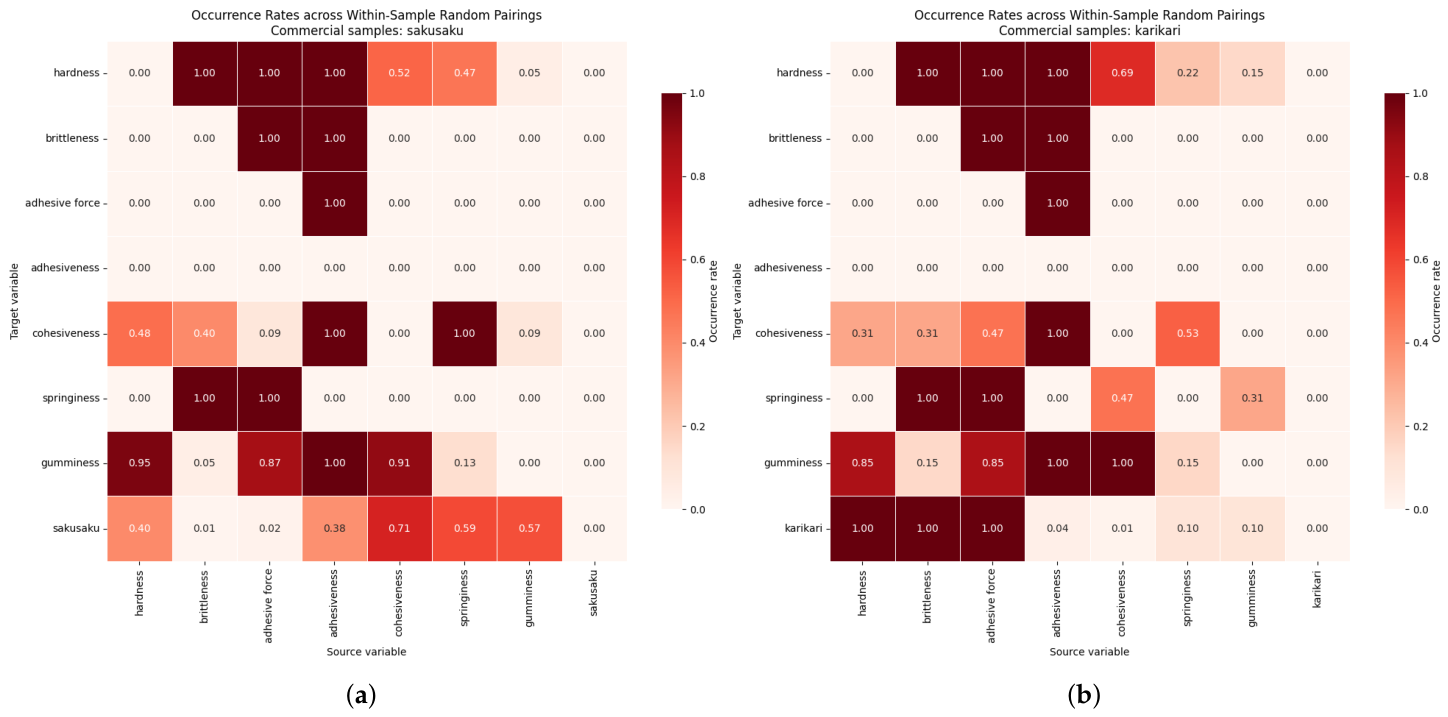
The same random-pairing sensitivity analysis was performed for the commercial samples. Random pairings were generated only within each commercial sample (S1–S9), and the occurrence frequencies of the estimated causal edges are shown in Figure 12.
Figure 12.
Occurrence frequencies of causal edges obtained from 1000 random pairings within each sample group for the commercial sample. Each cell indicates the proportion of analyses in which the corresponding directed edge was estimated. (a) Sakusaku. (b) Karikari.
The relationships among hardness, cohesiveness, and gumminess were different from those for the cooked sample.
Table 6 summarizes the results of bootstrap resampling, focusing on direct arrows from physical features to sakusaku and karikari in the causal graphs of the commercial samples. For karikari, occurrence frequencies of hardness, brittleness, and adhesiveness were very high. In contrast, for sakusaku, the occurrence frequencies of cohesiveness and gumminess were high, whereas those of hardness and brittleness were low.
Table 6.
Bootstrap stability of direct edges from physical features to sensory variables in the commercial-sample models (1000 resamples).
4. Discussion
The present study investigated whether DirectLiNGAM can provide useful insights into the directional relationships between instrumental physical features and the sensory perceptions of sakusaku and karikari. By analyzing both controlled cooked samples and commercially available products, the study evaluated the applicability of causal discovery under datasets with substantially different sources of variation.
For the cooked samples, hardness and brittleness consistently appeared as direct parents of both sakusaku and karikari, and these relationships were reproduced in almost all bootstrap resamples. The correlation analysis showed similar tendencies, with hardness, brittleness, and gumminess exhibiting strong negative correlations with sakusaku and positive correlations with karikari. DirectLiNGAM further suggested that hardness and brittleness remained directly associated with the sensory descriptors even after simultaneously considering the relationships among all physical features. These findings agree with the definitions of the sensory attributes adopted in this study: sakusaku represents a texture that fractures easily under relatively small force, whereas karikari is associated with a harder and more forceful fracture. Previous studies have also reported that brittleness and fracture behavior are important determinants of crispness and crunchiness in brittle foods [5]. The present results extend these observations by estimating directional statistical dependencies among multiple physical features rather than only pairwise associations.
The commercial samples exhibited a considerably more heterogeneous causal structure than the cooked samples. Although hardness and brittleness again showed stable relationships with karikari, additional variables, particularly adhesive force, also appeared as candidate direct parents. In contrast, the causal graph for sakusaku emphasized cohesiveness, springiness, and gumminess rather than hardness and brittleness. These differences are likely attributable to the much greater diversity of the commercial products, which differed not only in formulation but also in shape, internal structure, porosity, moisture content, manufacturing process, and fracture behavior. Consequently, the instrumental variables represented a wider variety of physical characteristics than in the controlled cookie dataset, making the resulting causal structure more complex and less straightforward to interpret.
The additional correlation analysis provided complementary information to the causal discovery results. For the cooked samples, several physical features showed strong mutual correlations in addition to their correlations with the sensory attributes. Similarly, the commercial samples exhibited numerous correlations among instrumental features, although the overall correlation structure was weaker and more heterogeneous. These findings indicate that simple pairwise correlations cannot distinguish direct relationships from indirect associations mediated through other physical variables. DirectLiNGAM complements correlation analysis by estimating a directed dependency structure while simultaneously considering all variables included in the model. The agreement between the correlation analysis and the most stable DirectLiNGAM edges, particularly those involving hardness and brittleness, increases confidence that these features represent robust instrumental indicators of texture perception.
Bootstrap resampling and the random-pairing sensitivity analysis evaluated different aspects of the robustness of the estimated causal structures. Bootstrap resampling assessed the stability of the estimated causal edges with respect to sampling variability, whereas the random-pairing sensitivity analysis evaluated the dependence of the estimated causal structures on the pairing strategy between independently collected sensory evaluations and physical features. The major causal relationships, particularly those involving hardness and brittleness, remained stable in both analyses, whereas weaker edges were more sensitive to the pairing strategy.
Because DirectLiNGAM assumes linear relationships with non-Gaussian independent disturbance terms, these assumptions were examined. The non-Gaussianity assumption was supported for six of the nine variables but not for all variables in the present dataset. Therefore, the estimated causal graphs should be regarded as exploratory statistical hypotheses rather than definitive causal relationships, and their validity is necessarily limited by the partial fulfillment of the model assumptions.
Several limitations should be considered when interpreting the results. First, gumminess is mathematically derived from hardness and cohesiveness. Including all three variables within the same causal model inevitably introduces deterministic or near-deterministic dependence, which may influence the estimated graph structure. Second, cohesiveness, springiness, and gumminess depend on the second compression cycle. Because the wedge-shaped probe frequently fractured brittle samples during the first compression, these parameters may partly reflect fragment rearrangement during the second compression rather than intrinsic structural recovery of intact samples. Accordingly, first-compression variables such as hardness and brittleness are likely to provide more physically interpretable indicators for brittle foods.
Another important limitation concerns the pairing of the sensory and instrumental data. Sensory evaluation and instrumental measurement were performed on different samples, and the datasets were paired sequentially within each sample group. The additional random-pairing sensitivity analysis indicated that the principal causal relationships were robust to different pairings within each sample group; the dependence arising from repeated observations within the same products and panelists was not eliminated. Consequently, the estimated causal relationships should be interpreted as group-level statistical hypotheses rather than sample-specific causal effects.
The present bootstrap analysis was limited to the occurrence frequencies of the estimated directed edges. More detailed bootstrap analyses, such as estimating confidence intervals for the path coefficients, were not conducted because they require additional customized implementation beyond the standard functionality of the LiNGAM package. Incorporating these analyses remains an important topic for future work.
Finally, this study should be regarded as an exploratory investigation of causal discovery for food texture analysis. The cooked samples varied primarily in sugar concentration, whereas the commercial products represented only nine selected snack foods. Each cooked formulation was produced in only a single baking batch. Consequently, the effects of formulation cannot be separated from batch-specific variation arising from dough preparation, moisture content, oven conditions, or baking uniformity. Therefore, the causal relationships estimated for the cooked samples should be interpreted as exploratory findings rather than definitive formulation-specific effects. Furthermore, the sensory panels consisted mainly of young adults. In addition, the cooked-sample panel included only male participants, whereas the commercial-sample panel included nine males and one female. Because sample type and panel composition varied simultaneously, differences between the two datasets cannot be attributed solely to differences in the products. Larger datasets including more formulations, more commercial products, and broader participant demographics will be necessary to further validate the estimated causal structures. In addition, future studies should investigate nonlinear causal discovery methods and incorporate additional physical characteristics, such as acoustic features, moisture content, and microstructural information, to obtain a more comprehensive understanding of texture perception.
5. Conclusions
This study investigated the applicability of DirectLiNGAM for exploring directional statistical relationships between instrumental texture features and the sensory perceptions of sakusaku and karikari. Controlled cooked cookie samples and commercially available snack foods were analyzed using seven force-derived texture features obtained from a magnetic texture sensor.
Correlation analysis demonstrated significant associations between several physical features and the sensory descriptors, particularly for the cooked samples. Assessment of the estimated disturbance terms also provided empirical support for the non-Gaussianity assumption required for DirectLiNGAM. Building on these analyses, DirectLiNGAM identified hardness and brittleness as the most stable candidate direct determinants of both sakusaku and karikari in the cooked samples, whereas the commercial products exhibited more heterogeneous dependency structures reflecting their greater physical diversity.
These findings suggest that causal discovery can complement correlation analysis by estimating directed statistical relationships while simultaneously considering interactions among multiple physical features. Nevertheless, the estimated graphs should be interpreted as exploratory statistical hypotheses because sensory and instrumental measurements were obtained from different samples, several variables were derived from the second compression cycle, and the analysis relied on the assumptions of DirectLiNGAM.
Future work will include larger and more diverse datasets, paired sensory and instrumental measurements obtained from identical samples, and the incorporation of additional physical characteristics such as acoustic and structural features. Extending the framework to nonlinear causal discovery methods and to a broader range of food materials will further improve the understanding of texture perception.
Author Contributions
Conceptualization, Y.K. and H.N.; methodology, Y.K.; software, Y.K.; validation, Y.K. and H.N.; formal analysis, Y.K.; investigation, Y.K.; data curation, Y.K.; writing—original draft preparation, Y.K.; writing—review and editing, Y.K.; visualization, Y.K.; supervision, H.N. All authors have read and agreed to the published version of the manuscript.
Funding
This work was supported by JSPS KAKENHI, Grant Number JP26K08681.
Institutional Review Board Statement
The study was conducted in accordance with the Declaration of Helsinki, and the protocol was approved by the Ethics Committee of the Graduate School of System Informatics, Kobe University (approval No. R05-04) on 15 March 2024.
Informed Consent Statement
Informed consent was obtained from all subjects involved in the study.
Data Availability Statement
The data presented in this study are available from the corresponding author upon reasonable request.
Conflicts of Interest
The authors declare no conflicts of interest.
References
- Vickers, Z.M. Pleasantness of Food Sounds. J. Food Sci. 1983, 48, 783–786. [Google Scholar] [CrossRef] [Scilit]
- Bourne, M.C. Food Texture and Viscosity, 2nd ed.; Academic Press: New York, NY, USA, 1982. [Google Scholar]
- Szczesniak, A.S. Texture is a sensory property. Food Qual. Prefer. 2002, 13, 215–225. [Google Scholar] [CrossRef] [Scilit]
- Tunick, M.H.; Onwulata, C.I.; Thomas, A.E.; Phillips, J.G.; Mukhopadhyay, S.; Sheen, S.; Liu, C.; Latonaa, N.; Pimentel, M.R.; Cooke, P.H. Critical evaluation of crispy and crunchy textures: A review. Int. J. Food Prop. 2013, 16, 949–963. [Google Scholar] [CrossRef] [Scilit]
- Saeleaw, M.; Schleining, G. A review: Crispness in dry foods and quality measurements based on acoustic–mechanical destructive techniques. J. Food Eng. 2011, 105, 387–399. [Google Scholar] [CrossRef] [Scilit]
- Huang, L.; Fan, J.; Han, C.; Du, C.; Wei, Z.; Du, D. Methods and Instruments for the Evaluation of Food Texture: Advances and Perspectives. Food Res. Int. 2025, 208, 116162. [Google Scholar] [CrossRef] [Scilit] [PubMed]
- Lupu, M.; Nedeff, V.; Panainte, M.; Rusu, D. Techniques and Methods for Measuring the Texture of Processed and Fresh Agro-Food Products—A Review. Bul. Inst. Politeh. Iaşi 2022, 68, 7–28. [Google Scholar] [CrossRef] [Scilit]
- Friedman, H.H.; Whitney, J.E.; Szczesniak, A.S. The Texturometer—A New Instrument for Objective Texture Measurement. J. Food Sci. 1963, 28, 390–396. [Google Scholar] [CrossRef] [Scilit]
- Varela, P.; Chen, J.; Fiszman, S.; Povey, M.J.W. Crispness assessment of roasted almonds by an integrated approach to texture description: Texture, acoustics, sensory and structure. J. Chemom. 2006, 20, 311–320. [Google Scholar] [CrossRef] [Scilit]
- Salvador, A.; Varela, P.; Sanz, T.; Fiszman, S.M. Understanding potato chips crispy texture by simultaneous fracture and acoustic measurements, and sensory analysis. LWT Food Sci. Technol. 2009, 42, 763–767. [Google Scholar] [CrossRef] [Scilit]
- Taniwaki, M.; Kohyama, K. Mechanical and acoustic evaluation of potato chip crispness using a versatile texture analyzer. J. Food Eng. 2012, 112, 268–273. [Google Scholar] [CrossRef] [Scilit]
- de Moraes, J.O.; Andreani, P.; Murta, B.H.P.; Link, J.V.; Tribuzi, G.; Laurindo, J.B.; Paul, S.; Carciofi, B.A.M. Mechanical–acoustical measurements to assess the crispness of dehydrated bananas at different water activities. LWT 2022, 154, 112822. [Google Scholar] [CrossRef] [Scilit]
- Szczesniak, A.S. Correlating Sensory with Instrumental Texture Measurements—An Overview of Recent Developments. J. Texture Stud. 1987, 18, 1–15. [Google Scholar] [CrossRef] [Scilit]
- Nogueira, A.R.; Pugnana, A.; Ruggieri, S.; Pedreschi, D.; Gama, J. Methods and Tools for Causal Discovery and Causal Inference. WIREs Data Min. Knowl. Discov. 2022, 12, e1449. [Google Scholar] [CrossRef] [Scilit]
- Shimizu, S.; Hoyer, P.O.; Hyvärinen, A.; Kerminen, A. A Linear Non-Gaussian Acyclic Model for Causal Discovery. J. Mach. Learn. Res. 2006, 7, 2003–2030. [Google Scholar]
- Shimizu, S.; Inazumi, T.; Sogawa, Y.; Hyvärinen, A.; Kawahara, Y.; Washio, T.; Hoyer, P.O.; Bollen, K. DirectLiNGAM: A Direct Method for Learning a Linear Non-Gaussian Structural Equation Model. J. Mach. Learn. Res. 2011, 12, 1225–1248. [Google Scholar]
- Bi, X.; Wu, D.; Xie, D.; Ye, H.; Zhao, J. Large-Scale Chemical Process Causal Discovery from Big Data with Transformer-Based Deep Learning. Process Saf. Environ. Prot. 2023, 173, 163–177. [Google Scholar] [CrossRef] [Scilit]
- Miraki, A.; Parviainen, P.; Arghandeh, R. Electricity Demand Forecasting at Distribution and Household Levels Using Explainable Causal Graph Neural Network. Energy AI 2024, 16, 100368. [Google Scholar] [CrossRef] [Scilit]
- Kotoku, J.; Oyama, A.; Kitazumi, K.; Toki, H.; Haga, A.; Yamamoto, R.; Shinzawa, M.; Yamakawa, M.; Fukui, S.; Yamamoto, K.; et al. Causal Relations of Health Indices Inferred Statistically Using the DirectLiNGAM Algorithm from Big Data of Osaka Prefecture Health Checkups. PLoS ONE 2020, 15, e0243229. [Google Scholar] [CrossRef] [Scilit] [PubMed]
- Liu, J.; Niyogi, D. Identification of Linkages between Urban Heat Island Magnitude and Urban Rainfall Modification by Use of Causal Discovery Algorithms. Urban Clim. 2020, 33, 100659. [Google Scholar] [CrossRef] [Scilit]
- Takayama, M.; Okuda, T.; Pham, T.; Ikenoue, T.; Fukuma, S.; Shimizu, S.; Sannai, A. Integrating Large Language Models in Causal Discovery: A Statistical Causal Approach. Trans. Mach. Learn. Res. 2025, 1–78. [Google Scholar] [CrossRef] [Scilit]
- Komatsu, Y.; Shimizu, S.; Shimodaira, H. Assessing Statistical Reliability of LiNGAM via Multiscale Bootstrap. In Proceedings of the 20th International Conference on Artificial Neural Networks; Springer: Berlin/Heidelberg, Germany, 2020; pp. 309–314. [Google Scholar]
- Nakamoto, H.; Nagahata, Y.; Kobayashi, F. Food Texture Sensor and Comparison of the Measurement Data of Chicken Nuggets. Sensors 2021, 21, 3310. [Google Scholar] [CrossRef] [Scilit] [PubMed]
- Hayakawa, F.; Kazami, Y.; Nishinari, K.; Ioku, K.; Akuzawa, S.; Yamano, Y.; Baba, Y.; Kohyama, K. Classification of Japanese Texture Terms. J. Texture Stud. 2013, 44, 140–159. [Google Scholar] [CrossRef] [Scilit]
- Huskisson, E.C. Measurement of Pain. Lancet 1974, 304, 1127–1131. [Google Scholar] [CrossRef] [Scilit] [PubMed]

Disclaimer/Publisher’s Note: The statements, opinions and data contained in all publications are solely those of the individual author(s) and contributor(s) and not of MDPI and/or the editor(s). MDPI and/or the editor(s) disclaim responsibility for any injury to people or property resulting from any ideas, methods, instructions or products referred to in the content. |
© 2026 by the authors. Licensee MDPI, Basel, Switzerland. This article is an open access article distributed under the terms and conditions of the Creative Commons Attribution (CC BY) license.