


Abstract
Although combustion technology is used in various fields, carbon dioxide is emitted when fossil fuels are burned. Using methane, the main component of natural gas, mixed with a non-carbon-dioxide-emitting fuel is a practical solution. In this study, we focused on hydrogen as a zero-emission fuel and examined the associated challenges. As a case study, we considered co-combustion in which the methane (the main component of LNG) was replaced with hydrogen, analyzing the impact on carbon dioxide emissions, calorific value, and price. Similarly, we examined ammonia and compared it with hydrogen. Taking into account the CO2 emissions permitted during fuel production under the Act on the Promotion of a Hydrogen Society, the reduction rate is lower when methane is replaced with hydrogen or ammonia. When methane is completely replaced with hydrogen, the CO2 emissions from the fuel production process would still amount to 15% of those from a 100% methane fuel. In contrast, this value rises to 33% for ammonia, indicating that the CO2 reduction effect of ammonia is smaller than that of hydrogen.
1. Introduction
In order to address global warming, countries around the world, including Japan, are aiming to achieve carbon neutrality by 2050 [1,2,3]. In combustion technologies such as thermal power generation, burning carbon-containing fuels typically results in the emission of carbon dioxide [4,5,6]. To reduce carbon dioxide emissions from combustion, three approaches are being considered: (i) using carbon-free fuels [7,8,9,10], (ii) using carbon-neutral fuels [4,11,12,13,14,15,16,17,18,19], and (iii) establishing systems that capture and prevent the release of 100% of the carbon dioxide into the atmosphere after combustion [20,21]. As for carbon-free fuels, hydrogen addition in laminar flames [7,8] and turbulent flames [9,10] has been investigated. Regarding carbon-neutral fuels, many overseas projects are underway [11,12,13]. This application is called power-to-gas (PtG), which is a technology that converts surplus electricity—usually from renewable sources like wind or solar—into gaseous fuels such as hydrogen or synthetic methane. In particular, methanation for synthesizing methane from carbon dioxide and hydrogen has attracted attention [4,14,15]. We have proposed new methanation reactors [16,17,18,19].
Hydrogen is an example of a carbon-free fuel. This study examined its use. However, since hydrogen is rarely found in nature, key considerations for its utilization include what to use as a source and how to produce it. PtG technology [13], which uses surplus renewable energy to electrolyze water and produce green hydrogen or green methane, is becoming increasingly widespread. Regarding (iii), the success of technologies for separating carbon dioxide from combustion gases or capturing it from the atmosphere (direct air capture, DAC) is an issue [20]. However, we propose the ZERO (Zero-Emission Reactor [21]) system, which recovers and utilizes carbon dioxide from combustion gases within the system. This paper does not cover (ii) and (iii).
As hydrogen and ammonia do not emit carbon dioxide, they are expected to be used more widely in the future. This study identifies the challenges associated with using hydrogen and ammonia as fuels for combustion and examines the carbon dioxide emissions when these fuels are mixed with methane. Section 2 introduces Japanese efforts to develop a legal framework to promote hydrogen and low-carbon fuels. Section 3 focuses specifically on hydrogen and explains its fuel characteristics. Section 4 discusses the issues associated with the use of hydrogen, as well as blended fuels of methane and hydrogen or ammonia.
2. Legislation for Hydrogen Utilization and Promotion
The first Japanese law related to global warming to be mentioned is the Act on Promotion of Global Warming Countermeasures, enacted in 1998 [22]. This law was domestic legislation that offered a framework for reducing greenhouse gas emissions in relation to the Kyoto Protocol, which came into effect in 2005 [23]. The law’s primary objectives were to curb greenhouse gas emissions and promote measures against global warming. Based on the Paris Agreement adopted at COP21 in 2015 [24], this law has since undergone several amendments.
On the other hand, with regard to legislation concerning the utilization of hydrogen, there is the Hydrogen Society Promotion Act, which came into effect in October 2024 [25,26]. Its official name is the Act on the Promotion of the Supply and Utilization of Low-Carbon Hydrogen and its Derivatives. “Low-carbon hydrogen and its derivatives” are defined as hydrogen and other low-carbon hydrocarbon fuels that meet the following requirements: the amount of carbon dioxide emitted during their production is below a specified value; their use is recognized as contributing to reducing carbon dioxide emissions in Japan in accordance with international decisions on the calculation of carbon dioxide emissions; and they satisfy other requirements specified by the Ordinance of the Ministry of Economy, Trade, and Industry. The Ordinance of the Ministry of Economy, Trade, and Industry specifies these requirements (Article 2, Paragraph 1 of the Act) [27].
In this Act, “low-carbon hydrogen and its derivatives” are defined as “hydrogen and its compounds specified by an Ordinance of the Ministry of Economy, Trade, and Industry”. The Enforcement Regulations of the Act on the Promotion of the Supply and Use of Low-Carbon Hydrogen for a Smooth Transition to a Decarbonized, Growth-Oriented Economic Structure (Ministry of Economy, Trade, and Industry Ordinance No. 69 of 2024) (hereafter referred to as the “Regulations”) state that these hydrogen compounds include (a) ammonia; (b) liquids synthesized from hydrogen and carbon monoxide or hydrogen and carbon dioxide (synthetic fuels); and (c) methane synthesized from hydrogen and carbon monoxide or hydrogen and carbon dioxide (synthetic methane) (Article 2 of the Regulations). More specifically, please refer to Article 3 of the Regulations of the Ordinance of the Ministry of Economy, Trade, and Industry. For hydrogen and ammonia, the CO2 emissions during their production processes serve as the reference values for CO2 emissions from “well to gate”, representing the total CO2 generated from the extraction of raw materials (“well”) to the factory exit (“gate”), including emissions from feedstock gathering, processing, and on-site production, but excluding final transport and use [28]. In contrast, for synthetic fuels and synthetic methane, the reference value derived from the Hydrogen Society Promotion Act includes CO2 emissions from the supply chain, including production, transportation, storage, and utilization. The approach of setting a benchmark value based on a 70% reduction in CO2 emissions from grey hydrogen and grey ammonia is maintained for hydrogen and ammonia. For synthetic fuels and synthetic methane, the reference value is set based on a 70% reduction in CO2 emissions from the grey hydrogen production portion, plus the consideration of the energy consumption associated with synthesis, transportation, etc. In this study, we only focused on hydrogen and ammonia.
3. Properties of Hydrogen and Methane
Natural gas, or liquefied natural gas (LNG), is a fossil fuel consisting mainly of methane. In this section, we will compare the characteristics of hydrogen and methane, as shown in Table 1. Firstly, hydrogen is known to have a wider flammable range and lower minimum ignition energy than methane [29]. The burning velocity of hydrogen is much greater than that of methane. Regarding the flame extinction distance, that of hydrogen is 0.64 mm and that of methane is 2.2 mm, meaning that hydrogen is less prone to flame extinction during combustion [30].
Table 1.
Physical properties [29].
Here, we consider the issues surrounding the Hydrogen Society Promotion Act. Although hydrogen can be produced through the electrolysis of water, the Act does not restrict its scope to green hydrogen or green ammonia, both of which are produced solely from renewable energy sources. Currently, even if fossil fuels are used in the production of hydrogen or ammonia, this is permitted if the amount of carbon dioxide emitted during production is below the reference value defined by law. For example, if the amount of carbon dioxide emitted when producing 1 kg of hydrogen is 3.4 kg or less, the hydrogen is classified as “low-carbon hydrogen and its derivatives”. However, this reference value does not include carbon dioxide emitted during the transportation and storage of hydrogen. In the current situation in Japan, most hydrogen is likely to be imported from overseas. Methane is stored at −162 °C and hydrogen at −253 °C. The boil-off gas (BOG) generation rate of liquefied hydrogen is considerably higher than that of LNG. Even if hydrogen can be liquefied for transport, its density is considerably lower than that of LNG. Consequently, more ships will be needed to transport the same amount as for LNG [31].
4. Blended Fuels with Methane and Hydrogen or Ammonia
It is well known that the main component of LNG is methane. When methane is burned, it releases less carbon dioxide than other fossil fuels, such as coal. This is why the use of LNG is expanding so rapidly. Conversely, since hydrogen does not contain carbon, it can be considered a zero-carbon fuel. However, it is not realistic to replace all equipment and infrastructure used to satisfy the fuel demand with low-hydrocarbon fuel. Therefore, the addition of hydrogen or ammonia to city gas is being considered as a realistic approach [32,33]. It should be noted that green hydrogen is still expensive. Furthermore, adding hydrogen inevitably changes the calorific value of the mixed fuel.
Therefore, we examined the positive effects of reducing carbon dioxide emissions by adding hydrogen to methane, as well as the negative effects of lowering the calorific value and raising fuel costs. For comparison, we conducted a similar analysis of ammonia, which has attracted attention in recent years [34]. As ammonia does not contain carbon, mixing it with methane reduces the carbon dioxide emissions during combustion. The combustion reactions of methane, hydrogen, and ammonia are shown below:
In reality, the above reactions do not occur in their entirety. However, when estimating the reduction in carbon dioxide that can be achieved by burning a mixed fuel containing hydrogen or ammonia added to methane, the complete reaction equation is more useful. In the present analysis, only combustion-related CO2 emissions were calculated. Moreover, the production-related CO2 emissions for hydrogen and ammonia were considered. Since other CO2 emissions from methane extraction, processing, liquefaction, transportation, and leakage [35,36] were not included, this could represent a limited-boundary scenario assessment.
Considering the complete reaction simultaneously makes it easier to adjust the oxidant supply so that the equivalence ratio corresponding to that of the mixed fuel becomes 1. In our calculations, we set the molar fraction of hydrogen (or ammonia) in the mixed fuel as x and then used Equations (1)–(3) to calculate the amount of carbon dioxide contained in the post-combustion gas when some of the methane was replaced with hydrogen or ammonia. Table 2 shows the calculation conditions and the results for the molar fraction of carbon dioxide in the burned gas, assuming the composition of the mixed fuel and the complete reaction equation when methane is progressively replaced with hydrogen. Table 3 shows the calculation conditions when methane was progressively replaced with ammonia. As an oxidant, air was used, with a nitrogen-to-oxygen ratio of 79:21. Nitrogen was treated as an inert gas, and it was not included in the reaction. The components of all species except nitrogen were calculated. It is noted that the values in Table 2 and Table 3 were estimated via simple algebraic calculations of the chemical reactions in Equations (1)–(3), not via equilibrium calculations. The final thermodynamic conditions were not considered.
Table 2.
Calculation conditions when methane is replaced with hydrogen.
Table 3.
Calculation conditions when methane is progressively replaced with ammonia.
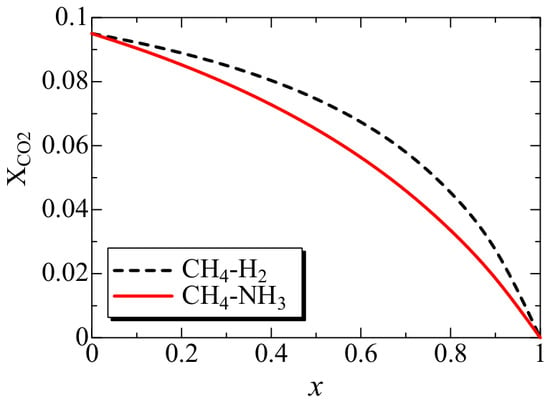
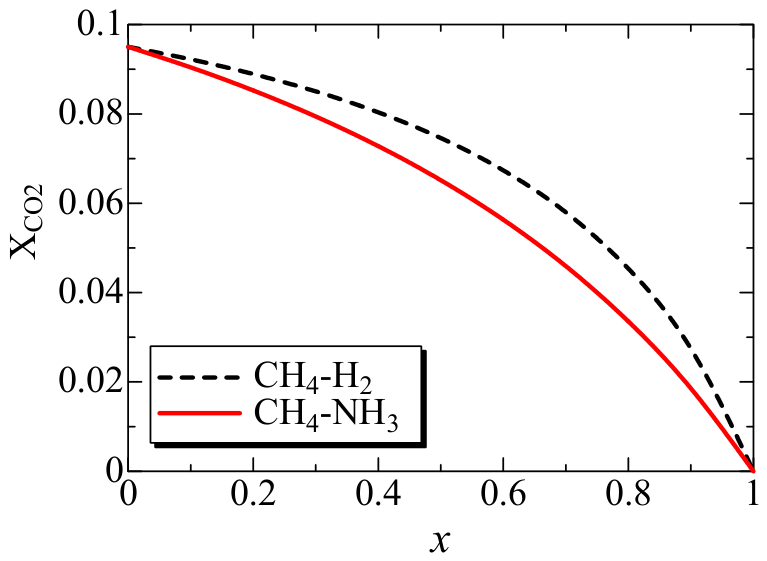
First, the changes in carbon dioxide emissions were examined when a blended fuel was used. Figure 1 shows the molar fraction of carbon dioxide contained in the burned gas. According to the calculations, as the fraction of hydrogen and ammonia in the blended fuel increases, the carbon dioxide emissions decrease monotonically. However, when the fractions of hydrogen and ammonia in the blended fuel are equal, the ammonia-blended case results in lower carbon dioxide emissions. Since 0.5 moles of oxygen are required to completely burn 1 mole of hydrogen and 0.75 moles of ammonia, when the fractions of hydrogen and ammonia in the blended fuel are equal and the total stoichiometric ratio is 1, it is likely that ammonia will require more air. Consequently, the molar fraction of carbon dioxide in the burned gas is smaller.
Figure 1.
Molar fractions of carbon dioxide contained in burned gas, where x is the molar fraction of hydrogen (or ammonia) in the mixed fuel.
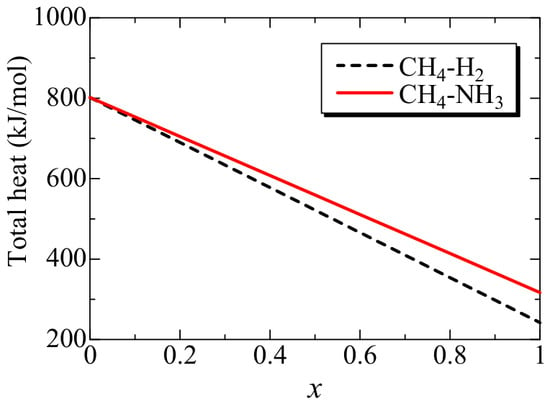
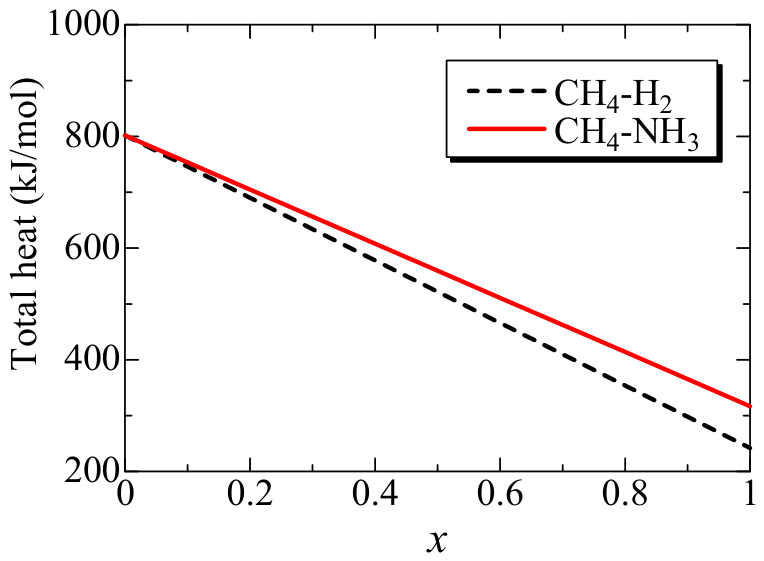
Next, the heat of combustion for the blended fuels under the conditions shown in Figure 1 was calculated. The results are shown in Figure 2. The lower heating values are 802 kJ/mol for methane, 242 kJ/mol for hydrogen, and 316 kJ/mol for ammonia [37]. Based on the molar fractions of the two fuels, the heat of combustion of the mixed fuel was calculated via proportional allocation. Consequently, replacing more methane with hydrogen or ammonia results in a monotonic decrease in the total heat of the blended fuel. Furthermore, the rate of decrease is greater when replacing methane with hydrogen, because the heat of combustion of hydrogen per mole is lower than that of ammonia.
Figure 2.
Heat of combustion for blended fuels under conditions in Figure 1, where x is the molar fraction of hydrogen (or ammonia) in the mixed fuel.
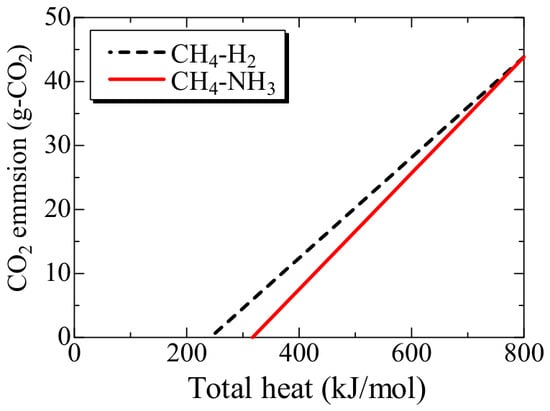
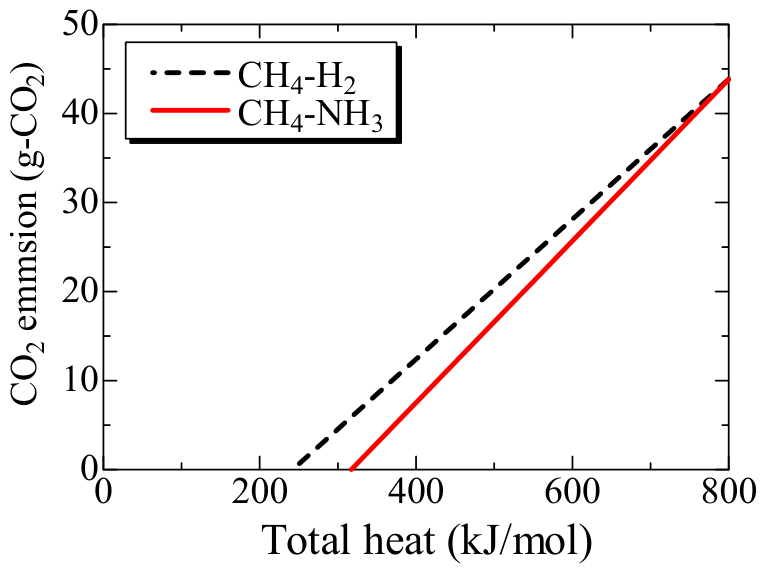
As seen in Figure 1, equal molar fractions of H2 and NH3 do not represent equal energy substitution for methane. Moreover, the CO2 mole fractions in Figure 1 and Table 2 and Table 3 depend on the combustion-air requirements, water production, and total flue-gas volume. Then, the mass of CO2 emissions from 1 mol of the blended fuel in Table 2 and Table 3 was obtained. Figure 3 shows the correlation between the input of total heat and CO2 emissions. As seen in the figure, replacing methane with hydrogen or ammonia reduces the total heat of combustion, and lower CO2 emissions are observed. Furthermore, it is found that, for the same total heat of the blended fuel, ammonia results in lower CO2 emissions than hydrogen.
Figure 3.
Correlation between total heat and mass of CO2 emissions in burned gas.
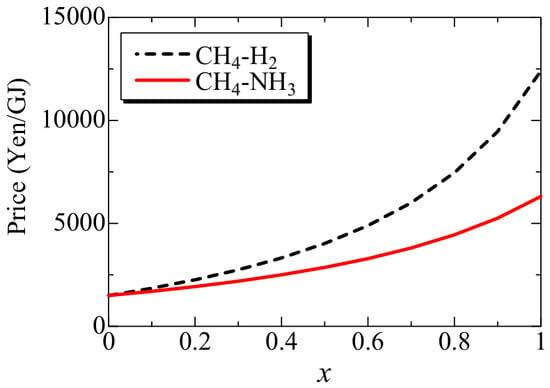
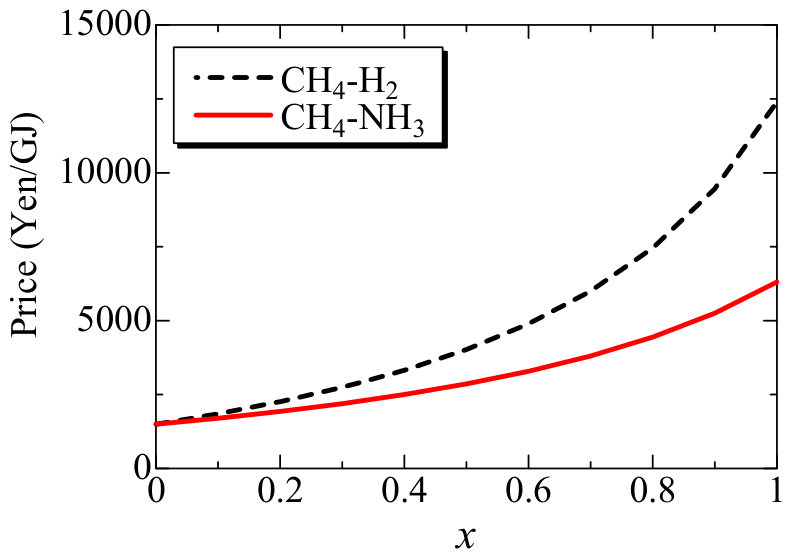
Next, we examined the price of the blended fuel. As the fuel price fluctuates daily, the discussion was based solely on the results obtained using the assumed price in our calculations. In this trial, the price of methane corresponded to Japan’s average LNG import price of $11/MBtu (JPY 85,000/ton) in 2021 [38]. Furthermore, the cost of green hydrogen was calculated to be $10/kg in 2024 [39], while that of green ammonia was calculated to be $800/ton in 2022 [40]. These prices represent typical international transaction prices. Figure 4 shows the price per unit of energy (unit of heat) for the blended fuel. Replacing the methane in the fuel with hydrogen or ammonia was found to cause the price of the blended fuel to rise significantly. Surprisingly, replacing methane with hydrogen roughly doubled the value. It is noted that the prices of hydrogen and ammonia used in the calculations also vary by region due to differences in production costs, and these results represent only one example. The results would differ depending on the specific prices used.
Figure 4.
Price per unit of energy (unit of heat) for blended fuel, where x is the molar fraction of hydrogen (or ammonia) in the mixed fuel.
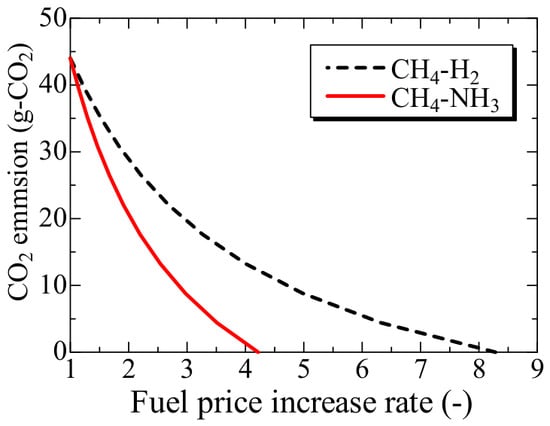
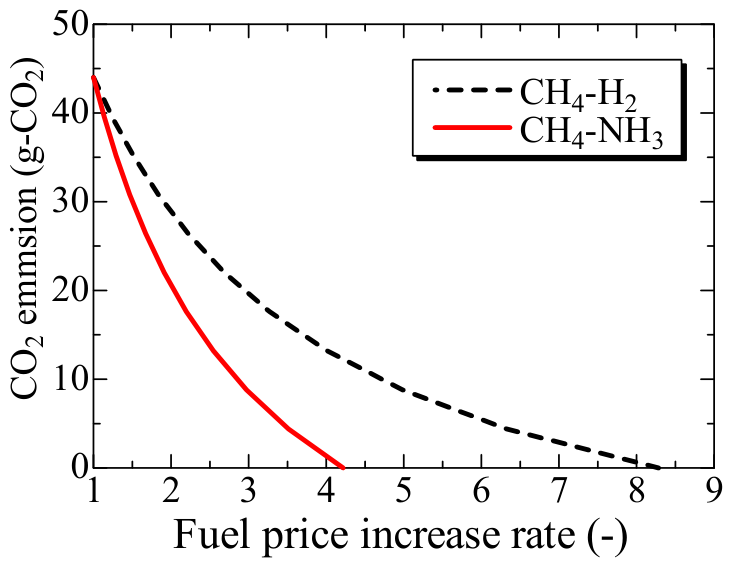
Figure 5 shows the relationship between the rate at which the price of the blended fuel increases relative to the price of methane alone (without substitution by hydrogen or ammonia), which is given on the horizontal axis, and the mass of CO2 emissions. In other words, the fuel increase rate is the value of the mixed fuel price divided by the price of methane. In this figure, the vertical axis is the mass of CO2 emissions from 1 mol of the blended fuel in Table 2 and Table 3. Since it has been established that reducing CO2 emissions is acceptable even if the fuel price is somewhat higher, this figure illustrates the results of investigating the effects of the fuel price on CO2 reduction. Interestingly, although hydrogen is considerably more expensive than ammonia, it does not reduce CO2 emissions to the same extent. By comparing these two results, it is derived that, if the price of green hydrogen falls to around half of its current level, it can be expected to reduce CO2 emissions to a similar extent as ammonia.
Figure 5.
Relationship between fuel price increase rate and mass of CO2 emissions.
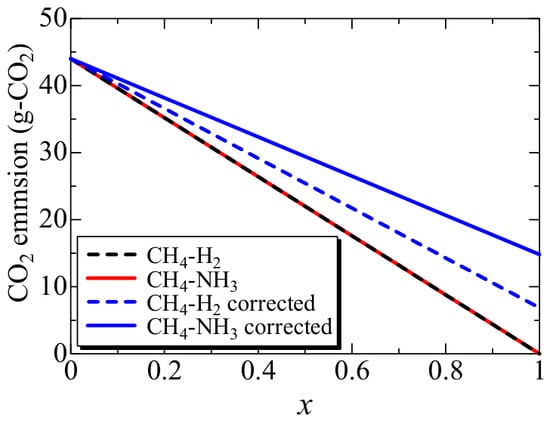
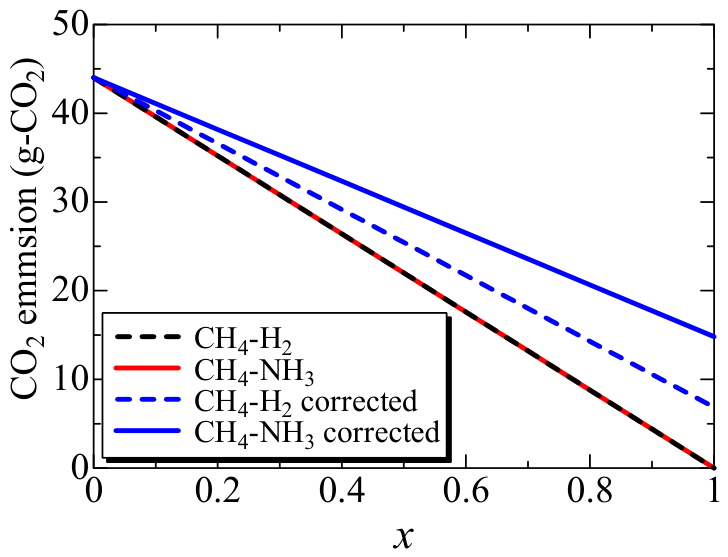
It should be noted that the Hydrogen Society Promotion Act permits CO2 emissions of up to 3.4 kg for every kg of hydrogen produced. Therefore, when methane was substituted with hydrogen, the CO2 emissions were recalculated to take this allowance into account (Figure 6). First, the mass-based CO2 emissions from 1 mol of the blended fuel in Table 2 and Table 3 were calculated. Based on the mass of hydrogen, the amount of carbon dioxide generated during production through 3.4 kg-CO2/kg-H2 was added to the mass of the CO2 emissions. Similarly, the CO2 emissions were adjusted for ammonia production by assuming 0.87 kg of CO2 per kg of ammonia produced. To facilitate a comparison of the results before and after correction, the post-correction results are shown in blue, aligned with the original results converted from Figure 1. For a hydrogen or ammonia blend, at the same total fuel molar input and substitution fraction, both blends contain the same amount of CO2. However, when considering the amount of CO2 during fuel production, the reduction rate is lower when methane is replaced with hydrogen or ammonia. The ammonia blend has a smaller effect regarding the reduction of CO2 emissions. When methane is completely replaced with hydrogen, the CO2 emissions from the fuel production process would still amount to 15% of those from a 100% methane fuel. In contrast, this value rises to 33% for ammonia, indicating that the CO2 reduction effect achieved by blended fuels is smaller than that of hydrogen.
Figure 6.
The corrected CO2 emissions when considering CO2 generated during H2 or NH3 production, where x is the molar fraction of hydrogen (or ammonia) in the mixed fuel. For comparison, the original results converted from Figure 1 are also plotted.
5. Conclusions
Although combustion technology is used in many fields, burning fossil fuels emits carbon dioxide. It is widely recognized that hydrogen and low-carbon fuels derived from renewable energy sources are costly. As the technology to power thermal power plants using 100% hydrogen or ammonia has yet to be developed, it is considered more practical to use these fuels in blends with others. In this paper, the changes in fuel price and calorific value when blending these fuels with methane, the main component of LNG, were examined. In particular, the relationships between these factors and the amount of carbon dioxide emitted during combustion were clarified. Although using a blended fuel can reduce CO2 emissions, it also increases the price and lowers the total heat of combustion, since hydrogen and ammonia have lower heating values than methane. For the same total heat of combustion, ammonia results in lower CO2 emissions than hydrogen. Considering the CO2 emissions permitted by the Hydrogen Society Promotion Act during fuel production, the CO2 reduction rate achieved by the blended fuel was reduced. Conclusively, the CO2 reduction rate of ammonia is lower than that of hydrogen, simply because the allowable CO2 emissions from ammonia production are relatively high.
Funding
No funding was received for conducting this study.
Data Availability Statement
All data used in the calculations are presented in the paper.
Conflicts of Interest
The author declares no conflicts of interest.
References
- Ozawa, A.; Tsani, T.; Kudoh, Y. Japan’s pathways to achieve carbon neutrality by 2050—Scenario analysis using an energy modeling methodology. Renew. Sustain. Energy Rev. 2022, 169, 112943. [Google Scholar] [CrossRef] [Scilit]
- Xu, P.; Adebayo, T.S.; Khan, K.A.; Özkan, O.; Shukurullaevich, N.K. United States’ 2050 carbon neutrality: Myth or reality? Evaluating the impact of high-tech industries and green electricity. J. Clean. Prod. 2024, 440, 140855. [Google Scholar] [CrossRef] [Scilit]
- Nematchoua, M.K.; Rakotomalala, M.S.; Reiter, S. Carbon Neutrality and Resilient Districts, a Common Strategy in European Union Countries in 2050. Atmosphere 2025, 15, 508. [Google Scholar] [CrossRef] [Scilit]
- Turakulov, Z.; Kamolov, A.; Norkobilov, A.; Variny, M.; Díaz-Sainz, G.; Gómez-Coma, L.; Fallanza, M. Assessing various CO2 utilization technologies: A brief comparative review. J. Chem. Technol. Biotechnol. 2024, 99, 1291–1307. [Google Scholar] [CrossRef] [Scilit]
- Koytsoumpa, E.; Bergins, C.; Buddenberg, T.; Wu, S.; Sigurbjörnsson, Ó.; Tran, K.C.; Kakaras, E. The challenge of energy storage in Europa: Focus on power to fuel. J. Energy Resour. Technol. 2016, 138, 2049–2061. [Google Scholar] [CrossRef] [Scilit]
- Wulf, C.; Linßen, J.; Zapp, P. Review of power-to-gas projects in Europe. Energy Procedia 2018, 155, 367–378. [Google Scholar] [CrossRef] [Scilit]
- Moriyama, T.; Kimura, W.; Asai, H.; Yamamoto, K. OH chemiluminescence of methane-hydrogen premixed flames. J. Therm. Sci. Technol. 2021, 16, JTST0032. [Google Scholar] [CrossRef] [Scilit]
- Moriyama, T.; Yamamoto, K. Numerical simulation of methane-hydrogen premixed flames on a Bunsen burner. J. Therm. Sci. Technol. 2022, 17, 22-00129. [Google Scholar] [CrossRef] [Scilit]
- Smallbone, A.; Tsuneyoshi, K.; Kitagawa, T. Turbulent and stable/unstable laminar burning velocity measurements from outwardly propagating spherical hydrogen-air flames at elevated pressures. J. Therm. Sci. Technol. 2006, 1, 31–41. [Google Scholar] [CrossRef] [Scilit][Green Version]
- Nakahara, M.; Shirasuna, T.; Hashimoto, J. Experiment study on local flame properties of hydrogen added hydrocarbon premixed turbulent flames. J. Therm. Sci. Technol. 2009, 4, 190–201. [Google Scholar] [CrossRef] [Scilit]
- Tada, S.; Shimizu, T.; Kameyama, H.; Haneda, T.; Kikuchi, R. Ni/CeO2 catalysts with high CO2 methanation activity and high CH4 selectivity at low temperatures. Int. J. Hydrogen Energy 2012, 37, 5527–5531. [Google Scholar] [CrossRef] [Scilit]
- Gahleitner, G. Hydrogen from renewable electricity an international review of power-to-gas pilot plants for stationary applications. Int. J. Hydrogen Energy 2013, 38, 2039–2061. [Google Scholar] [CrossRef] [Scilit]
- Bailera, M.; Lisbona, P.; Romeo, L.M.; Espatolero, S. Power to gas projects review: Lab, pilot and demo plants for storing renewable energy and CO2. Renew. Sustain. Energy Rev. 2017, 69, 292–312. [Google Scholar] [CrossRef] [Scilit]
- Le, T.A.; Kim, M.S.; Lee, S.H.; Kim, T.W.; Park, E.D. CO and CO2 methanation over supported Ni catalysts. Catal. Today 2017, 293–294, 89–96. [Google Scholar] [CrossRef] [Scilit]
- Inkeri, E.; Tynjälä, T.; Karjunen, H. Significance of methanation reactor dynamics on the annual efficiency of power-to-gas -system. Renew. Energy 2021, 163, 1113–1126. [Google Scholar] [CrossRef] [Scilit]
- Yamamoto, K.; Sakaguchi, K. Hydrogen reactivity factor and effects of oxygen on methane conversion rate by chemical equilibrium calculation. Int. J. Thermofluids 2022, 15, 100186. [Google Scholar] [CrossRef] [Scilit]
- Yamamoto, K.; Sakaguchi, K. 1D Modeling of methanation reactor with circulation (MeRCi) for assessment of reaction characteristics. Int. J. Thermofluids 2023, 20, 100513. [Google Scholar] [CrossRef] [Scilit]
- Yamamoto, K.; Nakayama, R. Investigation of alternative substances for replacing hydrogen in methanation. Energies 2024, 17, 3690. [Google Scholar] [CrossRef] [Scilit]
- Yamamoto, K.; Matsuura, T. New Methanation reactor by reciprocating engine (MeRE). New Energy Exploit. Appl. 2024, 3, 292–300. [Google Scholar] [CrossRef] [Scilit]
- Nisbet, T.M.; Made, A.W. Direct air capture of CO2: An industrial perspective. Curr. Opin. Chem. Eng. 2025, 50, 101190. [Google Scholar] [CrossRef] [Scilit]
- Yamamoto, K. Proposal for ZERO system combining water electrolysis, methanation and thermal power generation. In Proceedings of the 17th International Conference on Thermal Engineering: Theory and Applications, Valetta, Malta, 22–24 June 2026. [Google Scholar]
- Oka, K.; Mizutani, W.; Ashina, S. Climate change impacts on potential solar energy production: A study case in Fukushima, Japan. Renew. Energy 2022, 153, 249–260. [Google Scholar]
- Quirion, P. Complying with the Kyoto Protocol under uncertainty: Taxes or tradable permits? Energy Policy 2010, 38, 5166–5173. [Google Scholar] [CrossRef] [Scilit]
- Salman, M.; Long, X.; Wang, G.; Zha, D. Paris climate agreement and global environmental efficiency: New evidence from fuzzy regression discontinuity design. Energy Policy 2022, 168, 113128. [Google Scholar] [CrossRef] [Scilit]
- Frazer, E.; Cao, T.; Sugiyama, M.; Shiraki, H.; Fujimori, S.; Wada, K.; Hamasaki, H.; Kato, E.; Matsuo, Y.; Nishiura, O.; et al. JMIP 2 part 2: Technology sensitivities in Japan’s power sector decarbonization. Energy Clim. Change 2026, 7, 100244. [Google Scholar] [CrossRef] [Scilit]
- Ghorbani, B.; Zendehboudi, S.; Bagheri, M.; Elkamel, A.; Chatzis, I. Hydrogen economy in East Asia: National roadmaps and opportunities for strategic collaboration with Canada. Ind. Eng. Chem. Res. 2026, 65, 8496–8576. [Google Scholar] [CrossRef] [Scilit]
- Vijayakumar, V.; Fulton, L.; Shams, M.; Sperling, D. Creating a Global Hydrogen Economy: Review of International Strategies, Targets, and Policies with a Focus on Japan, Germany, South Korea, and California; UC Davis Research Reports 2022, UCD-ITS-RR-22-100; The Regents of the University of California: Oakland, CA, USA, 2022. [Google Scholar] [CrossRef]
- Bube, S.; Lange, K.; Ruiz, D.G.; Schindler, S.; Plaisir, M.; Kaltschmitt, M.; Bard, J.; Ilse, K. Sustainability regulations for PtX projects: Scope and impact analysis. Joule 2025, 9, 101966. [Google Scholar] [CrossRef] [Scilit]
- Singh, S.; Jain, S.; Venkateswaran, P.S.; Tiwari, A.K.; Nouni, M.R.; Pandey, J.K.; Goel, S. Hydrogen: A sustainable fuel for future of the transport sector. Renew. Sustain. Energy Rev. 2015, 51, 623–633. [Google Scholar] [CrossRef] [Scilit]
- Palecka, J.; Julien, P.; Goroshin, S.; Bergthorson, J.M.; Frost, D.L.; Higgins, A.J. Quenching distance of flames in hybrid methane–aluminum mixtures. Proc. Combust. Inst. 2015, 35, 2463–2470. [Google Scholar] [CrossRef] [Scilit]
- Zhang, T.; Uratani, J.; Huang, Y.; Xu, L.; Griffiths, S.; Ding, Y. Hydrogen liquefaction and storage: Recent progress and perspectives. Renew. Sustain. Energy Rev. 2023, 176, 113204. [Google Scholar] [CrossRef] [Scilit]
- Isaac, T. HyDeploy: The UK’s first hydrogen blending deployment project. Clean Energy 2019, 3, 114–125. [Google Scholar] [CrossRef] [Scilit]
- Cristello, J.B.; Yang, J.M.; Hugo, R.; Lee, Y.; Park, S.S. Feasibility analysis of blending hydrogen into natural gas networks. Int. J. Hydrogen Energy 2023, 48, 17605–17629. [Google Scholar] [CrossRef] [Scilit]
- Faghih, M.; Valera-Medina, A.; Chen, Z.; Paykani, A. Effect of radiation on laminar flame speed determination in spherically propagating NH3-air, NH3/CH4-air and NH3/H2-air flames at normal temperature and pressure. Combust. Flame 2023, 257, 113030. [Google Scholar] [CrossRef] [Scilit]
- Howarth, R.W. The greenhouse gas footprint of liquefied natural gas (LNG) exported from the United States. Energy Sci. Eng. 2024, 12, 4843–4859. [Google Scholar] [CrossRef] [Scilit]
- Yang, M.; Bahetnur, A.; Mutailipu, M.; Liu, R.; Sun, H. Carbon dioxide liquefaction and transport optimization for marine carbon sequestration: A comprehensive review. Renew. Sustain. Energy Rev. 2026, 235, 116945. [Google Scholar] [CrossRef] [Scilit]
- Gordon, S.; McBride, B.J. Computer Program for Calculation of Complex Chemical Equilibrium Composition and Application, Part I Analysis. NASA Reference Publication 1311. Version CEARUN Rev4. 1994; pp. 1–58. Available online: https://cearun.grc.nasa.gov/intro.html (accessed on 25 February 2026).
- Halser, C.; Paraschiv, F.; Russo, M. Oil–gas price relationships on three continents: Disruptions and equilibria. J. Commod. Mark. 2023, 31, 100347. [Google Scholar] [CrossRef] [Scilit]
- Mensah, G.; Opoku, R.; Davis, F.; Obeng, G.Y. Techno-economic analysis of green hydrogen production and electric vehicle charging using redundant energy on a solar photovoltaic mini-grid. Clean. Energy Syst. 2024, 9, 100165. [Google Scholar] [CrossRef] [Scilit]
- Mitrai, I.; Palys, M.J.; Daoutidis, P. A multistage stochastic programming approach for renewable ammonia supply chain network design. Comput. Chem. Eng. 2026, 205, 109443. [Google Scholar] [CrossRef] [Scilit]

Disclaimer/Publisher’s Note: The statements, opinions and data contained in all publications are solely those of the individual author(s) and contributor(s) and not of MDPI and/or the editor(s). MDPI and/or the editor(s) disclaim responsibility for any injury to people or property resulting from any ideas, methods, instructions or products referred to in the content. |
© 2026 by the author. Licensee MDPI, Basel, Switzerland. This article is an open access article distributed under the terms and conditions of the Creative Commons Attribution (CC BY) license.