Abstract
The Hybrid Barjeel of the ORA House, designed for the Solar Decathlon Middle East 2018 in Dubai, is a contemporary reinterpretation of the traditional windcatcher—Barjeel, integrating vernacular cooling principles with modern mechanical systems to enable passive precooling of intake air in hot, arid climates. This study aims to evaluate the thermal performance of several horizontal windcatcher configurations developed during the ORA House design process and compare them with the conventional vertical windcatcher typology. Numerical simulations were performed using Computational Fluid Dynamics to analyse airflow behaviour and thermal characteristics—factors that directly influence cooling loads and indoor air quality, and ultimately contribute to carbon savings and cost efficiency. The results show that the horizontally integrated windcatcher effectively reduces the temperature of the supply air, demonstrating its viability as a passive precooling strategy; however, the performance improvement relative to the vertical configuration is modest. Overall, the findings suggest that horizontal windcatcher designs offer an architecturally flexible alternative for contemporary residential buildings, enabling better morphological integration without compromising functional potential.
1. Introduction
Traditional windcatchers, locally known in the United Arab Emirates as Barjeel, have been part of Middle Eastern architecture for over a millennium. They function as ingenious passive cooling and ventilation devices that utilise pressure differentials to induce natural airflow from prevailing winds through the building’s internal spaces [1,2,3]. Barjeels represent one of humanity’s earliest examples of a sustainable, climate-adaptive design, demonstrating an understanding of thermal comfort and fluid dynamics principles long before the emergence of modern engineering [3] (Figure 1). Empirical evidence from case studies such as the Mortaz house in Yazd, Iran, showed that these windcatchers have historically provided effective temperature reductions—in this instance, a 0.5–4.5 degrees Celsius reduction range—compared to the ambient air temperature, highlighting the potential to ventilate passively and cool spaces without external energy inputs [4].
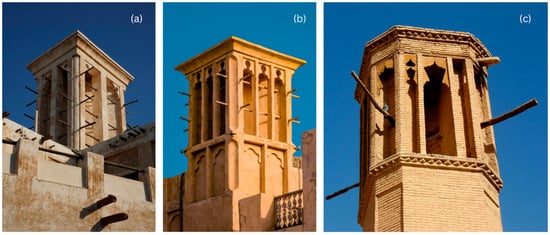
Figure 1.
Images of traditional windcatchers in the Middle East: (a) Doha, Qatar—Image credit: Cansu Hangül, (b) Bastakiya District, Dubai, UAE—Image credit: Chinar Minar, (c) Iran—Image credit: AmirHadi Manavi.
The significance of such natural ventilation and passive cooling strategies becomes especially evident when examining global energy consumption patterns and their environmental implications. The building sector accounts for a large share of primary energy consumption in most countries. According to the UN Environment Programme (UNEP) and the Global Alliance for Buildings and Construction (GlobalABC), the building sector consumed 32% of global final energy in 2023 [5]. Furthermore, within the HVAC sector, rising standards for indoor environmental quality have driven increased energy consumption due to higher demand [6]. Therefore, any innovative concept or technology that reduces a building’s power consumption will yield demonstrable benefits for overall building energy performance [7]. Windcatchers offer a distinct advantage as completely carbon-neutral passive cooling systems that require no electrical input. Past research has demonstrated that wind-driven mechanisms are the primary force in windcatcher operation, delivering 76% greater indoor ventilation than buoyancy-driven systems alone [8].
Despite their proven energy-saving potential and historical effectiveness, windcatchers in contemporary Middle Eastern architecture have undergone a transformation in purpose and application. Windcatchers are still incorporated into the design of some modern UAE houses; however, they are mainly used for decorative and cultural symbolism, mimicking traditional Emirati architecture rather than serving as the primary ventilation system [1,2]. This shift in windcatcher usage is primarily due to the widespread use of mechanical air-conditioning and ventilation systems, which are more efficient in meeting ventilation and cooling demands. Furthermore, the efficiency of a windcatcher’s natural ventilation and passive cooling depends mainly on its structural design and the ambient macroclimate. However, the cooling capabilities of windcatchers, based solely on structural design, are inadequate [9,10,11,12,13]. Given this, it is crucial to cool the air passing through the windcatcher to improve thermal comfort and reduce the building’s heat load, especially during the summer months. In previous studies, evaporative cooling devices were fitted with wind-tower systems to enhance passive cooling performance [9,10,11,12,13]. The warm air passes through the devices, which cool it before it enters internal spaces. However, studies have shown that integrating these cooling devices has restricted airflow within the tower and decreased overall system efficiency [9,12]. This approach necessitates constructing taller towers to allow sufficient contact time between the cooling devices and the airflow. Even without cooling devices, studies show that windcatchers are more efficient at taller heights (6–9 m) and slower wind speeds [14]. The need for tall towers to achieve efficiency makes implementing windcatchers difficult in modern developments due to height restrictions and spatial constraints.
These challenges have raised the question of whether alternative geometrical configurations of the traditional vertical windcatcher can be developed and adapted for contemporary residential houses, thereby reducing energy use for cooling and ventilation while overcoming the spatial limitations of the conventional form.
1.1. Hybrid Barjeel of ORA House
ORA house is a net-zero residential project designed and built by a multidisciplinary team of students and faculty from Heriot-Watt University for the first-ever Solar Decathlon Middle East 2018 (SDME), held in Dubai, United Arab Emirates (UAE) (Figure 2). The international student design competition was organised by the Dubai Electricity and Water Authority (DEWA) of the UAE in collaboration with the Department of Energy, United States of America.
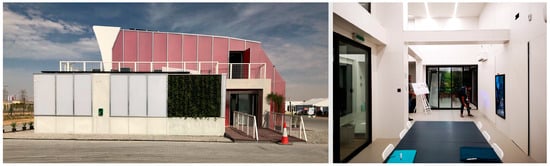
Figure 2.
ORA House, SDME 2018. Image Credit: Shreya Sathyanadhan.
One of the novel design strategies for the 100 sqm single-storey residential house designed for a single family unit for the hot-arid climate region is the ecosystemic approach, which is embedded in its name ORA, an acronym of ‘Organic’, ‘Resilient’ and ‘Adaptive’ [15]. Each of which is an independent ecology with a symbiotic relationship with the others. The ‘Organic’ ecology comprises all passive design strategies; ‘Resilient’ ecosystems represent the active technical equipment; and ‘Adaptive’ ecology defines the behaviour of the house that responds to various agencies to which it is susceptible, including climate, users, and functional requirements.
The windcatcher in the ORA House—The Hybrid Barjeel, as designated by the ORA project team, is an adaptation of the traditional vertical windcatchers from desert architecture. The design of this horizontally integrated windcatcher follows an ecosystemic approach, in which the organic and resilient ecosystems of the ORA House work together to improve the energy efficiency of the house’s cooling system. With the aid of passive landscape design, the prevailing hot air from the north-west or south-west channels flows into the west-facing Hybrid Barjeel, positioned at a height of 7 m. The landscape design comprising resilient ghaf and olive trees facilitates dust filtration and initial passive cooling of the incident wind. The dust filter installed at the mouth of the Hybrid Barjeel provides an additional sand trap during sandstorms. The horizontal air shaft of the windcatcher has a tapered geometry, designed to have a funnelling effect and increase the incident air velocity. The air channel is then routed through a chamber containing a Phase-Change Material (PCM) that absorbs latent heat, thereby further cooling the air (Figure 3 and Figure 4). The air then discharges into a non-air-conditioned vestibule (Figure 5) via a hydroponic green wall with NASA-grade plants that help remove carbon dioxide and other toxins. The passively pre-cooled air at the end is then supplied into an Energy Recovery Ventilation (ERV) system, which further improves energy efficiency and, overall, lowers the house’s net cooling load throughout the year.
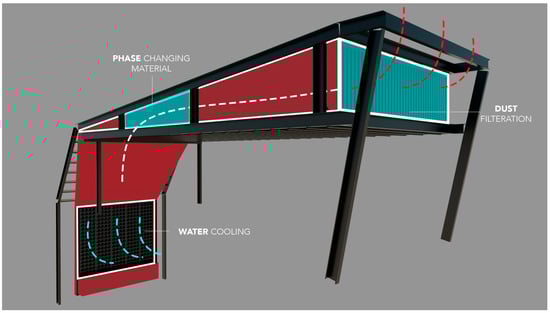
Figure 3.
Hybrid Barjeel, ORA House 2018. Source [15].
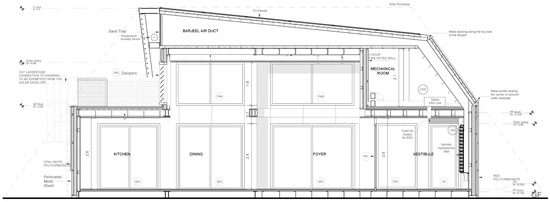
Figure 4.
Longitudinal section from the Solar Decathlon Middle East 2018 competition submission by Team ORA (Authors 1 and 2 were members of this team).
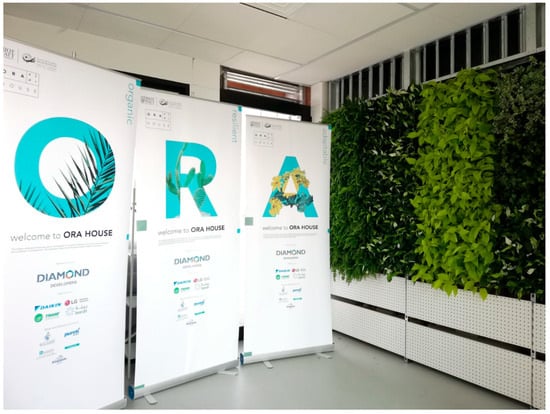
Figure 5.
Vestibule Zone, ORA House 2018. Image Credit: Shreya Sathyanadhan.
1.2. Research Aims and Objectives
The primary aim of this study is to explore the feasibility of transforming traditional vertical windcatcher systems into horizontal configurations, thereby expanding the architectural possibilities for integrating passive windcatchers into contemporary building designs. Historically, Barjeels were typically elevated to heights of 7–10 m, corresponding to the one- or two-storey structures of traditional Gulf architecture [1,16]. In contrast, contemporary two-storey buildings commonly reach approximately 9 m, creating favourable conditions for embedding horizontally oriented windcatcher systems within current height constraints.
To establish a baseline for comparison, this study first seeks to characterise the performance of the traditional vertical windcatcher using CFD modelling. The benchmark will serve as a reference point for evaluating alternative, horizontally configured systems. Building on this foundation, the research will develop and assess four horizontal windcatcher typologies: Horizontal, Horizontal—Tapered, Horizontal—Integrated, and Hybrid Barjeel (ORA House).
The objectives of this research study are:
- Determine the airflow performance for the defined horizontal windcatcher configurations in comparison to the traditional vertical windcatcher using air velocity and airflow distribution matrices.
- Determine the thermal performance of all windcatcher models examined in this study and identify the optimum horizontal configuration suitable for integration into contemporary residential architecture.
1.3. Research Methodology
The research employed a CFD-based numerical study to compare airflow and thermal performance between the traditional vertical windcatcher and several configurations within a horizontal typology. After defining the research problem and reviewing existing windcatcher studies, 3D geometric models were developed and meshed with grid-independence validation to ensure numerical accuracy. Simulations were executed in ANSYS Fluent 2025-R2 using RANS equations with the Realisable k–ε model and UAE-based environment conditions. Post-processing focused on extracting airflow patterns, velocity fields, and temperature distributions, enabling comparison of ventilation effectiveness and energy-saving potential. The results informed design implications for integrating improved windcatcher systems into contemporary residential buildings. Figure 6 provides a detailed workflow of the research methodology employed in this study.
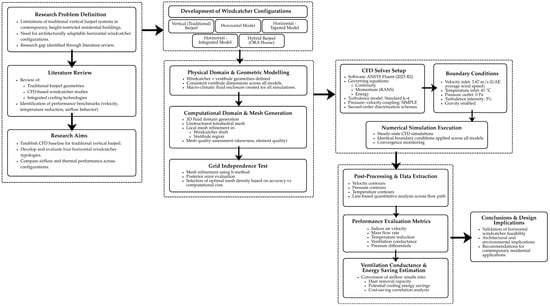
Figure 6.
Research methodology flowchart.
2. Review of Related Literature
This section conducts a systematic review of the previous literature on traditional windcatcher configurations, including the impact of structural geometry.
2.1. Geometry and Opening Configurations
The optimisation of windcatcher system performance in hot, arid climates, such as those in the Middle East, has been extensively researched [3,13]. Research has focused on determining the influence of tower height, opening size, and the effect of internal partitions on both airflow and thermal comfort indoors [4,17,18,19,20]. CFD and field validation studies have revealed the performance capabilities of these vernacular systems, established benchmarks and starting points for optimisation efforts.
Recent CFD-based studies highlight that well-optimised blade arrangements, such as plus-blade configurations, and the optimisation of the ratio between inlet to outlet areas can enhance airflow velocity and improve the efficacy of passive cooling [18,21]. Other studies confirm that increasing windcatcher height increases passive cooling efficacy only up to a certain height (6 m). It was found that increasing the height further does not provide additional passive cooling benefits while reducing ventilation performance due to flow dissipation [14,22].
Alhraki and Qurraie [23] conducted a comprehensive CFD-based performance investigation of windcatchers installed in a mosque in Nizwa, Oman, assessing variations in geometry and internal partitioning strategies (e.g., X-blades, +-blades, H-blades). Their findings demonstrated that a square windcatcher fitted with an X+ hybrid partition yielded a 51.9% improvement in indoor ventilation rate, raising indoor velocities from 0.33 m/s to 0.69 m/s. The study reinforces the importance of internal aerodynamic optimisation and further validates the influence of inlet segmentation on flow stabilisation and air-supply performance in hot-arid environments.
Despite the breadth of geometric research, critical gaps persist. Most comparative studies, whether experimental, field, or simulation-based, remain focused on traditional vertical windcatcher systems. Studies and evaluations of horizontal or hybrid configurations relevant to contemporary, space-constrained Middle Eastern architecture are scarce.
2.2. Numerical Studies
Numerical studies on windcatchers use CFD to resolve wind-driven air velocity, temperature, and pressure from the exterior flow, through the tower, into the attached room. CFD has become standard for windcatcher analysis, employing three-dimensional steady RANS simulations with standard k-epsilon and Realisable k-epsilon turbulence models. Various numerical studies from Calautit et al. [9,10,24] and Montazeri et al. [21] have used CFD to quantify induced flow rate, indoor air speeds, and recirculation zones, and validate the results against wind-tunnel or full-scale measurements of velocity, with typical validation studies achieving 7–10% deviations.
Field-based numerical work on traditional Barjeels has also been conducted, focusing primarily on Iranian courtyard houses in Yazd, where long-term monitoring data are available. Subsequent studies conducted by Hedayat et al. [4,25] recorded a full year of wind and shaft velocity data of a representative four-sided windcatcher in Yazd via outdoor and indoor sensors. The data were then used to validate their OpenFOAM RANS-based CFD simulations of the building-tower system, studying how tower geometry and prevailing wind directions influence ventilation performance under real climatic conditions.
Qadourah [26] explored the practicality of applying windcatchers within multi-storey buildings in Egypt, addressing a significant gap in the literature where most prior studies focus solely on low-rise structures. Using a validated 3D CFD model in DesignBuilder, the study compared scenarios with no windcatcher, one windcatcher, and dual opposed windcatchers. The results indicated that windcatchers can meaningfully enhance ventilation in high-rise typologies, improving both air-velocity distribution and thermal-comfort compliance (ASHRAE-55 [27]). The study highlights the applicability of windcatcher systems beyond traditional settings and demonstrates their potential for vertical urban development.
Hosseini et al. [28] examined the thermal performance of a two-sided windcatcher integrated with an evaporative cooling module, modelled using Eulerian–Lagrangian multiphase CFD. Their simulations revealed cooling potentials of 5–10 K, depending on outdoor air velocity and temperature, with improved cooling observed at lower ambient wind speeds. This study confirms that evaporative augmentation can substantially enhance supply air temperatures in windcatcher systems while acknowledging the trade-off of increased moisture content, a key consideration for hot-arid applications where humidity loads must be carefully managed.
Having thoroughly examined the fundamental geometric optimisation of windcatchers, a growing body of research now addresses the integration of advanced technologies to further improve passive cooling performance. One such technology gaining increasing attention in recent years is the application of Heat Transfer Devices (HTD) in the form of heat pipes and cooling coils. Studies by Calautit and Hughes [12] and Calautit et al. [24] demonstrated that incorporating HTDs within vertical and horizontal windcatcher shafts can reduce supply air temperatures by up to 15 K compared to conventional windcatcher designs, but can reduce airflow by up to 20–35%. More importantly, the effectiveness of HTDs was largely independent of tower height, enabling their application in modern or non-vertical configurations. Additionally, PCMs, an energy storage mechanism, represent another innovative adaptation of the traditional windcatcher, while conceptual projects such as the ORA House Concept in Dubai [15] demonstrate the potential to integrate PCMs into the windcatcher structure to mitigate peak thermal loads and extend cooling benefits. Further testing and simulations are needed to determine their actual efficiency and performance under real operational conditions.
2.3. Contemporary Adaptations of Windcatcher in Residential Architecture (Design)
Contemporary architectural practice has witnessed a notable revival of windcatcher design principles, reflecting two motivations: cultural heritage preservation and recognition of the potential for energy efficiency. Masdar City in Abu Dhabi represents the most prominent documented contemporary application, incorporating a 45-m-tall windcatcher as a public space feature with automated sensor-operated louvres, polytetrafluoroethylene membranes, mist generators, and LED energy-status feedback (Figure 7). However, Hassan et al. [29] emphasised that actual performance data and long-term thermal effectiveness remain undocumented in published and peer-reviewed sources, limiting their value as a quantitative benchmark for design in residential contexts. Nevertheless, the research illustrates how the traditional Barjeel has been reinterpreted technologically rather than simply replicated as a static historical form.
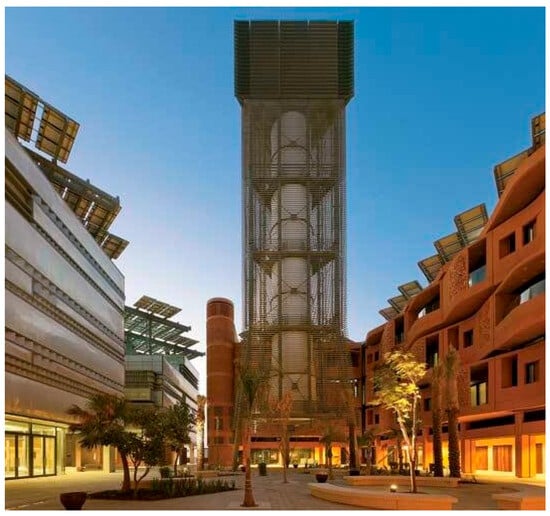
Figure 7.
Windcatcher at Masdar City, Abu Dhabi, UAE. Licensed by CC BY-NC-SA 2.0.
Beyond residential applications, Habibeh Madjdabbadi’s Museum for Modern Arab Art proposal in the UAE integrates seven rooftop Barjeel-like towers that serve as both cultural signifiers and natural-ventilation chimneys for the exhibition areas, demonstrating how windcatcher forms are being re-engineered. However, there remains a notable gap in the documentation of fully built contemporary housing in which a Barjeel-type windcatcher is used to passively cool and ventilate the space.
Despite extensive literature on advancements in windcatchers, much of the research on geometrical or technological integration remains focused solely on traditional, vertical wind-tower layouts. Moreover, there is a lack of quantified understanding of how modified windcatcher geometries or integrated cooling technologies influence the balance between airflow performance and passive cooling effectiveness in hot-arid climates. This gap limits the development of modern windcatcher systems suitable for space-constrained, energy-efficient, hot-arid urban contexts. Table 1 summarises prior research studies done within hot-arid climate conditions, clarifying the objectives, methods employed, and key results that provide context for the aforementioned research gaps.

Table 1.
Summary of the objectives, methods applied and key results in the previous literature.
3. Numerical Methodology
3.1. Base Vertical Windcatcher Model Design
The physical domain for the base vertical windcatcher model is determined in comparison to historical references [3,13] and in accordance with prior research and CFD studies of four-sided wind towers used for room-scale natural ventilation in hot, arid climates. Previous work typically employed cross-sections of about 1.0–1.5 m and heights between 6 and 10 m coupled to single test rooms/vestibules of roughly 5–6 m span and 3 m height, while the wind inlet opening is found to be within the range of 0.5 m to 1.5 m [9,14,22].
The base vertical windcatcher defined for the numerical study, Model 1, has a windcatcher measuring 2.1 × 2.1 × 10 m and a connected vestibule measuring 6.0 × 4.0 × 3.5 m. The wind inlet opening on the windcatcher is at 1.5 m × 1.5 m. The windcatcher is internally divided into four partitions with an X-blade arrangement, providing omnidirectional wind capture for improved indoor ventilation rate and velocity [23]. The inlet opening into the ventilated room, and the outlet from it, both measure 1.5 m in width and 0.7 m in height (Figure 8).
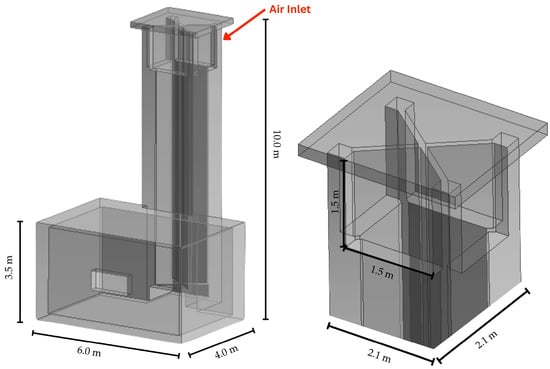
Figure 8.
Physical domain for Model 1—Vertical Windcatcher Geometry.
3.2. Horizontal Windcatcher Typologies Undertaken for the Numeric Study
The configuration of the horizontal windcatcher typologies assumes that the inlet face is aligned with the prevailing wind direction and that the channel height is limited to a single storey for the present analysis, even though contemporary residential buildings are typically two storeys in height and could accommodate a taller device in practice. For consistency with the vertical model, the horizontal section length is kept at 10 m, and the vestibule geometry is maintained at 6.0 × 4.0 × 3.5 m across all four horizontal models, so that changes in performance can be attributed to the variations in windcatcher typology rather than differences in room size. The dimensions of the inlet and outlet in the vestibule are also maintained at 1.5 m in width and 0.7 m in height. These assumptions provide a common reference case for comparing the alternative horizontal windcatcher arrangements introduced in the subsequent subsections.
3.2.1. Horizontal Model
The horizontal windcatcher, Model 2, consists of a wind channel, also 2.1 × 2.1 × 10 m in dimension, and a connected vestibule/room that is 6.0 × 4.0 × 3.5 m in dimension (Figure 9). The size of the windcatcher opening is 1.5 × 1.5 m. Unlike the vertical model, the horizontal configuration has no partitions. In the horizontal model, airflow descends via a vertical shaft and enters the vestibule from the bottom of the space. The window is located across from the supply outlet.
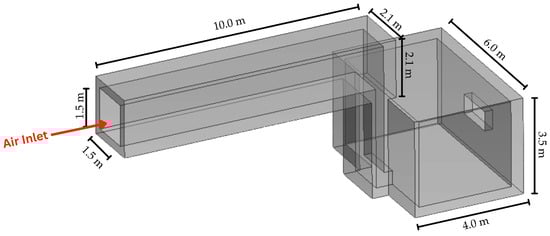
Figure 9.
Physical domain for Model 2—Horizontal Model.
3.2.2. Horizontal Tapered Model
The horizontally tapered windcatcher, Model 3, consists of a 10 m long wind channel with a 2.1 × 2.1 m opening that tapers to 2.1 × 1.1 m as it connects to the vestibule (Figure 10). Similar to the Model 2, the horizontal tapered windcatcher does not have any partitions, and airflow descends a vertical shaft and enters the vestibule from the bottom of the space with a window situated across from the supply outlet (Figure 10).
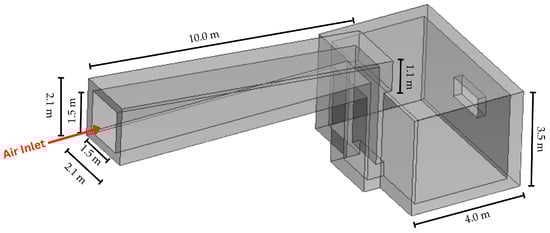
Figure 10.
Physical domain for Model 3—Horizontal Tapered Model.
3.2.3. Integrated Model
The integrated windcatcher, Model 4, is an adaptation of the horizontal tapered design, aimed at optimising the architectural volume (Figure 11). The horizontal wind channel retains the same geometric configuration as the previous model; however, in this version, air enters the vestibule through an opening introduced in its ceiling. The size of this opening matches that of the vertical shaft opening in Models 2 and 3. Similar to the earlier horizontal configuration, the wind channel remains partition-free and maintains the same window outlet.
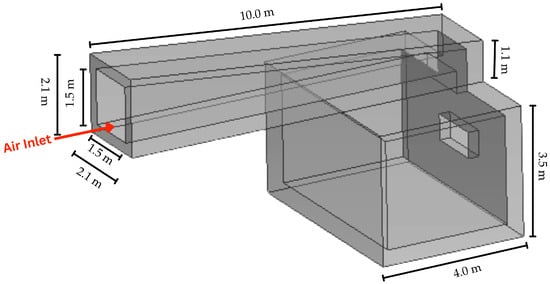
Figure 11.
Physical domain for Model 4—Integrated Model.
3.2.4. Hybrid Barjeel (ORA House)
The Hybrid Barjeel of the ORA House, Model 5, preserves the optimised architectural configuration while reintroducing the vertical shaft on the opposite side compared to Model 3, allowing air to enter the vestibule (Figure 12). Two outlet windows are positioned on adjacent walls of the vestibule. For consistency, the dimensions of the wind channel and the openings remain the same as in the previous models.
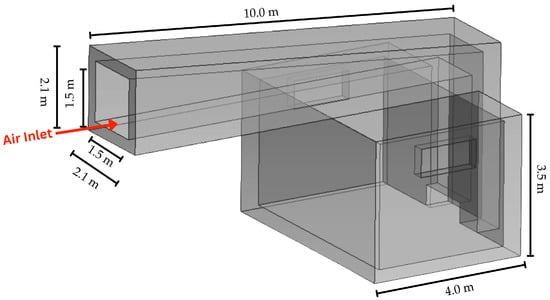
Figure 12.
Physical domain for Model 5—Hybrid Barjeel.
3.3. Computational Fluid Dynamics Method
The CFD workflow follows a structured process that includes geometry creation, mesh generation, solver setup, CFD solution simulation, and result post-processing and extraction. The three-dimensional Reynolds-Averaged Navier–Stokes (RANS) equations, along with the momentum, continuity, and energy equations, were solved using the commercial CFD code to simulate the velocity and pressure fields. The model employs the control-volume technique and the Semi-Implicit Method for Pressure-Linked Equations (SIMPLE) velocity-pressure coupling algorithm with the second-order upwind discretisation. The current study utilised ANSYS Workbench 2025-R2 and used FLUENT 2025-R2 for the investigation. The ANSYS software is a reliable numerical method, applied extensively in the literature [10,11,12,13] to solve for air flow in and around buildings, including windcatchers, and in simulations on velocity, pressure and temperature formations, thereby implying its rationale for use in the current work.
3.3.1. Governing Equations
The main governing equations for fluid flow in ANSYS Fluent 2025 R2 involve the solver accounting for continuity (mass conservation), momentum (Navier–Stokes) and the energy equations. For this study, the standard k-e transport model, which is frequently used for incompressible flows, was used to define the turbulence kinetic energy and flow dissipation rate within the model. The turbulence kinetic energy, , and its rate of dissipation, , were obtained from the following transport equations formulated in Equations (1) and (2),
where represents the generation of turbulence kinetic energy due to the mean velocity gradients, represents the generation of turbulence kinetic energy due to buoyancy, and represents the contribution of fluctuating dilatation in compressible turbulence to the overall dissipation rate. are constants, and are the turbulent Prandtl numbers for and , and and are the user-defined source terms.
Using the energy balance equation for radiative heat transfer (Equation (3)) and assuming a steady-state condition (no heat storage), the surface temperature, , on the windcatcher outer wall was estimated by balancing the incoming and outgoing energy,
where is the solar irradiance (W/m2), is the surface absorptivity, is the emissivity, is the Stefan-Boltzmann constant (5.67 × 10⁻⁸ W/m2K4), and is the surface temperature.
Based on a typical solar irradiance in the UAE of 800 W/m2, and assuming typical values for concrete:
Absorptivity (): 0.6, Emissivity (): 0.9, and the estimated surface temperature of concrete is: ≈311.43 K ≈ 38.28 °C
The heat transfer equation (Equation (4)) is fundamental in understanding how energy transfer occurs in thermodynamic processes, and can also be applied to ventilation. It relates heat (), mass (), and specific heat capacity () to the change in temperature () of a substance, where represents the amount of thermal energy absorbed or released, is the mass of the substance, measured in kilograms (kg), is the specific heat capacity, indicating how much heat is required to raise the temperature of a unit mass of the substance by 1 °C or 1 K, and is the change in temperature, calculated as the final temperature minus the initial temperature.
3.3.2. Computational Domain
The simulations comprise five windcatcher configuration models: Vertical Windcatcher (traditional), Horizontal, Horizontal Tapered, Integrated, and Hybrid Barjeel. A fluid enclosure was also created surrounding the windcatcher structure to simulate the macroclimate and extract more accurate results. Figure 13 shows the dimensions of the enclosure used in all five simulations.
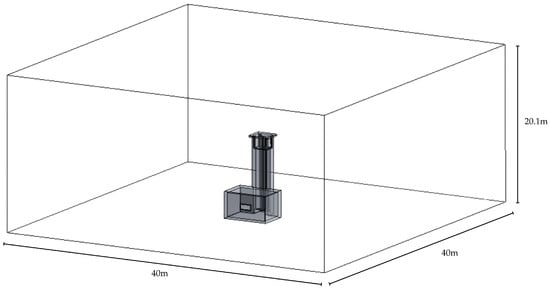
Figure 13.
Fluid enclosure dimensions.
3.3.3. Mesh Design
A non-uniform, unstructured tetrahedral mesh was generated for each of the five windcatcher configurations. Automatic inflation and adaptive sizing were not applied to any of the models. Instead, the mesh was refined manually by selecting the windcatcher structure and inflating it through the smooth-transition option. A global element size of 1.0 m was initially assigned, but because the capture curvature setting was enabled, the mesh became non-uniform, with smaller elements along edges and on detailed surfaces. The mesh defeaturing setting also reduced the number of small elements that would not significantly influence the results, thereby reducing the total number of elements.
As evident from Table 2 below, the mesh shows a variation of element sizes throughout. Finer elements are more concentrated around the windcatcher and the indoor area of the connected room, which are treated as critical regions because they experience higher velocity gradients. The mesh elements are visibly larger and coarser further away from the windcatcher and all over the fluid enclosure to reduce the overall computational load. The refinement of the mesh around critical areas ensures more accurate air flow predictions in regions of interest while maintaining a manageable mesh size.
Table 2.
Mesh statistics.
In order to set boundary conditions, named selections were created and assigned to specific faces of the fluid enclosure for all four configurations. The creation of the named selections serves to clearly define the flow constraints in the model. As is the case with all five configurations, the upstream face of the enclosure (highlighted in blue) is labelled as the velocity inlet (Figure 14). The downstream face, on the other hand, is labelled as a pressure outlet (highlighted in red).
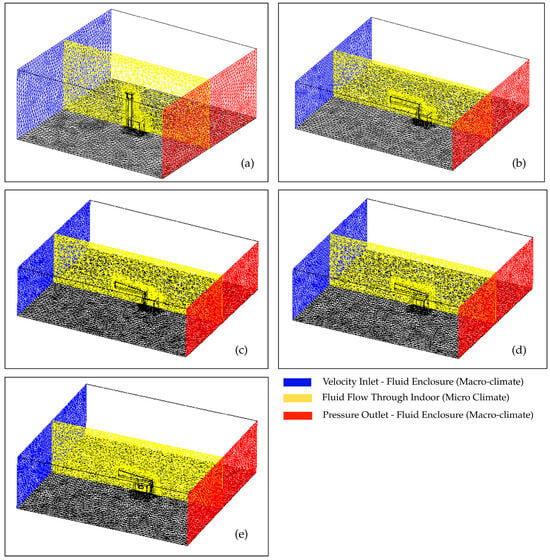
Figure 14.
Mesh named selections for (a). Vertical Windcatcher (traditional), (b) Horizontal model, (c) Horizontal Tapered model, (d) Integrated model, and (e) Hybrid Barjeel.
3.3.4. Grid Independence Test
To verify the numerical models, grid verification was carried out using mesh refinements (h-method) to optimise the distribution of mesh size h over a finite element, as described by Chung [35]. In finite element analysis, the basic concept of mesh refinement methods is to refine the element in which the a posteriori error indicator is larger than the preset criterion. To achieve this error estimate, the h-adaptivity proceeds with an error indicator in terms of changes of gradients of appropriate variables. The Hybrid Barjeel (Model 5) was used for this study, with the computational domain being refined around the microclimate. The grid verification process was carried out to determine the stability of the CFD model.
Table 3 shows the mesh representation at an increasing number of elements. Area weighted average of the static temperature at the outlet was taken as the parameter for calculating the posteriori error. The grid verification process increased the number of elements from 316,347 to 532,665. The maximum posteriori error was 3.05% with a reduction to 0.25% with an increasing mesh. At 532,665 elements, the error indication between refinements dropped to 0.32%; coupled with the computational time, making it an acceptable compromise.
Table 3.
Posteriori error with increasing number of elements.
Figure 15a,b displays a visual representation of the mesh at 316,347, 345,945, and 532,665 elements, alongside the variation in the posterior error with the increasing mesh elements.
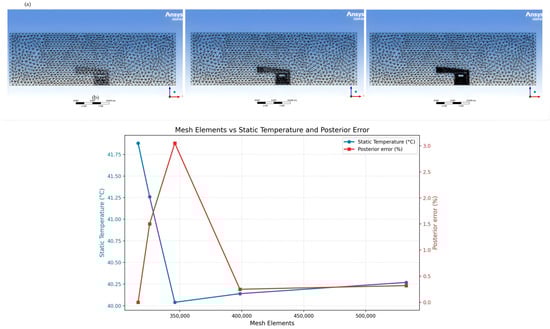
Figure 15.
(a) Visual and (b) Graphical representation of the static temperature and posteriori error with increasing mesh elements.
3.3.5. Boundary Conditions
All windcatcher models were simulated under standardised boundary conditions. An inlet velocity of 3.67 m/s was applied, as this is the average wind velocity in the UAE [36]. The fluent solution setup can be seen in Table 4 below.
Table 4.
Standardised boundary conditions.
4. Results and Discussions
4.1. Air Flow Distribution
The computational model involving the macro climate was run with inlet wind speeds of 3.67 m/s as the mean for the UAE. Velocity, pressure and temperature contour plots were used to assess the ventilation and thermal performance of each configuration. The windcatcher was located centrally within the microclimate. Figure 16 displays the findings for the air flow distribution across the final models. Out of the five investigated models, the vertical typology (Model 1—Figure 16a) displayed an average indoor velocity of 0.281 m/s, a reduction of 92% from the inlet. The highest indoor air velocity was obtained for the horizontal typology (Model 2 (Figure 16b)) at 0.475 m/s, a reduction of 87% from the inlet.
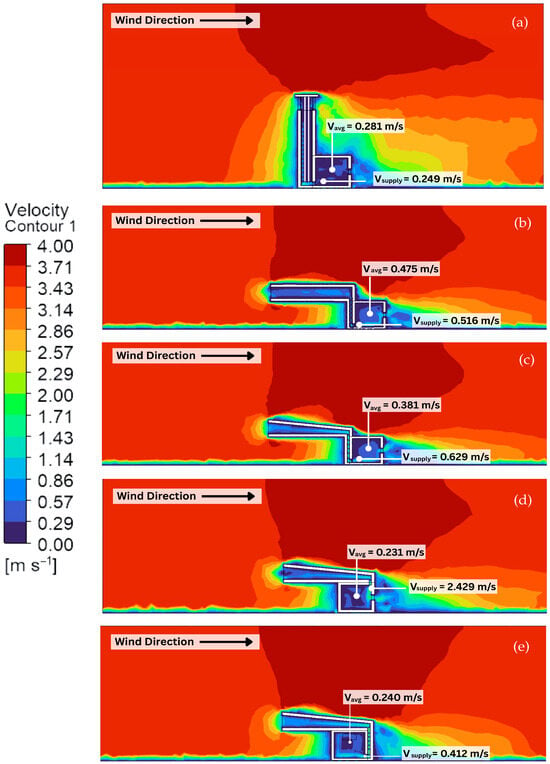
Figure 16.
Contour plot for velocity across (a) Vertical Windcatcher (traditional), (b) Horizontal model, (c) Horizontal Tapered model, (d) Integrated model, and (e) Hybrid Barjeel. Red indicates high velocity, while blue represents minimum velocity.
For Model 1 (Figure 16a), the wind impact on the front façade was strong, producing a compact wake and relatively high roof velocity (0.826 m/s), while downstream recirculation was moderate. The Model 2 (horizontal windcatcher), i.e., Figure 16b, shows a more horizontal wind approach, creating an elongated wake and lower roof velocity (0.405 m/s), indicating increased shielding. The airflow distribution for Model 3 (horizontal tapered), Figure 16c, is similar to Model 2 but with slightly higher roof velocity (0.384 m/s) and a more concentrated low-speed zone behind the structure. Model 4 (integrated model), Figure 16d, indicates intensification of the recirculation, with a larger low-velocity region and the lowest roof velocity (0.231 m/s), suggesting significant wind blockage. Finally, Model 5 (Hybrid Barjeel), Figure 16e, exhibits the most pronounced wake and turbulence, with extensive low-speed zones and a roof velocity of 0.248 m/s, reflecting strong energy dissipation and airflow separation. Overall, the progression, Figure 16a–e, shows increasing wake size, reduced roof exposure, and greater recirculation effects. According to ANSI/ASHRAE Standard 55, the air velocity upper limit is 0.8 m/s for indoor zones with operative temperatures above 25.5 °C; therefore, Model 2 is closest to this. All the windcatcher models, however, meet the lower limit of 0.2 m/s comfortably.
4.2. Static Pressure Distribution
Figure 17 presents five static pressure contour profiles for the five investigated models under varying wind conditions, illustrating pressure distribution changes with airflow orientation. In all cases, the windward side of the building experiences a high-pressure zone (shown in red), while the leeward side exhibits a low-pressure region (blue), indicating strong suction effects. Figure 17a displays the most pronounced pressure difference, with a peak positive pressure of approximately 6.83 Pa on the windward face and a negative pressure of −3.89 Pa on the leeward side, suggesting a steep pressure gradient. As the wind direction shifts in subsequent profiles, the high-pressure zone becomes less concentrated, and the suction region behind the building expands, reducing the overall pressure differential. This trend reflects a gradual decrease in frontal impact and an increase in downstream recirculation effects.
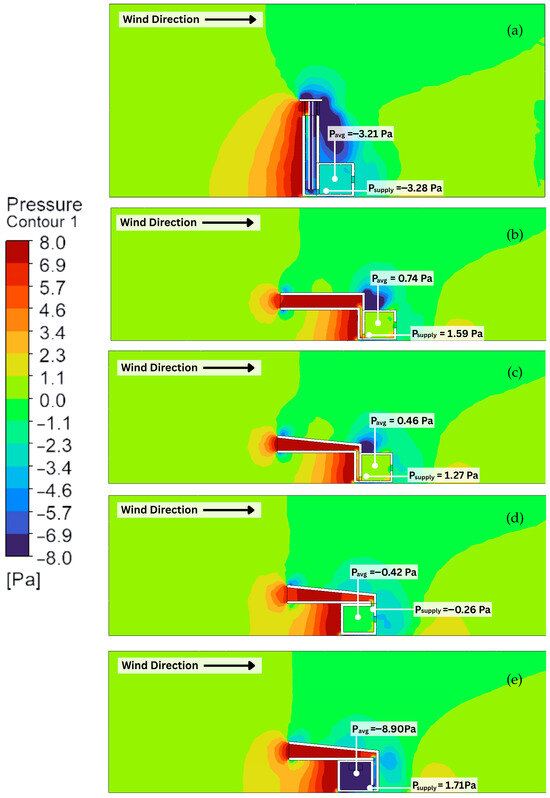
Figure 17.
Contour plot for pressure across (a) Vertical Windcatcher (traditional), (b) Horizontal model, (c) Horizontal Tapered model, (d) Integrated model, and (e) Hybrid Barjeel. Red indicates high pressure, while blue represents low pressure.
For the horizontal windcatcher, Model 2 (Figure 17b), the pressure distribution shows a clear shift in wind interaction compared to the traditional vertical windcatcher—Model 1. The windward side of the structure experiences a concentrated high-pressure zone near the front façade, with a peak pressure of approximately 6.07 Pa, while the leeward side exhibits a strong suction effect at −1.59 Pa. This configuration indicates a significant pressure differential, which can lead to increased structural loading on the windward face and potential infiltration through openings. The wake region behind the building is more elongated than in Model 1, suggesting enhanced recirculation and turbulence, which may influence ventilation performance and pollutant dispersion.
The static pressure impact indicated lower intensity in Model 3 (horizontal tapered), Figure 17c, on the windward side, with a peak pressure of about 6.04 Pa, and the leeward suction remains strong at −1.37 Pa. The pressure contours show a more distributed gradient, indicating that the wind angle or flow conditions have reduced the direct stagnation effect on the front façade.
In Model 4 (integrated windcatcher) (Figure 17d) and Model 5 (Hybrid Barjeel) (Figure 17e), the pressure contours show more distributed gradients, with peak windward pressures dropping to around 5.69 Pa and leeward suction intensifying to nearly −3.87 Pa. These changes indicate that as the wind approaches at a more oblique angle, the stagnation point shifts, reducing direct pressure on the front façade while enhancing negative pressure zones along the sides and rear. The elongated low-pressure regions in these cases suggest stronger vortex formation and flow separation behind the building.
4.3. Temperature Distribution
Temperature distribution analysis (displayed in Figure 18a–e) indicated that all configurations achieve measurable indoor cooling effects. Out of the five investigated models, the vertical windcatcher model demonstrated superior thermal performance with an indoor temperature of 39.57 °C, showing a 1.43 °C temperature reduction from ambient conditions. Meanwhile, the Hybrid Barjeel model recorded the highest indoor temperature of 40.04 °C.
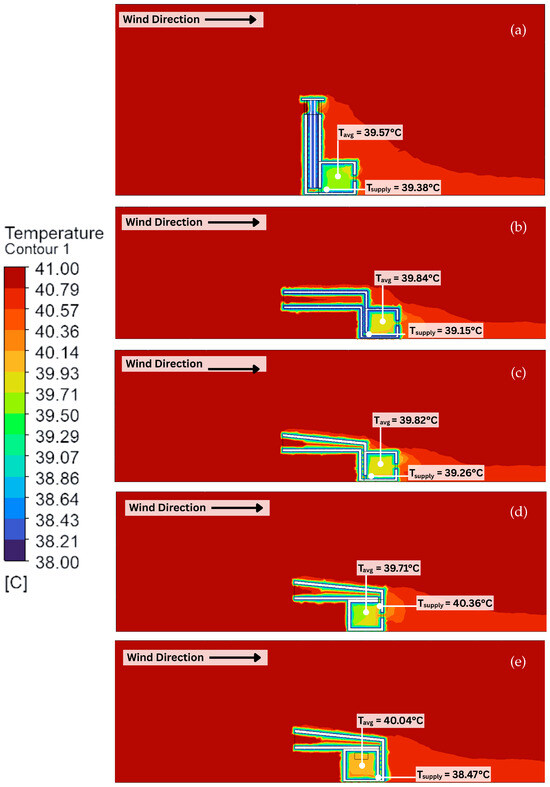
Figure 18.
Contour plot for temperature across (a) Vertical Windcatcher (traditional), (b) Horizontal model, (c) Horizontal Tapered model, (d) Integrated model, and (e) Hybrid Barjeel. Red indicates high temperature, while blue represents minimum temperature.
For the traditional vertical windcatcher (Model 1) (Figure 18a), the temperature near the structure is relatively uniform, with slight cooling around the base and façade, indicating limited heat removal. Figure 18b, i.e., the horizontal windcatcher (Model 2), indicated more pronounced cooling along the building’s windward side and internal courtyard, suggesting improved ventilation and heat dissipation. A similar trend was observed with the horizontal tapered windcatcher (Model 3) (Figure 18c). However, it also shows slightly reduced heat accumulation near the roof, thus indicating better airflow penetration. For both versions of the integrated horizontal windcatcher models (Models 4 and 5) (Figure 18d,e), the cooling effect becomes more localised, with distinct low-temperature zones near openings and shaded areas, while the surrounding environment remains hot. Figure 18d displays concentrated cooling at the rear and roof edges, implying enhanced convective heat removal in those regions. Figure 18e exhibits the most uniform cooling across the building envelope, with temperatures near 38.4 °C in the supply zone, suggesting optimal airflow for thermal comfort.
According to ASHRAE Standard 55, which establishes acceptable temperature ranges for thermal comfort, all the models exceed the recommended upper limit for naturally conditioned spaces (around 30–32 °C for hot climates), indicating that the integration of additional cooling or passive cooling strategies may be required.
For quantitative analyses, a line was drawn in the horizontal (X-Y) plane through the cross-section of all five models. The line consisted of 100 points, which are represented as chart counts on the x-axis (similar to the contour planes above). Trends in velocity, pressure, and temperature were compiled to compare the different windcatcher configurations. Figure 19a–c displays the findings.
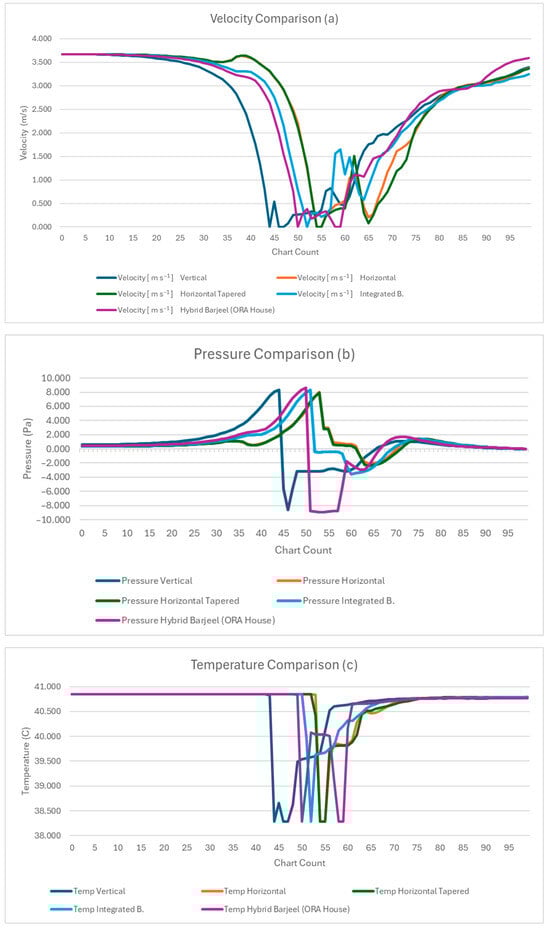
Figure 19.
Quantitative trend for (a) velocity, (b) pressure, and (c) temperature profiles along the cross-sectional line.
All five profiles reach similar maximum velocities of ~3.8–4.0 m/s at the upstream end, but their minimum velocities in the mid-range low flow zone differ markedly: the vertical windcatcher drops deepest to near stagnation; the horizontal windcatcher (Model 2) bottoms at ~0.2–0.3 m/s; and Model 3 (horizontal tapered windcatcher) dips to ~0.1–0.2 m/s after a slightly delayed fall. The integrated windcatcher (Model 4) maintains a higher airflow of ~0.5–0.7 m/s. However, the Hybrid Barjeel (Model 5) preserves the best minimum of ~0.4–0.6 m/s with a smooth, early recovery. By the end of the record, all configurations rebound toward ~3.0–3.5 m/s, indicating the positive influence of its design consideration for passive ventilation. As indicated in the work of Calautit et al. [10], an average indoor velocity of 0.34 m/s (in relation to an outdoor speed of 3 m/s) was observed, indicating a drop of approximately 89%. This trend is visible in the current models too, with the average velocity observation of 0.322 m/s, which is a 91% drop from the inlet speed of 3.67 m/s.
Figure 19b compares pressure profiles for the five configurations. All profiles start near neutral pressure (~0 Pa) but diverge significantly in the mid-range. Maximum pressures occur between chart counts 40–55 (microclimate windward), where the horizontal windcatcher (Model 1) and the Hybrid Barjeel (Model 5) peak around 8–9 Pa, the integrated windcatcher (Model 4) reaches ~7–8 Pa, whilst the traditional vertical windcatcher (Model 1) displays lower maximum pressure at ~6–7 Pa. In contrast, minimum pressures show the greatest variation. The vertical model drops sharply to approximately −8 Pa, while the other models maintain less negative values between −2 and −4 Pa. After chart count 70 (microclimate leeward), all profiles appear to stabilise near zero, indicating recovery to baseline conditions.
Overall, the Hybrid Barjeel (Model 5) exhibits the highest positive pressure peaks, suggesting strong windward loading, while the traditional vertical windcatcher displays the highest negative pressure, indicating significant suction effects.
The temperature comparison graph (Figure 19c) indicates that the vertical windcatcher (Model 1) shows the largest drop, with a sharp decline to nearly 38 °C and slower stabilisation. Design significantly affects temperature distribution by influencing airflow patterns, shading, and heat retention around a structure, whilst the vertical windcatcher model displays a higher temperature difference from the ambient; its inability to induce a minimal mass flow rate indicates lower heat transfer capability (as demonstrated in the subsequent section). All models appear to drop at the 38 °C temperature zone at the supply of the windcatcher to the microclimate; however, the Hybrid Barjeel model displays two instances of the reduced temperature locations compared to all other models, which is notable.
5. Ventilation Conductance and Correlation with Cost Savings
The evaluation of the five investigated configurations reveals distinct performance characteristics in airflow dynamics and thermal regulation. Model 2 (Horizontal) exhibits superior ventilation efficiency, achieving the highest mean mass flow rate (7.98 kg·s−1) and microclimate velocity (0.48 m·s−1), coupled with maximum ventilation conductance of 14,836.82 W and a mean conductance of 553.75 W. This indicates a strong capacity for convective heat transfer and enhanced cooling potential. Model 3 (Horizontal Tapered) ranks second, with a mean mass flow rate of 6.40 kg·s−1 and moderate conductance values, suggesting improved aerodynamic performance relative to vertical and integrated designs. Model 1 (Vertical) provides intermediate results, balancing airflow and thermal stability but at reduced conductance levels. Conversely, Model 4 (Integrated) demonstrates the lowest ventilation capacity (mean flow rate: 3.88 kg·s−1; mean conductance: 299.48 W), despite maintaining microclimate temperatures near 39.71 °C, indicating limited convective exchange. Notably, Model 5 (Hybrid Barjeel) achieves the lowest supply temperature (38.47 °C), implying localised cooling effectiveness, though its overall ventilation conductance remains modest (231.55 W). These findings underscore the dominance of horizontal configurations in optimising airflow and heat dissipation, reinforcing their suitability for passive cooling strategies in hot-arid climates. Table 5 displays the summarised results.
Table 5.
Ventilation conductance findings.
Ventilation conductance (W) represents the rate of heat transfer facilitated by airflow through the system. Higher conductance values indicate more effective heat removal from the indoor environment, reducing reliance on mechanical cooling systems such as air conditioners. In hot-arid climates such as Dubai, where cooling loads dominate annual energy consumption, passive ventilation strategies that achieve high conductance can significantly reduce HVAC demand. Model 2 (Horizontal) achieves a maximum conductance of 14,836 W, which is equivalent to 14.8 kW of heat removal capacity under peak conditions. If this passive system operates for 8 h/day, it can displace approximately 118.7 kWh/day of cooling energy. Assuming a typical cooling COP of 3.0 (typical summer cooling season in Dubai), and an electricity cost of AED 0.30/kWh (average residential electricity rate), this translates to AED 11.87/day or AED 3561/year in potential savings for a single windcatcher unit during peak summer months. Even models with lower conductance (e.g., Model 4 at 2496 W) still provide meaningful reductions in cooling load, especially when scaled across multiple units or integrated into building design.
Figure 20 displays the linear relationship between ventilation conductance (W) and energy cost savings under fixed operating assumptions (COP = 3.0, 8 h/day, electricity tariff = 0.32 AED/kWh, cooling season = 150 days). It consists of two panels: Panel A (left) plots daily cost savings (AED/day) against conductance for each model. Circular markers represent savings based on mean conductance, while square markers represent maximum conductance. Each point is labelled (M1–M5) corresponding to the five ventilation configurations. Dashed trend lines indicate the proportional increase in savings with conductance. Panel B (right) shows the same relationship for seasonal savings (AED over 150 days). The pattern mirrors Panel A, with higher conductance models positioned toward the upper-right quadrant, indicating greater cumulative savings. Key observations state that models with higher conductance (e.g., Model 2—Horizontal, max ≈ 14,836 W) achieve the greatest savings, up to ≈12.7 AED/day or ≈1900 AED per season. Lower conductance models (e.g., Model 4—Integrated windcatcher, max ≈ 2496 W) yield modest savings, highlighting the economic advantage of designs that maximise airflow.
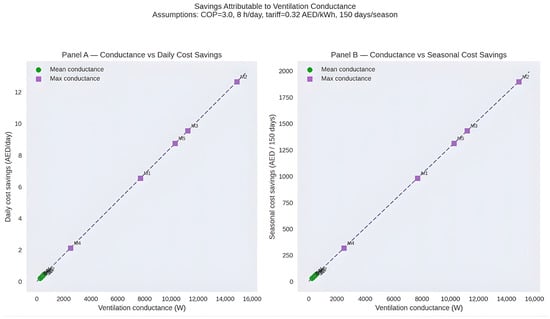
Figure 20.
Estimated daily and seasonal cooling cost savings versus ventilation conductance.
The linearity of the trend lines reflects the direct proportionality between conductance and avoided cooling energy. The findings of the overall study indicate that improving passive ventilation conductance can significantly reduce cooling energy costs in hot-arid climates, reinforcing the economic case for high-performance horizontal or tapered designs. As windcatchers have no moving parts and no reliance on electricity, they offer long-term durability and operational savings, and therefore, performance degradation does not occur significantly over time, making them a reliable strategy in regions where energy costs for mechanical cooling are significant.
In order to conduct a validation against the works of Calautit et al. [10], a normalisation ratio of indoor/outdoor velocities was carried out for the two models presented in the works of Calautit et al. [10], alongside the five numerical models proposed in the current study. The findings are presented in Table 6. The observation suggested that unobstructed/less resistive designs (horizontal windcatcher) have higher normalisation ratios (≈0.13–0.17), whereas added internal resistance (HTDs (Calautit et al. [10] or the integrated windcatcher models) pushed ratios down to ≈0.06–0.10, i.e., a ~40–60% drop in indoor speed per unit approach wind. This analysis provided a normalised confirmation of the same trade-off found between both studies.
Table 6.
Normalisation ratio of indoor/outdoor velocities against the works of Calautit et al. [10].
The validation study used the benchmark of Calautit et al. [10] because it is one of the most rigorously validated experimental–numerical investigations of a unidirectional windcatcher, offering wind-tunnel data and CFD results against which new ventilation geometries can be reliably compared. Calautit et al.’s setup employed a vertical, unidirectional tower—a configuration geometrically and operationally distinct from the horizontally oriented, partition-free channels and tapered or integrated inlets explored in the present study. In terms of velocity normalisation, Calautit et al.’s benchmark models produced ratios of 0.167 (standard) and 0.097 (HTD), whereas the designs in the current study fall within 0.063–0.131. The higher ratios observed in the horizontal model (≈0.131) indicate comparatively lower flow resistance and more efficient transmission of the approach wind, while the lower ratios in the integrated and Hybrid Barjeel configurations (≈0.063–0.065) reflect similar performance penalties to those seen in Calautit et al.’s HTD case, implying greater internal drag or geometric dissipation of momentum. Overall, the comparison confirms that designs with fewer internal obstructions behave more like Calautit et al.’s benchmark tower model.
6. Conclusions
The reinterpretation and adaptation of the conventional vertical windcatcher into a horizontal configuration represent a significant advancement in the evolution of contemporary windcatcher systems. Beyond the optimised volumetric design, numerical analysis through CFD simulations demonstrates notable improvements in passive cooling performance. While the vertical Barjeel remains an iconic element of vernacular architecture, the integrated horizontal typology offers a discreet and adaptable solution for modern design contexts.
This research opens several avenues for further exploration. One promising direction is the morphological study of horizontal windcatcher systems and their integration into common residential typologies, such as townhouses and villas, which predominate in gated communities across the UAE and the broader Middle East. The cumulative effect of reducing cooling loads can contribute substantially to carbon savings and energy efficiency. The CFD analysis concluded that, overall, horizontal windcatcher configurations outperform traditional vertical designs in ventilation efficiency, with the horizontal model achieving the highest mean mass flow rate (7.98 kg·s−1) and ventilation conductance (14,836 W), indicating a superior convective heat transfer potential. While the vertical windcatcher demonstrated the greatest temperature drop from ambient (≈1.43 °C), its airflow stagnation limited overall heat removal, making it less effective than horizontal alternatives. Integrated designs, including the Hybrid Barjeel of ORA House, showed localised cooling benefits, achieving the lowest supply air temperature (38.47 °C). But their overall ventilation conductance remained modest, suggesting trade-offs between airflow and thermal precooling. This study, therefore, demonstrates that horizontal windcatcher configurations are not only feasible but can be architecturally integrated into contemporary residential buildings without compromising passive cooling potential.
Future research into the horizontal windcatcher model provides an opportunity to incorporate PCMs to enable higher levels of passive cooling. The Hybrid Barjeel in ORA House design extends this concept further by enhancing indoor air quality, channelling supply air through NASA-certified plants that help remove carbon dioxide and toxins, thereby combining thermal comfort with improved environmental health.
Author Contributions
Conceptualisation, S.M.; methodology, H.N.C.; software, H.N.C. and I.M.C.S.; validation, S.M., H.N.C. and I.M.C.S.; formal analysis, S.M.; investigation, H.N.C.; resources, S.M., H.N.C. and I.M.C.S.; data curation, S.M. and H.N.C.; writing—original draft preparation, S.M., H.N.C. and I.M.C.S.; writing—review and editing, S.M., H.N.C. and I.M.C.S.; visualisation, S.M., H.N.C. and I.M.C.S.; supervision, S.M. and H.N.C.; project administration, S.M. and H.N.C.; funding acquisition, S.M. and H.N.C. All authors have read and agreed to the published version of the manuscript.
Funding
This research received no external funding.
Institutional Review Board Statement
Not applicable.
Informed Consent Statement
Not applicable.
Data Availability Statement
The data presented in this study are available on request from the corresponding author. The data are not publicly available due to ongoing research.
Acknowledgments
The authors would like to thank Heriot-Watt University for the use of the library and resources required in conducting this research.
Conflicts of Interest
The authors declare no conflicts of interest.
Abbreviations
The following abbreviations are used in this manuscript:
| SDME | Solar Decathlon Middle East |
| DEWA | Dubai Electricity and Water Authority |
| ORA | Organic, Resilient, Adaptive |
| PCM | Phase Changing Material |
| HTD | Heat Transfer Devices |
| CFD | Computational Fluid Dynamics |
References
- Assi, E. Layers of Meaning and Evolution of Cultural Identity: The Case of Wind Towers in Dubai. Conservation 2022, 2, 38–50. [Google Scholar] [CrossRef]
- Abu Hantash, T.F. Building a Zero Energy House for Uae: Traditional Architecture Revisited. In Proceedings of the 5th International Conference on Zero Energy Mass Customised Housing—ZEMCH 2016, Kuala Lumpur, Malaysia, 20–23 December 2016. [Google Scholar]
- Mahmoud, A.K.A.M.; Malhoub, M.S.; Elgendy, E.S. Analytical study of Wind Catchers and Their Application in Contemporary Architecture. Int. J. Curr. Eng. Technol. 2025, 15, 401–407. [Google Scholar]
- Hedayat, Z.; Samkhaniani, N.; Belmans, B.; Hossein, M.; Ayatollahi, S.; Wouters, I.; Descamps, F. Energy performance analysis of solar-wind catchers under hot and dry climatic condition in Iran-Yazd. In Proceedings of the 3rd International Conference and Exhibition on Solar Energy (ICESE); University of Tehran: Tehran, Iran, 2016. [Google Scholar]
- UNEP; GABC. Global Status Report for Buildings and Construction 2024/2025. In Proceedings of the UNEP/Global Alliance for Buildings and Construction (GlobalABC); United Nations Environment Programme: Nairobi, Kenya, 2025. [Google Scholar]
- Rudd, A.; Bergey, D. Ventilation System Effectiveness and Tested Indoor Air Quality Impacts; National Renewable Energy Laboratory: Golden, CO, USA, 2014.
- Hughes, B.R.; Chaudhry, H.N.; Ghani, S.A. A review of sustainable cooling technologies in buildings. Renew. Sustain. Energy Rev. 2011, 15, 3112–3120. [Google Scholar] [CrossRef]
- Hughes, B.R.; Cheuk-Ming, M. A study of wind and buoyancy driven flows through commercial wind towers. Energy Build. 2011, 43, 1784–1791. [Google Scholar] [CrossRef]
- Calautit, J.K.; Hughes, B.R.; Chaudhry, H.N.; Ghani, S.A. CFD analysis of a heat transfer device integrated wind tower system for hot and dry climate. Appl. Energy 2013, 112, 576–591. [Google Scholar] [CrossRef]
- Calautit, J.K.S.; Hughes, B.R.; Shahzad, S.S. CFD and Wind Tunnel Study of the Performance of a Uni-Directional Wind Tower with Heat Transfer Devices. Renew. Energy 2015, 83, 85–89. [Google Scholar] [CrossRef]
- Foroozesh, J.; Hosseini, S.H.; Hosseini, A.J.A.; Parvaz, F.; Elsayed, K.; Babaoglu, N.U.; Hooman, K.; Ahmadi, G. CFD modeling of the building integrated with a novel design of a one-sided wind-catcher with water spray: Focus on thermal comfort. Sustain. Energy Technol. Assess. 2022, 53, 102736. [Google Scholar] [CrossRef]
- Calautit, J.K.; Hughes, B.R.H. Application of a Passive Cooling Wind Catcher within the Built Environment: Numerical and Experimental Analysis. In Proceedings of the SusTEM 2015; Newcastle University: Newcastle, UK, 2015. [Google Scholar]
- Sirror, H. Innovative Approaches to Windcatcher Design: A Review on Balancing Tradition Sustainability and Modern Technologies for Enhanced Performance. Energies 2024, 17, 5770. [Google Scholar] [CrossRef]
- Ghadiri, M. The Effect of Tower Height in Square Plan Wind catcher on its Thermal Behavior. Aust. J. Basic Appl. Sci. 2011, 5, 381–385. [Google Scholar]
- Muhammed, S. ORA House: An Ecosystemic Approach to Design of a Net-Zero House for the Middle East. In Proceedings of the 108th ACSA Annual Meeting 2020; Association of Collegiate Schools of Architecture: Washington, DC, USA, 2020. [Google Scholar]
- Zarandi, M.M. Comparative analysis on architectural characters of Iranian wind catchers in hot arid (case study: Yazd & Bandar Lengeh). Int. J. Adv. Appl. Sci. 2015, 2, 17–22. [Google Scholar]
- Sakhri, N.; Menni, Y.; Ameur, H.; Chamkha, A.J.; Kaid, N.; Bensafi, M.; Lorenzini, G.; Makinde, O.D. Investigation of the natural ventilation of wind catchers with different geometries in arid region houses. J. Mech. Eng. Sci. 2020, 14, 7109–7124. [Google Scholar] [CrossRef]
- Ghadiri, M.; Nik Ibrahim, N.L.; Mohamed, M.F. Performance Evaluation of Four-Sided Square Wind Catchers with Different Geometries by Numerical Method. Eng. J. 2013, 17, 9–18. [Google Scholar] [CrossRef]
- Dehghan, A.A.; Esfeh, M.K.; Manshadi, M.D. Natural ventilation characteristics of one-sided wind catchers: Experimental and analytical evaluation. Energy Build. 2013, 61, 366–377. [Google Scholar] [CrossRef]
- Lesan, M.; Mirjafari, M.; Lesan, M.; Yazdanfar, A. CFD simulation of Hydrodynamic Behavior of Four-Sided Windcatcher integrated to the Earth ducts (Nay-Kesh) on the mean Temperature of the basement (traditional passive cooling in Kashan Iran). In Proceedings of the 54th International Conference of the Architectural Science Association (ANZAScA) 2020; Architectural Science Association: Auckland, New Zealand, 2020. [Google Scholar]
- Montazeri, H.; Montazeri, F. CFD simulation of cross-ventilation in buildings using rooftop wind-catchers: Impact of outlet openings. Renew. Energy 2018, 118, 502–520. [Google Scholar] [CrossRef]
- Ghadiri, M.; Nik Ibrahim, N.L.; Mohamed, M.F. Applying Computational Fluid Dynamic to Evaluate the Performance of Four-Sided Rectangular Wind Catcher with Different Height. Res. J. Appl. Sci. Eng. Technol. 2014, 7, 502–509. [Google Scholar] [CrossRef]
- Alhraki, A.R.; Qurraie, B.S. CFD evaluation of wind catcher geometry and internal partitions for enhanced ventilation in Nizwa. J. Innov. Eng. Nat. Sci. 2025, 5, 55–69. [Google Scholar] [CrossRef]
- Calautit, J.K.; Chaudhry, H.N.; Hughes, B.R.; Ghani, S.A. Comparison between evaporative cooling and a heat pipe assisted thermal loop for a commercial wind tower in hot and dry climatic conditions. Appl. Energy 2013, 101, 740–755. [Google Scholar] [CrossRef]
- Hedayat, Z.; Ayatollahi, M.H.; Wouters, I.; Descamps, F. Performance assessment of ancient wind catchers—An experimental and analytical study. Energy Procedia 2015, 78, 2578–2583. [Google Scholar] [CrossRef]
- Qadourah, J.A. Improving Natural Ventilation Multi-Story Buildings within Hot and Dry Climates: A CFD Study of Windcatcher Performance. Civ. Eng. Archit. 2023, 12, 1014–1026. [Google Scholar] [CrossRef]
- ASHRAE Standard 55-2003; Thermal Environment Conditions for Human Occupancy. ASHRAE (American Society of Heating, Refrigerating and Air-Conditioning Engineers): Atlanta, GA, USA, 2023.
- Hosseini, A.A.; Ghodrat, M.; Hosseini, S.H.; Golparvar, B.; Calautit, J.K.; Ahmadi, G. CFD Study of Evaporative Cooling System Integrated to a Windcatcher. In Proceedings of the 22nd Australasian Fluid Mechanics Conference AFMC2020; University of Queensland Library: Brisbane, Australia, 2020. [Google Scholar]
- Hassan, A.M.; Lee, H.; Yoo, U. From medieval Cairo to modern Masdar City: Lessons learned through a comparative study. Archit. Sci. Rev. 2016, 59, 39–52. [Google Scholar] [CrossRef]
- Calautit, J.K.; Hughes, B.R.; Ghani, S.A. Integration and Application of Passive Cooling Within a Wind Tower. In Proceedings of the First International Conference on Energy and Indoor Environment for Hot Climates, Doha, Qatar, 24–26 February 2014; pp. 160–167. [Google Scholar]
- Hughes, B.R.; Chaudhry, H.N.; Calautit, J.K. Passive energy recovery from natural ventilation air streams. Appl. Energy 2014, 113, 127–140. [Google Scholar] [CrossRef]
- Hughes, B.R.; Ghani, S.A.A.A. A numerical investigation into the effect of Windvent louvre external angle on passive stack ventilation performance. Build. Environ. 2010, 45, 1025–1036. [Google Scholar] [CrossRef]
- Eso, O.; Darkwa, J.; Calautit, J. Integrated Phase-Change Materials in a Hybrid Windcatcher. Energies 2025, 18, 848. [Google Scholar] [CrossRef]
- Li, J.; Calautit, J.; Jimenez-Bescos, C.; Song, W.; Riffat, S.; Chen, Q. Climate-adaptive windcatcher natural ventilation integrated with passive and low-energy technologies: A review of current and future developments. Build. Environ. 2025, 284, 113436. [Google Scholar] [CrossRef]
- Chung, T.J. Computational Fluid Dynamics, 2nd ed.; Cambridge University Press: Cambridge, UK, 2010. [Google Scholar] [CrossRef]
- Dubai, UAE: Weather Statistics and Wind History. Dubai, UAE, Dubai Wind and Weather Statistics—Windy.app. Available online: https://windy.app/forecast2/spot/366852/Dubai+%D8%AF%D8%A8%D9%8A/statistics (accessed on 6 February 2026).


Disclaimer/Publisher’s Note: The statements, opinions and data contained in all publications are solely those of the individual author(s) and contributor(s) and not of MDPI and/or the editor(s). MDPI and/or the editor(s) disclaim responsibility for any injury to people or property resulting from any ideas, methods, instructions or products referred to in the content. |
© 2026 by the authors. Licensee MDPI, Basel, Switzerland. This article is an open access article distributed under the terms and conditions of the Creative Commons Attribution (CC BY) license.