Abstract
Atmospheric deposition of microplastics (MPs) contributes to the contamination of both terrestrial and aquatic environments. Roads show high MP deposition, yet the factors influencing the deposition rate and characteristics (polymer types and sizes) remain insufficiently understood. In this study, we investigated atmospheric MPs in two size fractions: 45–300 μm (small) and ≥300 μm (large), collected monthly for one year using a bulk deposition method. Large MPs were visually sorted and characterized via ATR-FTIR spectroscopy for polymer identification, while smaller MPs were quantified by measuring non-purgeable organic carbon (NPOC) using a total organic carbon (TOC analyzer), without polymer characterization. Deposition rates of large MPs ranged from 3 to 9 million pcs/ha/month, while small MPs averaged 72.2 gC/ha/month. Identified polymers included PP, PE, PS, PVC, PET, PVAC, PA, and PU. Traffic mainly influenced large MPs, especially PET and PA, near roads, whereas wind direction and intensity enhanced dispersal of small MPs and the transport of PVC, PS, and PU. Predominant easterly winds also indicated possible contributions from industrial and other anthropogenic sources. By focusing on the road area, integrating influence of traffic and meteorological factors, and adapting TOC-based carbon quantification, this study provides new insights and extends existing knowledge in the field.
1. Introduction
The presence of microplastics (MPs) in the atmosphere raises concerns regarding their potential for inhalation and human exposure, as they have been found in human lung tissues [1,2]. A study on internal exposure showed that individuals living near roads had higher concentrations of MPs in their lungs [2]. While abrasion and UV degradation are known pathways for microplastic (MP) formations [3], one study demonstrated that stepping on plastic bags on road surfaces at specific time intervals also releases inhalable MPs [4]. In addition to unidentified airborne sources, other possible contributors to MPs in roadside air include tire and brake wear [5,6], and plastic materials used in the road environment [4].
One way to observe the presence of MPs in the air is by examining their deposits, which are assumed to be suspended at a lower level. This method was implemented in some research discussing atmospheric MP deposition, whether in a bulk setting condition or dry/wet setting [7,8,9,10,11,12]. Roadside areas were found to comprise the highest deposition among other forms of land, such as residential areas and parks [7,8]. In Japan, where many people commute by public transportation, bicycles, or on foot, periods exist when they contribute to or are even exposed to MP pollution in roadside areas. The accumulated or deposited MPs in road dust are not only harmful to humans, since they may degrade and recirculate back in the atmosphere [13] and pose the risk of obstructive pulmonary disease [14,15], but they can also lead to further pollution of terrestrial and aquatic ecosystems by surface runoff water [16,17]. Therefore, we mainly focused on atmospheric deposited road MPs.
MPs in roadside areas are generally discussed into two groups, T(R)WP—Tire (Road) Wear Particles or microrubbers (MRs) [18] and ordinary or typical MPs, such as PE and PET [19]. While T(R)WP have received growing research attention, ordinary MPs originating from multiple significant sources need to be more widely recognized [20]. In the case of Japan, road dust samples show that containers/packaging MPs accounted for more than rubber MPs [21]. Moreover, airborne street dust MPs comprise higher oxidative potential than that of microrubbers (MRs), which cause a high depletion of antioxidants that are important for neutralizing free radicals, triggering cellular, protein, and DNA damage in the human body [22]. Over time, these MPs may also pose the same level of toxicity as TRWP after long-term accumulation.
With regard to MP pollution in aquatic environments (rivers and seas) [23,24,25,26], many studies focused on the presence of road-derived MPs in water media. Past investigations mainly took samples from road runoff water and dust (swept away with road runoff water during rain). These compartments were analyzed in many countries [27,28], including Japan. Additionally, road runoff water in Japan was found to consist of higher MP emissions to river catchments than that of untreated wastewater [16] and this road runoff is believed to be a major contributor to pollution compared with that of sewage overflow input [17]. Japanese road dust in Kusatsu, Kumamoto, Okinawa, and Tokyo was confirmed to contain MPs either suspected or traced from tire–road wear or plastic waste/plastic products, such as plastic containers, road paint, and other road accessories [13,20,21,29]. These researchers agreed that atmospheric deposition contributed to the accumulation of MPs pollution in their samples.
Previous studies on atmospheric MPs deposition have generally classified sites as such as urban, suburban, rural, or remote [1,11,30,31,32]. Most investigations of road-associated MPs have focused primarily on resuspended road dust [13,28,29], while roadside atmospheric fallout has received limited attention despite its role as a secondary deposition pathway [33]. Moreover, Cakaj [7] and Jenner [8] reported that the road environment exhibited the highest MPs compared to other such as industrial areas, residential zones, and parks, which led us to focus on roadside deposition. While meteorological conditions have been considered in some atmospheric deposition studies [30,31], their combined role with local traffic in the roadside environment remains poorly understood. Although Gao [34] and Ozen and Mutuk [35] considered traffic influence, their study focused only on tire wear particles. Moreover, from the most recent article review by Liu [36], there is still no report yet on the atmospheric MPs deposition study from Japan. Therefore, our study focuses on roadside atmospheric deposition of ordinary microplastics in Japan through a year-long assessment of deposition rate and MPs characteristics, namely polymer types, size distribution for large MPs (≥0.3–5 mm). Furthermore, we investigate the influence of traffic and meteorological factors and implement a TOC-based carbon quantification for smaller MPs (45–300 μm). By focusing on roadside atmospheric deposition of ordinary microplastics and combining with these approaches, our study provides new insights and extends existing knowledge in the field.
2. Materials and Methods
2.1. Sampling Site
The study was conducted at the main entrance of the Tokyo City University Yokohama Campus (35°33′42.21″ N, 139°34′33.24″ E, elevation: 50 m), located in the Kohoku New Town area of Tsuzuki Ward, Yokohama City, Japan. This area occupies nearly half of the Tsuzuki Ward and is considered one of the wards with a high coverage of greenery in the city. The northern and central regions are primarily residential and commercial, whereas the southern part near the Tsurumi River is designated for agricultural and industrial use [37,38]. Meteorological data related were obtained from the Japan Meteorological Agency.
As shown in Figure 1, the university surroundings are dominated by residential houses. The road in front of the main gate (Road A) connects two major roads, Kuyakusho-dori and Hiyoshimotoishikawasen, and serves as a shortcut for drivers avoiding traffic lights. Sampling was conducted on Road B, which runs perpendicular to Road A, and serves as the only vehicle-accessible university entrance site. Other gates exist but are restricted to pedestrians and cyclists.
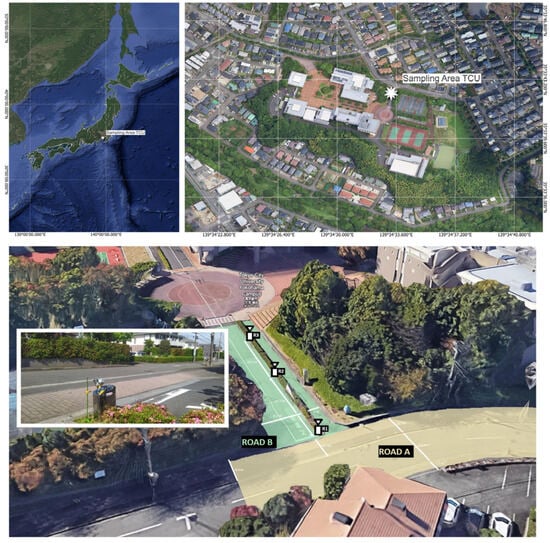
Figure 1.
Sampling site overview (image processed from Google Earth). (Top Left): Location Point of Tokyo City University Yokohama Campus within Japan. (Top Right): Aerial view of the surrounding university. (Bottom): sampling collection and road observation scheme.
Three sampling points were chosen along Road B at varying distances from Road A: R1 (<1 m), R2 (21 m), and R3 (32 m). Vehicle activity on Roads A and B was monitored monthly for one week using CCTV footage. Vehicles were categorized by type: motorcycles and bicycles as small vehicles, whereas cars, buses, and trucks were categorized as large vehicles. Given the university’s small size and generally consistent traffic, one week of observation was considered sufficient to represent monthly conditions, with the seasonal break reflected by reduced traffic. This approach also accounted for time and data storage limitations.
2.2. Sample Collection and Preparation
One bulk deposition sampler was installed at the ground level at each sampling point, totaling three samplers. These samplers collected both wet and dry atmospheric deposition data over the course of one year, from May 2024 to April 2025. A total of 12 independent samples were collected per site (one sample per month), with no technical replicates. This bulk sampling method is commonly used in atmospheric MP studies and is fit for long-term observation [11,31,32,39,40,41].
The device consisted of a 20 L stainless-steel tank with a funnel opening of 294 cm2, adapted from previous designs [9,31,40]. Unlike that of the other models, this sampler had no internal filtration, which is consistent with the approach used by Zheng [42]. Rainwater accumulated during each month was processed the same way as a liquid-phase sample for the fractionation method by size [43,44] using a stainless-steel sieve system (Test Sieve—Sanpo, Tokyo Screen Co., Ltd., Tokyo, Japan) with a mesh size of 300 μm and 45 μm.
Before each filtration, the sieves were rinsed with distilled water to ensure that no adhered particles or contaminants were present on the mesh surface. Thereafter, both sieves were stacked together—300 μm above 45 μm—and the rainwater containing atmospheric particles was poured and passed on to the filter. Additional rinsing with distilled water was performed to release the particles attached to the mesh surface. This caused the particles to transfer along with the rinse water and then flow into a stainless-steel tray positioned beneath the sieve. Rinse water containing larger particles (≥300 μm) in the tray was passed directly into an incubator. Contrarily, the rinse water containing smaller particles (45–300 μm) was transferred first into a 250 mL glass jar, and then stored and incubated. The incubator (SP-650; ADVANTEC, Tokyo, Japan) was set at 40 °C until both losses of water content eased, and the preparation for further analysis was completed.
Here, the large MPs particle size cut off was set at ≥0.3 mm due to mesh/filtration limitations, while smaller MPs (45–300 μm) were quantified separately as carbon mass using TOC Analysis with a 45 μm cut off following Hong [45]. This methodological choice enabled capturing both large visible particles and the finer friction, but through different approaches.
2.3. Sample Analysis
2.3.1. Larger MPs (≥300 μm): Sorting, Quantification, and Polymer Characterization
By assessing the fluorescence properties of plastics particles through the illumination of ultraviolet light (UV light) illumination [46,47,48], MPs sized ∼1–5 mm can be detected by visual inspection [49]. A UV flashlight (Alonefire SV57 (Alonefire, Shenzhen, China), 365 nm wavelength) and stainless-steel tweezers were used in combination to perform manual sorting of the larger group particles. Black particles suspected to originate from tires were excluded based on their distinct non-fluorescent appearance. To minimize contamination, the procedure was performed in the absence of air conditioning mode to reduce air flow; all samples were covered whenever possible during handling and resting periods. Laboratory blanks were included throughout the procedure by placing the same type of stainless-steel tray (only five particles were detected in the laboratory, and none were identified as plastic). The suspected plastic particles were grouped based on their longest axis every 1 mm (≥0.3–1 mm, 1–2 mm, 2–3 mm, 3–4 mm, 4–5 mm). The measurements were checked using a 10 cm steel ruler with 1 mm increments. Pharmaceutical-grade wrapping paper (Hakau, 90 × 90 cm) was prepared to store these particles until polymer analysis. For this sorting, only particles visually recognized under UV light were subsequently selected for FTIR analysis. While this preselection step improves efficiency, it may introduce bias by underrepresenting weakly fluorescent MPs that were less easily detected.
Organic and other inorganic materials can be potentially misdiagnosed as plastics based on their fluorescence [47], which may be included in the manual sorting results. Therefore, it is necessary to confirm the plastic composition of the particles and understand the differences between synthetic and natural fibers using polymer analysis [46]. This can be achieved using the identification method of ATR-FTIR or attenuated total reflectance-Fourier transform infrared spectroscopy, which was also implemented by Szwec [41] in their MP deposition study for 27 representative largest particles (up to 5 mm) and Bharath [50] for MPs size ≥ 0.3–5 mm (similar to our study). This method is flexible for large opaque MPs that do not require special pre-treatment [51].
A Spectrum One FTIR spectrometer (PerkinElmer, Shelton, CT, USA) was used for the analysis. Additionally, a Universal ATR accessory was installed. Between reading the measurements, the ATR plate and stainless-steel tweezers were thoroughly pre-cleaned using alcohol to prevent contamination. This machine was set up within 4000–650 cm−1 wavenumber range and a resolution of 0.2 cm−1. The FTIR spectra of each sample were identified with the reference data to IR spectra library from PerkinElmer site [52] and another supporting published reference [53,54]
2.3.2. Smaller MPs (45–300 μm): Sample Pre-treatment and Carbon Concentration Measurement
For quantifying smaller MPs, conventional techniques such as µFTIR, Raman spectroscopy or Pyr-GC/MS are often limited by their labor-intensive particle counting, complex data processing and high time-consuming. To address these constraints, TOC-based carbon has been proposed as a complementary method and shown in accurately quantifying micro-nano plastics from environmental samples [55,56] with 78–98% recovery [45]. It requires simple digestion utilizing Fenton’s reagent to diminish contaminants from non-plastic substances [57] and has been implemented in some micro and nanoplastics studies [45,55].
In this study, Fenton’s reagent (15 mL) was prepared from ferrous sulfate heptahydrate (FeSO4.7H2O) and 30% hydrogen peroxide (H2O2). This solution has a very high oxidation capability to accelerate the degradation of the organic matter for microplastics, and it is suggested by NOAA (National Oceanic and Atmospheric Administration) [43], with the temperature set up below 50 °C for optimal degradation [58]. Here, Fenton’s reagent treatment was conditioned in a 40 °C incubator (SP-650, ADVANTEC), and non-plastic organic matter other than MPs’ carbon intact is removed.
TOC Analyzer (TOC-150, Toray Engineering Co., Ltd., Tokyo, Japan) was used to determine the MPs’ carbon concentration. It was calibrated using standard carbon solutions prepared from Potassium Hydrogen Phthalate (Kanto Chemical Co., Inc., Tokyo, Japan, Cat. No. 32311-20). Sample measurements were checked against these calibration data to ensure accuracy and reproducibility, and the final MP concentrations were obtained by subtracting the values from the average of triplicate experiment controls.
This machine is a liquid-injection-type machine requiring 9 mL of an aqueous sample, prepared by adding distilled water to the dried sample in a glass jar. The TOC-NPOC method directly quantifies the carbon from MPs [59], where the injected sample undergoes acidification, gas purging (to remove inorganic carbon), and thermal oxidation, converting the remaining MPs’ carbon (Non-Purgeable Organic Carbon/NPOC) into CO2. While validation for this method against µFTIR for ordinary MPs exists in earlier work [45], such validation was not performed here, including for the carbon analysis of TRWP, and is acknowledged as a limitation.
2.4. Calculation and Statistical Analysis
MP deposition rates are reported in two units: (i) (pcs/ha/mon) and (ii) (gC/ha/mon). Similar to that of the other deposition studies [30], the deposition of MPs in the fate of particles was calculated from the number of counted particles divided by the opening area of the sampling device and sampling duration. Contrarily, the deposition of smaller group MPs (45–300 μm), which was quantified as carbon concentration (mgC/L), is calculated by the conversion of the concentration of MPs in volume of precipitation (dilution equation) and precipitation area over the period of sampling (monthly). This approach (concentration) may underestimate the actual deposition due to the exclusion of dry deposition, which is a limitation of this study.
A multivariate analysis test with a stepwise method was conducted using IBM SPSS 29 to understand the factors (wind direction, type of vehicles, and precipitation) significant for the characteristics of MPs (polymer type and size) and deposition rate. Here, Pearson’s correlation analysis was used to understand the correlation between two significant variables (p < 0.05). Differences between seasons, months, and sampling sites were identified using the F-test ANOVA.
3. Results and Discussion
3.1. MPs Deposition Rate, Concentration, and Characteristics
3.1.1. Large MPs Particle Deposition Rate (≥0.3–5 mm)
Over the one-year observation period, plastic polymers accounted for the majority (92.7%) of the particles collected, with cellulose comprising 3.6%. This differs from outdoor deposition studies in the coastal cities of China, where larger atmospheric particles were mostly cellulose (60%) [42]. Among the sites, R1 had the highest cellulose content (37%), followed by R2 (20%) and R3 (15%).
MPs sized between 0.3 and 5 mm represented 97% of all polymer particles, whereas only 3% were mesoplastics (>5 mm). Mesoplastic fragments were observed in 5–6 mm (1.5%), 6–7 mm (0.6%), 7–8 mm (0.4%), and 8–9 mm (0.6%) size ranges, with R1 accounting for 56% of them, followed by R2 (31%) and R3 (13%).
Across the sites, the distribution of larger MPs (≥300 μm) was 36.7%, 35.7%, and 27.7% at R1, R2, and R3, respectively. The monthly deposition rate (mean ± SD) was as follows:
- R1: 6,200,000 ± 3,100,000 pcs/ha/mon
- R2: 6,000,000 ± 1,800,000 pcs/ha/mon
- R3: 4,700,000 ± 2,000,000 pcs/ha/mon
When converted to a daily deposition of 1.5–2 pcs/m2/day, our values are comparable to those in Kosovo highway deposits (3 pcs/day in the 2.5–5 mm range) [7] and to Kusatsu-Japan road dust (2.0 ± 1.6 pcs/m2 in the 100–5 mm range) [21]. However, our deposition rate remains lower compared with more recent global atmospheric deposition studies. For example, Musthekwa T [60] reported 211.87 ± 31.44 pcs/m2/day across urban, rural, forest sites in Limpopo, South Africa (0.1–1 mm, microscope–ATR-FTIR). Weber [61] observed 9.1 ± 9.4 pcs/m2/day from throughfall deposition in a forest system in Hesse, Germany (>20 μm, µFTIR Imaging). In India, values ranged from 169.33 ± 51.05 to 615.23 ± 101.50 pcs/m2/day (Nagpur-urban, 65–11,370.8 µm, Stereomicroscope–ATR-FTIR) [62], while in China, deposition reached 18.73 to 490.9 pcs/m2/day (Wuhan, <0.5 mm and 0.5–1.0 mm, μ-Raman) [63].
The observed variation among studies likely stems from differences in the collection methods, analytical tools, and environmental conditions (Table 1). For example, Cakaj et al. [7] analyzed both wet and dry deposition using a stereomicroscope, while Jenner et al. [8] examined only a quarter of the filter using μ-FTIR from a bulk sample. These differences highlight the importance of methodological consistency in MP studies [64]. Most previous studies included particles down to 20–100 μm, whereas our study applied a cut-off at ≥0.3 mm forlarge MPs, meanwhilesmaller MPs were quantified separately as carbon mass (gC/ha/month—Section 3.1.2). Thus, our comparatively low rates are primarily explained by size exclusion rather than reduced atmospheric deposition.

Table 1.
Literature summary on road microplastic deposition rate.
Table 1.
Literature summary on road microplastic deposition rate.
| Source | Country—Site MPs Particle Size | MPs Deposition Rate b | Method |
|---|---|---|---|
| [7] | Kosovo—Highway 0.5–5 mm | 107.7 pcs/day | Microscope |
| [8] | UK-Roadside 5–50 µm | 603–3617 pcs/m2/day | μ-FTIR imaging |
| [34] a | USA—Low-traffic Road 10–80 μm | 59 × 104 pcs/m2/day | Optical microscopy, μ-ATR-FTIR |
| [10] | Bangladesh—Streets 1–1000 μm | 1.11–5.78 × 10⁶ pcs/m2/day | Microscope, μATR-FTIR |
| Japan—Roadside 0.3–5 mm (Large MPs) 45–300 μm (Small MPs) | 1.5–2 pcs/m2/day 72.2 gC/ha/month | Visual Inspection, ATR-FTIR TOC Analysis (NPOC) |
a Tire–road wear particle: specific density 1.8 g/cm3; b pcs = particles of MPs.
3.1.2. Small MPs Deposition Rate (45–300 μm)
Smaller MPs (45–300 μm) showed a similar trend across the sites, with relative distributions of 51% (R1), 25% (R2), and 24% (R3). The corresponding monthly carbon deposition rates were (mean ± SD) R1 (109.92 ± 220.52 gC/ha/mon); R2 (54.08 ± 91.18 gC/ha/mon); R3 (52.54 ± 61.85 gC/ha/mon). A visual overview of the small MPs deposition trends is shown in Figure 2.
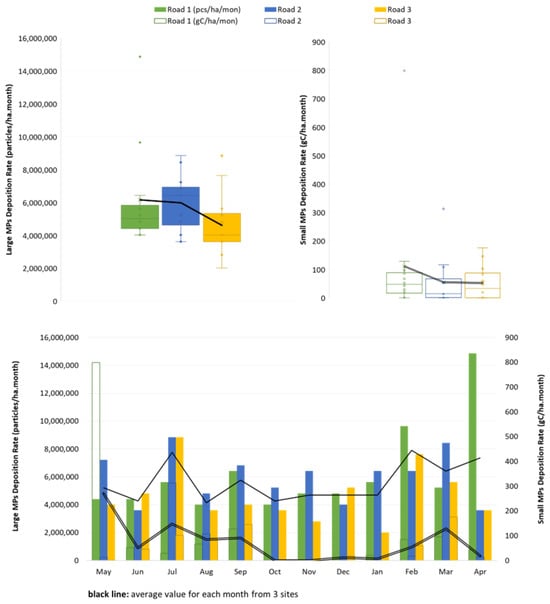
Figure 2.
Microplastic deposition rate: large MPs (0.3–5 mm, upper left) and small MPs (45–300 μm, upper right) by site, with monthly deposition (bottom).
Although carbon concentration is not a commonly reported metric in atmospheric MPs studies, this approach provides new insights into the potential role of MPs in carbon cycling. These results contribute to understanding the environmental impacts of MPs on soil and aquatic systems. While validation for this method against µFTIR exists in earlier work [45], this validation was not performed here and is acknowledged as a limitation.
MP deposits from the atmosphere can contaminate both terrestrial and aquatic environments [16,17]. They may also affect carbon dynamics in several ways: releasing CO2 and methane during degradation [65,66,67], reducing carbon sequestration [65,68,69], or acting as airborne vectors of CO2 and other pollutants [70]. Polyethylene terephthalate (PET), for instance, can absorb gases, while MPs may interfere with plant respiration by altering CO2 uptake [69,71,72]. Eventually, MPs settle in soils where they can persist for long periods. For instance, MPs (<300 μm) were found at 2.62 ± 0.66 mgC/kg in Korean soils [73] and 4.8 ± 0.8 mgC/L in sewage influent [45].
Overall, R1 exhibited the highest carbon concentration and particle count, followed by R2 and R3 (Figure 2). These site differences are explored in more detail in the next section (Section 3.2).
3.1.3. Large MPs Size Distribution
The dominant particle sizes observed were as follows: ≥0.3–1 mm (46%), 1–2 mm (31%), 2–3 mm (13%), 3–4 mm (7%), 4–5 mm (3%) (Figure 3). Detailed monthly and site-specific distributions are shown in Figure 3. All five sizes were detected at each site, with the smallest two categories (≥0.3–1 mm and 1–2 mm) dominating across all locations, which is consistent with results from previous studies where smaller particles were found to be more abundant [7,8]. For example, in the Kosovo highway study, only three MPs larger than 2.5 mm were found among 107.7 MPs/day, indicating that smaller particles dominate atmospheric deposition [7]. Similar findings (Table 2) were reported for the road dust and runoff samples in Japan, where particles sized <500 μm were most abundant [17,21]. International studies have similarly shown that fine MPs (20–100 μm) dominate in both atmospheric and wet deposition samples [74,75]. These findings about the smaller dominant sizes of MPs are also consistent with other observations from atmospheric MPs deposition studies [11,33,43,45].
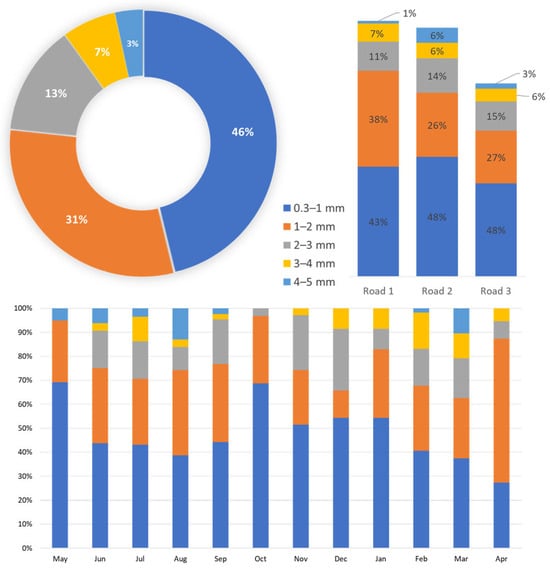
Figure 3.
Large MPs (≥300 μm)—Size distribution: total (upper left—pie chart), by sites (upper right), monthly distribution (bottom).
This happened likely due to continuous fragmentation and degradation processes caused by UV exposure, mechanical stress, and road abrasion [3,4,5,6,76]. Smaller MPs are more mobile, can remain airborne for a longer period, and travel farther [74].
Table 2.
Literature summary on polymers and sizes of road/air-related MPs study.
Table 2.
Literature summary on polymers and sizes of road/air-related MPs study.
| Sample Type (Country—Site) | Main Polymers 1 | Size | Method |
|---|---|---|---|
| Atmosphere deposits—bulk Japan—Yokohama This Study | PVC, PE, PET, PVAC, PA11.12, PA6/66, PP, PS, PU | ≥0.3–5 mm | ATR-FTIR |
| Atmosphere deposits—bulk (UK-Roadside) [8] | PE, Nylon, PET, PP, RES | 5–50 µm | μ-FTIR |
| Atmosphere deposits—dry (Bangladesh -Streets) [10] | PE, Nylon | 1–1000 μm | μATR-FTIR |
| Atmospheric fallout on soil (Turkey—Bus Terminal) [77] | PA 6, PES, PU, PE-PP | >20 μm | ATR-FTIR |
| Road dust (Japan—Kumamoto, Okinawa, Tokyo) [29] | PDAP, PVC, PMMA, PE, PES, PCS, PP, PVA, PET, PS | >300 μm | ATR-FTIR |
| Road dust (Japan—Kusatsu) [21] | PE, PS, PET, PP, PU, EDPM, SBR, EPC, PVS, PAK | 100–5 mm | ATR-FTIR |
| Road dust (Japan—Kusatsu) [13] | PE, PVC, SBR, PS, ABS, PA66, PMMA, PP, PC | 1.1–850 μm | Pyr-GC/MS |
| Road dust (Australia—Queensland) [78] | PP, PS, PET, PVC, PMMA, PE | 250–5 mm | Pyr-GC/MS |
| Highway runoff water (Japan) [17] | PEPD, PEP, PET, PS, PE, PP | 10–5 mm | μ-FTIR |
| Active Sampling Sample [79] (Japan—Urban 50 m from road) | PE, PS, PET, PA66 | 0.43–11 μm | Pyr-GC/MS |
| Active Sampling Sample [80] (Japan—Urban, Rural, Remote) | PE, RES, PA, PVA, PP, PET, PS, PVAC, PPS, PU, PE/PP, PS/PVC | 3.3–17.9 μm | μ-Raman |
1 PE (polyethylene), PET (polyethylene terephthalate), PP (polypropylene), RES (resin), PDAP (polydiallylphthalate), PA6/66 (Polyamide), PES (polyester), PU (polyurethane), PDAP (poldiallyl phthalate), PVC (polyvinyl chloride), PMMA (polymethyl methacrylate), PCS (poly(alpha-chloroacrolein-co-styrene), PVA (polyvinyl alcohol), PVAC (polyvinyl acetate), PPS (polyphenylene sulfide), PS (polystyrene), SBR (styrene/butadiene rubber), EPC (ethylene/propylene copolymer), PVS (polyvinyl stearate), PAK (polyacrylate), ABS (acrylonitrile/butadiene/styrene resin), PC (Polycarbonate), PEPD (polyethylene polypropylene diene), and PEP (polyethylene–polypropylene copolymer).
3.1.4. Large MPs Polymer Type
Nine polymers were identified, with polyvinyl chloride (PVC) being the most prevalent (76.1%), followed by polyethylene (PE, 7.8%), polyethylene terephthalate (PET, 6.2%), polyvinyl acetate (PVAC, 3.6%), polyamide 11 and 12 (PA11.12, 2.4%), polyamide 6 and 66 (PA6/66, 2.0%), polypropylene (PP, 1.8%), polystyrene (PS, 0.2%), and polyurethane (PU, 0.2%). The polymer distribution varied slightly among sites and months (Figure 4).
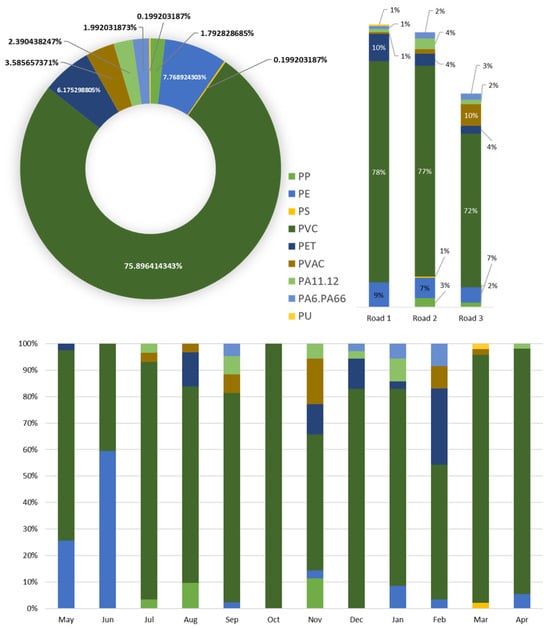
Figure 4.
Large MPs (≥300 μm)—Polymer type distribution: total (upper left—pie chart), by sites (upper right), monthly distribution (bottom). Abbreviations: PP (polypropylene), PE (polyethylene), PS (polystyrene), PVC (polyvinyl chloride), PET (polyethylene terephthalate), PVAC (polyvinyl acetate), PA11.12, PA6/66 (Polyamide), PES (polyester), PU (polyurethane).
During the study period, PVC and PE were among the top three plastic products sold in Japan, excluding PVAC, with approximately 1,864,874 tons of PVC and 2,519,259 tons of PE produced [81]. This suggests a possible relationship between market demand and the generation of MPs from these polymers.
Focusing on previous roadside MPs monitoring studies, variations in detected polymers are discussed in this part. PE, PET, PP, PS, and PA were present in road air deposits in the UK, Bangladesh, and Turkey [8,10,77]. In Japan, all the polymers we identified were also reported in road dust and runoff water [13,17,20,21,29]. Five polymers (PE, PP, PB, PS, and PA) were detected by active air sampling along high-traffic roads near university areas in Turkey [35]. Using a similar method on a rooftop 50 m from a major road in Kyoto, Japan, the presence of PE, PS, PET, and PA66 [76], and PVAC was also confirmed in the Japanese air sample [80].
Plastic materials used in road environments vary widely and, like other anthropogenic plastics, can fragment over time. By analyzing PVC MPs additives in road dust samples, it was found that Japanese road markings contained similar plasticizers to those found in PVC resins, indicating that road paint is a major source of PVC pollution in roadside areas [29]. High PVC abundances in road dust samples from Kumamoto, Japan, were also reported in both 2020 [29] and 2024 [20], consistent with the high frequency observed in this study.
PVC is typically used in plumbing or piping works and highway deliniators [20,82] as well as in buildings and consumer products such as toys, food contact articles, and furniture [83]. During the study period, a high-rise building construction project was underway near the sampling area, which may have contributed to the increased presence of PVC and other polymers in the samples.
Compared with other thermoplastics, PVC is more carcinogenic, contains hazardous additives, and is easily fragmented, yet it remains widely used [84]. PE, PS, and PET are classified as general-purpose plastics [4,79] while PA, commonly used in textiles [79] also applied in the automotive industry for finishing gears and tires [85]. Yukioka [21] categorized PE, PP, PS, and PET as container-packaging MPs and PU as rubber MPs. A minor portion of PU is used in road-marking paint along with acrylic and PES in several European countries [82]. PE can be used in highway cones, sheets, and anti-vibration materials as well [17]. According to this order, PU > PVC > PAN > ABS > PMMA > TPU > UP > PET > PS > HDPE, these polymers exhibit varying levels of potential marine hazard [86]; notably, four of the nine polymers detected in this study are among the top-ranked hazardous ones. PVAC, though frequently detected, poses a lower environmental risk due to its easy degradability and low toxicity [86]. It is commonly incorporated into adhesives (for example, white glue), paints, and coatings [87].
3.1.5. Large MPs Polymer Distribution by Size
The vulnerability of MPs depends on their polymer type and their degradability [86], which can be reflected in their size distribution. Figure 5 presents the size distribution of each polymer type collected across all sites.
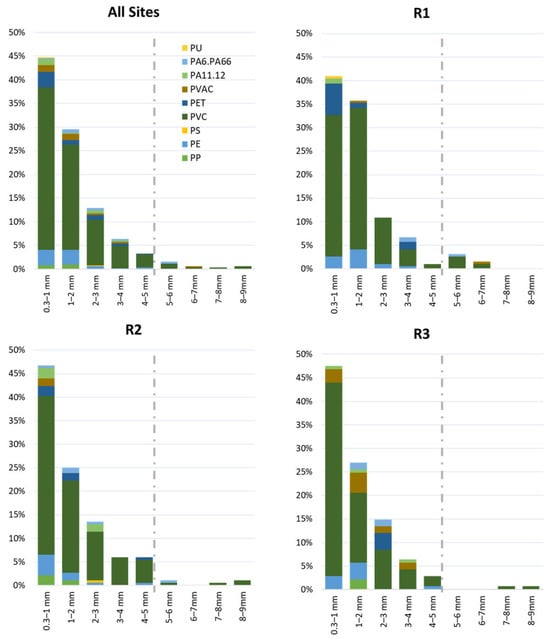
Figure 5.
Size distribution of large MPs polymer types across all sites and individual sites (R1, R2, R3). Abbreviations: PP (polypropylene), PE (polyethylene), PS (polystyrene), PVC (polyvinyl chloride), PET (polyethylene terephthalate), PVAC (polyvinyl acetate), PA11.12, PA6/66 (Polyamide), PES (polyester), and PU (polyurethane).
Overall, all polymers tended to be more abundant in the smaller size fractions, consistent with the general particle size distribution pattern. Most polymers appeared within the MPs’ size range; however, PVC, PVAC, and PA6/66 were also detected in the mesoplastic range. This suggests that widely used polymers like PVC can originate from various materials in the surrounding environment, while PA6/66 is likely derived from daily clothing, and PVAC from fragmented road paint or construction materials.
PVC, the most prevalent MP polymer, exhibited a consistent decrease in abundance with increasing particle size, but it remained dominant across all size fractions, including mesoplastic. Interestingly, in the 8–9 mm fraction, PVC particle counts exceeded those in smaller size fractions (6–8 mm), indicating possible accumulation in larger sizes.
In contrast, PP, PE, and PA6/66 did not always follow this trend. PP was found only in two size fractions (≥0.3–1 mm and 1–2 mm). PE showed a slight reversal between 3 and 4 mm and 4–5 mm, although the trend was consistent in the smaller size range (≥0.3–3 mm). PA6/66 had a lower number of particles in the ≥0.3–1 mm fraction compared with 1–2 mm, but followed a similar trend in larger fractions. PU was only present in size ≥0.3–1 mm, consistent with its suspected origin as rubber MPs, originating from the continuous abrasion of vehicle rubber or road paint, which may explain the occurrence of smaller sizes.
3.2. Factors Affecting MPs’ Deposition and Characteristics
3.2.1. Sampling Sites (Distance from Road)
Deposition data for both large (≥0.3–5 mm) and small MPs (45–300 μm) were analyzed across all three sampling sites (R1, R2 and R3). Road A has a higher traffic volume than Road B, including all motorized vehicle types, but excluding bicycles. The overall deposition pattern (Figure 2) generally agrees with the findings of Gao et al. [34], suggesting that road proximity may influence particle deposition. Since sampling site R1 is the closest to Road A, we hypothesized that heavier traffic would result in higher MP deposition rates.
Although a slight tendency toward higher deposition near the busier road was observed, the ANOVA test revealed no statistically significant differences among the three sites for either large (F2,33 = 1.46, p = 0.25) or small MPs (F2,33 = 0.63, p = 0.54). These non-significant site-to-site variations alone cannot fully explain the observed pattern, likely due to the similar background environment at the sampling sites, the complex setting of the study area—where two roads intersect—and the combined influence of traffic and meteorological conditions.
Previous studies suggested that the distribution of MP polymer types and sizes is influenced by the distance from sources [88], and that changes in wind direction can alter the origin of MP [31]. Therefore, three main factors were considered in this study: traffic volume/vehicle type, precipitation, and wind frequency per direction. A multivariate assessment was conducted to evaluate the influence of each factor on MP deposition rates and characteristics, while accounting for interactions among them. The results (Table S1–S3) indicated that precipitation was statistically insignificant, as no variables related to it entered the models, even when combined with wind and traffic variables, highlighting vehicle activity and wind dynamics as the dominant drivers of MPs deposition.
The observations set the stage for the detailed analysis in Section 3.2.2 and Section 3.2.3, where the individual contributions of traffic patterns and metrological conditions on MP deposition are examined further.
3.2.2. Traffic Volume and Vehicle Type Influence
The influence of traffic volume and vehicle type on MPs deposition was examined using Pearson’s correlation analysis, with results presented in Figure 6. Only statistically significant correlations (p < 0.05, n = 12) are shown with their respective correlation coefficient (r). Overall traffic volume on both roads was not significantly correlated with MPs deposition in either size fraction. However, when examined by vehicle type, cars and larger vehicles (buses and trucks) showed a positive correlation with MP deposition, whereas smaller vehicles, such as bicycles, showed negligible or negative relationships.
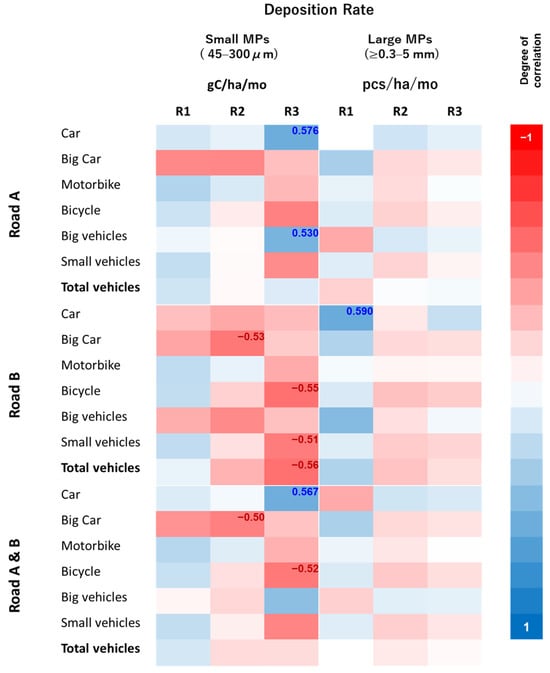
Figure 6.
Vehicles to deposition rate correlation heatmap. Only significant correlations are shown with the correlation coefficient (r).
Vehicle movement pattern strongly affected deposition behavior. Road A crosses the sampling area, generating greater turbulence, while Road B runs parallel to the sites (Figure 1). For small MPs, the strongest correlations were observed at R3, particularly with cars and large vehicles from Road A. Wind turbulence generated by the busy crossing from the vehicles likely enhanced particle transport toward this site. However, the vehicle-related variables were not retained in the multivariate model, showing that the natural wind blows interrupted the form of deposition. In contrast, traffic flow on Road B showed a negative correlation with small-particle deposition, suggesting that wind generated by parallel-moving vehicles may have displaced small MPs away from the samplers, reducing their accumulation.
For larger MPs, a positive correlation was detected between cars on Road B and MPs deposition at R1 (see Figure 2), even after accounting for wind and precipitation effects in a multivariate model (β = 7519.22, p = 0.001, r = 0.589 *). Larger particles are less influenced by turbulence and tend to settle when vehicles decelerate—such as at intersections- consistent with previous studies on tire wear particles deposition [34].
Across all sampling sites, the deposition of large MPs composed of PET and nylon-based polymer (PA6/66; PA11/12) exhibited strong positive relationship with vehicle activity, particularly car counts on Road B. Regression models indicated that cars from Road B significantly predicted PET deposition (β = 0.01, p = 0.0001, R2 = 0.95, r = 0.669 ** at R1) and PA6/66 deposition (β = 0.002, p = 0.00004, R2 = 0.9, r = 0.696 ** at R2). These results suggest that vehicles—especially cars and heavy vehicles—play a stimulating role in the presence of these polymers, although they may not be the sole sources. PET and nylon are widely used in packaging, bottles, and textiles, and the higher influence observed along Road B (a university road) likely reflects additional input from local human activity. Frequent vehicle movement may resuspend existing PET and nylon particles from road dust, increasing their deposition fluxes. A previous study on road atmospheric deposition also found that roads with high trunk traffic had unexpectedly lower MP depositions than those in roads with higher human activity [8], highlighting the complex and variable nature of traffic-related MP release and transport dynamics.
Traffic on Road B, particularly from cars, was also significantly associated with the deposition of large MPs in the ≥0.3–1 mm (β = 0.01, p = 0.004, r = 0.670 **), 1–2 mm (β = 0.002, p = 0.02, r = 0.245), 2–3 mm (β = 0.002, p = 0.03, r = 0.630 *) size ranges. The 4–5 mm fraction was influenced by cars on both Roads A and B (β = 0.00006, p = 0.003, r = 0.694 **). MPs of small to large sizes were present at all sites (Figure 3), indicating continuous fragmentation and resuspension. The parallel vehicle motion on Road B may have generated similar effects on the deposition of both smaller and larger MPs within the large-size fraction. Although particle size generally governs settling behavior [89], this observed pattern does not appear to significantly influence the relationship between vehicle activity on Road B and MP size distribution. We hypothesize that the number and types of vehicles contribute to fragmentation. Fragmentation likely occurs near Road A, with heavier traffic promoting breakage into smaller particles, resulting in smaller fractions being more abundant at R1.
Overall, these findings demonstrate that MP deposition rates, large MPs polymer composition, and particle size distribution are jointly influenced by vehicle type, movement pattern, and road orientation. Turbulence from crossing traffic enhances the transport of small particles, cars and heavy vehicles promotes PET and nylon accumulation, and parallel flows sustain resuspension and deposition across multiple large-MP size ranges.
3.2.3. Meteorological Influences
Meteorological factors such as precipitation and wind are important drivers of atmospheric MPs deposition. We also assessed seasonal differences in MP deposition, but no statistically significant seasonal variation was observed across the three sites.
- -
- Small MPs: (R1: F3,8 = 1.18, p = 0.38; R2: F3,8 = 2.8, p = 0.11, R3: F3,8 = 0.28, p = 0.84).
- -
- Large MPs: (R1: F3,8 = 0.72, p = 0.57; R2: F3,8 = 0.1, p = 0.96; R3: F3,8 = 0.65, p = 0.61).
No significant correlation was found between precipitation and MP deposition at any site (p > 0.05), and precipitation variables were not retained in the multivariate model. This aligns with the results of bulk deposition studies by Klein and Fischer [40], Welsh et al. [31] and of the deposition in the road area study by Jenner et al. [8].
Small MPs showed a weak positive correlation (rR1 = 0.29, rR2 = 0.196, rR3 = 0.319, p > 0.05) and large MPs showed a weak negative correlation (rR1 = −0.168, rR2 = −0.234, rR3 = −0.09, p > 0.05). Although not statistically significant, these trends suggest that precipitation may slightly reduce large particles through scavenging, whereas small MPs may remain suspended or accumulated due to runoff or temporary suspension. Wu et., al [90] reported that removal of particles less than 2.5 μm is more efficient with wet deposition. This explanation provides context but does not confirm a strong trend in our study.
Wind intensity and direction were analyzed in combination with traffic and precipitation. Wind emerged as the dominant driver of MPs deposition at sites farther from the main road (R2–R3):
- -
- Large MPs: R1 (SSW wind, β = 44,560.9, p = 0.007, r = 0.268), but more strongly at R2–R3 (E wind β = 115,381.01, p = 0.001, r = 0.697 **—ESE wind β = 119,645.98, p = 0.042, r = 0.594 *).
- -
- Small MPs: R2–R3 (ESE wind β = 6.06, p = 0.023, r = 0.645 *—NE wind β = 5.04, p = 0.029, r = 0.630 *)
Mostly winds coming from along east direction and were identified as the most influential in this study (Figure 7), considering the location of the nearest meteorological measurement station to the observed road (TCU, Tokyo City University), as shown in Figure 7. These eastern wind directions were significantly positively correlated with microplastics deposition in major diameters of ≥0.3 mm and 45–300 μm, providing strong, coherent evidence for their influence. The winds from those directions passing the built-up areas were associated with anthropogenic activities [30], as shown by the land cover map [91], which is more dominant in the reddish color of built-up cover. Additionally, Tokyo Metropolitan City, Kawasaki City, and Yokohama City are located east of the sampling sites, near the coastal area of Tokyo Bay (approximately 20 km), where population density is higher than in western, northern, and southern areas. The high wind frequencies in these directions also suggest potential transport from marine sources [11]. Sea breeze was documented to release MPs from the ocean surfaces [92], and the Pacific Ocean east of Yokohama was identified as a contributor to transboundary marine MP transport to Asian countries, and approximately contributes to 7% of the total marine MP pollution per year [93].
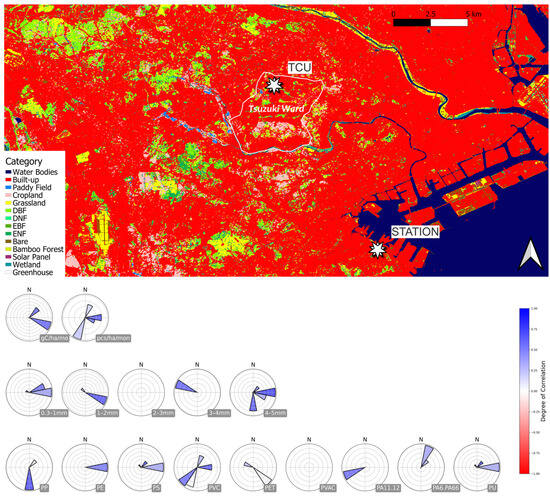
Figure 7.
Land cover map showing the sampling point at TCU (Tokyo City University, Yokohama Campus) and the meteorological station, with wind rose plots illustrating significant wind directions for MPs deposition (gC/ha/mon for small MPs; pcs/ha/mon for large MPs) and large MPs characteristics (size fractions and polymer types). Additional abbreviations: DBF = Deciduous Broadleaf Forest; DNF = Deciduous Needleleaf Forest; EBF = Evergreen Broadleaf Forest; ENF = Evergreen Needleleaf Forest; N = North.
Wind direction also influenced the deposition of certain polymers:
- -
- PVC showed a strong association with easterly winds at R2 (β = 0.4, p = 0.0001, R2 = 0.84, r = 0.699 **)
- -
- PS and PU were linked with north-easterly and north-westerly winds at R2 (β = 0.03, p <0.001, R2 = 0.9, r = 0.693 **).
These findings suggest that wind not only disperses particles but also shapes deposition patterns by transporting MPs from surrounding industrial or anthropogenic sources into the sampling sites. For example, for PVC and PU, typically associated with road and vehicle properties, their strong correlation with wind suggests additional sources along connected road networks.
Most dispersion occurred under easterly wind (NE, E) and southerly (S) winds, supporting a potential connection with nearby industrial zones situated in the south of the study area/Tsuzuki ward [37,38].
Regarding particle size, deposition of 4–5 mm and 1–2 mm MPs were primarily influenced by winds from the east, E (β = 0.04, p = 0.00001, R2 = 0.91, r = 0.801 ** at R3) and east–southeast, ESE (β = 0.1, p = 0.0036, R2 = 0.91, r = 0.713 ** at R3), respectively. Although easterly (E) winds were less frequent than from ESE winds, they appeared capable of transporting larger MP particles (4–5 mm), resulting in fewer but heavier deposited particles. This pattern may reflect the higher settling velocity of large particles, which tend to deposit before reaching collection devices. In contrast, smaller particles can remain airborne for longer periods and travel greater distances under sustained wind conditions.
4. Conclusions
This study evaluated roadside atmospheric microplastics (MPs) deposition in Japan by separating small (45–300 μm) and large (≥0.3–5 mm) fractions, collected monthly over one year from three points (R1-R3) along the same roadside transect. By integrating traffic and meteorological influences and adapting TOC-based carbon quantification for small particles, this study provides new insights into atmospheric roadside MP dynamics. Large MPs ranged from 3 to 9 million pcs/ha/month, while small MPs averaged 72.2 gC/ha/month. Nine polymer types were identified in large fractions (PP, PE, PS, PVC, PET, PVAC, PA11.12, PA6/66, and PU). PU detection indicates contributions from vehicle-related sources.
Precipitation did not significantly affect the MPs’ deposition. Traffic activity strongly affected large MPs deposition near the roads and intersection, with PET and nylon (PA6/66, PA11/12) in the ≥0.3–5 mm range, particularly associated with vehicles and the parallel movement of vehicles producing similar particles size distribution between sites, while the effect on small MPs was negligible. In contrast, wind direction and intensity strongly affected small MPs deposition, enhancing their dispersal potential, influencing the transport of large particles including PVC, PS and PU. Significant eastern winds associations also suggest additional contributions from industrial and other anthropogenic activities as well as Pacific Ocean as MPs source. These results highlight that vehicle activity and wind dynamics jointly shape the deposition and distribution of MPs, with traffic dominating large particle deposition and wind driving the dispersal of smaller particles and select polymers.
Future research should build on these findings by addressing the limitations of the current studies: including finer MPs (<0.3 mm) to better generalize results across atmospheric MP studies; cross-validating TOC-based quantification of small MPs with μ-FTIR, Pyr-GC/MS, or Raman spectroscopy to strengthen specificity; additionally, expanding environmental and health assessments, particularly regarding inhalable MP fractions (PM10/PM2.5), is highly recommended.
Supplementary Materials
The following supporting information can be downloaded at the following link: https://www.mdpi.com/article/10.3390/microplastics5010017/s1. Table S1: Precipitation + Vehicles + Wind Frequency -> Deposition Rate. Table S2: Precipitation + Vehicles + Wind Frequency -> Large MPs Polymers Characteristics. Table S3: Precipitation + Vehicles + Wind Frequency -> Large MPs Size Fraction Distribution Characteristics.
Author Contributions
Conceptualization, Y.-S.H.; methodology, Y.-S.H.; software, Y.-S.H.; validation, Y.-S.H. and A.N.L.; formal analysis, A.N.L. and Y.-S.H.; investigation, A.N.L. and Y.-S.H.; resources, Y.-S.H.; data curation, A.N.L. and Y.-S.H.; writing—original draft preparation, A.N.L. and Y.-S.H.; writing—review and editing, A.N.L., Y.-S.H. and Z.K.O.; visualization, A.N.L. and Y.-S.H.; supervision, Y.-S.H.; project administration, Y.-S.H.; funding acquisition, Y.-S.H. All authors have read and agreed to the published version of the manuscript.
Funding
This research received no external funding.
Institutional Review Board Statement
Not applicable.
Informed Consent Statement
Not applicable.
Data Availability Statement
The data will be made available by the authors on request.
Acknowledgments
The authors sincerely acknowledge and are grateful for the support from the staffs in the Department of Facilities of Tokyo City University Yokohama Campus for providing the essential data of traffic record and the staffs from Interdisciplinary Research Center for Nano Science and Technology, Tokyo City University-Setagaya Campus for assisting with the FTIR analysis.
Conflicts of Interest
The authors declare no conflicts of interest.
References
- Amato-Lourenço, L.F.; Carvalho-Oliveira, R.; Júnior, G.R.; Dos Santos Galvão, L.; Ando, R.A.; Mauad, T. Presence of airborne microplastics in human lung tissue. J. Hazard. Mater. 2021, 416, 126124. [Google Scholar] [CrossRef] [PubMed]
- Wang, S.; Lu, W.; Cao, Q.; Tu, C.; Zhong, C.; Qiu, L.; Li, S.; Zhang, H.; Lan, M.; Qiu, L.; et al. Microplastics in the Lung Tissues Associated with Blood Test Index. Toxics 2023, 11, 759. [Google Scholar] [CrossRef] [PubMed]
- Gao, J.; Wang, L.; Wu, W.-M.; Luo, J.; Hou, D. Microplastic generation from field-collected plastic gauze: Unveiling the aging processes. J. Hazard. Mater. 2024, 467, 133615. [Google Scholar] [CrossRef] [PubMed]
- Kataoka, H.; Tanaka, S.; Okamoto, M.; Yukioka, S.; Ikuta, K.; Takada, H. Fragmentation Behavior of Microplastics from Plastic Products on Road Surface. J. Jpn. Soc. Civ. Eng. Ser. G Environ. Res. 2021, 77, III_269–III_275. [Google Scholar] [CrossRef]
- Li, K.; Yu, K.; Zhang, Y.; Du, H.; Sioutas, C.; Wang, Q. Unveiling the mechanism secret of abrasion emissions of particulate matter and microplastics. Sci. Rep. 2024, 14, 23710. [Google Scholar] [CrossRef]
- Van Os, M.F.; Nooijens, M.G.A.; Van Renesse Van Duivenbode, A.; Tromp, P.C.; Höppener, E.M.; Grigoriadi, K.; Boersma, A.; Parker, L.A. Degradation rates and ageing effects of UV on tyre and road wear particles. Chemosphere 2025, 372, 144121. [Google Scholar] [CrossRef]
- Cakaj, A.; Lisiak-Zielińska, M.; Drzewiecka, K.; Budka, A.; Borowiak, K.; Drapikowska, M.; Cakaj, A.; Qorri, E.; Szkudlarz, P. Potential Impact of Urban Land Use on Microplastic Atmospheric Deposition: A Case Study in Pristina City, Kosovo. Sustainability 2023, 15, 16464. [Google Scholar] [CrossRef]
- Jenner, L.C.; Sadofsky, L.R.; Danopoulos, E.; Chapman, E.; White, D.; Jenkins, R.L.; Rotchell, J.M. Outdoor Atmospheric Microplastics within the Humber Region (United Kingdom): Quantification and Chemical Characterisation of Deposited Particles Present. Atmosphere 2022, 13, 265. [Google Scholar] [CrossRef]
- Hernández-Fernández, J.; Puello-Polo, E.; Trilleras, J. Characterization of Microplastics in Total Atmospheric Deposition Sampling from Areas Surrounding Industrial Complexes in Northwestern Colombia. Sustainability 2022, 14, 13613. [Google Scholar] [CrossRef]
- Islam, M.T.; Roy, S.; Nahian, S.; Zaman, S.U.; Salam, A. Microplastics in the Atmospheric Deposited Dust Collected from Different Traffic Intersections in Dhaka City: Microplastics in the Atmospheric Deposited Dust. Dhaka Univ. J. Sci. 2024, 72, 7–14. [Google Scholar] [CrossRef]
- Allen, S.; Allen, D.; Phoenix, V.R.; Le Roux, G.; Durántez Jiménez, P.; Simonneau, A.; Binet, S.; Galop, D. Atmospheric transport and deposition of microplastics in a remote mountain catchment. Nat. Geosci. 2019, 12, 339–344. [Google Scholar] [CrossRef]
- Ding, Y.; Zou, X.; Wang, C.; Feng, Z.; Wang, Y.; Fan, Q.; Chen, H. The abundance and characteristics of atmospheric microplastic deposition in the northwestern South China Sea in the fall. Atmos. Environ. 2021, 253, 118389. [Google Scholar] [CrossRef]
- Morioka, T.; Tanaka, S.; Yamada, Y.; Yukioka, S.; Aiba, F. Quantification of microplastic by particle size down to 1.1 μm in surface road dust in an urban city, Japan. Environ. Pollut. 2023, 334, 122198. [Google Scholar] [CrossRef] [PubMed]
- Dong, C.-D.; Chen, C.-W.; Chen, Y.-C.; Chen, H.-H.; Lee, J.-S.; Lin, C.-H. Polystyrene microplastic particles: In vitro pulmonary toxicity assessment. J. Hazard. Mater. 2020, 385, 121575. [Google Scholar] [CrossRef] [PubMed]
- Goodman, K.E.; Hare, J.T.; Khamis, Z.I.; Hua, T.; Sang, Q.-X.A. Exposure of Human Lung Cells to Polystyrene Microplastics Significantly Retards Cell Proliferation and Triggers Morphological Changes. Chem. Res. Toxicol. 2021, 34, 1069–1081. [Google Scholar] [CrossRef]
- Imbulana, S.; Tanaka, S.; Oluwoye, I. Quantifying annual microplastic emissions of an urban catchment: Surface runoff vs wastewater sources. J. Environ. Manag. 2024, 360, 121123. [Google Scholar] [CrossRef] [PubMed]
- Sugiura, M.; Takada, H.; Takada, N.; Mizukawa, K.; Tsuyuki, S.; Furumai, H. Microplastics in urban wastewater and estuarine water: Importance of street runoff. Environ. Monit. Contam. Res. 2021, 1, 54–65. [Google Scholar] [CrossRef]
- Halle, L.L.; Palmqvist, A.; Kampmann, K.; Khan, F.R. Ecotoxicology of micronized tire rubber: Past, present and future considerations. Sci. Total Environ. 2020, 706, 135694. [Google Scholar] [CrossRef]
- Vercauteren, M.; Semmouri, I.; Van Acker, E.; Pequeur, E.; Van Esch, L.; Uljee, I.; Asselman, J.; Janssen, C.R. Assessment of road run-off and domestic wastewater contribution to microplastic pollution in a densely populated area (Flanders, Belgium). Environ. Pollut. 2023, 333, 122090. [Google Scholar] [CrossRef]
- Yamahara, S.; Kubota, R.; Tun, T.Z.; Nakata, H. Source traceability of microplastics in road dust using organic/inorganic plastic additives as chemical indicators. Sci. Total Environ. 2024, 932, 172808. [Google Scholar] [CrossRef]
- Yukioka, S.; Tanaka, S.; Nabetani, Y.; Suzuki, Y.; Ushijima, T.; Fujii, S.; Takada, H.; Van Tran, Q.; Singh, S. Occurrence and characteristics of microplastics in surface road dust in Kusatsu (Japan), Da Nang (Vietnam), and Kathmandu (Nepal). Environ. Pollut. 2020, 256, 113447. [Google Scholar] [CrossRef]
- Abbasi, S.; Keshavarzi, B.; Moore, F.; Turner, A.; Kelly, F.J.; Dominguez, A.O.; Jaafarzadeh, N. Distribution and potential health impacts of microplastics and microrubbers in air and street dusts from Asaluyeh County, Iran. Environ. Pollut. 2019, 244, 153–164. [Google Scholar] [CrossRef] [PubMed]
- Huang, W.; Song, B.; Liang, J.; Niu, Q.; Zeng, G.; Shen, M.; Deng, J.; Luo, Y.; Wen, X.; Zhang, Y. Microplastics and associated contaminants in the aquatic environment: A review on their ecotoxicological effects, trophic transfer, and potential impacts to human health. J. Hazard. Mater. 2021, 405, 124187. [Google Scholar] [CrossRef] [PubMed]
- Issac, M.N.; Kandasubramanian, B. Effect of microplastics in water and aquatic systems. Environ. Sci. Pollut. Res. 2021, 28, 19544–19562. [Google Scholar] [CrossRef] [PubMed]
- Naz, S.; Chatha, A.M.M.; Khan, N.A.; Ullah, Q.; Zaman, F.; Qadeer, A.; Khan, I.M.; Danabas, D.; Kiran, A.; Skalickova, S.; et al. Unraveling the ecotoxicological effects of micro and nano-plastics on aquatic organisms and human health. Front. Environ. Sci. 2024, 12, 1390510. [Google Scholar] [CrossRef]
- Vázquez, O.A.; Rahman, M.S. An ecotoxicological approach to microplastics on terrestrial and aquatic organisms: A systematic review in assessment, monitoring and biological impact. Environ. Toxicol. Pharmacol. 2021, 84, 103615. [Google Scholar] [CrossRef]
- Järlskog, I.; Strömvall, A.-M.; Magnusson, K.; Gustafsson, M.; Polukarova, M.; Galfi, H.; Aronsson, M.; Andersson-Sköld, Y. Occurrence of tire and bitumen wear microplastics on urban streets and in sweepsand and washwater. Sci. Total Environ. 2020, 729, 138950. [Google Scholar] [CrossRef]
- Mon, E.E.; Tun, T.Z.; Agusa, T.; Yeh, H.-M.; Huang, C.-H.; Nakata, H. Monitoring of microplastics in road dust samples from Myanmar and Taiwan. Environ. Monit. Contam. Res. 2022, 2, 112–119. [Google Scholar] [CrossRef]
- Kitahara, K.-I.; Nakata, H. Plastic additives as tracers of microplastic sources in Japanese road dusts. Sci. Total Environ. 2020, 736, 139694. [Google Scholar] [CrossRef]
- Kernchen, S.; Schmalz, H.; Löder, M.G.J.; Georgi, C.; Einhorn, A.; Greiner, A.; Nölscher, A.C.; Laforsch, C.; Held, A. Atmospheric deposition studies of microplastics in Central Germany. Air Qual. Atmosphere Health 2024, 17, 2247–2261. [Google Scholar] [CrossRef]
- Welsh, B.; Aherne, J.; Paterson, A.M.; Yao, H.; McConnell, C. Atmospheric deposition of anthropogenic particles and microplastics in south-central Ontario, Canada. Sci. Total Environ. 2022, 835, 155426. [Google Scholar] [CrossRef] [PubMed]
- Wright, S.L.; Ulke, J.; Font, A.; Chan, K.L.A.; Kelly, F.J. Atmospheric microplastic deposition in an urban environment and an evaluation of transport. Environ. Int. 2020, 136, 105411. [Google Scholar] [CrossRef] [PubMed]
- He, B.; Shi, C.; Chen, B.; Wu, H.; Goonetilleke, A.; Liu, A. Occurrence and risk associated with urban road-deposited microplastics. J. Hazard. Mater. 2023, 459, 132012. [Google Scholar] [CrossRef]
- Gao, Z.; Cizdziel, J.V.; Wontor, K.; Clisham, C.; Focia, K.; Rausch, J.; Jaramillo-Vogel, D. On airborne tire wear particles along roads with different traffic characteristics using passive sampling and optical microscopy, single particle SEM/EDX, and µ-ATR-FTIR analyses. Front. Environ. Sci. 2022, 10, 1022697. [Google Scholar] [CrossRef]
- Özen, H.A.; Mutuk, T. The influence of road vehicle tyre wear on microplastics in a high-traffic university for sustainable transportation. Environ. Pollut. 2025, 367, 125536. [Google Scholar] [CrossRef]
- Liu, Y.; Nie, Z.; Meng, Y.; Liu, G.; Chen, Y.; Chai, G. Influence of meteorological conditions on atmospheric microplastic transport and deposition. Environ. Res. 2025, 265, 120460. [Google Scholar] [CrossRef]
- 横浜市都市計画局 都市計画課. 都筑区まちづくりプラン (Tsuzuki Ward City Planning Plan). 横浜市 (City of Yokohama). Available online: http://kn-kk.com/archives/linkpdf/06027.pdf (accessed on 30 June 2025).
- 横浜市 都筑区役所. 都市マスタープラン都筑区プラン. 横浜市 (Tsuzuki Ward Office, Yokohama City. Urban Master Plan Tsuzuki Ward Plan), November 2018. Available online: https://www.city.yokohama.lg.jp/tsuzuki/kurashi/machizukuri_kankyo/machizukuri/puran/toshimasu.files/0009_20181109.pdf (accessed on 30 June 2025).
- Cai, L.; Wang, J.; Peng, J.; Tan, Z.; Zhan, Z.; Tan, X.; Chen, Q. Characteristic of microplastics in the atmospheric fallout from Dongguan city, China: Preliminary research and first evidence. Environ. Sci. Pollut. Res. 2017, 24, 24928–24935. [Google Scholar] [CrossRef]
- Klein, M.; Fischer, E.K. Microplastic abundance in atmospheric deposition within the Metropolitan area of Hamburg, Germany. Sci. Total Environ. 2019, 685, 96–103. [Google Scholar] [CrossRef]
- Szewc, K.; Graca, B.; Dołęga, A. Atmospheric deposition of microplastics in the coastal zone: Characteristics and relationship with meteorological factors. Sci. Total Environ. 2021, 761, 143272. [Google Scholar] [CrossRef]
- Zheng, H.; Yao, K.; Guo, H. Characterization and sources of indoor and outdoor microplastics and PM2.5: Possible relationships. Air Qual. Atmosphere Health 2024, 18, 645–656. [Google Scholar] [CrossRef]
- Mausra, J.; Foster, G.; Arthur, C. Laboratory Methods for the Analysis of Microplastics in the Marine Environment: Recommendations for Quantifying Synthetic Particles in Waters and Sediments. NOAA Marine Debris Division, NOAA Technical Memorandum NOS-OR&R-48, July 2015. Available online: https://repository.library.noaa.gov/view/noaa/10296/noaa_10296_DS1.pdf (accessed on 10 April 2024).
- Mekong River Commission. Protocol for Riverine Microplastics Monitoring: A Detailed Methodology for Long-Term and Cost-Effective Monitoring of Riverine Plastic Debris Pollution in the Lower Mekong River; Mekong River Commission Secretariat: Vientiane, Laos, 2024; Available online: https://www.mrcmekong.org/publications/protocol-for-riverine-microplastics-monitoring/ (accessed on 10 April 2024). [CrossRef]
- Hong, Y.; Oh, J.; Lee, I.; Fan, C.; Pan, S.-Y.; Jang, M.; Park, Y.-K.; Kim, H. Total-organic-carbon-based quantitative estimation of microplastics in sewage. Chem. Eng. J. 2021, 423, 130182. [Google Scholar] [CrossRef]
- Jaruda, R.J.; Gabayno, J.F. Detection of microplastics in surface water using a DSLR lens-based UV imaging system. J. Phys. Conf. Ser. 2024, 2793, 012018. [Google Scholar] [CrossRef]
- Balestra, V.; Bellopede, R. Microplastic pollution in show cave sediments: First evidence and detection technique. Environ. Pollut. 2022, 292, 118261. [Google Scholar] [CrossRef] [PubMed]
- Ehlers, S.M.; Maxein, J.; Koop, J.H.E. Low-cost microplastic visualization in feeding experiments using an ultraviolet light-emitting flashlight. Ecol. Res. 2020, 35, 265–273. [Google Scholar] [CrossRef]
- Dey, S.; Sen, K.; Saha, N.C.; Saha, S. Analytical approaches for quantifying and characterizing microplastics: Environmental impacts and bioaccumulation in aquatic Systems. Green Anal. Chem. 2025, 12, 100191. [Google Scholar] [CrossRef]
- Srinivasalu, S.; Natesan, U.; Ayyamperumal, R.; Kalam, N.; Anbalagan, S.; Sujatha, K.; Alagarasan, C. Microplastics as an Emerging Threat to the Freshwater Ecosystems of Veeranam Lake in South India: A Multidimensional Approach. Chemosphere 2021, 264, 128502. [Google Scholar] [CrossRef]
- Shim, W.J.; Hong, S.H.; Eo, S.E. Identification methods in microplastic analysis: A review. Anal. Methods 2017, 9, 1384–1391. [Google Scholar] [CrossRef]
- PerkinElmer Japan, G.K. FT-IR Spectrums. Available online: https://www.perkinelmer.co.jp/support/labblog/ftir/article24/ (accessed on 17 June 2025).
- Acik, G.; Cansoy, C.E.; Kamaci, M. Effect of flow rate on wetting and optical properties of electrospun poly(vinyl acetate) micro-fibers. Colloid Polym. Sci. 2019, 297, 77–83. [Google Scholar] [CrossRef]
- Pourchert, C.J. The Aldrich Library of Infrared Spectra, 3rd ed.; Aldrich Chemical Company: Milwaukee, WI, USA, 1981. [Google Scholar]
- Li, P.; Lai, Y.; Li, Q.; Dong, L.; Tan, Z.; Yu, S.; Chen, Y.; Sharma, V.K.; Liu, J.; Jiang, G. Total Organic Carbon as a Quantitative Index of Micro- and Nano-Plastic Pollution. Anal. Chem. 2022, 94, 740–747. [Google Scholar] [CrossRef]
- Shao, Q.; Yang, Y.; Liang, H.; Zhang, K.; Ma, Z.; Wang, W.; Hu, Z.; Wang, R.; Chen, J.; Han, Y.; et al. Progresses in treatment processes and quantification strategies of micro- and nanoplastics. Prog. Nat. Sci. Mater. Int. 2025, 35, 666–682. [Google Scholar] [CrossRef]
- Lin, J.; Xu, X.-P.; Yue, B.-Y.; Li, Y.; Zhou, Q.-Z.; Xu, X.-M.; Liu, J.-Z.; Wang, Q.-Q.; Wang, J.-H. A novel thermoanalytical method for quantifying microplastics in marine sediments. Sci. Total Environ. 2021, 760, 144316. [Google Scholar] [CrossRef] [PubMed]
- Savino, I.; Campanale, C.; Trotti, P.; Massarelli, C.; Corriero, G.; Uricchio, V.F. Effects and Impacts of Different Oxidative Digestion Treatments on Virgin and Aged Microplastic Particles. Polymers 2022, 14, 1958. [Google Scholar] [CrossRef] [PubMed]
- Chen, C.; Du, R.; Tang, J.; Wang, B.; Li, F.; Zhang, Z.; Yu, G. Characterization of microplastic-derived dissolved organic matter in freshwater: Effects of light irradiation and polymer types. Environ. Int. 2024, 185, 108536. [Google Scholar] [CrossRef] [PubMed]
- Mutshekwa, T.; Mulaudzi, F.; Maiyana, V.P.; Mofu, L.; Munyai, L.F.; Murungweni, F.M. Atmospheric deposition of microplastics in urban, rural, forest environments: A case study of Thulamela Local Municipality. PLoS ONE 2025, 20, e0313840. [Google Scholar] [CrossRef]
- Weber, C.J.; Bigalke, M. Forest soils accumulate microplastics through atmospheric deposition. Commun. Earth Environ. 2025, 6, 702. [Google Scholar] [CrossRef]
- Prajapati, A.; Jadhao, P.; Kumar, A.R. Atmospheric microplastics deposition in a central Indian city: Distribution, characteristics and seasonal variations. Environ. Pollut. 2025, 374, 126183. [Google Scholar] [CrossRef]
- Zhu, J.; Xu, A.; Shi, M.; Su, Y.; Liu, W.; Zhang, Y.; She, Z.; Xing, X.; Qi, S. Atmospheric deposition is an important pathway for inputting microplastics: Insight into the spatiotemporal distribution and deposition flux in a mega city. Environ. Pollut. 2024, 341, 123012. [Google Scholar] [CrossRef]
- Song, Y.K.; Hong, S.H.; Eo, S.; Shim, W.J. A comparison of spectroscopic analysis methods for microplastics: Manual, semi-automated, and automated Fourier transform infrared and Raman techniques. Mar. Pollut. Bull. 2021, 173, 113101. [Google Scholar] [CrossRef]
- Li, K.; Du, L.; Qin, C.; Bolan, N.; Wang, H.; Wang, H. Microplastic pollution as an environmental risk exacerbating the greenhouse effect and climate change: A review. Carbon Res. 2024, 3, 9. [Google Scholar] [CrossRef]
- Sunil, S.; Bhagwat, G.; Vincent, S.G.T.; Palanisami, T. Microplastics and climate change: The global impacts of a tiny driver. Sci. Total Environ. 2024, 946, 174160. [Google Scholar] [CrossRef]
- Shi, J.; Tanentzap, A.J.; Sun, Y.; Wang, J.; Xing, B.; Rillig, M.C.; Li, C.; Jin, L.; Wang, F.; Adyel, T.M.; et al. Microplastics Generate Less Mineral Protection of Soil Carbon and More CO2 Emissions. Adv. Sci. 2025, 12, 2409585. [Google Scholar] [CrossRef]
- Shen, M.; Liu, S.; Hu, T.; Zheng, K.; Wang, Y.; Long, H. Recent advances in the research on effects of micro/nanoplastics on carbon conversion and carbon cycle: A review. J. Environ. Manag. 2023, 334, 117529. [Google Scholar] [CrossRef]
- Wang, X.; Xing, Y.; Lv, M.; Zhang, T.; Ya, H.; Jiang, B. Recent advances on the effects of microplastics on elements cycling in the environment. Sci. Total Environ. 2022, 849, 157884. [Google Scholar] [CrossRef] [PubMed]
- Ortega, D.E.; Cortés-Arriagada, D. Atmospheric microplastics and nanoplastics as vectors of primary air pollutants—A theoretical study on the polyethylene terephthalate (PET) case. Environ. Pollut. 2023, 318, 120860. [Google Scholar] [CrossRef] [PubMed]
- Rillig, M.C.; Leifheit, E.; Lehmann, J. Microplastic effects on carbon cycling processes in soils. PLoS Biol. 2021, 19, e3001130. [Google Scholar] [CrossRef] [PubMed]
- Zhao, S.; Rillig, M.C.; Bing, H.; Cui, Q.; Qiu, T.; Cui, Y.; Penuelas, J.; Liu, B.; Bian, S.; Monikh, F.A.; et al. Microplastic pollution promotes soil respiration: A global-scale meta-analysis. Glob. Change Biol. 2024, 30, e17415. [Google Scholar] [CrossRef]
- Seo, Y.; Lai, Y.; Chen, G.; Dearnaley, J.; Wang, S.; Liu, X.; Song, P. Quantification of microplastics in agricultural soils by total organic carbon -solid sample combustion analysis. J. Hazard. Mater. 2025, 490, 137841. [Google Scholar] [CrossRef]
- Villafañe, A.B.; Ronda, A.C.; Rodríguez Pirani, L.S.; Picone, A.L.; Lucchi, L.D.; Romano, R.M.; Pereyra, M.T.; Arias, A.H. Microplastics and anthropogenic debris in rainwater from Bahia Blanca, Argentina. Heliyon 2023, 9, e17028. [Google Scholar] [CrossRef]
- Dong, J.; Zhao, T.; Wang, Y.; Zhao, S.; Zhu, L.; Li, H.; Wang, M.; An, L. Microplastic characteristics in rain/snow sampled from two northern Chinese cities. Sci. Total Environ. 2024, 956, 177352. [Google Scholar] [CrossRef]
- Barnes, D.K.A.; Galgani, F.; Thompson, R.C.; Barlaz, M. Accumulation and Fragmentation of Plastic Debris in Global Environments. Philos. Trans. R Soc. Lond. B Biol. Sci. 2009, 364, 1985–1998. [Google Scholar] [CrossRef]
- Tunahan Kaya, A.; Yurtsever, M.; Çiftçi Bayraktar, S. Ubiquitous exposure to microfiber pollution in the air. Eur. Phys. J. Plus 2018, 133, 488. [Google Scholar] [CrossRef]
- O’Brien, S.; Okoffo, E.D.; Rauert, C.; O’Brien, J.W.; Ribeiro, F.; Burrows, S.D.; Toapanta, T.; Wang, X.; Thomas, K.V. Quantification of selected microplastics in Australian urban road dust. J. Hazard. Mater. 2021, 416, 125811. [Google Scholar] [CrossRef]
- Morioka, T.; Tanaka, S.; Kohama-Inoue, A.; Watanabe, A. The quantification of the airborne plastic particles of 0.43–11 μm: Procedure development and application to atmospheric environment. Chemosphere 2024, 351, 141131. [Google Scholar] [CrossRef]
- Sasaki, H.; Takahashi, T.; Futami, M.; Endo, T.; Hirano, M.; Kotake, Y. A Trial Survey on Atmospheric/Airborne Microplastics Using Micro-Raman Spectroscopy (μRaman). J. Environ. Chem. 2024, 34, 61–70. [Google Scholar] [CrossRef]
- Japan Plastics Industry Federation. 2023 Plastic Raw Materials Sales Performance. 2024. Available online: https://www.jpif.gr.jp/statistics/ (accessed on 10 July 2025).
- Rosso, B.; Corami, F.; Barbante, C.; Gambaro, A. Quantification and identification of airborne small microplastics (<100 µm) and other microlitter components in atmospheric aerosol via a novel elutriation and oleo-extraction method. Environ. Pollut. 2023, 318, 120889. [Google Scholar] [CrossRef] [PubMed]
- Campisi, L.; La Motta, C.; Napierska, D. Polyvinyl chloride (PVC), its additives, microplastic and human health: Unresolved and emerging issues. Sci. Total Environ. 2025, 960, 178276. [Google Scholar] [CrossRef] [PubMed]
- Lithner, D.; Larsson, Å.; Dave, G. Environmental and health hazard ranking and assessment of plastic polymers based on chemical composition. Sci. Total Environ. 2011, 409, 3309–3324. [Google Scholar] [CrossRef]
- Khosrovyan, A.; Gabrielyan, B.; Kahru, A. Ingestion and effects of virgin polyamide microplastics on Chironomus riparius adult larvae and adult zebrafish Danio rerio. Chemosphere 2020, 259, 127456. [Google Scholar] [CrossRef]
- Yuan, Z.; Nag, R.; Cummins, E. Ranking of potential hazards from microplastics polymers in the marine environment. J. Hazard. Mater. 2022, 429, 128399. [Google Scholar] [CrossRef]
- Namazi, H. Polymers in our daily life. BioImpacts 2017, 7, 73–74. [Google Scholar] [CrossRef]
- Brahney, J.; Hallerud, M.; Heim, E.; Hahnenberger, M.; Sukumaran, S. Plastic rain in protected areas of the United States. Science 2020, 368, 1257–1260. [Google Scholar] [CrossRef]
- Reininger, A.S.W.; Tatsii, D.; Bhowmick, T.; Bagheri, G.; Stohl, A. The atmospheric settling of commercially sold microplastics. Atmos. Chem. Phys. 2025, 25, 10691–10705. [Google Scholar] [CrossRef]
- Wu, Y.; Liu, J.; Zhai, J.; Cong, L.; Wang, Y.; Ma, W.; Zhang, Z.; Li, C. Comparison of dry and wet deposition of particulate matter in near-surface waters during summer. PLoS ONE 2018, 13, e0199241. [Google Scholar] [CrossRef]
- Japan Aerospace Exploration Agency (JAXA). High-Resolution Land Use and Land Cover Map Products. 2024. Available online: https://earth.jaxa.jp/en/data/2562/index.html (accessed on 20 May 2025).
- Oehlschlägel, L.M.; Schmid, S.; Lehmann, M.; Gekle, S.; Held, A. Water–air transfer rates of microplastic particles through bubble bursting as a function of particle size. Microplastics Nanoplastics 2024, 4, 1. [Google Scholar] [CrossRef]
- Long, X.; Fu, T.-M.; Yang, X.; Tang, Y.; Zheng, Y.; Zhu, L.; Shen, H.; Ye, J.; Wang, C.; Wang, T.; et al. Efficient Atmospheric Transport of Microplastics over Asia and Adjacent Oceans. Environ. Sci. Technol. 2022, 56, 6243–6252. [Google Scholar] [CrossRef]
Disclaimer/Publisher’s Note: The statements, opinions and data contained in all publications are solely those of the individual author(s) and contributor(s) and not of MDPI and/or the editor(s). MDPI and/or the editor(s) disclaim responsibility for any injury to people or property resulting from any ideas, methods, instructions or products referred to in the content. |
© 2026 by the authors. Licensee MDPI, Basel, Switzerland. This article is an open access article distributed under the terms and conditions of the Creative Commons Attribution (CC BY) license.