


Abstract
Climate change has put the agricultural industry under enormous pressure, as rising temperatures and changing rainfall patterns are affecting crop yields and productivity. The temporal variability of the irrigation water requirement (IWR) as a function of crop evapotranspiration (ETc) and effective rainfall (Peff) was analyzed for forage corn cultivation from a climate-change perspective in the “Comarca Lagunera” region, located in the north of Mexico. The time periods 1975–2016 and 2061–2080 were analyzed, the latter using the forcings of the climate-change scenario SSP5-8.5, from the meteorological data. The Peff, ETc, and IWR for the maize crop were modeled with CROPWAT software, and the Rodionov test was applied to detect points of change in the three variables mentioned above. The historical values of IWR, ETc, and Peff values for spring were estimated at 511, 571, and 57, while for summer, they were 336, 450, and 122, respectively. The climate-change scenario toward the distant horizon projects increases in IWR of 11.9% and 3.5% and in ETc of 7.7% and 0.6%, respectively, for both spring and summer agricultural cycles, as well as decreases in Peff of −30% and −12%, respectively. These results emphasize the combined impact of rising temperatures and reduced rainfall on crop water needs, a crucial factor for crop production in regions that depend on agricultural irrigation. This study provides a foundation for planning irrigation water management in anticipation of an imminent increase in demand due to erratic weather patterns in arid zones.
1. Introduction
Irrigated agriculture is responsible for using almost 70% of the planet’s available water resources [1]. Global projections are uncertain, and food demand is expected to increase by up to 60% by 2050. This increase requires greater planting in fertile soils and more intensive production with greater use of water resources [2]. However, agricultural water scarcity is under increasing pressure due to the rapid growth in water demand for different consumptive uses in addition to the impact of climate change on the hydrological cycle [3]. Climate change is directly affecting crop evapotranspiration, leading to increased irrigation water demand, with a projected global average increase of 7–21% expected by the end of this century [4].
In this situation, one alternative solution is to estimate crop water demand. These calculations are useful, based on available regional water resources, for improving the efficiency of irrigation systems [5]. Crops require a certain amount of water for their growth and development; however, if water is not distributed according to need, losses occur, and as a result, irrigation would be applied to a smaller area with a sufficient amount of water [6]. Crop water requirements depend on climatic conditions, cultivated areas, crop species, soil types, growing seasons, and crop production frequencies [7].
In Mexico, agriculture is the most water-intensive activity, accounting for 77% of the total consumption; the remaining extraction is used for public supply (14%), thermoelectric power (5%), and self-supplied industry (4%) [8]. As an agricultural country, Mexico relies heavily on irrigation due to insufficient rainfall in agricultural areas of Central and Northern Mexico, providing water to 6.4 million hectares [9]. Maize cultivation consumes an average of 400 to 500 mm of water; however, water use is limited in both quantity and timing [10].
Maize is the most important crop in Mexico in terms of production volume, as it is used for both human consumption and animal feed [11]. Forage maize is offered as crop residue or silage to ruminant livestock, providing significant amounts of fiber and energy [12]. Irrigation District 017 is located in the Comarca Lagunera region of Northern Mexico. An average of 54,300 hectares are dedicated annually to forage maize production, making it the third most important region in Mexico for this crop. During the period 2016–2020, annual forage production reached 2.3 million tons, registering an average of 43 tons per hectare [13]. The dairy region of the “Comarca Lagunera” contributes approximately 22% of the country’s total cow’s milk production. In this sense, the increased need for products made from corn and the decrease in water availability require an optimization of resources to meet present and future needs [14].
The environmental conditions of this arid region of Mexico, allow for the production of forage maize during two agricultural cycles: spring and summer. This is achieved using a significant amount of freshwater for irrigation (2530 Mm3), which comes from the Nazas River Basin (1278 Mm3) and deep wells in different aquifers in the Comarca Lagunera region (1252 Mm3) [15]. Maize production during these two agricultural cycles satisfies the forage needs of dairy cattle in this region [12,16].
Climate change, coupled with increased water demand from industry, is generating a greater need for irrigation systems [17]. When irrigation water is required, evapotranspiration and rainfall provide an indicator of the amount of water a crop consumes during its growth cycle, influencing decisions about the necessary irrigation amount [18]. In developing countries, farmers apply more water than necessary to their crops due to a lack of accurate information about crop water requirements and the belief that more abundant irrigation translates to better harvests [19]. The CROPWAT tool is being researched as a resource for measuring plant water use, calculating the amount of irrigation and total water consumed based on crop type in a specific area, and evaluating the variations in water consumption and irrigation caused by climate change [18,20].
Therefore, the objectives of this research were to determine the temporal variability of the irrigation water requirement (IWR) from crop evapotranspiration (ETc) and effective precipitation (Peff) for the cultivation of forage maize in an arid climate of Northern Mexico, such as the “Comarca Lagunera”, and to identify the main threats from a climate-change perspective, which, globally, causes erratic and more difficult environmental conditions for the establishment and development of crops in arid areas. Water resources in the region are becoming increasingly scarce due to population and industrial growth. This puts pressure on both underground and surface water sources, which threatens to deprive agriculture of water.
2. Materials and Methods
2.1. Study Area
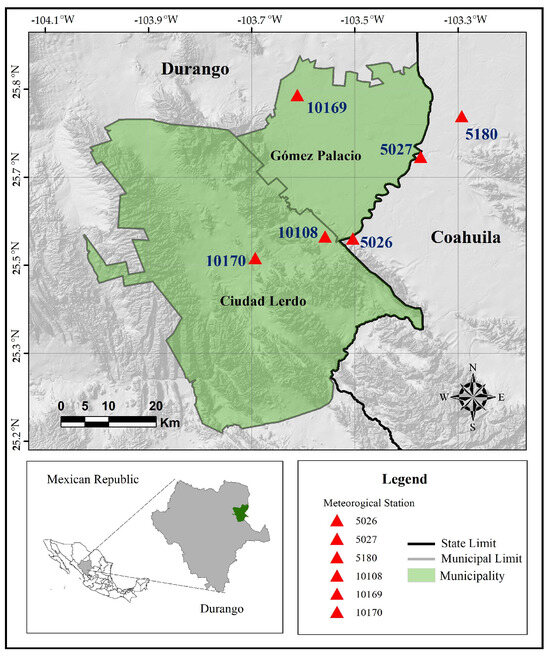
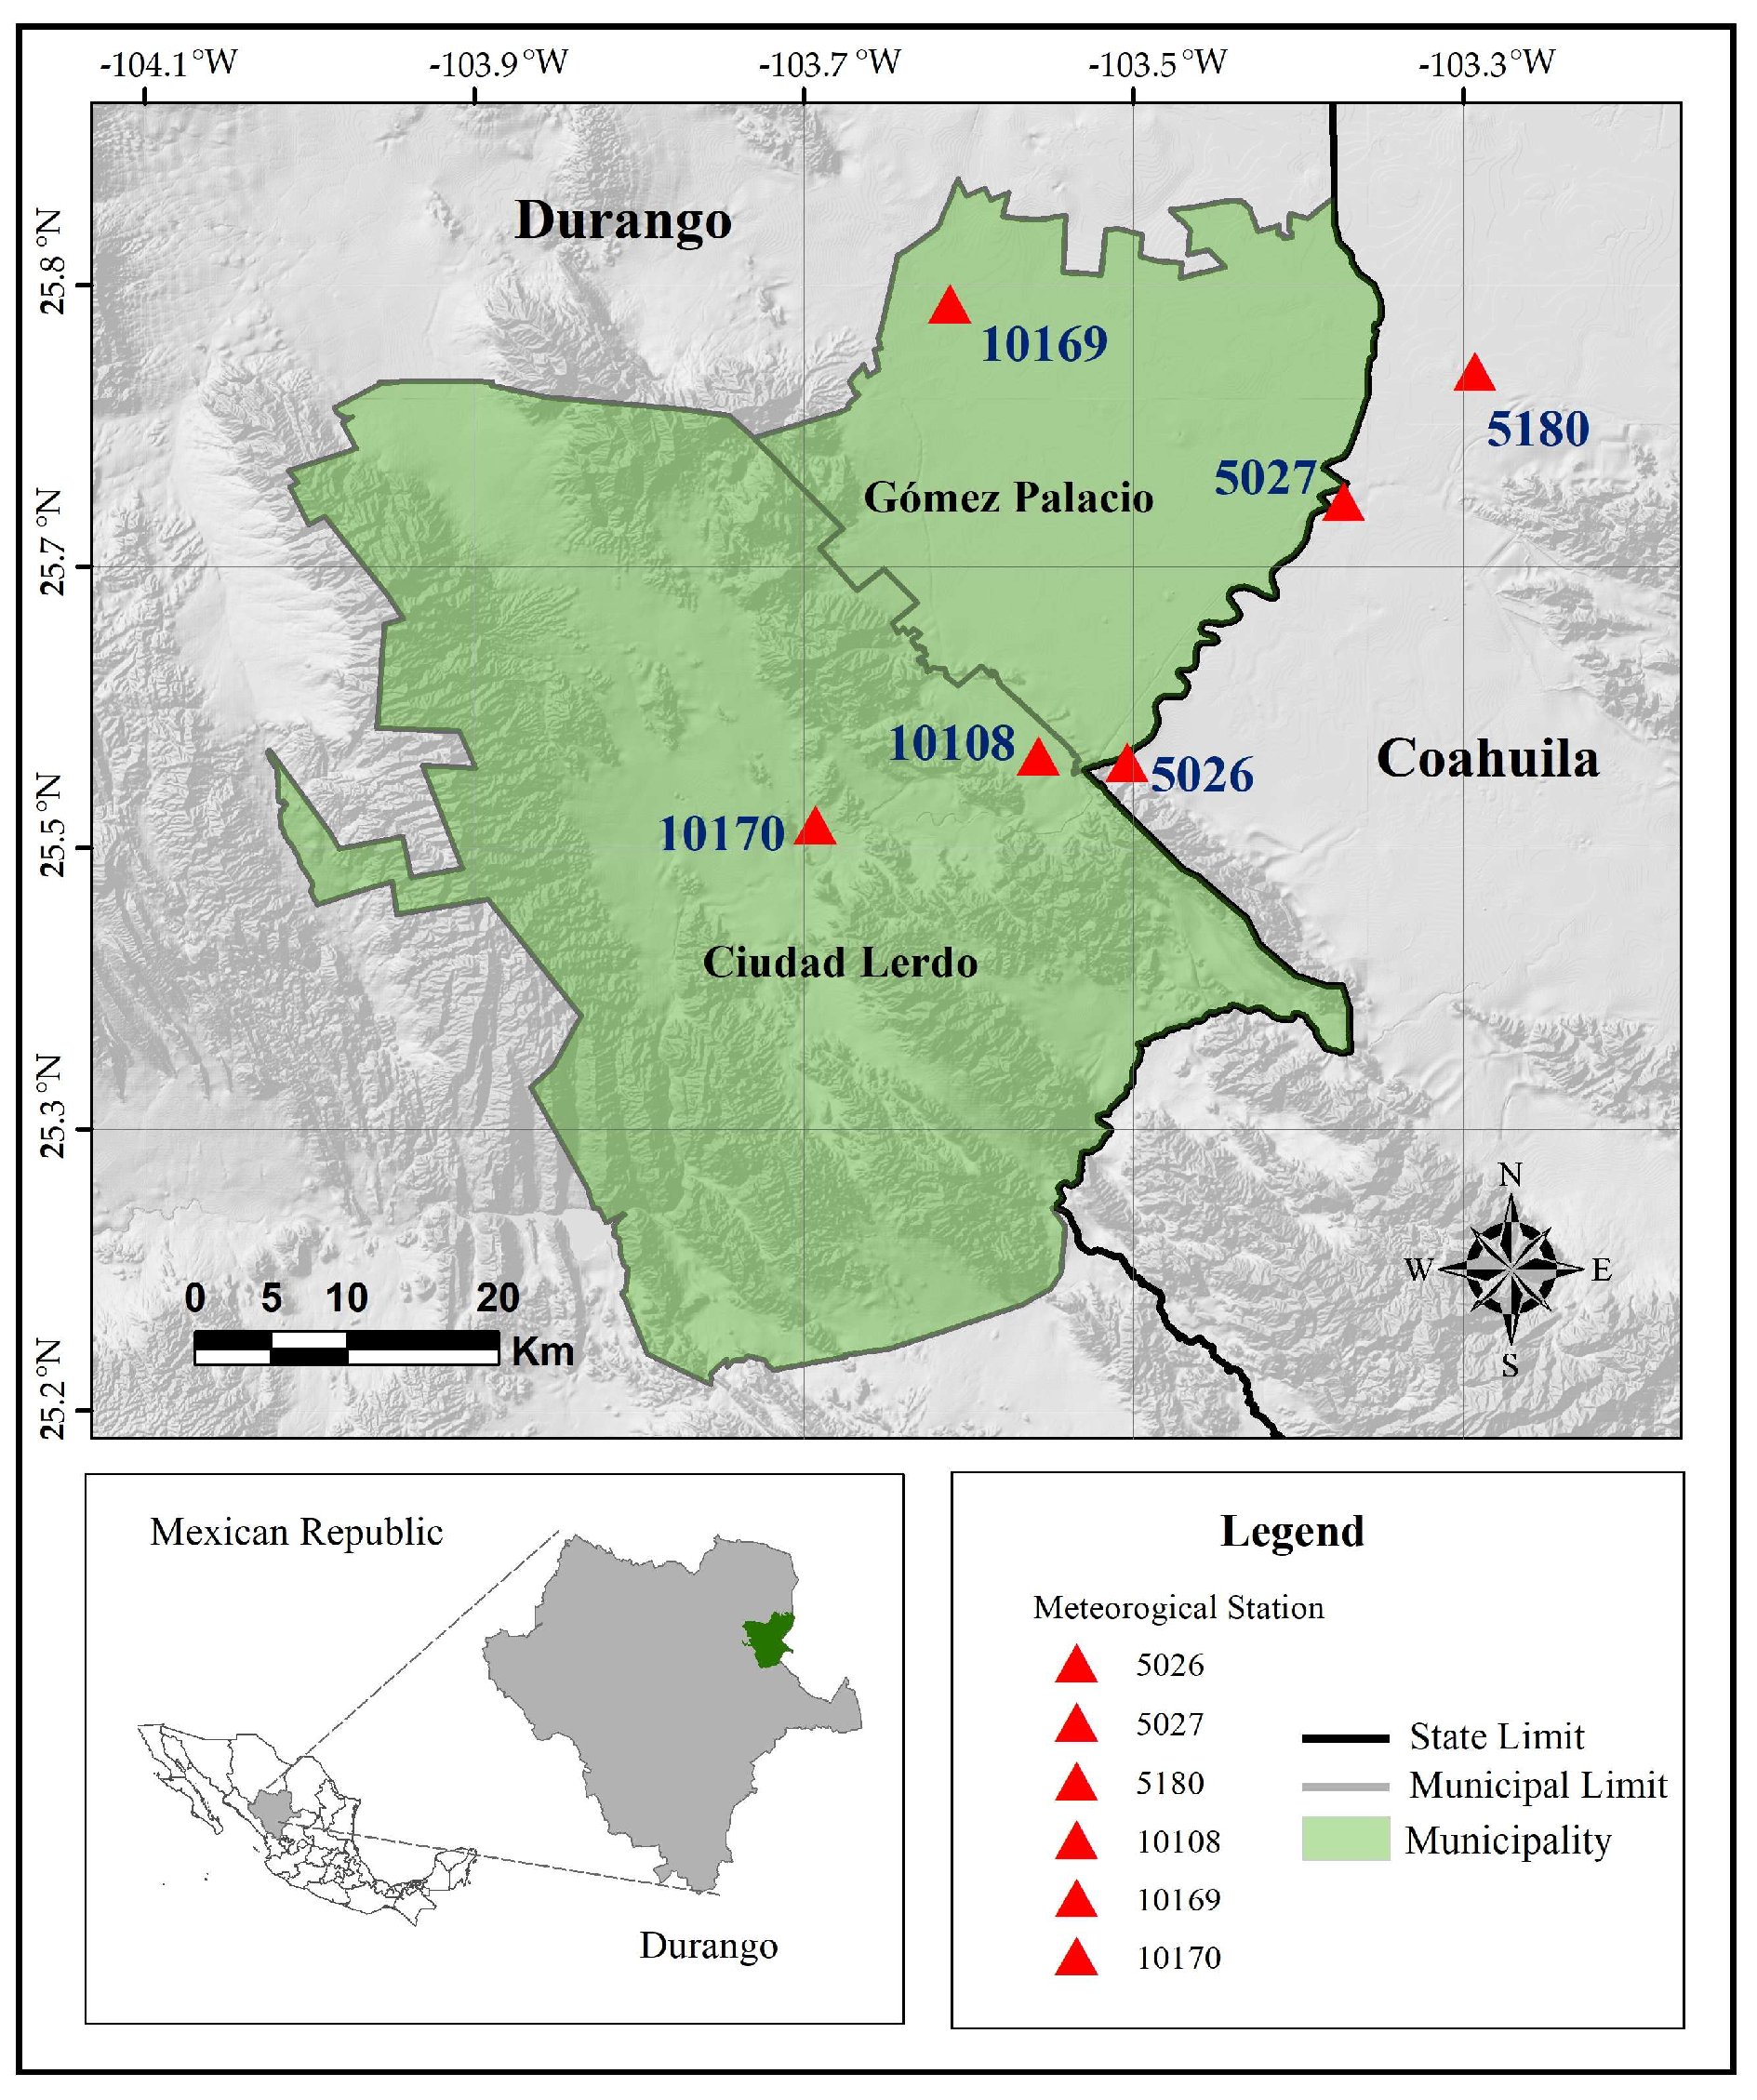
This research was carried out in two municipalities in the state of Durango, Mexico: Gómez Palacio (25°36′02.39″ N; 103°29′36.20″ W; 1132 m) and Lerdo (25°28′51.03″ N; 103°39′54.84″ W; 1145 m). These municipalities are located in the central part of the Comarca Lagunera region and are the main producers of forage maize. In 2023, the cultivated areas for these two municipalities were reported to be 18,854 and 7830 hectares, respectively [13]. The study area is located in Hydrological Region No. 36, in irrigation district 017 (Figure 1) [21].
Figure 1.
Geographic location of the municipalities of Lerdo and Gómez Palacio, Durango, Mexico.
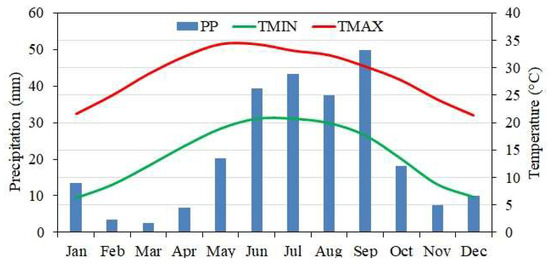
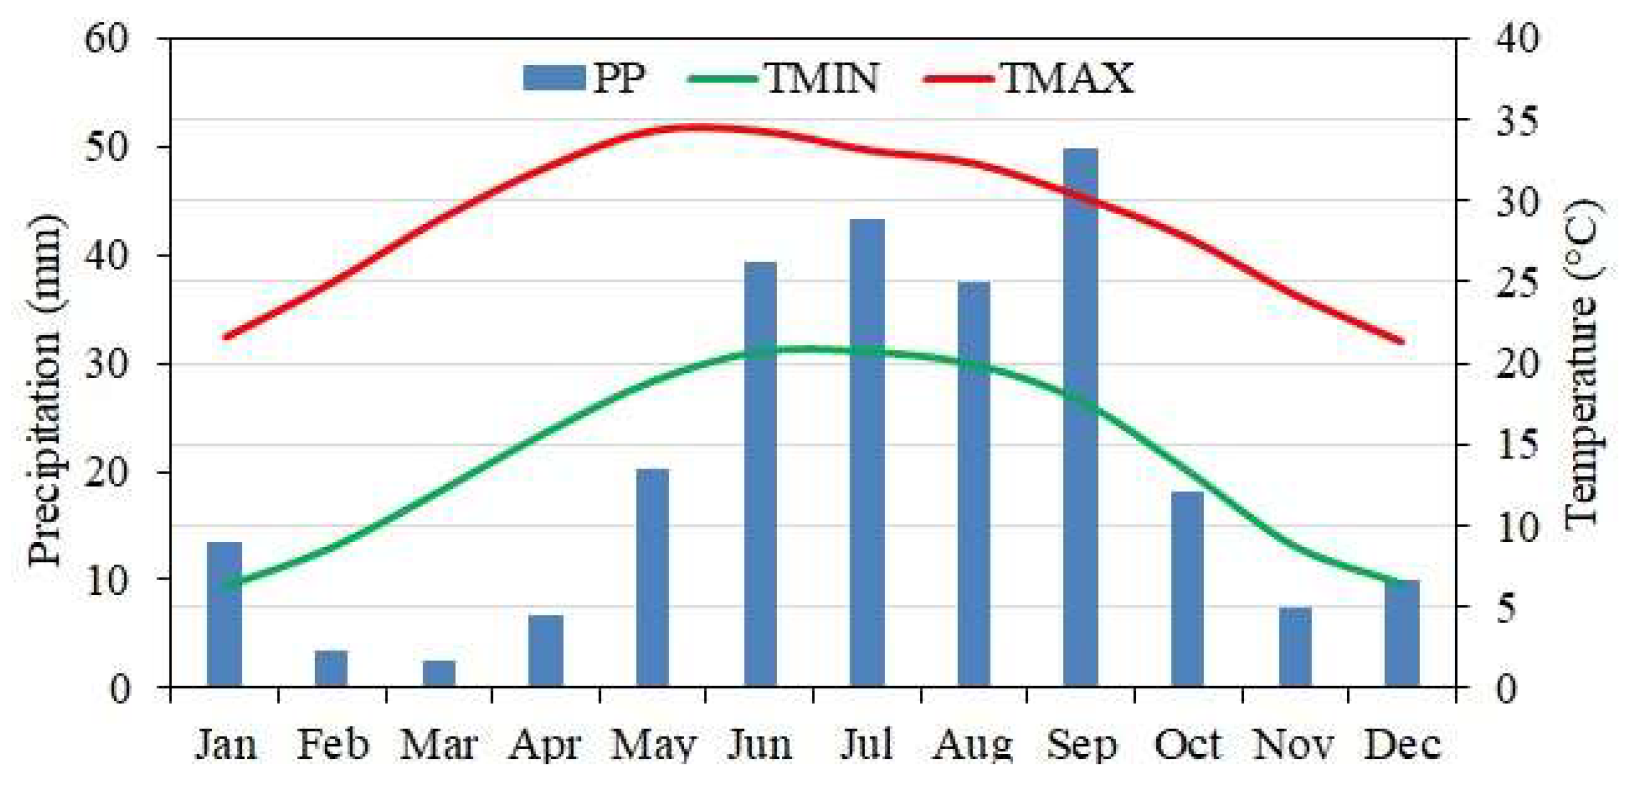
According to the climatological normals of the National Meteorological Service (SMN), during the period from 1990 to 2020, the region had an average precipitation of 250 mm·year−1; the average maximum temperature was 28.9 °C, with the months of May, June, and July being the hottest; while the average annual minimum temperature was 14.9 °C, with the months of December and January having the lowest temperatures, at 0 °C (Figure 2) [22].
Figure 2.
Climogram of the municipalities of Lerdo and Gómez Palacio for the period from 1990 to 2020. PP = precipitation, TMIN = minimum temperature, and TMAX = maximum temperature.
2.2. Climatic Data
The monthly average of the maximum and minimum temperature values and precipitation recorded at six stations in the study area was used (Figure 1): 05026—PRESA COYOTE (25°32′31.89″ N; 103°28′09.04″ W), 05027—EL CUIJE (25°41′47.91″ N; 103°20′25.08″ W; 1120), 05180—FRANCISCO I. MADERO (25°46′26.95″ N; 103°15′43.06″ W), 10108—CIUDAD LERDO (25°32′45.77″ N; 103°31′19.06″ W), 10169—C.B.T.A. 101 GOMEZ PALACIO (25°48′50.15″ N; 103°34′26.84″ W), and 10170—C.B.T.A. 047 LERDO (25°30′19.98″ N; 103°39′13.19″ W), belonging to the SMN with a daily record of 42 years (1975–2016) [22]. To control the quality of the meteorological data, a process of homogenization and filling in missing data for each station was performed, using the R-CLIMATOL 3.1.1 package https://www.climatol.eu/ (accessed on 15 June 2025), following the methodology described by Guijarro [23].
Climatol uses the Standard Normal Homogeneity Test (SNHT) to check the homogeneity of climate series and the Paulhus and Kohler method to complete daily series using averages from nearby stations [24,25]. This process involves detecting outliers resulting from incorrect data entry or measurement errors and completing the missing data [26], using provisional averages and standard deviations. The process is then repeated with the complete series, and the original missing data are recalculated using the new parameters, resulting in new means and standard deviations. This process is repeated until none of the means changes when the data are rounded to their initial precision [27,28].
2.3. Climate-Change Scenarios
The Long Ashton Research Station Meteorological Generator Ver. 8.0 (LARS-WG) was used as a downscaling model for the precipitation and maximum and minimum temperatures. This program performs well under a wide range of meteorological conditions and has been calibrated and validated in various climate studies in Mexico [29]. LARS-WG generates high-resolution climate-change scenarios at a regional level [30,31].
Climate-change projections were made using CMIP6 MPI-ESM1-2-LR GCM, considering Shared Socioeconomic Pathway SSP5-8.5 (High Forcing), for a distant time horizon of 2061–2080, using daily average data from the six meteorological stations in the study area [32,33]. Xiang et al. [34] demonstrated that during an SSP5-8.5 scenario toward the distant horizon, the greatest variabilities occur in the temperature and precipitation due to climate change, altering the water requirement and evapotranspiration of a crop.
MPI-ESM1.2-LR (Max Planck Institute Earth System Model version 1.2 Low-Resolution) is a global climate model from the Max Planck Institute for Meteorology in Germany [35]. It is a state-of-the-art climate model used for climate simulations and predictions, particularly within the framework of CMIP6 (the Coupled Model Intercomparison Project). This model improves the representations of atmospheric and oceanic dynamics, allowing for reduced bias and detailed studies of climate impacts, as well as seasonal and decadal predictions, and is widely used throughout the world [36,37].
The calibration, validation, and projection of climate-change scenarios were the three processes necessary for the configuration of LARS-WG in the Comarca Lagunera, as indicated by Semenov et al. [30] (2024). This process was validated using the Kolmogorov–Smirnov (K-S) statistical test, with the purpose of verifying that the distributions of the daily climatic variables, obtained from both observed and simulated data, were similar. A p-value was also used to determine whether to accept or reject the hypothesis that both groups of data could originate from a single distribution [29].
2.4. Reference Evapotranspiration
Ref-ET software version 4.1 (Reference Evapotranspiration Calculator programming) [38] was used. Its calculations are based on meteorological data measurements provided by the user. For this research, the Hargreaves–Samani method was used, following the methodological process recommended by Allen [39]. The HS method requires only the maximum and minimum air temperatures and the solar radiation at the top of the atmosphere [40], as indicated in Equation (1):
where ET0 = reference evapotranspiration (mmd−1); Tmax = maximum temperature (°C); Tmin = minimum temperature (°C); Tmed = average temperature (°C); Ra = extraterrestrial solar radiation (in mm·day−1).
2.5. CROPWAT
CROPWAT 8.0 is a decision-support software developed by the Land and Water Development Division of the Food and Agriculture Organization of the United Nations (FAO). It uses a series of equations to estimate crop evapotranspiration (ETc), effective rainfall (Peff), irrigation water requirement (IWR), and irrigation scheduling [20]. As input data, it requires crop, soil, precipitation, and climate information, which supports the calculation of the water supply for different crops under irrigated and rainfed conditions [7].
To accurately estimate the requirements of the forage corn crop in the study area, the parameters describing ETc, Peff, and IWR were calculated based on the methodologies proposed by the FAO [41].
2.5.1. Climate Data
Monthly values of reference evapotranspiration (ET0) and precipitation (P) were used as input data for the CROPWAT model, which were obtained from the base period (1975–2016) and distant future (2060–2080) projected in the SSP5-8.5 scenario.
2.5.2. Crop Data
Crop parameters (Table 1) were determined from the sowing, development, and harvest dates of some forage varieties, as well as the agronomic management reported in the Comarca Lagunera by Granados-Niño et al. [12] and Montemayor-Trejo et al. [15]. The sowing dates for the spring and summer cycles were fixed: March 10 and June 5, respectively.
Table 1.
Physiological and phenological parameters of the forage maize crop in the Comarca Lagunera.
2.5.3. Crop Evapotranspiration (ETc)
The ETC of the forage corn crop was calculated from Equation (2):
where ETc = crop evapotranspiration (in mm dia−1); Kc = crop coefficient (dimensionless); ET0 = evapotranspiration of the reference crop (in mm dia−1).
2.5.4. Effective Rainfall (Peff)
The USDA Soil Conservation Service method was used to calculate the effective rainfall (Peff) on a monthly [42,43] basis, using the following criteria:
1. When rainfall (P) is <250 mm·year−1, the effective rainfall (Peff) is obtained using Equation (3):
2. When rainfall (P) is >250 mm·year−1, the effective rainfall (Peff) is obtained using Equation (4):
where Peff = effective rainfall (mm·year−1); P = rainfall (mm·year−1).
2.5.5. Irrigation Water Requirement (IWR)
From the ETc calculated for the corn crop and the effective rainfall values (Peff), the irrigation water requirement (IWR) was calculated using Equation (5):
where IWR = irrigation water requirement (mm·year−1); ETc = crop evapotranspiration (mm·year−1); Peff = effective rainfall (mm·year−1).
2.6. Detection of Changes in IWR, ETc, and Peff
The detection of abrupt changes (turning points or breaking points) indicates the possibility of a regime shift in a time series [44]. This research used the method proposed by Rodionov [45], known as STARS (Sequential T-test Analysis of Regime Shifts), which has been applied in numerous research projects, primarily in climatology and marine ecosystem research, oceanography, hydrology, and biochemistry [46]. For this research, the free Excel add-in “SHIFT Detection” V.2.1 https://www.beringclimate.noaa.gov/regimes/ (accessded on 10 May 2025) was used. Change detection (in the mean) was performed for the IWR, ETc, and Peff time series, with a significance level of p = 0.05, as determined using Student’s t-test, a cutoff length of 10, and a Huber parameter of 1.
3. Results
3.1. Climate-Change Scenarios
The maximum and minimum temperatures and precipitation recorded in the Comarca Lagunera region during the period 1975–2016 were used to calibrate and validate LARS-WG. Subsequently, the effectiveness of this model was analyzed to perform the downscaling of the GCMs, using the Kolmogorov–Smirnov (K-S) statistical test. The results obtained show that the daily distribution of the analyzed variables—minimum and minimum temperatures, as well as precipitation—is perfect in the four seasons of the year, in both dry and wet periods (Table 2), which allows us greater confinement and reliability to generate the future climate scenario.
Table 2.
K-S tests and p-values for Comarca Lagunera station and the seasonal distributions of wet/dry series.
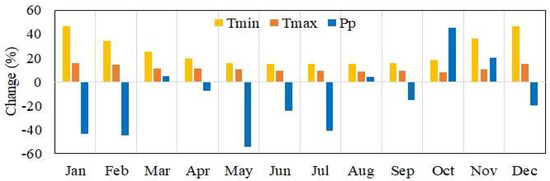
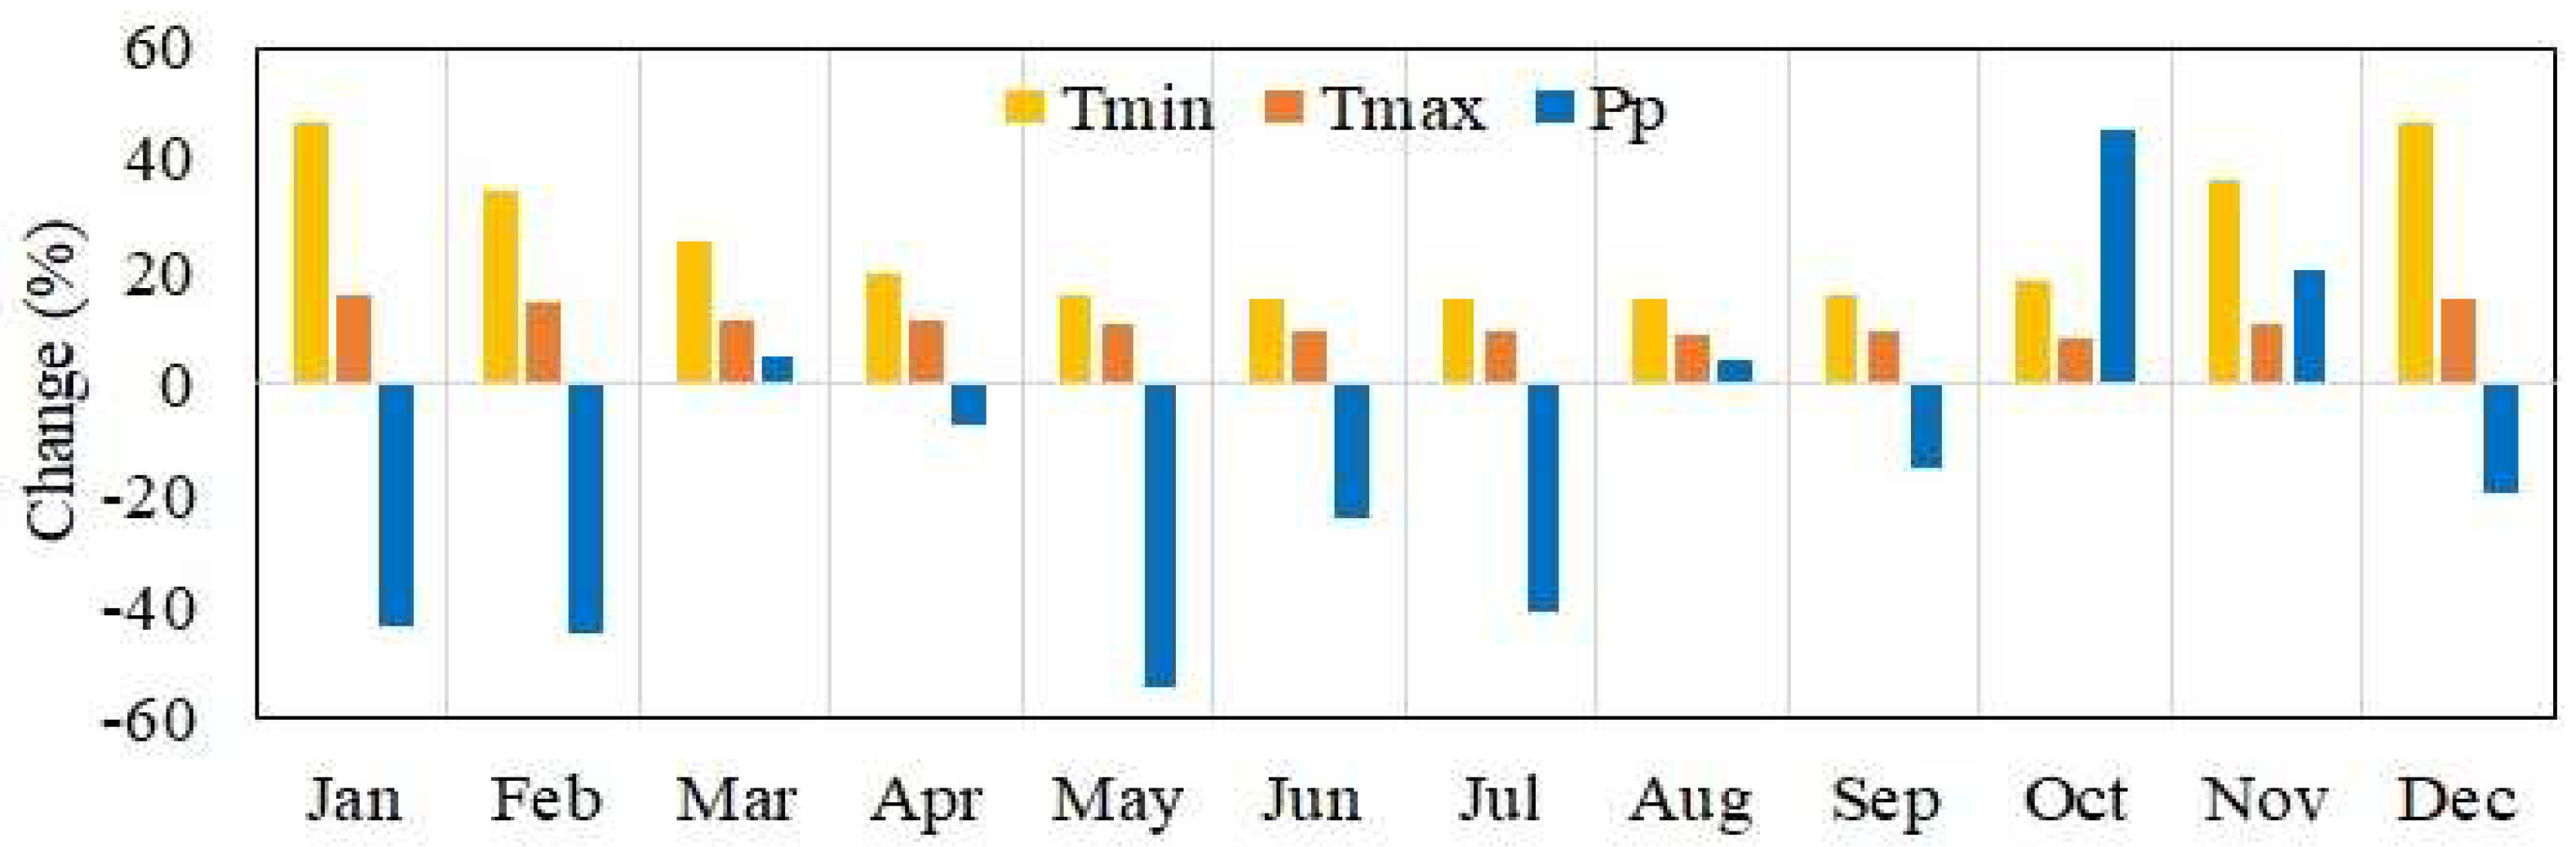
The average annual minimum and maximum temperatures reported in the study area (Comarca Lagunera) are 14.9 °C and 28.9 °C, respectively. Based on the MCG MPI-ESM1-2-LR projection with the SSP5-8.5 trajectory for the 2061–2080 horizon, the average annual minimum temperature is projected to increase by 21% (17.1 °C), while the maximum temperature is expected to increase by up to 10.9% (31.8 °C); both variables are compared to those over the historical period (1975–2016). Figure 3 shows the percentage changes for the temperature variables, indicating an increase in all months, mainly during the winter season, with the minimum temperature showing the greatest impact. The average annual precipitation recorded for irrigation district 017 in the Comarca Lagunera is 250 mm·year−1, where the MCC projects a decrease of up to 16% from the annual average, expecting an average annual precipitation of up to 210 mm·year−1 in the distant future. Based on the above, SSP5-8.5 projects a warmer and drier climate in the Comarca Lagunera region compared to the historical arid climate.
Figure 3.
Potential increases in the minimum temperature (Tmin), maximum temperature (Tmax), and precipitation (Pp) with respect to those the observed over the historical period (1975–2016), as influenced by SSP5-8.5.
3.2. Detection of Points of Change in IWR, ETc, and Peff
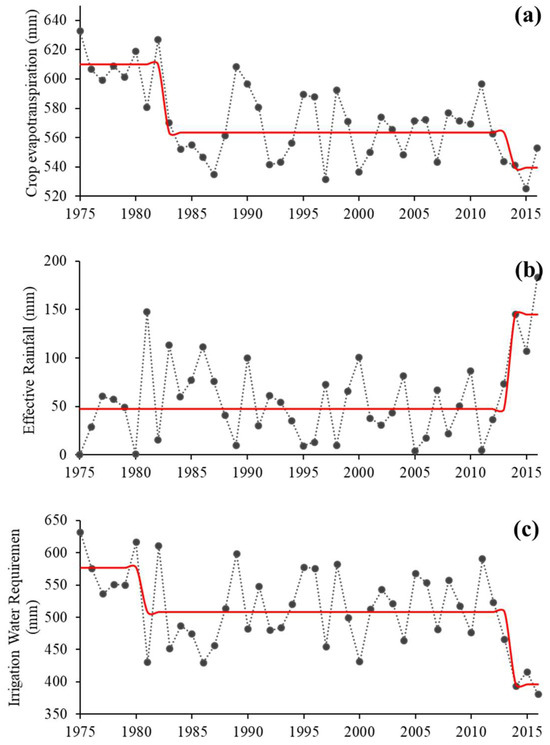
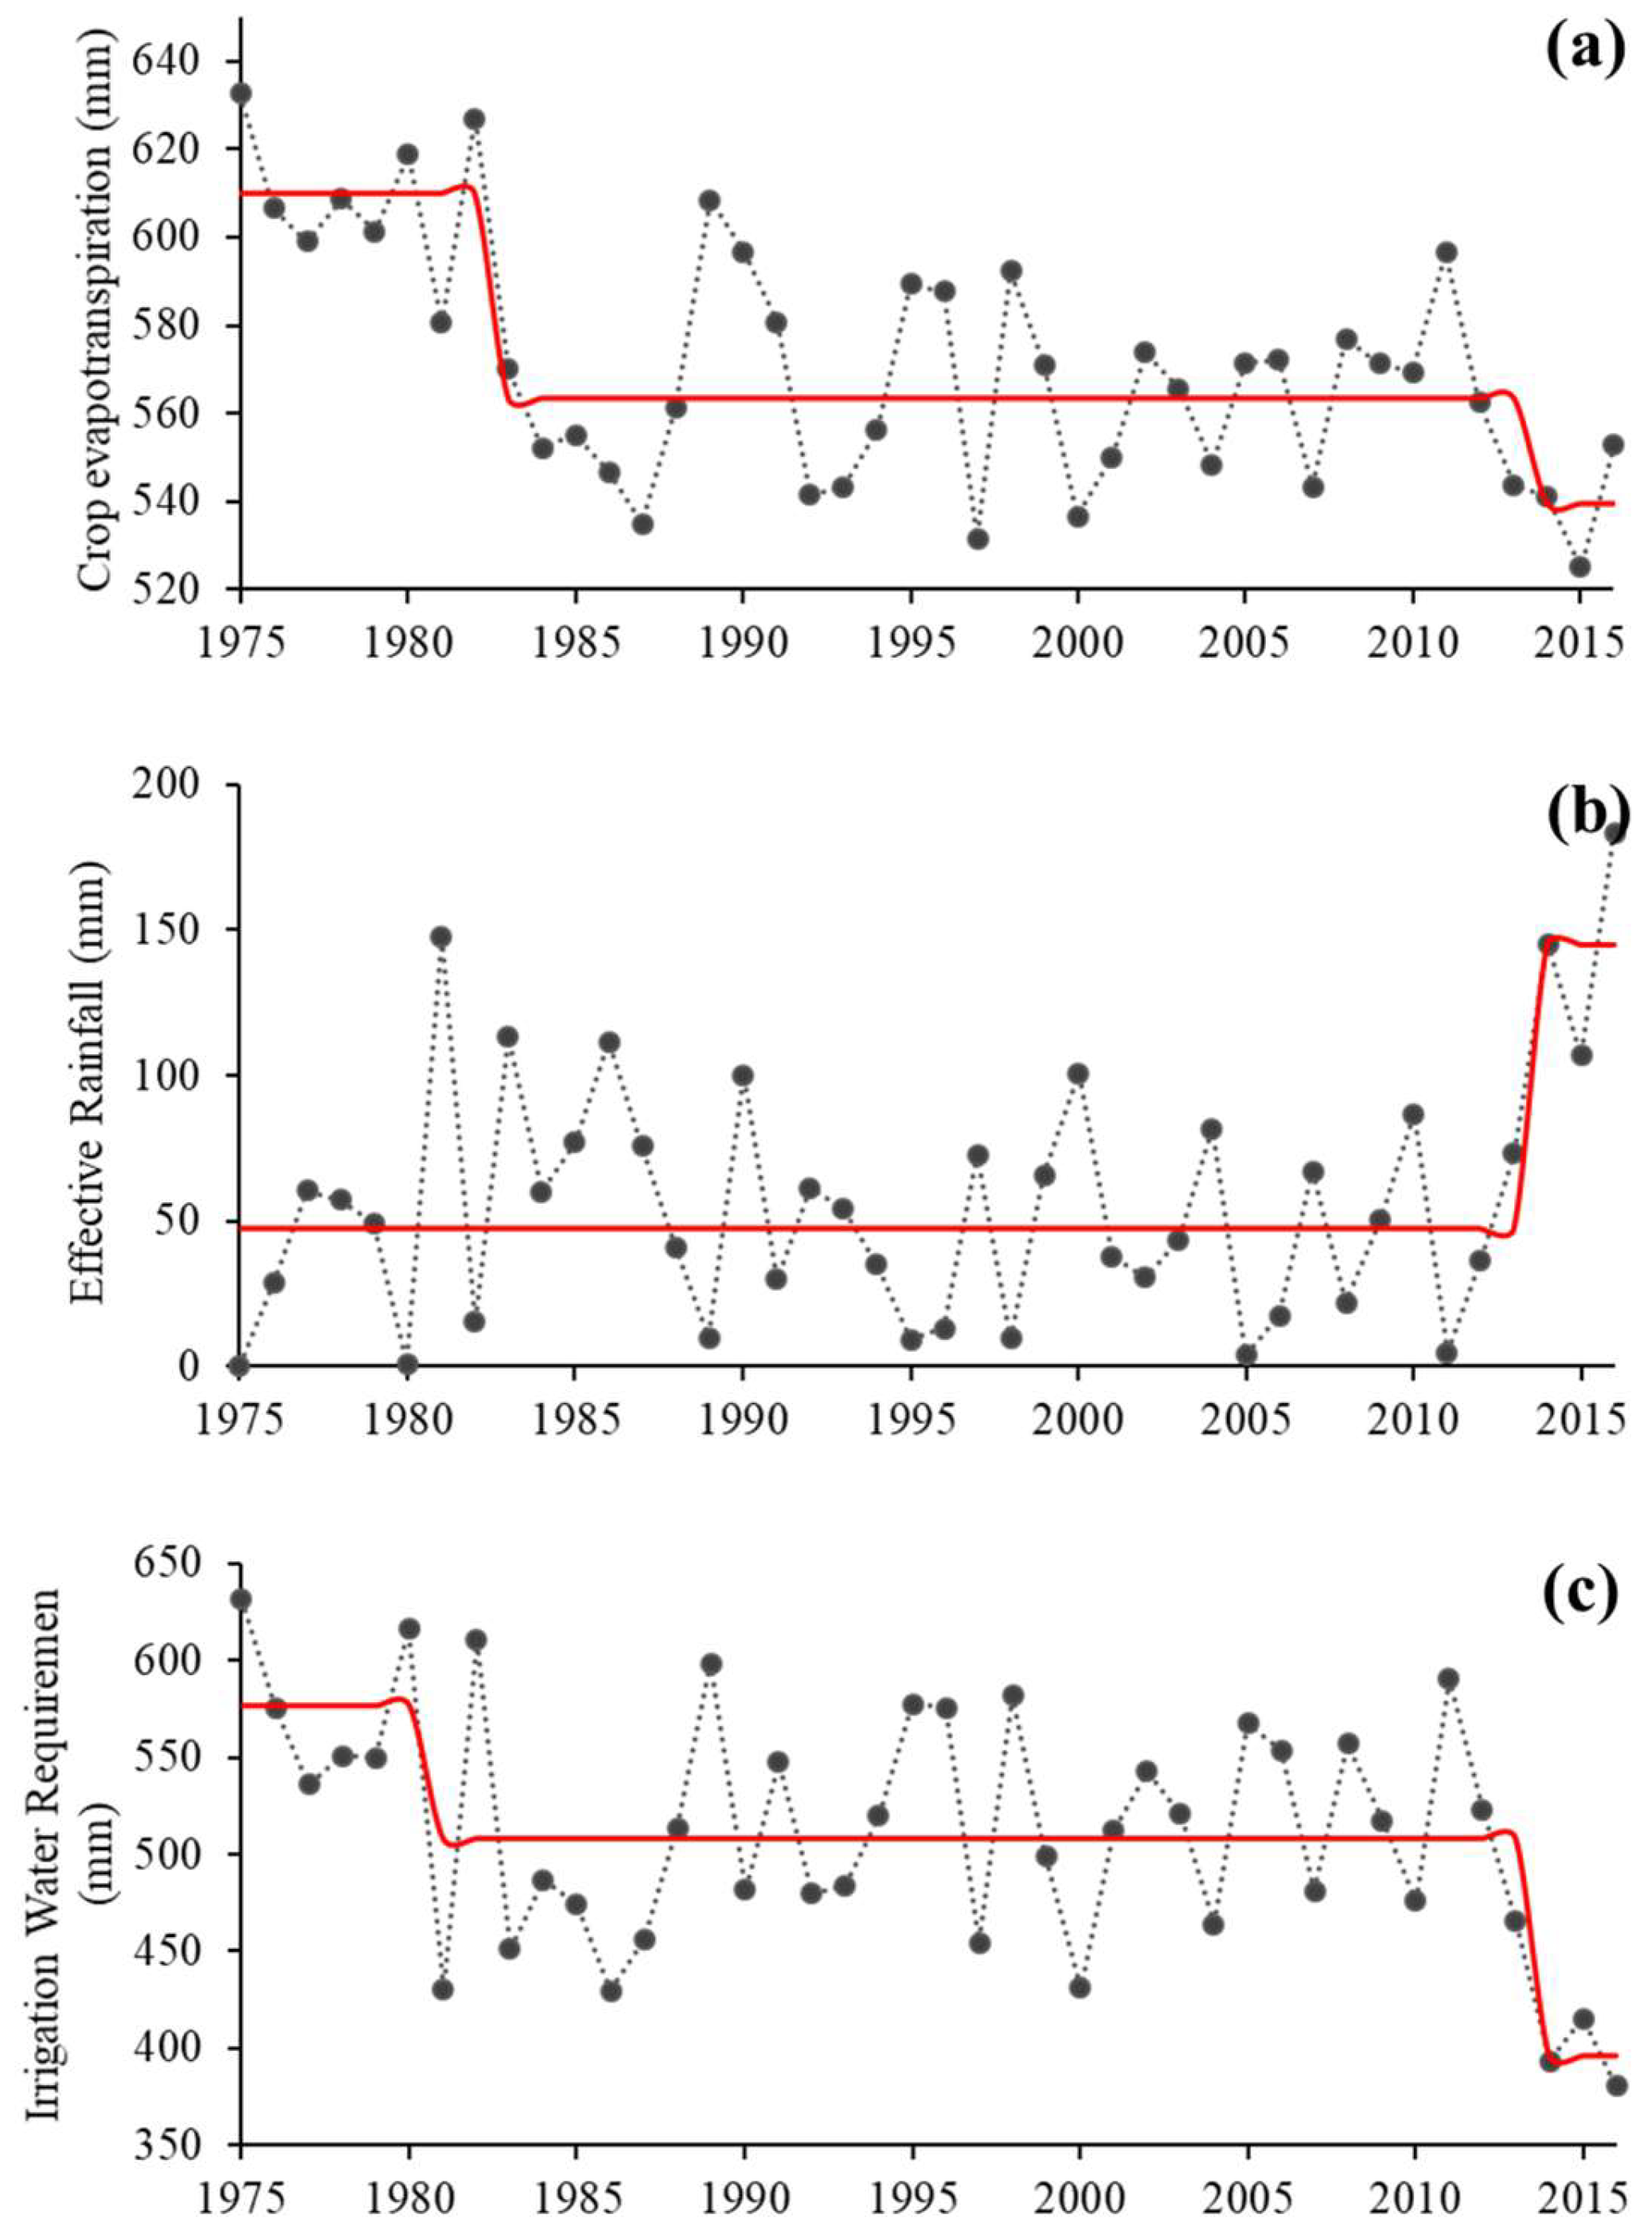
Using the Rodionov test applied during the spring growing season for forage maize (Figure 4), a point of change was identified for ETc in 1983; subsequently, a period of continuous stability occurred until 2014, when another significant change took place. Both changes were negative. For Peff, the same test identified only one turning point; after 40 years of stability, a positive change occurred in 2014, representing an increase in this variable. Similarly, for IWR, two turning points were detected on the timeline with respect to the mean: The first is a negative turning point in 1981, and later, toward the end of the series, another negative turning point occurred in 2014.
Figure 4.
Trends of crop evapotranspiration (a), effective rainfall (b), and irrigation water requirement (c) for the forage corn crop in the spring agricultural cycle (sowing 10/03) of Rodionov, with a significance level of p = 0.05, as determined using Student’s t-test; cut length = 10; Huber’s parameter = 1. The dotted line represents the annual behavior of each variable, while the red line represents the statistical change in the Rodionov test.
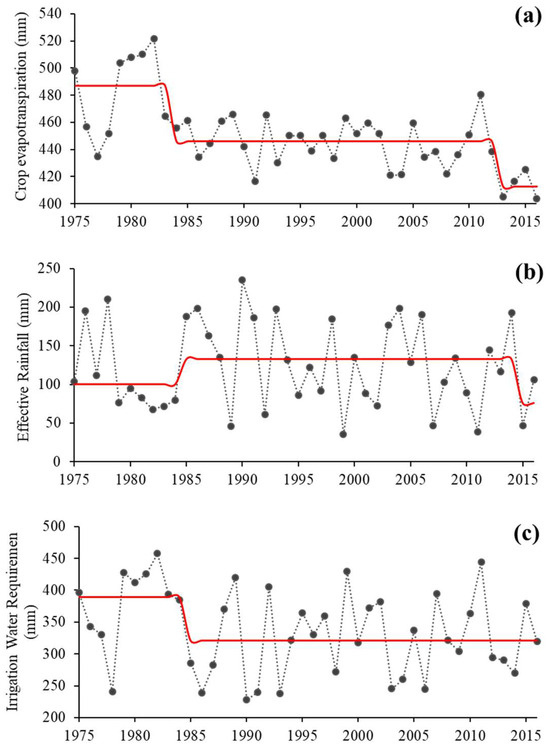
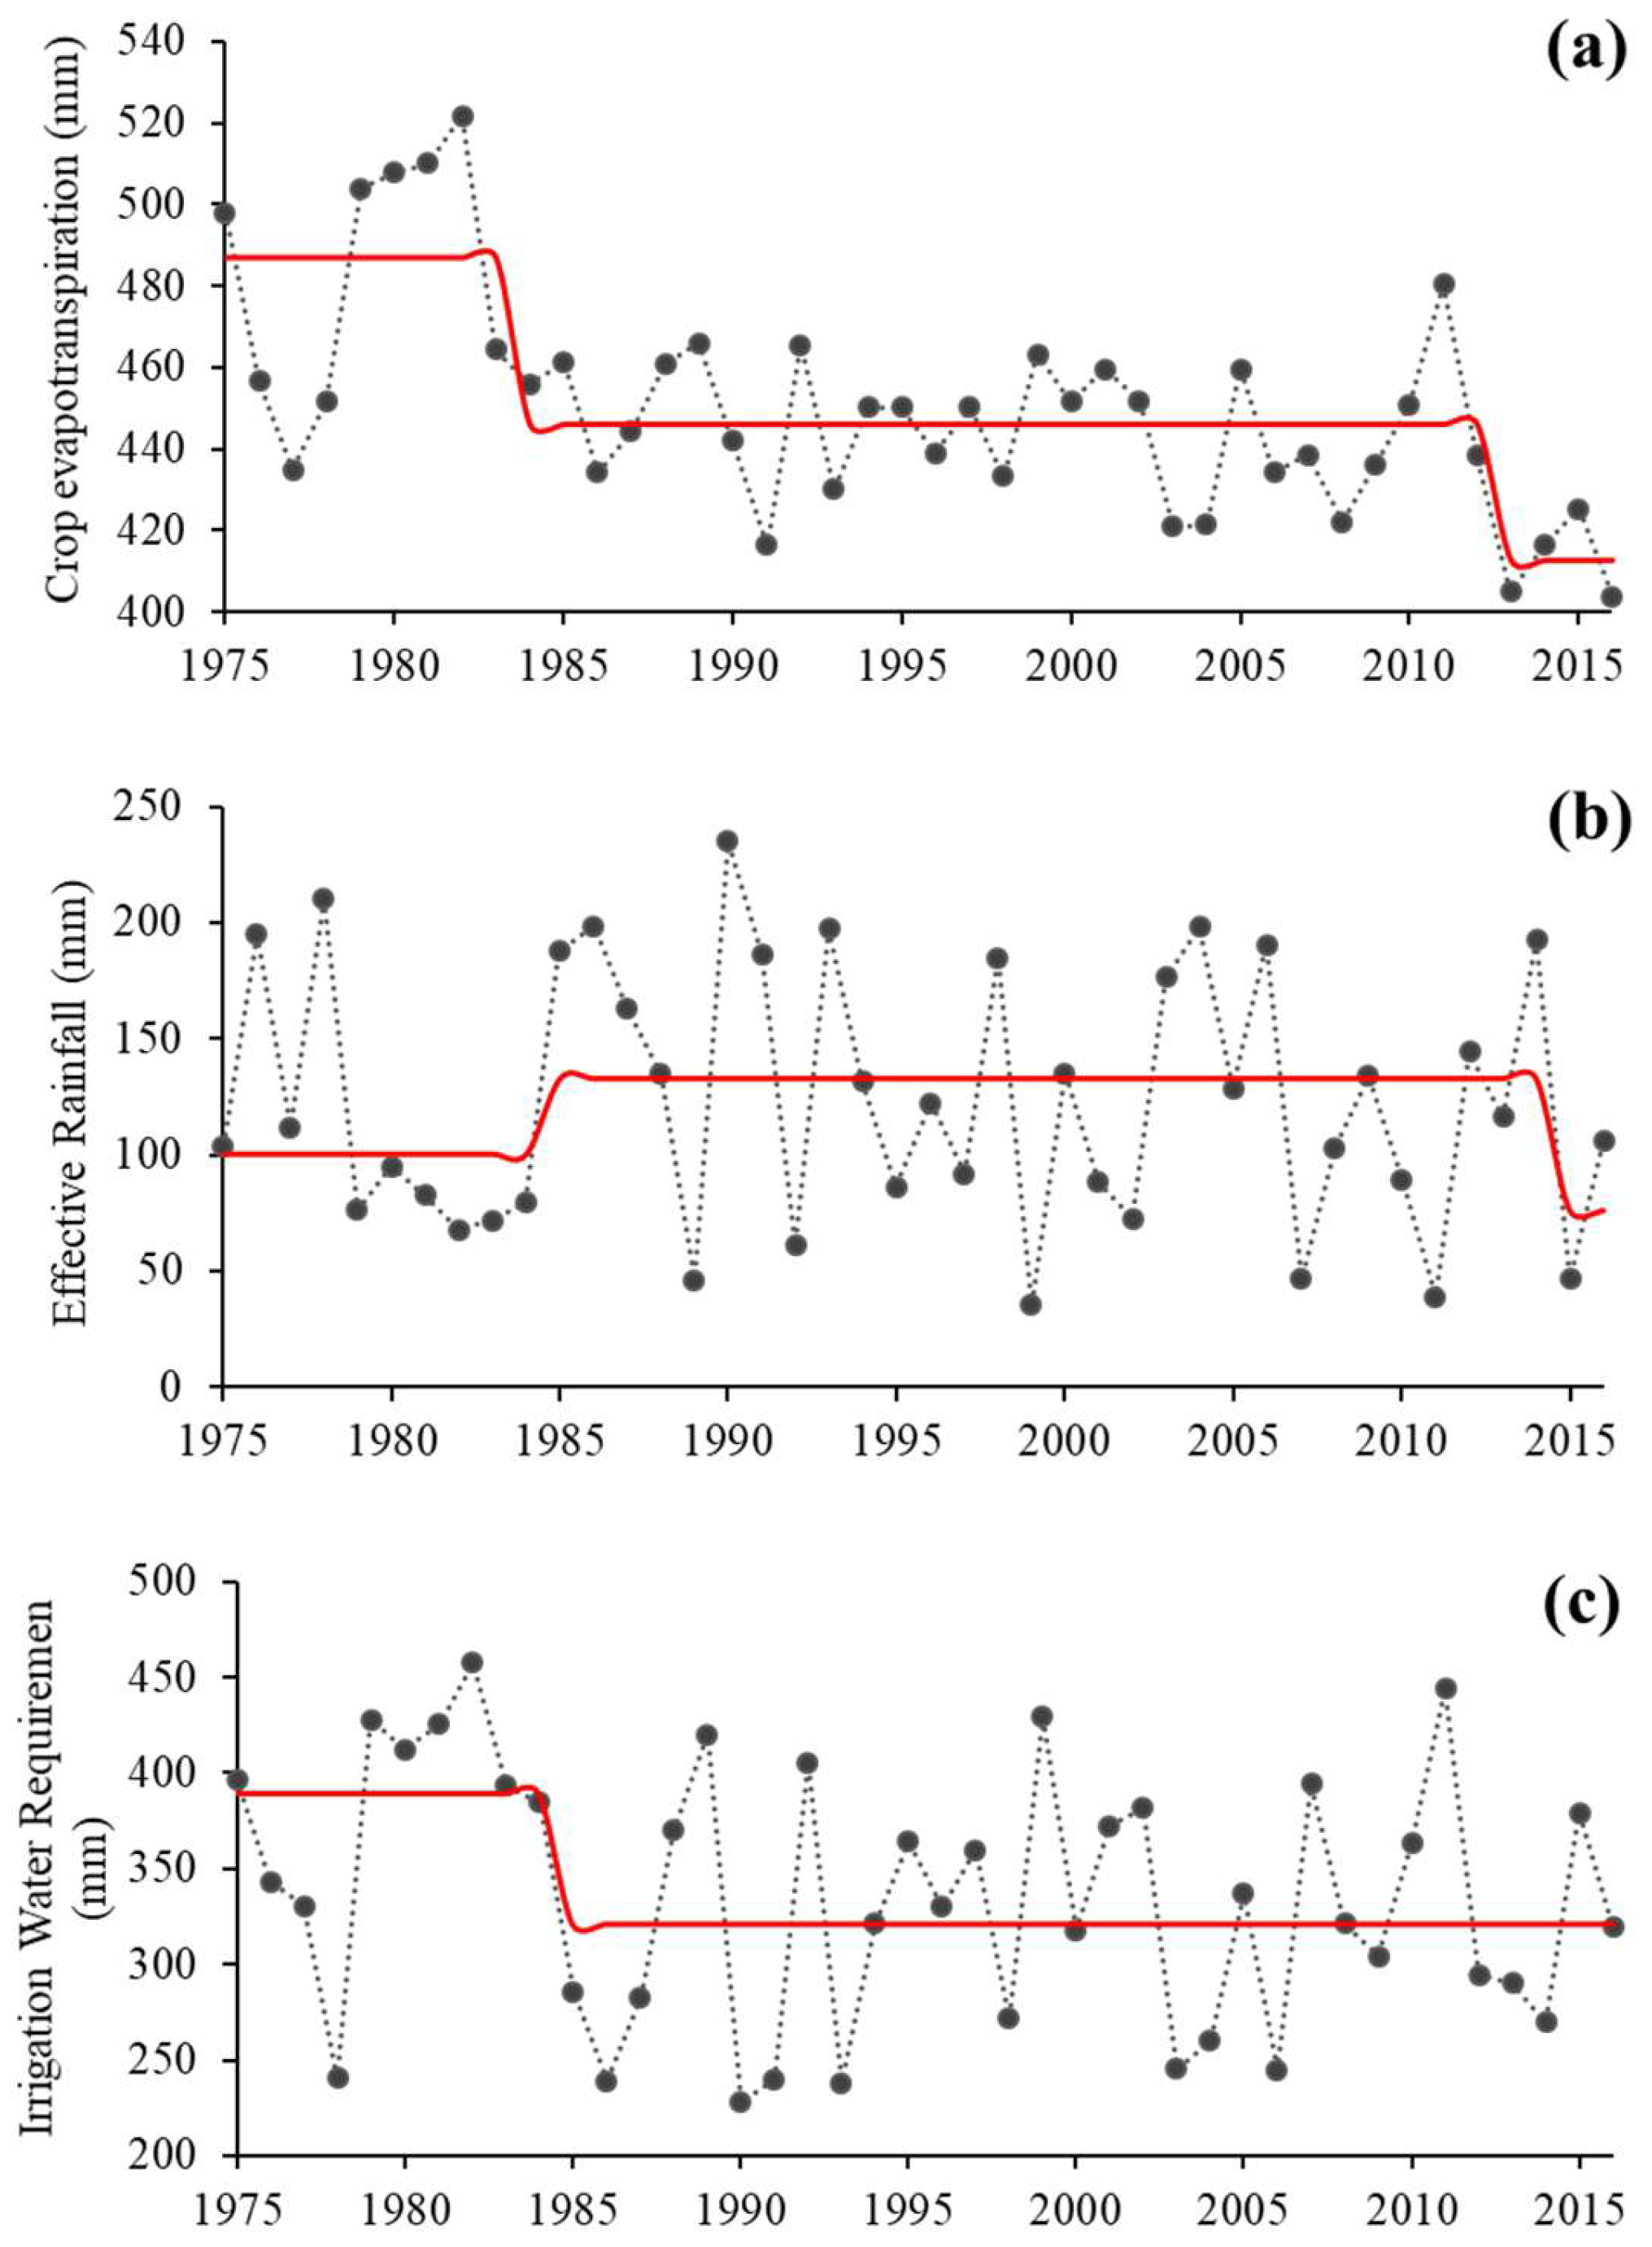
For the summer agricultural cycle, two abrupt changes were observed in the ETc variable, both negative relative to the mean. The first change was detected at around 1984 and the second in 2013. Regarding Peff, two points of change were also observed: the first in 1985 and the second in 2015, as shown in Figure 5. Both points of change were negative, indicating a decrease in precipitation. Finally, for the IWR variable, only one point of change was observed in 1985. These results suggest significant changes in the correlations of the climatic variables, highlighting abrupt periods of change in the analyzed data, which provide crucial information for understanding, and potentially predicting, variations in historical climate and associated agroclimatic variables.
Figure 5.
Trends of crop evapotranspiration (a), effective rainfall (b), and irrigation water requirement (c) for the forage corn crop in the summer agricultural cycle (planting 05/07). Rodionov test with a significance level of p = 0.05, as determined using Student’s t-test; cut length = 10; Huber’s parameter = 1. The dotted line represents the annual behavior of each variable, while the red line represents the statistical change in the Rodionov test.
3.3. Temporal Variations of IWR, ETc, and Peff
The results show annual variations for the three variables studied in both agricultural cycles, revealing a significant difference between them. Depending on the season, different climatic conditions are observed, such as precipitation, which is higher during the summer agricultural cycle, while the average temperature is lower during the spring cycle.
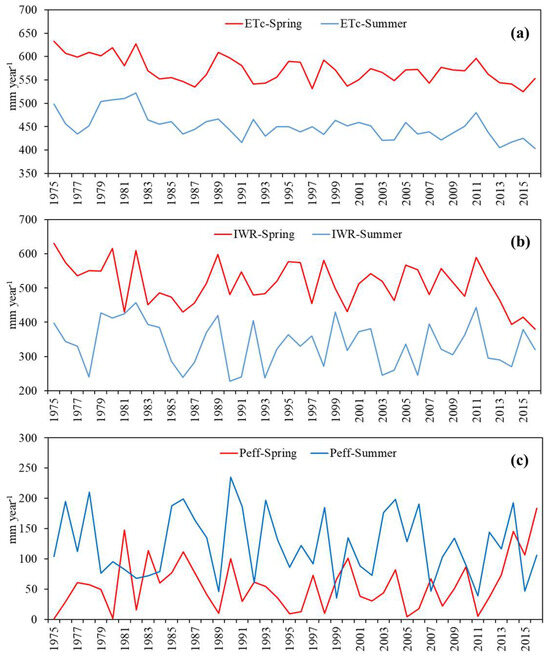
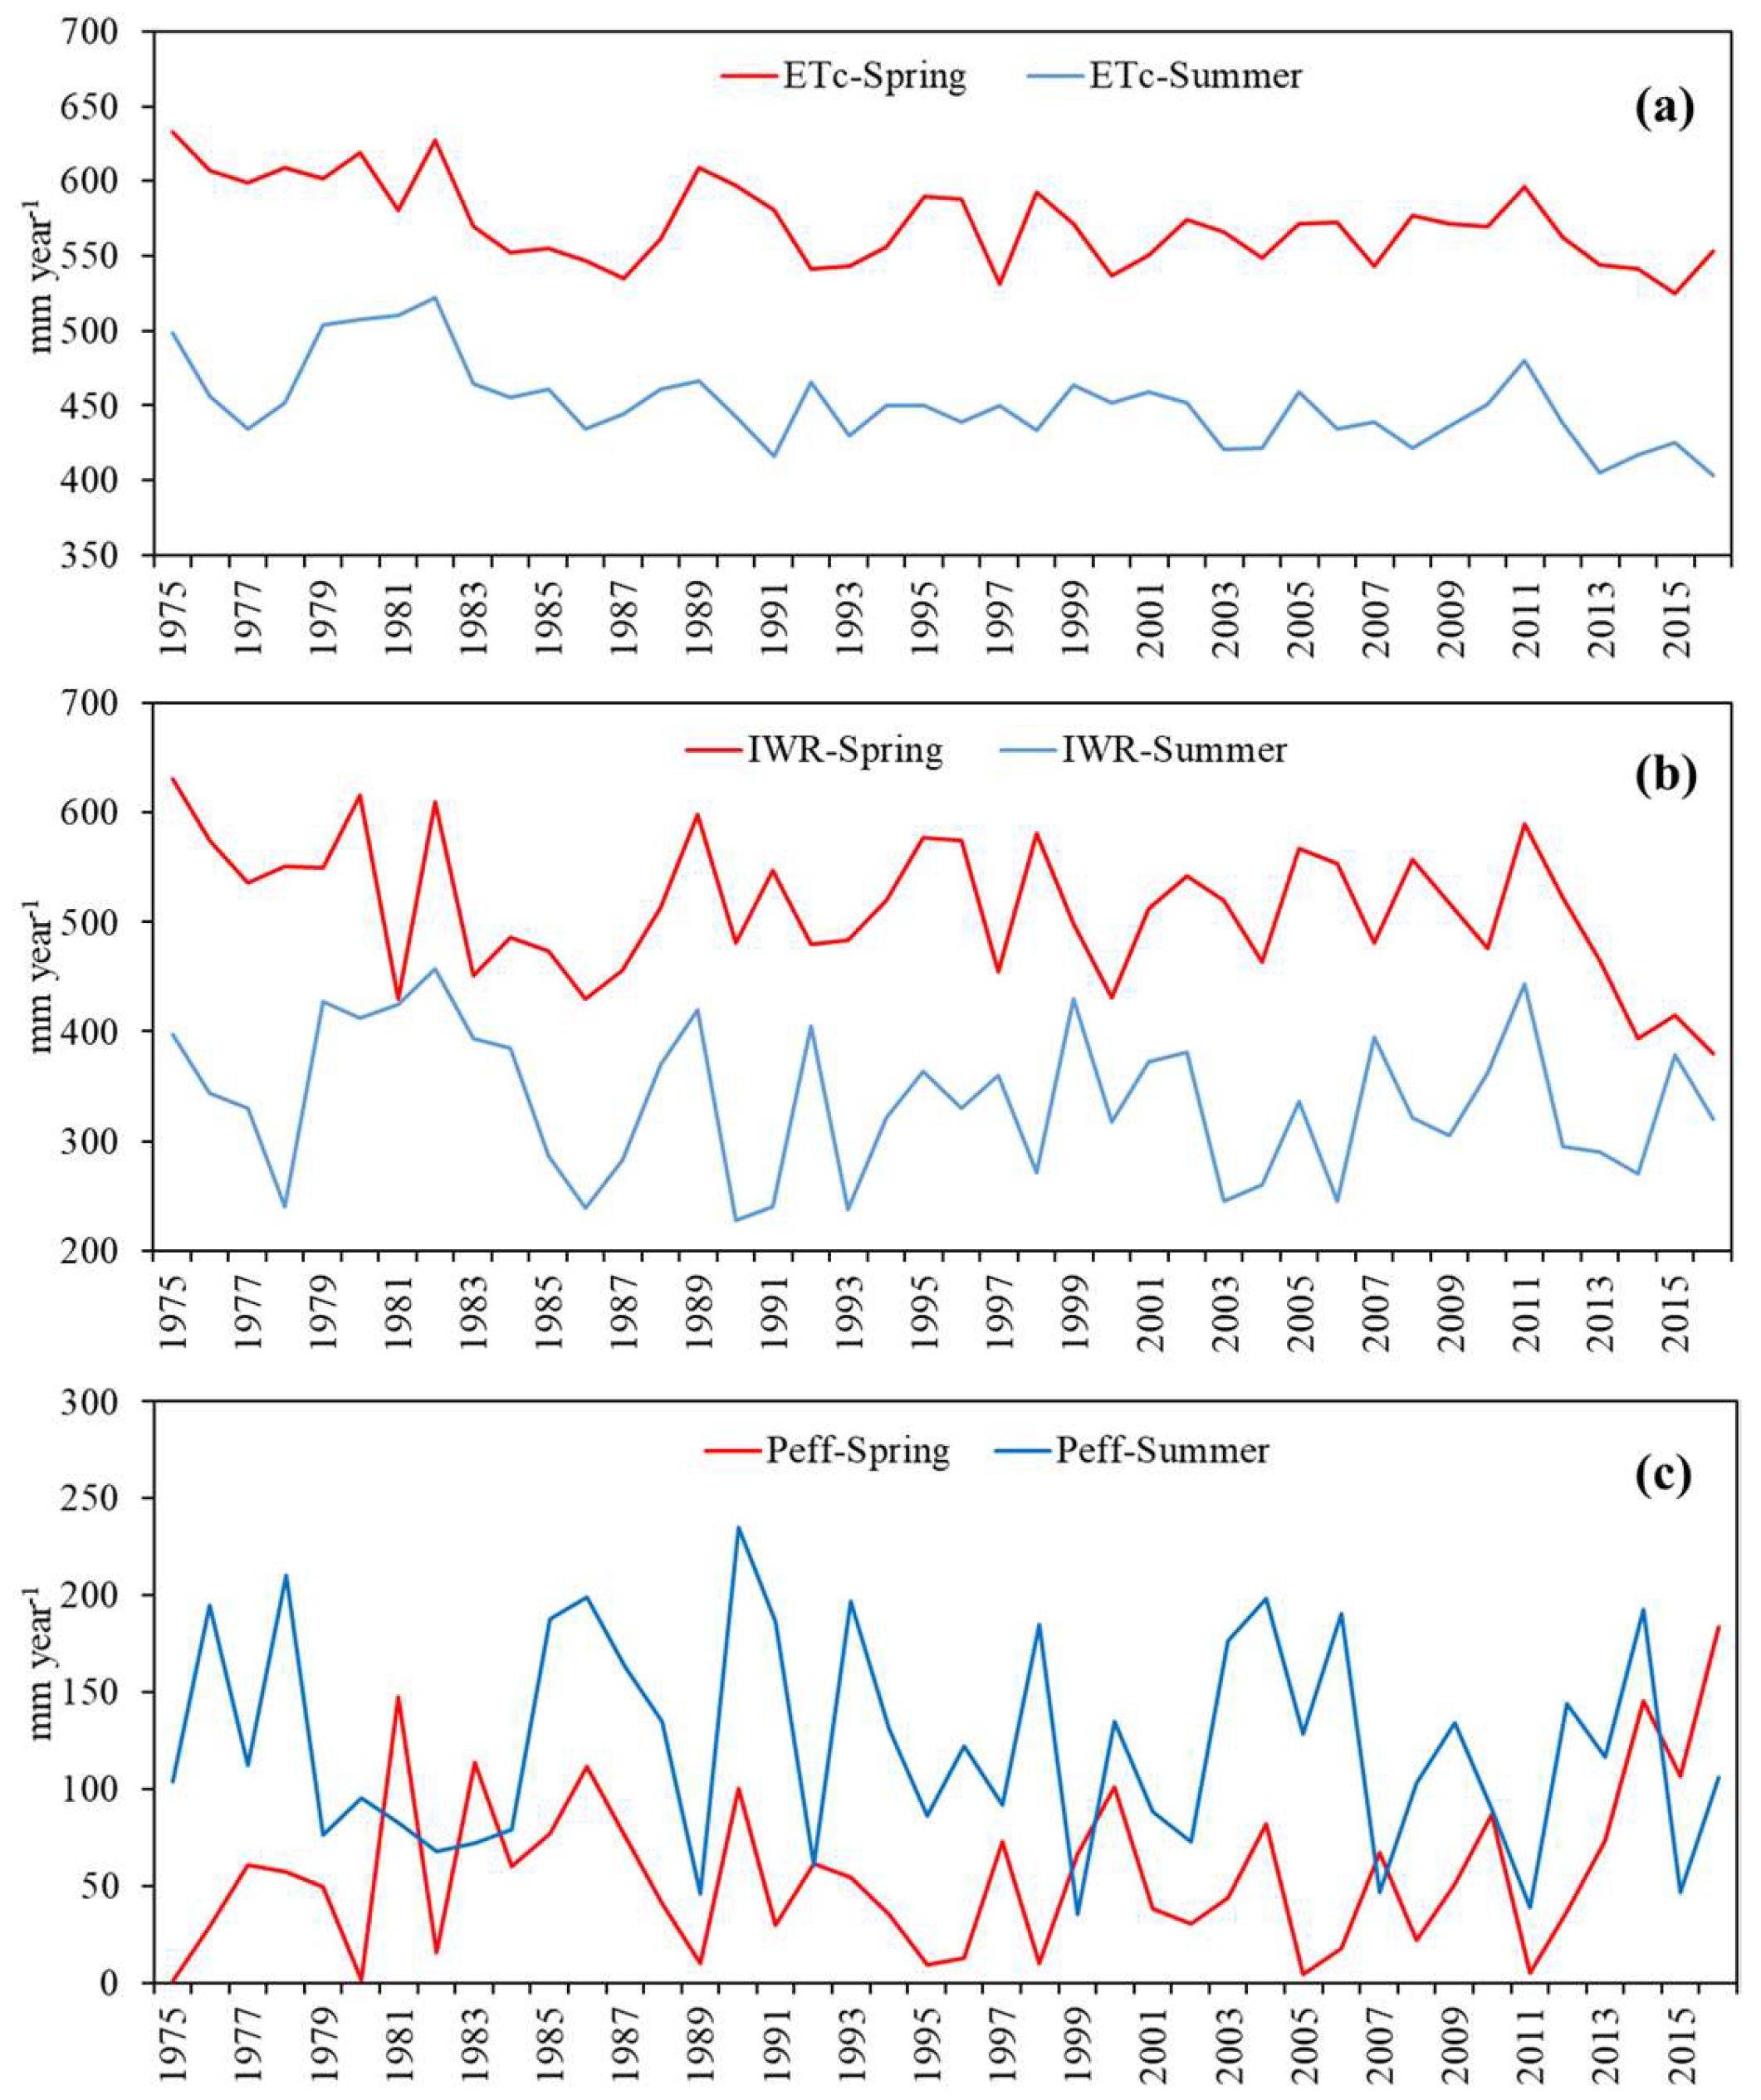
For the spring agricultural cycle, the highest IWR value occurred in 1975 at 631 mm·year−1, with a recorded ETc of 632 mm·year−1 and a near-zero Peff of 0.6 mm·year−1. In contrast, the lowest IWR was recorded in 2016 at 380 mm year−1, with an ETc of 553 mm·year−1 and a Peff of 183 mm·year−1. The average annual IWR is 511 mm·year−1, the average ETc is 571 mm·year−1, and the average Peff is 57 mm·year−1.
Regarding the results obtained for the summer agricultural cycle, Figure 6 shows that the highest IWR value occurred in 1982 at 458 mm·year−1; consequently, ETc also reached its highest value at 521.7 mm·year−1. However, the lowest IWR was recorded in 1990 at 228 mm·year−1, with an ETc of 442 mm year−1. The average annual IWR for this cycle was 336 mm·year−1, with ETc ranging around 450 mm·year−1 and an average Peff of 123 mm·year−1.
Figure 6.
(a) Crop evapotranspiration (ETc), (b) irrigation water requirement (IWR), and (c) effective rainfall (Peff) for the spring and summer agricultural cycles during the historical period of 1975–2016.
3.4. Temporal Variations of IWR, ETc, and Peff with Climate-Change Projections
MCG MPI-ESM1-2-LR with the SSP5-8.5 trajectory projects increases in IWR in the spring and summer cycles of 11.9% and 3.5%, respectively. ETc indicates increases of 7.7% for the spring cycle and 0.6% for the summer cycle; while the scenario for 2061–2080 projects significant decreases in Peff of −30% in the spring cycle and −12% in the summer cycle (Table 3).
Table 3.
Percentage changes in IWR, ETc, and Peff over the annual historical period (1975–2016) for the horizon 2061–2080 with SSP5-8.5.
4. Discussion
4.1. Climate-Change Scenarios
In this research, the long-term horizon (2061–2080) shows increases in the maximum temperature of 2.9 °C and the minimum temperature of 2.2 °C, consequently increasing the average annual temperature by 2.6 °C. These values indicate the variability caused by climate change in the Comarca Lagunera region and align with global temperature rise projections by 2100 (from 3.2 °C to 5.4 °C) [47,48]. In Mexico, CMIP6 scenarios with SSP5-8.5 project an increase of up to 6 °C by the end of this century in Northern Mexico [32]. In this regard, Mendoza-Hernández et al. [49] have reported increases in maximum and minimum temperatures of up to 4 °C in Comarca Lagunera. Furthermore, RCP-8.5 projects a decrease in precipitation relative to the average for the period 2021–2050, leading to a more desert-like environment. Nationally, precipitation is expected to decrease by an average of 15.2%, while for the Comarca Lagunera region, the scenario projects an estimated decrease of 12.9%. This condition will result in reduced runoff in basins located in arid zones, meaning a decrease in the available surface water [50].
4.2. Detection of Point-of-Change Temporal Variations in IWR, ETc, and Peff
The Rodionov test is based on a sequential t-test analysis, where a regime-change index is calculated to accept or reject the hypothesis of a regime change in each observation, determining whether subsequent values are significantly different from the mean of the previous regime [46]. For example, two change points could be identified in the ETc variable. Only one change point is present for Peff and two for IWR (Figure 5). These points indicate significant changes in all three variables [51].
In this study, Rodionov’s sequential approach, based on the weighted means of the IWR, ETc, and Peff regimes, using Huber’s weighting function with parameter α = 1, revealed abrupt changes in the analyzed variables, implying notable climate regime shifts [46]. For the spring cycle, the average Peff value changed in 1984, increasing by 21.2 mm·year−1 until 2014, when it decreased by 54.2 mm·year−1. Due to these increases, the average IWR decreased by 58 mm·year−1 in the same year (1984); meanwhile, the average ETc variable shows a decrease of 37.4 mm·year−1 toward 1983, while for the summer cycle, Peff showed an increase of 94.9 mm·year−1 until 2013 with respect to that in the historical period. In the same year, it was identified that IWR also decreased by 114 mm·year−1, while ETc showed a decrease of −45 mm·year−1 in 1983; and in 2014, it decreased again.
Guzmán-Luna et al. [52] identified, using Rodionov’s method, an increase in the average irrigation requirements for the spring growing season in Central Mexico. This increase was evident starting in 1995 with a cutting length of 20, while with a cutting length of 10, an increase was observed since 2016. Both increases were reflected in the rise in the average temperature during the agricultural cycle.
4.3. Temporal Variations of IWR, ETc, and Peff in Response to Climate Change
In the Comarca Lagunera region, annual variations are observed for the three variables studied (IWR, ETc, and Peff) in both agricultural cycles, showing a significant difference between them. Depending on the season, different climatic conditions are present in the study area, such as annual precipitation, which is higher during the summer agricultural cycle and lower in spring, with accumulations of 67% and 12%, respectively; while the average temperature is lower during the spring agricultural cycle (23.7 °C) compared to that during the summer agricultural cycle (26 °C) [15].
The temporal variation of the IWR in the Comarca Lagunera region is closely linked to the variation and changes in Peff and ETc for forage maize crops [53]. This condition is exacerbated by drought years, which are very common in arid zones of Northern Mexico, as reported by Velázquez-Zapata and Dávila-Ortiz [54]. They indicate that during 2011 and 2012, more than 85% of the country was affected by severe to extreme drought, causing water scarcity and heat waves that resulted in the loss of six million hectares of crops. Furthermore, droughts cause increased pressure on groundwater resources, which are the only source of supply for agricultural irrigation in these crops [55].
For the spring agricultural cycle, due to the lack of rain, it is necessary to apply up to five layers of irrigation in the different phenological stages of forage maize [16]. During the summer agricultural cycle, with greater precipitation, irrigations applied to the crop are reduced to one from two, allowing for storage in dams and reservoirs, as well as the recharge of aquifers in the Comarca Lagunera, which are overexploited [15,16,17,18,19,20,21].
Şen [1] identified a significant increase in the average temperature in the Cukurova region, particularly during summers, using the MCG HadGEM2-ES model with the RCP8.5 scenario and a significant (20%) increase in ETc in maize in a distant future scenario; while the irrigation water requirement increased from 459 mm·year−1 to 618 mm year−1 during the historical period (1971–2000) in the future projection (2069–2098). Shiferaw et al. [56] reported for the Ethiopian River Basin that during the historical period (1992–2015), the averages for Peff, ETc, and PP were 148 mm·year−1, 454.7 mm·year−1, and 306.1 mm·year−1, respectively, using CanRCM4 GCM with the RCP8.5 scenario, where they identified a projected mean Peff of 164 mm·year−1, an ETc of 482 mm·year−1, and an IWR of 330.3 mm·year−1, increases in the three variables of 10%, 6%, and 7%, respectively. Meanwhile, Saeed et al. [17] identified potential increases in ET0 and IWR in the semi-arid continental region of the Middle East north of Iraq, with a long-term horizon, reporting that ET0 increased by 15.9%, while IWR rose by 8.8%, with a 19.8% increase in the average temperature compared to the historical average of 39 °C.
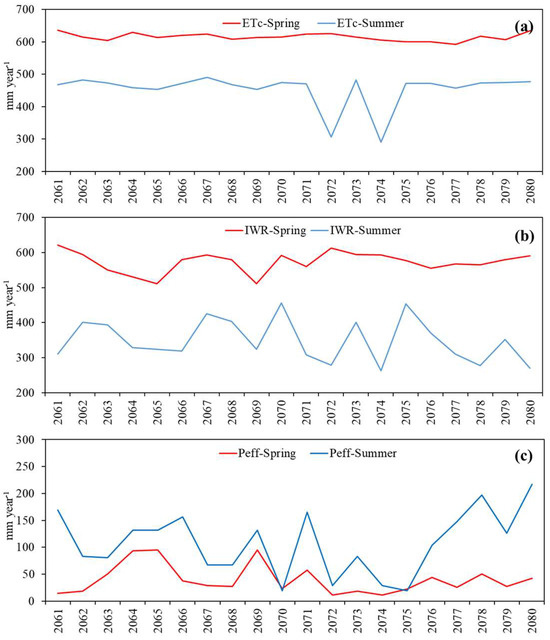
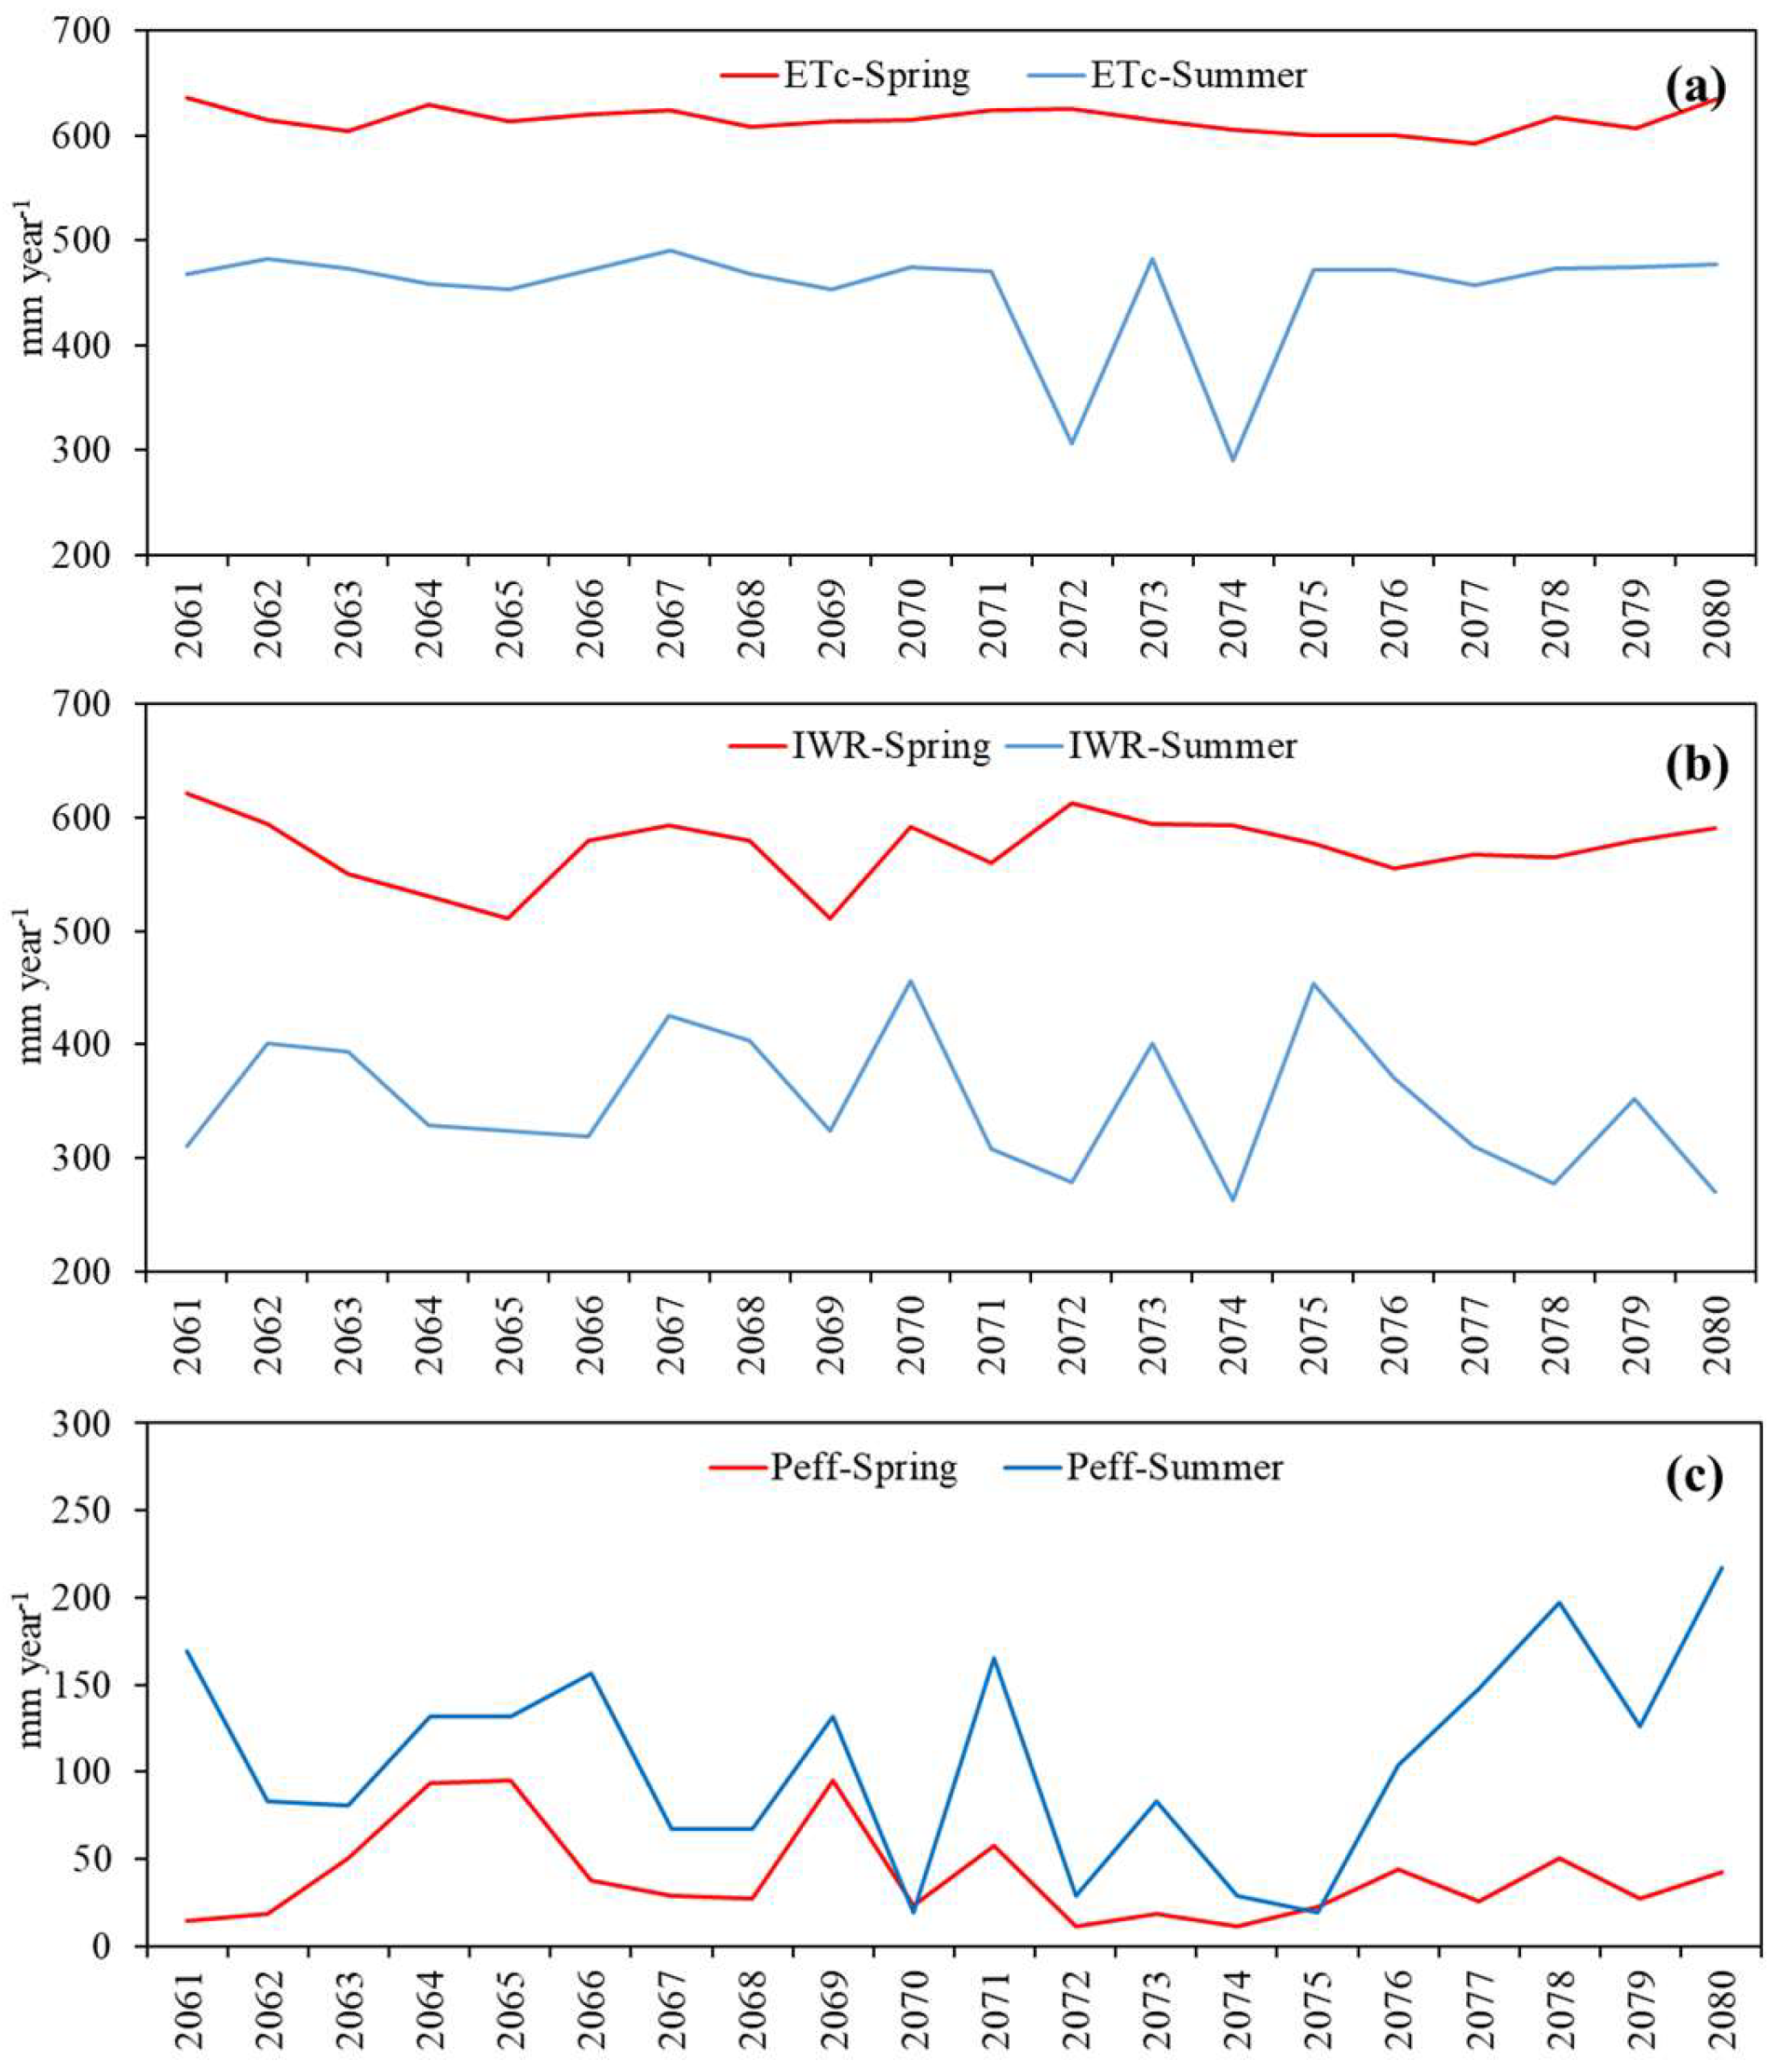
Figure 7 presents the temporal behaviors of the variables IWR, ETc, and Peff in the SSP5-8.5 scenario for the period 2061–2080. It can be observed that for both agricultural cycles, IWR increases toward the end of the time series. This behavior is due to the increase in ETc since as the average temperature increases, so does ETo; consequently, precipitation decreases in both periods [56]. As a result of climate change, IWR will be higher in many corn-producing regions for grain and forage, which will cause demand problems for these products [6].
Figure 7.
(a) Crop evapotranspiration (ETc), (b) irrigation water requirement (IWR) (c) effective rainfall (Peff) for the spring and summer agricultural cycles projected toward the distant horizon (2061–2080).
It has been reported that increases in maximum and minimum temperatures (Tmax and Tmin), caused by climate change, result in a shorter maize-growing season. This leads to a faster accumulation of growing degree days (GDD), which, in turn, reduces the number of days needed to reach a given phenological stage. This situation will demand a greater amount of rainfall to meet the water requirements of the maize [57,58].
5. Conclusions
The SSP5-8.5 scenario of MCG MPI-ESM1-2-LR, applied to the Comarca Lagunera region for the distant future (2061–2080), projects an increase in average temperature of 3.1°C and a decrease in precipitation of 41 mm/year, which directly impact variables associated with forage maize production, such as crop evapotranspiration, effective precipitation, and, consequently, irrigation water requirements. Crop evapotranspiration (ETc) for forage maize in the Comarca Lagunera region is higher than effective precipitation (Peff) in both growing seasons. Therefore, a significant amount of water must be provided to the crop through an irrigation system. Projected temperature increases in the SSP5-8.5 climate-change scenario will result in higher ETc and, consequently, a greater irrigation water requirement. This would jeopardize the production of forage maize in the distant future, significantly reducing the area planted with this crop. In the region, water resources are under pressure from urban, industrial, and livestock uses.
This study highlights the importance of improving irrigation efficiency in the Comarca Lagunera region to maintain a sustainable supply of irrigation water in the face of climate change, as water availability for agriculture could be a major challenge in the future. Furthermore, it is necessary to implement mitigation and adaptation measures to reduce water use, such as water storage, the use of drought- and high-temperature-tolerant forage maize seeds, adjusting planting dates, soil conservation, the use of biofertilizers, and improved water management, among others. All these measures could prove to be useful in combating the challenge of water availability for agriculture in the future.
Finally, it should be mentioned that a limitation in this research was the lack of historical irrigation records to validate the Cropwat model; however, with the information simulated by the program, it was possible to evaluate the irrigation water requirement, obtaining reliable results.
Author Contributions
Conceptualization, A.C.-G., R.A.-R., G.P.-R. and A.I.M.-R.; methodology, A.C.-G. and A.I.M.-R.; software, J.S.-R. and G.P.-R.; validation, R.A.-R. and A.I.M.-R.; formal analysis, J.S.-R. and A.C.-G.; investigation, A.C.-G., R.A.-R. and A.I.M.-R.; resources, R.A.-R.; data curation, A.C.-G. and G.P.-R.; writing—original draft preparation, A.C.-G. and R.A.-R.; writing—review and editing, A.C.-G., A.R.-L. and A.I.M.-R.; visualization, G.P.-R., J.S.-R. and A.R.-L.; supervision, R.A.-R., A.R.-L. and J.S.-R.; project administration, R.A.-R. and A.I.M.-R.; funding acquisition, R.A.-R. and A.I.M.-R. All authors have read and agreed to the published version of the manuscript.
Funding
This research received no external funding. The APC was funded by the DGIP program at Chapingo Autonomous University.
Data Availability Statement
The original contributions presented in this study are included in the article. Further inquiries can be directed to the corresponding author.
Acknowledgments
The first author thanks the Secretariat of Science, Humanities, Technology, and Innovation (SECIHTI), Mexico, for the doctoral fellowship and Chapingo Autonomous University for postgraduate studies.
Conflicts of Interest
The authors declare no conflicts of interest.
References
- Şen, B. Determining the Changing Irrigation Demands of Maize Production in the Cukurova Plain under Climate Change Scenarios with the CROPWAT Model. Water 2023, 15, 4215. [Google Scholar] [CrossRef] [Scilit]
- FAO. Water for Sustainable Food and Agriculture. A Report Produced for the G20 Presidency of Germany. 2017. Available online: https://www.fao.org/3/i7959e/i7959e.pdf (accessed on 12 October 2025).
- Tahir, N.; Sattar, M.T. Sustainable Water Use in Agriculture: A Review of Worldwide Research. Int. J. Agric. Biosci. 2022, 11, 246–250. [Google Scholar] [CrossRef] [Scilit] [PubMed]
- Mojid, M.A.; Mainuddin, M.; Murad, K.F.I.; Mac Kirby, J. Water usage trends under intensive groundwater-irrigated agricultural development in a changing climate–Evidence from Bangladesh. Agric. Water Manag. 2021, 251, 106873. [Google Scholar] [CrossRef] [Scilit]
- Khaydar, D.; Chen, X.; Huang, Y.; Ilkhom, M.; Liu, T.; Friday, O.; Gulkaiyr, O. Investigation of crop evapotranspiration and irrigation water requirement in the lower Amu Darya River Basin, Central Asia. J. Arid Land. 2021, 13, 23–39. [Google Scholar] [CrossRef] [Scilit]
- Soomro, S.; Solangi, G.S.; Siyal, A.A.; Golo, A.; Bhatti, N.B.; Soomro, A.G.; Memon, A.H.; Panhwar, S.; Keerio, H.A. Estimation of irrigation water requirement and irrigation scheduling for major crops using the CROPWAT model and climatic data. Water Pract. Technol. 2023, 18, 685–700. [Google Scholar] [CrossRef] [Scilit]
- Gabr, M.E.; Fattouh, E.M. Assessment of irrigation management practices using FAO-CROPWAT 8, case studies: Tina Plain and East South El-Kantara, Sinai, Egypt. Ain Shams Eng. J. 2021, 12, 1623–1636. [Google Scholar] [CrossRef] [Scilit]
- Neme-Castillo, O.; Valderrama-Santibáñez, A.L.; Chiatchoua, C. Determinants of productive water consumption and effects on economic activity in Mexico. Econ. Soc. Y Territ. 2021, 21, 505–537. [Google Scholar]
- Montesillo-Cedillo, J.L. Valor del agua en la producción agrícola bajo riego en México. Rev. Mex. Cienc. Agríc. 2023, 14, ME:e2715. [Google Scholar] [CrossRef] [Scilit]
- Bahrun, A.H.; Nurfaida; Ridwan, I.; Zul, A.F.; Widiayani, N.; Kusumah, R. Management of planting system based on water balance patterns on corn plants using Cropwat 8.0 model. IOP Conf. Ser.: Earth Environ. Sci. 2019, 343, 012015. [Google Scholar] [CrossRef] [Scilit]
- Cruz-González, A.; Arteaga-Ramírez, R.; Sánchez-Cohen, I.; Soria-Ruiz, J.; Monterroso-Rivas, A.I. Impacts of climate change on corn production in Mexico. Rev. Mex. Cienc. Agríc. 2024, 15, 1–13. [Google Scholar]
- Granados-Niño, J.A.; Sánchez-Duarte, J.I.; Ochoa-Martínez, E.; Rodríguez-Hernández, K.; Reta-Sánchez, D.G.; López-Calderón, M.J. Efecto del ciclo de producción sobre el potencial de rendimiento y calidad nutricional del maíz forrajero en la Comarca Lagunera. Rev. Mex. Cienc. Agríc. 2022, 13, 207–217. [Google Scholar] [CrossRef] [Scilit]
- SIAP. Avance de Siembras y Cosechas Resumen por Estado. Servicio de Información Agroalimentaria y Pesquera. 2025. Available online: https://nube.agricultura.gob.mx/avance_agricola/ (accessed on 9 November 2025).
- Anaya-Salgado, A.; Quevedo-Nolasco, A.; Bolaños-González, M.A.; Flores-Velázquez, J.; Reyes-González, A.; Santana-Espinoza, S.; Maltos-Buendía, J.; Sánchez-Duarte, J.I.; Maldonado-Jaquez, J.A. The Water Efficiency and Productivity of Forage Maize (Zea mays L.) in a Semi-Arid Region Under Different Humidity, Nitrogen, and Substrate Levels. Crops 2026, 6, 1. [Google Scholar] [CrossRef] [Scilit]
- Montemayor-Trejo, J.A.; Lara-Míreles, J.L.; Woo-Reza, J.L.; Munguía-López, J.; Rivera-González, M.; Trucíos-Caciano, R. Producción de maíz forrajero (Zea mays L.) en tres sistemas de irrigación en la comarca Lagunera de Coahuila y Durango, México. Agrociencia 2012, 46, 267–278. [Google Scholar]
- Gutiérrez-Guzmán, U.N.; Ríos-Vega, M.E.; Núñez-Hernández, G.; Esquivel-Romo, A.; Vázquez-Navarro, J.M.; Anaya-Salgado, A. Producción de maíz forrajero con dos sistemas de riego y tres niveles de la evaporación aplicada. Rev. Mex. Cienc. Agríc. 2022, 28, 263–273. [Google Scholar] [CrossRef] [Scilit]
- Saeed, F.H.; Al-Khafaji, M.S.; Al-Faraj, F.A.M. Sensitivity of Irrigation Water Requirement to Climate Change in Arid and Semi-Arid Regions towards Sustainable Management of Water Resources. Sustainability 2021, 13, 13608. [Google Scholar] [CrossRef] [Scilit]
- Nie, T.; Gong, Z.; Zhang, Z.; Wang, T.; Sun, N.; Tang, Y.; Chen, P.; Li, T.; Yin, S.; Zhang, M.; et al. Irrigation Scheduling for Maize under Different Hydrological Years in Heilongjiang Province, China. Plants 2023, 12, 1676. [Google Scholar] [CrossRef] [Scilit]
- Solangi, G.S.; Shah, S.A.; Alharbi, R.S.; Panhwar, S.; Keerio, H.A.; Kim, T.-W.; Memon, J.A.; Bughio, A.D. Investigation of Irrigation Water Requirements for Major Crops Using CROPWAT Model Based on Climate Data. Water 2022, 14, 2578. [Google Scholar] [CrossRef] [Scilit]
- Iacuzzi, N.; Tortorici, N.; Mosca, C.; Bondì, C.; Sarno, M.; Tuttolomondo, T. Crop Water Requirement Estimated with Data-Driven Models Improves the Reliability of CROPWAT 8.0 and the Water Footprint of Processing Tomato Grown in a Hot-Arid Environment. Agronomy 2025, 15, 1533. [Google Scholar] [CrossRef] [Scilit]
- Zavala-Borrego, F.; Reyes-González, A.; Alvarez-Reyna, V.D.; Cano-Rios, P.; Rodríguez-Moreno, V.M. Efecto De La Tasa De evapotranspiración En área Foliar, Potencial hídrico Y Rendimiento De maíz Forrajero. Rev. Mex. Cienc. Agríc. 2022, 13, 407–420. [Google Scholar]
- CONAGUA. Normales Climatológicas por Estado. 2025. Available online: https://smn.conagua.gob.mx/es/ (accessed on 7 August 2025).
- Guijarro, J.A. Homogeneización de Series Climáticas con Climatol. Versión 3.1. Agencia Estatal de Meteorología (AEMET). 2018. Available online: https://repositorio.aemet.es/bitstream/20.500.11765/12185/1/homog_climatol-es.pdf.
- Kessabi, R.; Hanchane, M.; Guijarro, J.A.; Krakauer, N.Y.; Addou, R.; Sadiki, A.; Belmahi, M. Homogeneización y análisis de tendencias de las series mensuales de precipitación en la región de Fez-Mequinez, Marruecos. Clima 2022, 10, 64. [Google Scholar] [CrossRef] [Scilit]
- Montero-Martínez, M.J.; Andrade-Velázquez, M. Effects of Urbanization on Extreme Climate Indices in the Valley of Mexico Basin. Atmosphere 2022, 13, 785. [Google Scholar] [CrossRef] [Scilit]
- Caloiero, T.; Filice, E.; Coscarelli, R.; Pellicone, G. A Homogeneous Dataset for Rainfall Trend Analysis in the Calabria Region (Southern Italy). Water 2020, 12, 2541. [Google Scholar] [CrossRef] [Scilit]
- López Hernández, N.A.; Martínez Sifuentes, A.R.; Halecki, W.; Trucíos Caciano, R.; Rodríguez Moreno, V.M. An Assessment of the Impact of Climate Change on Maize Production in Northern Mexico. Atmosphere 2025, 16, 455. [Google Scholar] [CrossRef] [Scilit]
- Trilles, S.; Juan, P.; Díaz-Avalos, C.; Ribeiro, S.; Painho, M. Reliability Evaluation of the Data Acquisition Potential of a Low-Cost Climatic Network for Applications in Agriculture. Sensors 2020, 20, 6597. [Google Scholar] [CrossRef] [Scilit]
- Cruz-González, A.; Arteaga-Ramírez, R.; Soria-Ruiz, J.; Sánchez-Cohen, I.; Monterroso-Rivas, A.I.; Quevedo-Nolasco, A. Climate change projections in temperature and precipitation using cmip6 in Central Mexico. Theor. Appl. Clim. 2025, 156, 97. [Google Scholar] [CrossRef] [Scilit]
- Semenov, M.A.; Senapati, N.; Coleman, K.; Collins, A.L. A dataset of CMIP6-based climate scenarios for climate change impact assessment in Great Britain. Data Brief. 2024, 55, 110709. [Google Scholar] [CrossRef] [Scilit]
- Semenov, M.A.; Stratonovitch, P. Adapting wheat ideotypes for climate change: Accounting for uncertainties in CMIP5 climate projections. Clim. Res. 2015, 65, 123–139. [Google Scholar] [CrossRef] [Scilit]
- IPCC (Intergovernmental Panel on Climate Change). Grupo Intergubernamental de Expertos sobre el Cambio Climático. WGI Interactive Atlas: Regional information. 2022. Available online: https://interactive-atlas.ipcc.ch (accessed on 5 September 2025).
- O’Neill, B.; van Aalst, M.; Ibrahim, Z.Z.; Ford, L.B.; Bhadwal, S.; Buhaug, H.; Diaz, D.; Frieler, K.; Garschagen, M.; Magnan, A.; et al. Chapter 16: Key Risks Across Sector and Regions. In Climate Change 2022: Impacts, Adaptation, and Vulnerability. Contribution of Working Group II to the Sixth Assessment Report of the Intergovernmental Panel on Climate Change; Cambridge University Press: Cambridge, UK, 2022. [Google Scholar]
- Xiang, Y.; Cheng, R.; Wang, M.; Ding, Y. Response of Matching Degree between Precipitation and Maize Water Requirement to Climate Change in China. Agronomy 2024, 14, 181. [Google Scholar] [CrossRef] [Scilit]
- Muller, W.A.; Jungclaus, J.H.; Mauritsen, T.; Baehr, J.; Bittner, M.; Budich, R.; Bunzel, F.; Esch, M.; Ghosh, R.; Haak, H.; et al. A Higher-resolution Version of the Max Planck Institute Earth System Model (MPI-ESM1.2-HR). J. Adv. Model. Earth Syst. 2018, 10, 1383–1413. [Google Scholar] [CrossRef] [Scilit]
- Ghassabi, Z.; Fattahi, E.; Habibi, M. Variability in Future Atmospheric Circulation Patterns in the MPI-ESM1-2-HR Model in Iran. Atmosphere 2023, 14, 307. [Google Scholar] [CrossRef] [Scilit]
- Saeed, F.; Haensler, A.; Weber, T.; Hagemann, S.; Jacob, D. Representation of Extreme Precipitation Events Leading to Opposite Climate Change Signals over the Congo Basin. Atmosphere 2013, 4, 254–271. [Google Scholar] [CrossRef] [Scilit]
- Allen, R.G. REF-ET for Windows: Reference Evapotranspiration Calculator Version 4. Kimberly: University of Idaho Research and Extension Center ID. 2000. Available online: https://www.uidaho.edu/idaho-ag-experiment-station/services/water-resources (accessed on 10 September 2025).
- Allen, R.G. REF-ET, versión 4.1; REF-ET: Reference Evapotranspiration Calculation Software for FAO and ASCE Standardized Equations; University of Idaho: Moscow, ID, USA, 2016.
- Hargreaves, G.H.; Samani, Z.A. Reference crop evapotranspiration from temperature. Appl. Eng. Agric. 1985, 1, 96–99. [Google Scholar] [CrossRef] [Scilit]
- FAO. CROPWAT Software. 2020. Available online: http://www.fao.org/land-water/databases-and-software/cropwat/en/ (accessed on 9 July 2025).
- Ali, M.H.; Mubarak, S. Effective rainfall calculation methods for field crops: An Overview, Analysis and New Formulation. Asian Res. J. Agric. 2017, 7, 1–12. [Google Scholar] [CrossRef] [Scilit]
- United States Department of Agriculture. Irrigation Water Requirements, Technical Release; United States Department of Agriculture: Washington, DC, USA, 1967; Volume 21. [Google Scholar]
- Pélissié, M.; Devictor, V.; Dakos, V. A systematic approach for detecting abrupt shifts in ecological timeseries. Biol. Conserv. 2024, 290, 110429. [Google Scholar] [CrossRef] [Scilit]
- Rodionov, S.N.; Overland, J.E.; Bond, N.A. The Aleutian low and winter climatic conditions in the Bering Sea. Part I: Classification. J. Clim. 2005, 18, 160–177. [Google Scholar] [CrossRef] [Scilit]
- Rodionov, S. A Sequential Method of Detecting Abrupt Changes in the Correlation Coefficient and Its Application to Bering Sea Climate. Climate 2015, 3, 474–491. [Google Scholar] [CrossRef] [Scilit]
- IPCC. Climate Change 2021, The Physical Science Basis Summary for Policymakers Working Group I Contribution to the Sixth Assessment Report of the Intergovernmental Panel on Climate Change; IPCC: Geneva, Switzerland, 2021. [Google Scholar]
- Karim, R.; Tan, G.; Ayugi, B.; Babaousmail, H.; Liu, F. Evaluation of Historical CMIP6 Model Simulations of Seasonal Mean Temperature over Pakistan during 1970–2014. Atmosphere 2020, 11, 1005. [Google Scholar] [CrossRef] [Scilit]
- Mendoza-Hernández, J.M.; Zermeño-González, A.; Covarrubias-Ramírez, J.M.; Cortés-Bracho, J.J. Proyecciones climáticas para el estado de coahuila usando el modelo precis bajo dos escenarios de emisiones. Agrociencia 2013, 47, 523–537. [Google Scholar]
- Martínez-Austria, P.F.; Patriño-Gómez, C. Efectos del cambio climático en la disponibilidad de agua en México. Tecnol. Cienc. Agua 2012, III, 5–20. [Google Scholar]
- Stirnimann, L.; Conversi, A.; Marini, S. Detection of regime shifts in the environment: Testing “STARS” using synthetic and observed time series. ICES J. Mar. Sci. 2019, 76, 2286–2296. [Google Scholar] [CrossRef] [Scilit]
- Guzmán-Luna, L.; Quevedo-Nolasco, A.; Pascual-Ramírez, F.; Bolaños-González, M.A.; Guzmán-Luna, J.R. Variación temporal de los requerimientos de riego en maíz método Rodionov en DR001, Pabellón, Aguascalientes. Rev. Mex. Cienc. Agríc. 2023, 14, 052–065. [Google Scholar] [CrossRef] [Scilit]
- Kashyap, D.; Agarwal, T. Temporal trends of climatic variables and water footprint of rice and wheat production in Punjab, India from 1986 to 2017. J. Water Clim. Chang. 2021, 12, 1203–1219. [Google Scholar] [CrossRef] [Scilit]
- Velázquez-Zapata, J.A.; Dávila-Ortiz, R. Projected Meteorological Drought in Mexico Under CMIP6 Scenarios: Insights into Future Trends and Severity. Geosciences 2025, 15, 186. [Google Scholar] [CrossRef] [Scilit]
- Ochoa-Noriega, C.A.; Aznar-Sánchez, J.A.; Velasco-Muñoz, J.F.; Álvarez-Bejar, A. The Use of Water in Agriculture in Mexico and Its Sustainable Management: A Bibliometric Review. Agronomy 2020, 10, 1957. [Google Scholar] [CrossRef] [Scilit]
- Shiferaw, Y.G.; Ebstu, E.T.; Lohani, T.K. Representative concentration pathways (RCPs) used as a tool to evaluate climate change impact on maize crop production in the Woybo catchment of Ethiopia. J. Water Clim. Chang. 2024, 15, 2714–2730. [Google Scholar] [CrossRef] [Scilit]
- Cruz-González, A.; Arteaga-Ramírez, R.; Sánchez-Cohen, I.; Soria-Ruiz, J.; Monterroso-Rivas, A.I.; Flores-Magdaleno, H. Tendencia y variabilidad climática: Efecto en la producción de maíz en el Distrito de Desarrollo Rural Atlacomulco. Ecosis Recur Agropec. 2023, Esp. III, e3868. [Google Scholar] [CrossRef] [Scilit]
- Aydın, Y. Quantification of water requirement of some major crops under semi-arid climate in Turkey. PeerJ 2022, 10, e13696. [Google Scholar] [CrossRef] [Scilit]

Disclaimer/Publisher’s Note: The statements, opinions and data contained in all publications are solely those of the individual author(s) and contributor(s) and not of MDPI and/or the editor(s). MDPI and/or the editor(s) disclaim responsibility for any injury to people or property resulting from any ideas, methods, instructions or products referred to in the content. |
© 2026 by the authors. Licensee MDPI, Basel, Switzerland. This article is an open access article distributed under the terms and conditions of the Creative Commons Attribution (CC BY) license.