


Abstract
This study examines how often adults with a travel-limiting condition or disability use online shopping and home delivery. It uses the person file of the 2022 National Household Travel Survey (NHTS), a household-based survey, restricted to community-dwelling adults aged 18 and over. Delivery counts are heavily overdispersed, so survey-weighted negative binomial models with household-clustered standard errors are used, with delivery frequency as the outcome. Covariates are entered sequentially. Adjusting for demographics alone, adults with a travel-limiting condition do not receive significantly more deliveries; adding socioeconomic status leaves the estimate null; only after employment, driver status, and household vehicle and driver counts are added does a positive association emerge. Because those variables may be consequences rather than causes of a travel-limiting condition, this association is contingent on the model specification and does not constitute evidence of a robust unconditional difference. Within the subsample of adults who receive at least one delivery, however, the pattern is stronger and specification-stable: adults with a travel-limiting condition receive more deliveries overall and disproportionately more food, grocery, and service or personal deliveries than general goods. All estimates are cross-sectional associations and cannot establish direction or cause. The NHTS records how often deliveries occur but not why, so whether delivery compensates for inaccessible travel options remains untested and requires data on accessibility and trip substitution.
1. Introduction
Online shopping and home delivery services are vital for people with disabilities (PWDs), providing convenience and minimizing the necessity for physical travel. These services address barriers such as mobility issues and inaccessible physical stores, providing essential goods and services to those who might otherwise struggle [1,2,3,4,5]. The COVID-19 pandemic accelerated the adoption of online shopping, and prior studies report that people with disabilities were among those who benefited from this shift. Income, technological literacy, and household location influence the likelihood of using these services, with urban and tech-savvy households exhibiting higher usage rates [6,7]. Physical barriers in stores, including narrow aisles and inaccessible facilities, frequently make in-person shopping difficult for individuals with disabilities. Consequently, online shopping has emerged as a crucial alternative, offering greater convenience and independence [8,9]. Improving the accessibility of online shopping platforms, reducing costs, and ensuring user-friendly interfaces are essential to maximizing the benefits of these services for people with disabilities. Solutions such as training store employees and redesigning physical spaces to be more accessible can also enhance the shopping experience [10].
The factors that affect the decision to use home deliveries include income, technology, disabilities, and health issues. According to a survey conducted in Switzerland, online grocery shopping increased by about 13% during the pandemic. Shopping, delivery costs, delivery subscriptions, and the risk of infection were essential factors in choosing online shopping [11]. One reason people with disabilities choose to shop online is because of in-person shopping barriers. People with disabilities are not always able to easily ask an employee for help since they may have trouble communicating and are not treated the same as other individuals. Physical barriers are also prevalent in stores and malls. Some stores have narrow walkways that may prevent someone in a wheelchair from moving around freely. Other physical factors that affect people with disabilities include poorly made fitting rooms, bathrooms that are not easily accessible, cash registers that cannot be reached, and stores that have staircases and no elevators. Another issue with staircases is that they often lead to poor escape routes and are not designed for those with physical disabilities [12]. People in the vision-impaired group note that the font size of signs needs to be bigger, and Braille should be included on signs. Hearing-impaired persons have trouble communicating and have difficulties in emergencies. Therefore, these PWDs may resort to online shopping [13]. Potential solutions to enable people with disabilities to access the internet and shop online include lowering the cost of internet use and online shopping subscriptions, since employment is lower among people with disabilities [14].
Moreover, PWDs are at a greater risk of food insecurity. Food insecurity is defined as not having enough food to meet a household’s needs. Around 35.2% of households with at least one member with a disability are at risk of food insecurity [15]. College students and young adults with disabilities are most at risk. Numerous barriers, such as social, environmental, and financial factors, prevent access to healthy food. Moreover, inequalities are present in the health and well-being of people with disabilities. PWDs showed lower levels of happiness, life satisfaction and self-worth, and higher levels of anxiety [16]. Also, a lack of self-confidence caused them to stay home from activities and not socialize [17]. The lack of access to public transportation decreases PWDs’ participation in everyday activities. Individuals who used paratransit, which is public transit specifically for those with disabilities, reported the highest social participation [18]. Those with lower incomes and households in urban areas use public transportation more often, but it is not always easily accessible for PWDs [19]. Rural areas have the least access to public transport [18].
Therefore, it is vital to understand the extent of online shopping use and its impact on the daily lives of individuals with disabilities. The goal of this study is to investigate the role of online shopping and home delivery services in providing convenience and accessibility for adults with travel-limiting conditions, using 2022 NHTS data. The analysis of online shopping presented here is our own; the NHTS collects delivery-frequency items but does not itself study online shopping. Insights from this research can guide improvements in service accessibility and inform policy decisions to better support this population.
A note on terminology: This study measures disability using the single NHTS item MEDCOND, which asks whether the respondent has a condition or disability that makes travel difficult. That is a narrower construct than disability in its clinical, legal, or social sense, and it may exclude sensory, cognitive, and other disabilities that do not produce a reported travel limitation. Where this paper reports its own results, we therefore refer to adults with a travel-limiting condition or disability. The broader terms people with disabilities and PWDs are retained only when summarizing prior studies whose populations were defined differently from ours.
2. Literature Review
2.1. Online Shopping and Home Delivery
Online shopping and home delivery services have emerged as essential resources for individuals with disabilities, offering convenience and accessibility in obtaining goods and services. PWDs often choose to stay home due to difficulties traveling. The order fill rate is critical when shopping online, whether considering people with or without disabilities. Most customers want to purchase groceries in a single online purchase, so all items must be in stock. Customers also participate in online shopping if all items are unavailable in person and as long as the delivery service is free or offered at a low cost [20]. Demographics also influence the choice to shop online. The likelihood of purchasing goods online has increased partly because younger generations participate in more online shopping. However, more adults in households are choosing to shop online. A higher household income and education level influence online shopping, while lower income and education levels result in fewer online purchases [21].
Since the COVID-19 pandemic, online shopping has increased as people have become concerned about catching the virus and have adapted to this new form of shopping. The factors that affect the decision to use home deliveries include income, technology, disabilities, and health issues. According to a survey conducted in Switzerland, online grocery shopping increased by about 13% during the pandemic. Shopping, delivery costs, delivery subscriptions, and the risk of infection were essential factors in choosing online shopping [11]. Age, income, tech savviness, and home location were associated with online shopping during the pandemic. Higher incomes and more tech-savvy households increased the chance of purchasing items online and paying for deliveries. During the pandemic, participants in their 70s also had a large increase in online purchasing [11]. Also, households in urban and suburban areas increased their online shopping slightly more than those in rural areas [22].
There are several improvements that regular online shoppers want from online stores. The most frequent suggestions are a broad assortment and delivery time/flexibility. Customers prefer to shop at online stores that have all items in stock and want them delivered quickly. Another proposed improvement is to reduce economic costs, which suggests that online prices differ from those in stores. Additionally, delivery fees are factors that increase the price of items, and usability issues and difficulty accessing the items online are also issues that need to be addressed [23]. Solutions can be implemented to allow PWDs to shop in-store or online. To prevent difficulties in malls or stores, a solution could be to train store employees to be aware of the needs of people with disabilities and redesign the structure of malls to make all places more accessible to people with disabilities [12].
2.2. Public Transportation
People with disabilities (PWDs) are often faced with obstacles while traveling, lessening how frequently they travel [24]. They take 10–30% fewer trips than people without disabilities, or 2–4 fewer trips per week, and the difference is mainly in non-work trips. Compared with the general population, PWDs use public transportation more, ride with others more, and walk or drive less. Also, they travel shorter distances overall, and it takes them longer to get from one place to another since their mode of transportation is slower. PWDs also face many barriers, such as changes in ground surfaces, specific seat designs, a lack of ramps for boarding, and inaccessibility inside vehicles [10].
Infrastructure accessibility is essential to ensuring equitable access to transit; however, transit systems do not always comply with regulations. Based on funding, the top twenty-six public transportation facilities in the United States have an overall accessibility score of 31.9 out of 62 possible points, as ranked by the TRACT system. A study in the Klang Valley had participants with disabilities rate the accessibility of various infrastructure elements, such as parking, steps, ramps, escalators, platforms, and toilets, in terms of perceived usability. Ramps and steps were considered the least accessible for people with disabilities, while escalators and toilets had the highest accessibility ratings. The participants also felt unsafe when boarding and exiting vehicles [25]. A lack of priority seating for people with disabilities has also been a prominent issue in public transit [26].
Both the type and length of disability create barriers specific to the individual. Assumptions have often been made about people with disabilities as if they were all the same instead of accounting for individual needs. Most transportation studies focus on mobility disabilities; however, there are many other disabilities, including cognitive, visual, mobility, and hearing disabilities. People with mental disabilities or visual impairments who have complex trips and multiple transfers often require assistance [27]. Feelings of discouragement and frustration have also negatively affected people with disabilities in need of public transit, and they do not want to be a burden to others when needing assistance [28]. Household location also affects travel when it does not accommodate people with disabilities. Nearly two-thirds of people in rural areas lack access to public transportation, leading to fewer trips. Household income also plays a role in transportation since a higher income results in more trips in a personal vehicle, while a lower income results in more extensive use of public transportation [29].
Studies have identified barriers from the time PWDs leave their homes to their destinations. One major obstacle is the need for first- or last-mile connections. Often, transit services assume all people can make the trip to and from the transit station; however, people with disabilities are not always able to do so. Inconsistent infrastructure, such as sidewalks, hinders PWDs from reaching public transit [30]. The number of travel minutes per minute of out-of-home activity is another significant barrier PWDs face. Data from the American Time Use Survey from 2008 to 2019 show that PWDs were likely to spend 50% more time traveling, which was associated with lower life satisfaction. The average time for PWDs was 17.3 s per minute of out-of-home activities, compared with 11 s for those without disabilities. Also, PWDs took fewer work trips. Results show that 27% took a work trip versus 55% for people without a disability [31].
Another way to increase access to public transit for people with disabilities is to provide learning programs that teach the best ways to travel. A survey of individuals with intellectual and developmental disabilities who received travel training from the Kentucky Center showed significant gains in participants’ ability to travel independently. After the training, there were enhanced travel skills for PWDs [32]. Similarly, personalized travel planning can help people with cognitive disabilities organize trips [27]. Travel training and planning for PWDs can reduce barriers to using public transit and promote inclusive access to transportation.
2.3. Social Participation
Participation in society can be challenging for PWDs because of the inequalities they face. A lack of access to public and private transportation leads to challenges like attending work and completing everyday tasks. In this case, employment is lower, and less money is spent on activities. Finally, web accessibility is more challenging for those with visual impairments, thereby reducing internet use. Private modes of transportation and public transit can be challenging for PWDs to access, ultimately hindering their participation in society. PWDs who use individual vehicles have noted difficulty entering and exiting their vehicles, and a lack of accessible parking spots has also been a hindrance. They also express how their slower reflexes and reaction times are a safety hazard when driving [26]. Individuals were more likely to use personal vehicles if they had a higher income. Those who had to rely on family and friends for private rides reported decreased social participation because of unreliability [18].
According to the National Household Travel Survey, walking and ridesharing are two other private modes of transportation. Walking is the least used private mode of transportation; however, walking is used the most for shorter distances due to the accommodation of medical devices such as wheelchairs [19]. Any disability led to a decrease in the use of rideshare compared to those without disabilities; however, PWDs who used rideshare took more trips than those without disabilities. More PWDs used rideshare if they were healthy, younger, employed, or lived in densely populated areas. Assistive devices such as wheelchairs led to a decrease in the overall use of rideshare, mainly due to the lack of wheelchair-accessible cars [33]. Also, the purpose of the trip influences transportation, such as shopping or socializing [19].
Table 1 summarizes key studies on online shopping, public transportation, and social participation among people with disabilities, highlighting thematic focus areas, methodologies, and major findings.
Table 1.
Summary of Studies on Online Shopping and Home Delivery Among People with Disabilities.
2.4. Theoretical Framing
Two frameworks inform our interpretation of the associations reported below, and we introduce them here rather than in the Discussion as they are relevant to the choice of variables. The social model of disability holds that disability arises from the interaction between an impairment and an environment that is not built to accommodate it, rather than from the impairment alone. Applied here, it implies that delivery use among adults with a travel-limiting condition should be understood in relation to the accessibility of the travel and retail environment, and it is also the reason we treat employment, driver status, and household vehicle access as potentially endogenous to condition status rather than as neutral background characteristics: under this model, not driving is partly an environmental outcome, not merely a personal attribute. Digital divide theory holds that access to and effective use of digital technologies is stratified by income, education, and skill. It motivates the inclusion of household income and education as covariates, and it predicts that any advantage delivery offers will be unevenly distributed, since the households most constrained in physical travel are also disproportionately those with least capacity to substitute digitally.
The public-transportation and social-participation literature summarised above bears on this study in two specific ways, although those studies do not themselves examine online shopping. First, findings that first- and last-mile connections are a recurring barrier motivate our treatment of driver status and household vehicle count as mobility variables rather than as demographic controls: they proxy the practical availability of a trip, not a preference. Second, findings that reduced out-of-home activity is associated with reduced social participation are why we decline to interpret higher delivery frequency as unambiguously beneficial and instead flag substitution as an untested hypothesis in the Discussion. Neither body of work provides a national estimate of delivery frequency by disability status disaggregated by delivery type, which is the gap this study addresses.
2.5. Research Questions
The literature reviewed above establishes that online delivery is used disproportionately by some groups and that people with disabilities face barriers in physical retail, but it does not establish how delivery use differs by disability status in a nationally representative adult sample once socioeconomic and mobility differences are taken into account, nor whether any difference is uniform across delivery types; existing national-survey work has generally treated deliveries as a single count. This study therefore asks three questions. RQ1: Do adults with a travel-limiting condition receive more online purchase deliveries than adults without one, and is any difference robust to the order in which demographic, socioeconomic, and mobility covariates are introduced? RQ2: Among adults who use delivery at all, does delivery frequency differ by travel-limiting condition status? RQ3: Does any difference vary across food, goods, grocery, and service or personal deliveries?
3. Materials and Methods
3.1. Data
Analyses were conducted in Python 3.12 using pandas for data management and statsmodels 0.14 for estimation; variance inflation factors were computed with statsmodel’s variance_inflation_factor on patsy design matrices. No merging across NHTS files was required: all analysis variables are drawn from the public-use person file, and household attributes such as HHSIZE, HHVEHCNT, DRVRCNT, HHFAMINC_IMP and URBRUR are already carried on the person record. The variables used are MEDCOND, DELIVER, DELIV_FOOD, DELIV_GOOD, DELIV_GROC, DELIV_PERS, R_AGE, R_SEX_IMP, R_RACE_IMP, EDUC, HHFAMINC_IMP, WORKER, DRIVER, HHSIZE, HHVEHCNT, DRVRCNT, URBRUR, WTPERFIN and HOUSEID. Negative response codes (−1 appropriate skip, −7 refused, −8 don’t know, −9 not ascertained) were treated as missing throughout and never recoded to substantive values. Reference categories are White, male, urban, employed, driver, high school or less, and household income under $25,000. The person’s weight was normalized so that the weights sum to the unweighted sample size, so weighting affects point estimates but not the nominal sample size. Confidence intervals for model coefficients are Wald intervals on the log scale, exponentiated; intervals for weighted descriptive statistics use Taylor-series linearization with households as the clustering unit. Variable definitions and weight application follow the 2022 NHTS User’s Guide and codebook.
The NHTS is a household-based survey distributed as a set of linked data files rather than as several separate datasets: a household file, a person file, a trip file, and a vehicle file. The household file records household characteristics, and the person file records characteristics of the individual members of those households, so person-level estimates derive from a household sample. This study uses the personal characteristics of each respondent from each household. The household dataset describes the characteristics of each respondent’s household. The trip dataset consists of the trip characteristics for each travel day. The vehicle dataset describes the vehicle characteristics of each vehicle in the household [34]. The survey has been conducted nine times: in 1969, 1977, 1983, 1990, 1995, 2001, 2009, 2017, and 2022. It provides a comprehensive record of how travel behavior has evolved with changes in demographics, economics, and culture [34]. This study used the newest dataset (NHTS 2022) for the analysis.
This study examines the utilization of online shopping and home delivery among people with disabilities. Since there is no specific variable that identifies people with disabilities, people who answered “yes” to the question “Condition or disability that makes travel difficult” were considered to have a disability in this study. Other variables related to online shopping and home delivery were investigated in this study, including “Number of online purchase deliveries in the past 30 days,” “Number of times food was delivered in the past 30 days,” “Number of times services were delivered in the past 30 days,” etc. Several other variables related to people with conditions or disability will be investigated in this study, including “Uses manual scooter or wheelchair,” “Uses devices to aid the blind or visually impaired,” etc. A comprehensive analysis of all the sociodemographic variables investigated in this study is presented in Table 2.
Table 2.
Characteristics of adults with and without a travel-limiting condition, 2022 NHTS [34].
In this study, we use the 2022 NHTS delivery-frequency items to examine online shopping and home delivery among adults with a travel-limiting condition. The NHTS itself does not study online shopping, and the research question examined here is ours rather than a survey objective. The 2022 NHTS is a household-based survey: the household file records household characteristics, and the person file records characteristics of the individual members of those households, so person-level estimates are derived from a household sample rather than from an independently drawn sample of persons. The survey uses a complex sample design, and the person weight (WTPERFIN) supplied with the data is applied throughout so that estimates represent the U.S. population. As shown in Table 2, the person file contains 16,997 individuals representing more than 305 million people in U.S. households. Of these, about 18.6 million, or 6.10%, report a condition or disability that makes travel difficult. Because the delivery module is administered only to household members aged 16 and over, and because education, employment, and driver status are not meaningful for children, all regression analyses in this study are restricted to adults aged 18 and over.
Table 3 describes assistive device use and reported travel impacts among adults who report a travel-limiting condition. Because the NHTS administers these items only to that group, no comparison against adults without such a condition is possible, and none is presented. Among adults with a travel-limiting condition, 30.4% (95% CI ±4.0) use a cane or walking stick, 20.9% (±3.6) use a walker or crutches, 9.7% (±2.6) use a manual wheelchair or scooter, 8.6% (±2.1) use a motorized wheelchair or scooter, and 41.4% (±4.7) report using no medical device. Most report the condition has lasted more than six months (70.7%, ±4.9), and 62.5% (±4.4) report reducing travel overall, while 21.7% (±3.3) report having given up driving.
Table 3.
Condition characteristics and assistive-device use among adults with a travel-limiting condition.
3.2. Methodology
The primary analysis is a negative binomial regression in which the count of online purchase deliveries in the past 30 days (DELIVER) is the outcome and travel-limiting condition status is the main predictor. This direction aligns with the objective of the study, which is to characterize the use of delivery among adults with a travel-limiting condition. A supplementary binary logistic model, in which travel-limiting condition status is the outcome, is also reported to show the association expressed as odds of reporting a condition; it is a re-parameterization of the same association and is not an independent test of it. The disability measure is the NHTS variable MEDCOND, “Condition or disability that makes travel difficult.” MEDCOND has five response codes: 01 Yes, 02 No, −7 prefer not to answer, −8 don’t know, and −9 not ascertained. The analysis variable is binary and uses only codes 01 and 02; the three non-substantive codes were treated as missing, and those respondents were excluded rather than being combined with “No,” because a refusal or a don’t-know response is not evidence of the absence of a condition. Among adults aged 18 and over, this excluded 725 respondents (604 refused, 92 don’t know, 29 not ascertained). Delivery predictors are the counts of total online purchase deliveries and, in the secondary models, of food, goods, grocery, and service or personal deliveries in the past 30 days. Logistic regression forms a best-fitting equation or function using the maximum likelihood (ML) method, which maximizes the probability of classifying the observed data into the appropriate category given the regression coefficients. In logistic regression, a logistic transformation of the odds (referred to as logit) serves as the dependent variable (Equation (1)) [35]:
If we take the above dependent variable and add a regression equation for the independent variables, we get a logistic regression (Equation (2)):
As in the least-squares regression, the relationship between the logit(p) and x is assumed to be linear. In Equation (3) [35], p can be calculated where
- p = the probability that a case is in a particular category;
- exp = the exponential function;
- a = the constant (or intercept) of the equation;
- b = the coefficient (or slope) of the predictor variables.
4. Results
Table 4 shows the distribution of delivery-count variables. The sample-construction steps are documented in Table 5. Table 6 shows the comparison of retained and excluded adults, and Table 7 presents sociodemographic information for people with disabilities compared with the general population in the U.S. This table shows that people with disabilities are more likely to live alone or with one other person (one- or two-person household size). Among adults, those reporting a travel-limiting condition are more likely to live in households earning less than $25,000 and to have no vehicle. They are less likely to hold a degree beyond high school, less likely to be employed, more likely to be female, and much less likely to drive. Because Table 2 is now restricted to adults aged 18 and over, the education comparison no longer includes school-age children in the distribution and unambiguously refers to completed adult education. Education categories are computed directly from the EDUC variable, and all category blocks in Table 2 sum to 100%.
Table 4.
Distribution of delivery-count variables, showing right skew, excess zeros, and overdispersion.
Table 5.
Sample-selection flow from the full 2022 NHTS person file to the analytic samples.
Table 6.
Comparison of retained and excluded adults (weighted).
Table 7.
Delivery frequency in the past 30 days among adults with and without a travel-limiting condition.
According to Table 7, adults with a travel-limiting condition receive fewer total deliveries on average than adults without one, but more food deliveries (2.20 versus 1.52), more grocery deliveries (1.36 versus 0.79), and more service or personal deliveries (1.03 versus 0.25). The difference is therefore compositional rather than a uniform difference in volume: fewer general-merchandise deliveries and more deliveries of consumables and personal services.
4.1. Regression Model Results
Because the NHTS uses a complex, weighted sampling design, all descriptive statistics reported in this study (Table 2, Table 3, Table 4, Table 5, Table 6 and Table 7) are weighted using the person-level analysis weight so that results are representative of the U.S. population. The regression model (Table 8) was likewise estimated, with standard errors clustered on household ID to account for the correlation among members of the same household; this is a partial adjustment for the survey’s complex design, since the public-use person file does not include the primary-sampling-unit or replicate-weight variables needed for full Taylor-series or jackknife variance estimation, a limitation discussed in Section 5. For comparison, an unweighted version of the same model was also estimated (Section 4.2); the direction and approximate magnitude of associations were consistent across the weighted and unweighted specifications.
Table 8.
Supplementary logistic regression results, with travel-limiting condition status as the outcome (ages 18 and over, N = 13,698). Specification A enters total online purchase deliveries (DELIVER); Specification B replaces it with the four disaggregated delivery types. For total deliveries, the coefficient is OR = 1.029; fit and discrimination statistics are reported in Supplementary Table S2. These models are reported as a supplement to the primary count models in Table 9, which use the outcome direction aligned with the study objective and a distribution appropriate to overdispersed counts.
The results of the survey-weighted binary logistic regression models are presented in Table 8. The dependent variable is “Condition or disability that makes travel difficult”; respondents who answered “yes” were coded as having a disability, and those who answered “no” were coded as the reference group. Consistent with the theory-driven specification described in Section 3.2, both models retain the full set of sociodemographic confounders identified in the literature review (age, sex, race, education, household income, employment status, driver status, number of household drivers, household size, and vehicle ownership). Because the aggregate “number of online purchase deliveries” variable (DELIVER), this study’s primary variable of interest, is highly collinear with its own component delivery categories (variance inflation factor > 7 when included alongside them; see Section 4.2), it could not be entered in the same model as the disaggregated delivery types without destabilizing the coefficients. We therefore estimated two separate models: Specification A tests DELIVER together with the covariates, directly addressing the paper’s central question of whether overall online delivery use is associated with disability status. Specification B replaces DELIVER with the four disaggregated delivery-type variables (food, goods, groceries, and services/personal deliveries) to test which specific delivery types drive that association.
Table 8 reports the supplementary logistic specifications. Specification A associates total online purchase deliveries with higher odds of reporting a travel-limiting condition, and Specification B associates food and service or personal deliveries with higher odds, while goods deliveries are not significant and groceries are marginal. These models express the same association as the odds ratio and are reported in the supplement; the primary analysis is the count model in Table 9, and Figure 1 plots those estimates. Comparing the two specifications shows that the association with total deliveries is larger for food, grocery, and service or personal deliveries than for goods deliveries. Because these are separate models rather than a decomposition of one model, this comparison does not establish that particular categories drive the total-delivery association. In these supplementary models, not being employed and not being a driver showed the strongest associations with travel-limiting condition status. We note that these same variables are treated as potential mediators in Section 4.1, so their large coefficients should not be read as competing explanations for delivery use.
Table 9.
Primary analysis. Negative binomial models of total online purchase deliveries in the past 30 days among adults aged 18+. Covariates entered sequentially: M1 demographics, M2 adds socioeconomic status, M3 adds mobility and household variables.
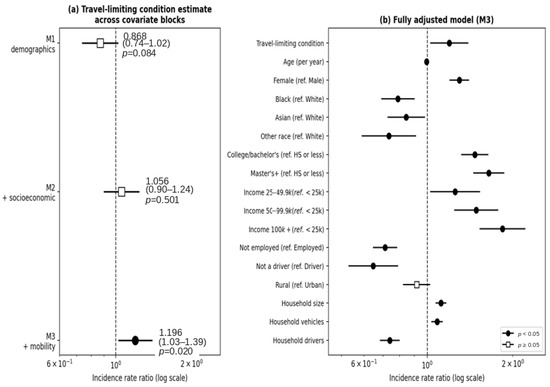
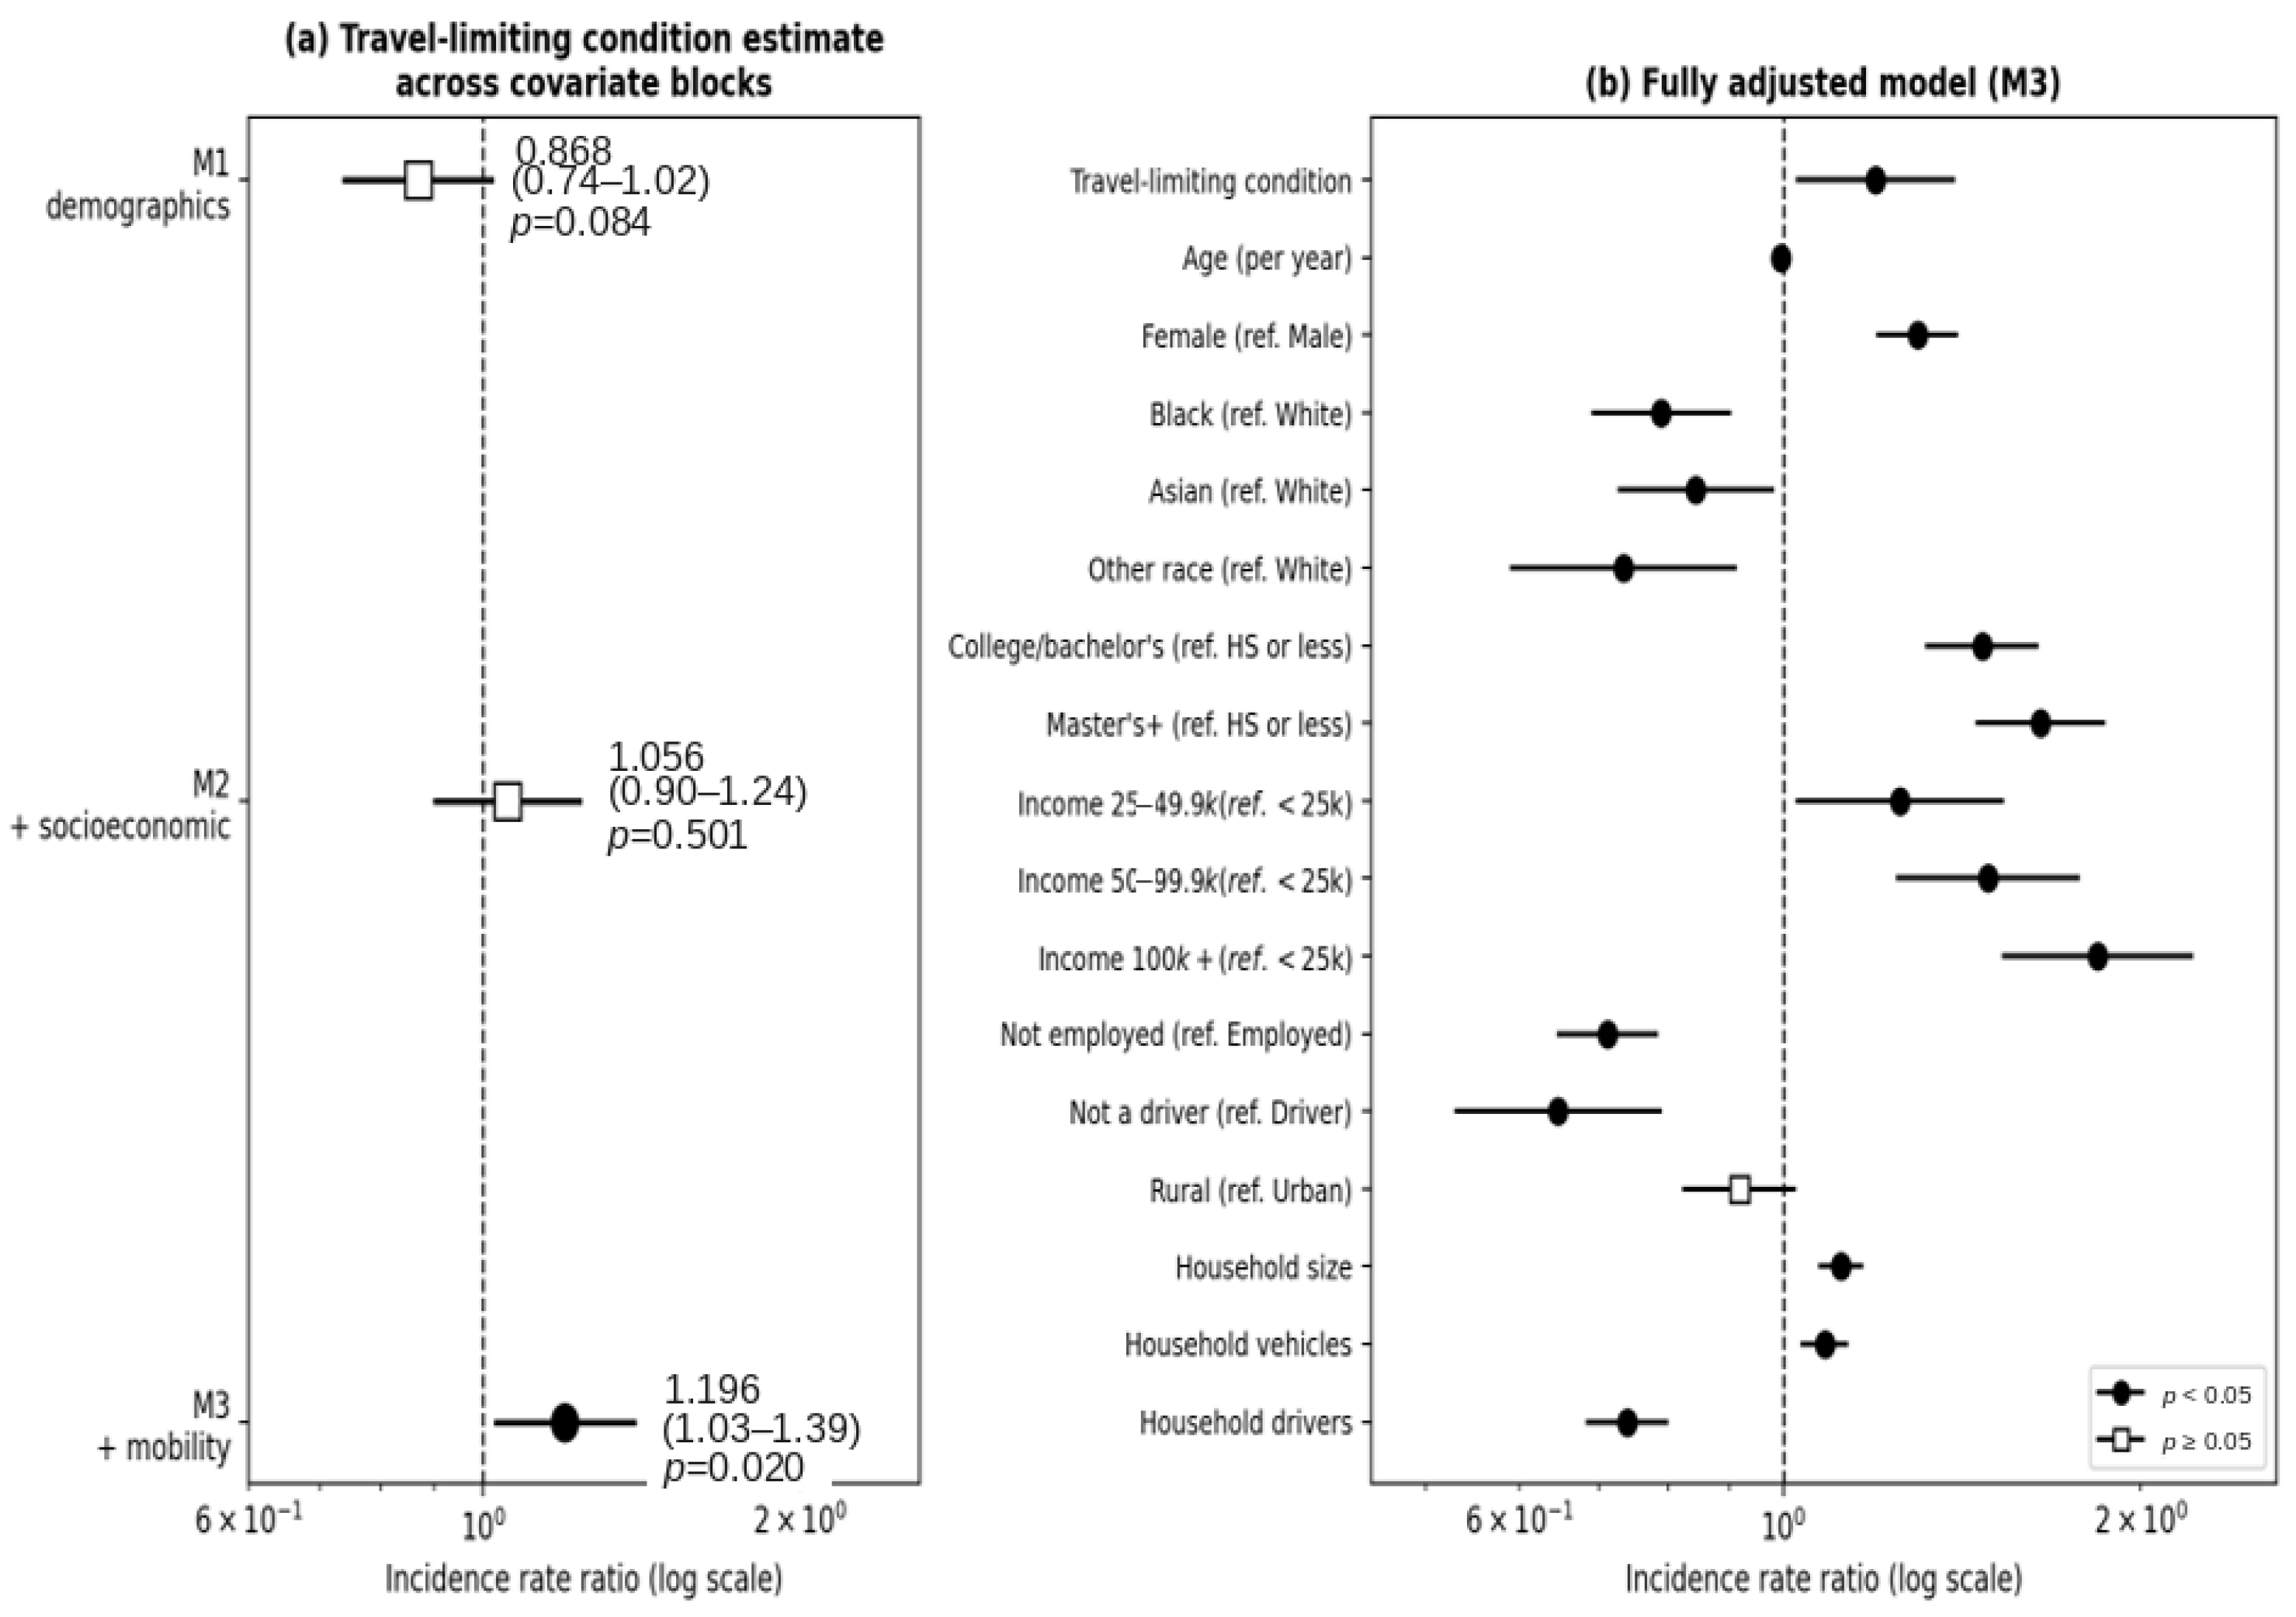
Figure 1.
Estimates from the primary survey-weighted negative binomial models of total online purchase deliveries reported in Table 9. Panel (a) shows the incidence rate ratio for having a travel-limiting condition as covariate blocks are added sequentially (M1 demographics; M2 adding education and income; M3 adding employment, driver status, household size, vehicles and drivers), illustrating that the estimate is null or slightly below 1 until mobility and employment variables are included. Panel (b) shows all M3 estimates. Both panels are plotted on a log scale with a reference line at an incidence rate ratio of 1. Filled circles denote p < 0.05 and hollow squares denote p ≥ 0.05, so significance is conveyed by marker shape as well as position, and the figure remains interpretable in grayscale. Intervals crossing the reference line indicate no statistically significant association.
4.2. Model Diagnostics and Sensitivity Analyses
Three diagnostic checks were performed. First, variance inflation factors (VIFs) confirmed the need for separate specifications for total and disaggregated deliveries: when DELIVER was included alongside its own component delivery-type variables, its VIF exceeded 7 (driven by its 0.88 correlation with the goods-delivery variable). Estimated separately, all VIFs in the primary model were below 4.2, and the full per-predictor VIF table is reported in Supplementary Table S1. VIFs in the secondary model ranged from 1.02 to 4.84, the upper values arising from the ordered household-income categories. In the primary negative binomial model, the maximum VIF is 4.13; per-predictor values are given in Supplementary Table S1. Second, unweighted versions of both models produced coefficients for the delivery variables and confounders with similar signs and, in most cases, similar magnitudes to those of the weighted models, suggesting that the substantive conclusions are not solely an artifact of the weighting approach. Third, a quadratic age term was added to test for nonlinearity in the age–disability relationship; the quadratic term was not statistically significant (p = 0.078), supporting the linear specification of age used in both models.
Because the study objective is to characterize delivery use among adults with a travel-limiting condition, the model in which delivery frequency is the outcome and travel-limiting condition status is the predictor is the specification most directly aligned with that objective. This count model is therefore now reported as the primary analysis (Table 9), and the logistic models in Table 8 are retained only as supplementary association analyses. A Poisson specification was initially considered but rejected: total deliveries are strongly right-skewed and overdispersed, and a Poisson fit produced a deviance-to-degrees-of-freedom ratio of 6.76. We therefore estimated a negative binomial model, which reduced the deviance ratio to 0.33 and substantially lowered the AIC. Standard errors are clustered at the household level.
To express these estimates on an interpretable scale, we computed weighted predictive margins holding covariates at their observed values. In the primary sample, the fully adjusted model implies 5.64 deliveries per 30 days for adults without a travel-limiting condition and 6.75 for adults with one, a difference of 1.11 deliveries per month, or roughly one additional delivery every four to five weeks. Among delivery users, the margins are 7.39 and 10.83, a difference of 3.44 per month. Expressed per five deliveries, the incidence rate ratio of 1.196 corresponds to about one extra delivery for every five received by an otherwise comparable adult. We report these margins because a ratio near 1.2, based on roughly six deliveries a month, represents a modest absolute difference, and the practical significance of the primary result should not be overstated relative to its statistical significance.
The supplementary logistic model in Table 8 and the primary count model in Table 9 are two parameterizations of the same cross-sectional association, not independent tests of it. A significant coefficient in both therefore provides no additional evidence about the direction of the relationship, and agreement between them should not be read as evidence against an artifact of model direction. Neither specification can establish causality with these cross-sectional data; we return to this limitation in Section 5.
Table 9 reports the primary analysis. The association between having a travel-limiting condition and total delivery frequency is not stable across specifications. With demographic covariates only (M1), the estimated incidence rate ratio is 0.868, indicating slightly lower delivery use that is not statistically significant. Adding education and household income (M2) moves the estimate to 1.056, essentially null. Only after employment, driver status, household size, vehicle count, and driver count are added (M3) does the estimate become positive and statistically significant at 1.196.
This pattern requires a cautious reading. The positive association appears only in the fully adjusted specification, and the variables whose inclusion produces it are precisely those that may be consequences of a travel-limiting condition rather than prior common causes of it. Reduced employment, not driving, and having fewer vehicles are plausible mediators on the pathway from a travel-limiting condition to delivery use. Conditioning on a mediator can create or reverse an apparent association, so M3 should not be read as a bias-corrected version of M1. The honest summary is that, among all community-dwelling adults, these data do not show a robust unconditional association between having a travel-limiting condition and receiving more deliveries; rather, any positive association is contingent on adjusting for mobility and employment characteristics that are themselves bound up with the condition.
Table 10 shows a different and considerably stronger pattern within the subsample of adults who receive at least one delivery. Among these delivery users, adults with a travel-limiting condition receive more total deliveries, and this association holds for every delivery type: food, groceries, services or personal deliveries, and, more modestly, goods. In this subsample, the estimate is also stable across M1, M2, and M3, so it does not depend on conditioning on potential mediators. The interpretation supported by these two tables together is therefore conditional rather than general: adults with a travel-limiting condition are not clearly more likely to use delivery at all, but among those who do use it, they use it substantially more, and disproportionately for food, groceries, and personal services rather than for general merchandise. Because the secondary sample is defined by a survey skip pattern rather than by random selection, this contrast may partly reflect selection into the disaggregated items and should be treated as descriptive.
Table 10.
Secondary analysis. Negative binomial models by delivery type, estimated on the conditional subsample of delivery users. All models use the M3 covariate set.
5. Discussion
This study provides new evidence on how frequently adults with a travel-limiting condition use online shopping and home delivery compared with adults without such a condition. The NHTS records how often deliveries are received but not why they are used, so the interpretation that delivery functions as a compensatory response to inaccessible physical and transportation environments is a hypothesis drawn from the prior literature rather than a finding established by these data. Testing it would require measures of platform and store accessibility, unmet need, and trip substitution that the NHTS does not collect. The findings illustrate not only a disproportionate reliance on these digital services among PWDs but also reveal how systemic disadvantages shape this reliance. In interpreting these results, we draw on relevant theoretical frameworks, most notably the social model of disability, which argues that disability arises from environmental barriers rather than individual impairments, and digital divide theory, which highlights inequalities in access to and effective use of digital technologies across social groups. These frameworks help situate the findings within broader academic and policy contexts, revealing how environmental and technological exclusions compound one another in shaping PWDs’ shopping behaviors.
The social model of disability emphasizes that disability is not merely a matter of physical or cognitive limitation but is also produced by structural barriers. In line with this perspective, the greater use of home delivery services by PWDs appears to reflect an adaptive response to enduring environmental constraints, such as inaccessible transportation, limited mobility, and lack of physical retail accommodations, rather than voluntary consumer preference. This highlights that digital alternatives are not luxuries but functional necessities for this population. The analysis qualifies this reading in an important way. Across all community-dwelling adults, the association between having a travel-limiting condition and total delivery frequency is unstable: it is null or slightly negative with demographic covariates alone, null after adding education and income, and positive only when employment, driver status, and household vehicle and driver counts are included. Since those variables may themselves be consequences of a travel-limiting condition, the fully adjusted estimate cannot be read as a corrected version of the unadjusted one, and these data do not demonstrate that adults with a travel-limiting condition receive more deliveries in general. Among adults who receive at least one delivery, however, the pattern is stronger and does not depend on that choice: they receive more deliveries overall and disproportionately more food, grocery, and service or personal deliveries than general goods deliveries. Descriptively, the same asymmetry appears, with fewer total deliveries but more food, grocery, and service deliveries than other adults. What the evidence supports, then, is not that delivery use is uniformly higher, but that its composition differs, weighted toward consumables and personal services rather than general merchandise. This compositional difference is consistent with delivery meeting routine needs, though the survey does not record why deliveries are used and cannot establish it. It does challenge treating online shopping as a single undifferentiated behavior.
Digital divide theory is also essential in contextualizing the study’s findings. Despite the opportunities offered by online platforms, not all PWDs have equal access to them. Barriers such as limited internet connectivity, high costs, inadequate digital literacy, and inaccessible website interfaces can create a second layer of exclusion. In some cases, the very tools designed to enable access may inadvertently reinforce marginalization when they are not designed with inclusive principles. This suggests that digital infrastructure must evolve in parallel with physical infrastructure to ensure full participation. Another important consideration is the potential social consequences of increasing reliance on digital technologies. While online shopping reduces logistical burdens, it may also isolate individuals who already face reduced opportunities for in-person interaction and social inclusion. We must recognize that access is not synonymous with empowerment. A well-rounded approach should preserve the option for in-person engagement rather than replacing it altogether.
Although this study did not explicitly investigate spatial dimensions, the urban–rural breakdown in the data implies potential geographic disparities. Rural areas often lack both comprehensive transportation networks and fast, affordable delivery options, placing PWDs there at a compounded disadvantage. Future research should explore geographic variability more directly to inform targeted interventions. Finally, this study raises important policy and industry questions. For policymakers, the findings highlight the need to integrate digital accessibility into disability policy frameworks. For service providers and retailers, this presents a responsibility and an opportunity to make their platforms more accessible, affordable, and user-friendly for PWDs. Universal design, options such as reduced delivery fees for households with a verified disability, or accessible last-mile logistics, merit evaluation; this study cannot show that they would change delivery use or well-being, since it measures neither the reasons for delivery use nor the cost sensitivity of these households.
Three limitations bound these conclusions. The design is cross-sectional, so neither direction nor cause can be established. The disability measure captures only conditions that make travel difficult and may exclude sensory, cognitive, and other disabilities. And the NHTS records how often deliveries occur but not why, so whether delivery compensates for inaccessible travel options, substitutes for in-person shopping, or supports independence cannot be tested with these data; establishing any of that would require measures of accessibility, unmet need, and trip substitution, ideally combined with qualitative work. We therefore present the delivery patterns documented here as a description of behavior requiring explanation, not as evidence of its cause.
6. Conclusions
This study examined how often adults with a travel-limiting condition or disability receive online purchase deliveries, using the person file of the 2022 NextGen National Household Travel Survey restricted to community-dwelling adults aged 18 and over (N = 13,698, of whom 1166 report such a condition). Because delivery counts are heavily overdispersed, survey-weighted negative binomial models with household-clustered standard errors were used, with delivery frequency as the outcome and covariates entered in blocks.
The principal result is that the association is not robust to specification. Adjusting for demographics alone, adults with a travel-limiting condition do not receive significantly more deliveries; adding education and income leaves the estimate null; a positive association emerges only once employment, driver status, and household vehicle and driver counts are added, and these variables may be consequences rather than causes of a travel-limiting condition. Among the subsample who receive at least one delivery, however, the pattern is stronger and more stable across all three blocks: these adults receive more deliveries overall and disproportionately more food, grocery, and service or personal deliveries than general goods deliveries. Descriptively, adults with a travel-limiting condition report fewer total deliveries than other adults (4.66 versus 5.75 per 30 days) but more food, grocery, and service deliveries, a pattern the models reproduce. The contribution of this study is therefore the disaggregation by delivery type and the demonstration that the aggregate association depends on how mobility and employment variables are treated.
Framing these findings through the lens of the social model of disability underscores that reliance on online shopping stems from systemic exclusions in the physical world. Whether through inaccessible infrastructure, inadequate transportation, or unaffordable service options, PWDs are often compelled to adapt their behavior to work around these limitations. Digital services thus become not an enhancement to existing infrastructure, but a substitute for its absence. This highlights the urgent need to address physical-world barriers alongside digital innovations. The study also contributes to the broader discourse on mobility, emphasizing the right of all individuals to access services, employment, and community life. By showing how digital delivery systems serve as a workaround for mobility constraints, this research emphasizes the essential role of home delivery in supporting independence and participation for PWDs. However, it also cautions against over-reliance on these systems as a replacement for inclusive mobility planning. Public investments in accessible transportation, urban design, and retail environments remain essential to ensure long-term inclusion and accessibility for all individuals.
The findings suggest several policy directions, which we frame as options warranting evaluation rather than as conclusions supported by the present analysis. This study measures how often deliveries occur, not why they are used, whether platforms are accessible, or whether any intervention would change behavior or well-being. First, digital inclusion measures such as internet-access subsidies and accessible design standards for websites and apps are frequently proposed, and our finding that adults with a travel-limiting condition are concentrated in lower-income households is consistent with affordability being a constraint, though we do not test this. Federal standards for digital accessibility already exist: Section 508 of the Rehabilitation Act requires federal electronic and information technology, including public-facing documents and websites, to be accessible, and remediation is required when they are not. The gap is therefore not an absence of standards but their inconsistent application and enforcement, together with the fact that private retail and delivery platforms fall outside the Section 508 mandate altogether. Second, this study did not measure in-person shopping trips, so whether delivery substitutes for them cannot be tested here; such a test would require trip-level or longitudinal data. If substitution does occur, it could raise concerns about social isolation and reduced presence in public space, but this remains a hypothesis. Third, for planners the relevant levers are concrete ones already within their remit: where grocery and pharmacy anchors are sited relative to transit and to residential concentrations of older adults, whether curb and sidewalk conditions permit a wheeled trip to those destinations, and whether curbside pickup and delivery loading are accommodated in site design and parking standards. These decisions shape whether delivery is a genuine addition to the choice set or a substitute for options that have become unusable. Fourth, e-commerce and logistics providers could evaluate adaptive interfaces, curbside drop-off, and pricing or membership structures aimed at households with a travel-limiting condition. Establishing whether any of these help would require data on accessibility, unmet need, and cost sensitivity that the NHTS does not collect.
While this study offers strong quantitative evidence, it is not without limitations. The binary identification of disability in the NHTS, based solely on difficulty with travel, does not capture the full spectrum of disabilities, including sensory and cognitive impairments. Additionally, the survey lacks qualitative data that could provide deeper insight into the lived experiences and emotional dimensions of reliance on online services. Future research should prioritize mixed-methods designs that incorporate interviews, ethnographies, or diary studies to understand how digital engagement intersects with autonomy, dignity, and well-being. Moreover, longitudinal studies could assess how usage patterns evolve as technologies mature and accessibility norms shift. For example, the growth of AI-powered delivery, autonomous vehicles, and drone technologies could dramatically reshape service landscapes. Evaluating their acceptance and effectiveness among PWDs should be a priority. Finally, cross-national comparisons could provide an even richer understanding of how different infrastructure, regulatory, and healthcare systems shape digital access for PWDs globally. Such comparative studies could yield valuable policy lessons and best practices.
In addition, this study’s regression results are associational, not causal: the cross-sectional design cannot determine whether disability status leads to greater reliance on delivery services, whether delivery use itself affects reported travel difficulty, or whether both are jointly shaped by unmeasured factors such as underlying health status or place of residence. The 2022 NHTS uses Taylor-series linearization for variance estimation and does not provide replicate weights; the public-use person file also does not release primary sampling unit or stratum identifiers sufficient for a full design-based variance calculation. The standard errors reported here, therefore, use household-level clustering as a partial adjustment only and may understate the true sampling variance. Confidence intervals and p-values should accordingly be read as approximate, and marginal results in particular should not be treated as firm evidence of an effect. Finally, because “Condition or disability that makes travel difficult” conflates functional limitation with environmental and transportation barriers, we cannot distinguish whether the associations reported here reflect the effect of impairment itself, of the physical/transportation environment, or of both; future work should incorporate the more specific device-use indicators shown in Table 3 (e.g., wheelchair, walker, or low-vision aid use) as alternative or complementary disability measures.
In conclusion, this study affirms that online shopping and home delivery services are more than mere conveniences for people with disabilities; they are essential tools for inclusion. They allow individuals to maintain independence, access vital goods and services, and navigate systemic barriers. Yet these platforms also carry risks if relied upon as a substitute for physical-world reform. True inclusion will only be realized when both digital and physical environments are designed with accessibility at the core. The findings of this study should motivate researchers, policymakers, and industry leaders to work together toward that vision.
Supplementary Materials
The following supporting information can be downloaded at: https://www.mdpi.com/article/10.3390/futuretransp6050188/s1. Table S1: Variance inflation factors for the primary negative binomial model; Table S2: Model fit and discrimination statistics.
Author Contributions
Conceptualization, E.S., R.J., M.S., C.B. and N.S.; methodology, E.S., R.J., M.S., C.B. and N.S.; writing—original draft preparation, E.S., R.J., M.S., C.B. and N.S.; writing—review and editing, E.S., R.J., M.S., C.B. and N.S. All authors have read and agreed to the published version of the manuscript.
Funding
This research received no external funding.
Institutional Review Board Statement
Ethical review and approval were waived because this study is a secondary analysis of the 2022 NextGen National Household Travel Survey public-use file, a de-identified dataset released for public use by the Federal Highway Administration. The analysis involved no interaction with human subjects, no intervention, and no access to identifiable private information.
Informed Consent Statement
Informed consent was waived because the authors of this secondary analysis had no contact with participants and received only de-identified records. Informed consent was obtained from participants by the survey administrator at the time of data collection.
Data Availability Statement
The data utilized in this study were obtained from the 2022 NextGen National Household Travel Survey (NHTS) public-use person file. Analyses used the person file only, and the 2022 NHTS User’s Guide, codebook, and weighting documentation available from the same portal were followed for variable definitions and for application of the person weight (WTPERFIN). The dataset is available at https://nhts.ornl.gov/. All data is publicly accessible and can be downloaded directly from the NHTS website. The variable list, recoding rules, sample-construction steps, and model specifications required to reproduce every estimate reported here are given in Section 3 and Table 5 and Table 6.
Acknowledgments
During the preparation of this manuscript, the authors used Claude (Sonnet 5) (Anthropic) for grammar and language polishing. All content was reviewed and edited by the authors.
Conflicts of Interest
The authors declare no conflicts of interest.
Abbreviations
The following abbreviations are used in this manuscript:
| NHTS | National Household Travel Survey |
| PWD | People with disabilities |
References
- Wang, X.; Renne, J.L. Socioeconomics of urban travel in the U.S.: Evidence from the 2017 NHTS. Transp. Res. Part D Transp. Environ. 2023, 116, 103622. [Google Scholar] [CrossRef] [Scilit]
- Orozco-Fontalvo, M.; Llerena, L.; Cantillo, V. Dockless electric scooters: A review of a growing micromobility mode. Int. J. Sustain. Transp. 2022, 17, 406–422. [Google Scholar] [CrossRef] [Scilit]
- Romano Alho, A.; Sakai, T.; Oh, S.; Cheng, C.; Seshadri, R.; Chong, W.H.; Hara, Y.; Caravias, J.; Cheah, L.; Ben-Akiva, M. A simulation-based evaluation of a Cargo-Hitching service for E-commerce using mobility-on-demand vehicles. Future Transp. 2021, 1, 639–656. [Google Scholar] [CrossRef] [Scilit]
- Bhuiya, M.M.R.; Hasan, M.M.U.; Keellings, D.J.; Mohiuddin, H. Application of machine learning classifiers for mode choice modeling for movement-challenged persons. Future Transp. 2022, 2, 328–346. [Google Scholar] [CrossRef] [Scilit]
- Samadi, N.; Javid, R.; Ziaei Ansaroudi, S.; Dehestanimonfared, N.; Naseri, M.; Jeihani, M. Machine Learning Assessment of Crash Severity in ADS and ADAS-L2 Involved Crashes with NHTSA Data. Safety 2025, 12, 2. [Google Scholar] [CrossRef] [Scilit]
- Zhang, Y.; Kamargianni, M. A review on the factors influencing the adoption of new mobility technologies and services: Autonomous vehicle, drone, micromobility and mobility as a service. Transp. Rev. 2023, 43, 407–429. [Google Scholar] [CrossRef] [Scilit]
- Aguilera-García, Á.; Gomez, J.; Rangel, T.; Baeza, M.d.L.Á.; Vassallo, J.M. Which factors influence the use of shared and privately-owned e-scooters in the city of Madrid? Implications for urban mobility. Cities 2024, 147, 104785. [Google Scholar] [CrossRef] [Scilit]
- Brown, A. Micromobility, Macro Goals: Aligning scooter parking policy with broader city objectives. Transp. Res. Interdiscip. Perspect. 2021, 12, 100508. [Google Scholar] [CrossRef] [Scilit]
- Wang, K.; Qian, X.; Fitch, D.T.; Lee, Y.; Malik, J.; Circella, G. What travel modes do shared e-scooters displace? A review of recent research findings. Transp. Rev. 2023, 43, 5–31. [Google Scholar] [CrossRef] [Scilit]
- Park, K.; Esfahani, H.N.; Novack, V.L.; Sheen, J.; Hadayeghi, H.; Song, Z.; Christensen, K. Impacts of disability on daily travel behaviour: A systematic review. Transp. Rev. 2023, 43, 178–203. [Google Scholar] [CrossRef] [Scilit]
- Meister, A.; Winkler, C.; Schmid, B.; Axhausen, K. In-store or online grocery shopping before and during the COVID-19 pandemic. Travel Behav. Soc. 2023, 30, 291–301. [Google Scholar] [CrossRef] [Scilit]
- Swaine, B.; Labbé, D.; Poldma, T.; Barile, M.; Fichten, C.; Havel, A.; Kehayia, E.; Mazer, B.; McKinley, P.; Rochette, A. Exploring the facilitators and barriers to shopping mall use by persons with disabilities and strategies for improvements: Perspectives from persons with disabilities, rehabilitation professionals and shopkeepers. Alter 2014, 8, 217–229. [Google Scholar] [CrossRef] [Scilit]
- Bashiti, A.; Rahim, A.A. Physical Barriers Faced by People with Disabilities (PwDs) in Shopping Malls. Procedia-Soc. Behav. Sci. 2016, 222, 414–422. [Google Scholar] [CrossRef] [Scilit]
- Childers, T.L.; Kaufman-Scarborough, C. Expanding opportunities for online shoppers with disabilities. J. Bus. Res. 2009, 62, 572–578. [Google Scholar] [CrossRef] [Scilit]
- Charnes, S.E. Household disability status, food store choice, and food insecurity in the United States. Physiol. Behav. 2022, 244, 113663. [Google Scholar] [CrossRef] [Scilit]
- Aitken, Z.; Bishop, G.M.; Disney, G.; Emerson, E.; Kavanagh, A.M. Disability-related inequalities in health and well-being are mediated by barriers to participation faced by people with disability. A causal mediation analysis. Soc. Sci. Med. 2022, 315, 115500. [Google Scholar] [CrossRef] [Scilit]
- Hästbacka, E.; Nygård, M.; Nyqvist, F. Barriers and facilitators to societal participation of people with disabilities: A scoping review of studies concerning European countries. Alter 2016, 10, 201–220. [Google Scholar] [CrossRef] [Scilit]
- Desai, R.H.; Hollingsworth, H.; Stark, S.; Putnam, M.; Eyler, A.; Wehmeier, A.; Morgan, K. Social participation of adults aging with long-term physical disabilities: A cross-sectional study investigating the role of transportation mode and urban vs rural living. Disabil. Health J. 2023, 16, 101503. [Google Scholar] [CrossRef] [Scilit]
- Uddin, M.; Pan, M.; Hwang, H.-L. Factors influencing mode choice of adults with travel-limiting disability. J. Transp. Health 2023, 33, 101714. [Google Scholar] [CrossRef] [Scilit]
- de Magalhães, D.J.A.V. Analysis of critical factors affecting the final decision-making for online grocery shopping. Res. Transp. Econ. 2021, 87, 101088. [Google Scholar] [CrossRef] [Scilit]
- Saphores, J.-D.; Xu, L. E-shopping changes and the state of E-grocery shopping in the US—Evidence from national travel and time use surveys. Res. Transp. Econ. 2021, 87, 100864. [Google Scholar] [CrossRef] [Scilit]
- Hong, C.; Choi, H.; Choi, E.-K.; Joung, H.-W. Factors affecting customer intention to use online food delivery services before and during the COVID-19 pandemic. J. Hosp. Tour. Manag. 2021, 48, 509–518. [Google Scholar] [CrossRef] [Scilit]
- Eriksson, N.; Stenius, M. What do regular online grocery shoppers want from online grocers going forward? Suggestions for service quality improvements. Procedia Comput. Sci. 2023, 219, 201–210. [Google Scholar] [CrossRef] [Scilit]
- Ibukun, O.; Alam, B.M. Factors Affecting Driving Decisions and Vehicle Miles Traveled by Americans with Travel-Limiting Disabilities: Evidence from the 2022 National Household Travel Survey (NHTS) Data. Future Transp. 2025, 5, 113. [Google Scholar] [CrossRef] [Scilit]
- Soltani, S.H.K.; Sham, M.; Awang, M.; Yaman, R. Accessibility for Disabled in Public Transportation Terminal. Procedia-Soc. Behav. Sci. 2012, 35, 89–96. [Google Scholar] [CrossRef] [Scilit]
- Remillard, E.T.; Campbell, M.L.; Koon, L.M.; Rogers, W.A. Transportation challenges for persons aging with mobility disability: Qualitative insights and policy implications. Disabil. Health J. 2022, 15, 101209. [Google Scholar] [CrossRef] [Scilit]
- Maisel, J.; Ranahan, M.; Choi, J. Factors Influencing Fixed-Route Transit Decision-Making: Exploring Differences by Disability and Community Type. J. Public Transp. 2021, 23, 1–15. [Google Scholar] [CrossRef] [Scilit]
- Cochran, A.L. Impacts of COVID-19 on access to transportation for people with disabilities. Transp. Res. Interdiscip. Perspect. 2020, 8, 100263. [Google Scholar] [CrossRef] [Scilit]
- Henly, M.; Brucker, D.L. Transportation patterns demonstrate inequalities in community participation for working-age Americans with disabilities. Transp. Res. Part A Policy Pract. 2019, 130, 93–106. [Google Scholar] [CrossRef] [Scilit]
- Levine, K. “The bus is accessible, but how do you get to the bus”: First and last mile experiences of disabled transit riders. J. Public Transp. 2024, 26, 100086. [Google Scholar] [CrossRef] [Scilit]
- Ralph, K.; Morris, E.A.; Kwon, J. Disability, access to out-of-home activities, and subjective well-being. Transp. Res. Part A Policy Pract. 2022, 163, 209–227. [Google Scholar] [CrossRef] [Scilit]
- Pfeiffer, B.; Sell, A.; Bevans, K.B. Initial evaluation of a public transportation training program for individuals with intellectual and developmental disabilities: Short report. J. Transp. Health 2020, 16, 100813. [Google Scholar] [CrossRef] [Scilit]
- Eisenberg, Y.; Hofstra, A.; Tilahun, N.; Shanley, J. Rideshare use among people with disabilities: Patterns and predictors based on a large nationally representative survey. Travel Behav. Soc. 2022, 29, 246–256. [Google Scholar] [CrossRef] [Scilit]
- Federal Highway Administration. National Household Travel Survey 2017. Available online: https://nhts.ornl.gov/ (accessed on 31 January 2022).
- Hosmer, D.W., Jr.; Lemeshow, S.; Sturdivant, R.X. Applied Logistic Regression, 3rd ed.; John Wiley & Sons: Hoboken, NJ, USA, 2013; Volume 398. [Google Scholar]

Disclaimer/Publisher’s Note: The statements, opinions and data contained in all publications are solely those of the individual author(s) and contributor(s) and not of MDPI and/or the editor(s). MDPI and/or the editor(s) disclaim responsibility for any injury to people or property resulting from any ideas, methods, instructions or products referred to in the content. |
© 2026 by the authors. Licensee MDPI, Basel, Switzerland. This article is an open access article distributed under the terms and conditions of the Creative Commons Attribution (CC BY) license.