


Abstract
Grocery shopping remains a heavily car-dependent activity in urban areas, even for short-distance trips within residential neighbourhoods. A primary barrier to shifting toward active travel (walking or cycling) is the physical burden of carrying heavy or bulky goods. This study investigates whether a retailer-managed home delivery service could encourage consumers who currently rely on motorised modes for grocery shopping to shift towards active travel while preserving the in-store shopping experience. The analysis focuses on urban Italian consumers who currently use motorised modes for grocery shopping. Using a Stated Preference (SP) experiment and a Mixed Logit (MMNL) model (n = 88), we analyse the conditions under which such a service may encourage the adoption of active travel modes and support proximity-based shopping patterns. Given the exploratory nature of the study and the small, non-representative sample, the findings should be interpreted as preliminary evidence for urban motorised grocery shoppers rather than as representative of the Italian population. The results indicate a substantial willingness among respondents to adopt the proposed service configuration. Delivery time, service cost, and the availability of delivery time-window selection emerge as critical factors influencing consumers’ choices. Acceptance of the service is also influenced by perceptions of walking and cycling infrastructure quality, trust in the integrity of delivered groceries, preferences for local products, and concerns regarding the working conditions of delivery personnel. Additionally, the model reveals significant heterogeneity in preferences regarding delivery by drone/autonomous vehicle and a 100% reduction in greenhouse gas emissions relative to conventional motorised transport. Younger respondents exhibit a more favourable attitude towards automated delivery technologies, while differences in the valuation of environmental benefits emerge between male and female respondents. The findings suggest that retailer-managed home delivery may represent a promising mechanism for encouraging active travel among current motorised grocery shoppers, while maintaining consumers’ relationship with neighbourhood retail services. These results provide retailers and urban policymakers with valuable insights, suggesting that appropriately designed delivery services may support more sustainable and proximity-oriented shopping behaviours. Such services could potentially contribute to maintaining the accessibility and vitality of neighbourhood retail activities, particularly in ageing urban contexts.
1. Introduction
Grocery shopping is a frequent and essential activity in everyday life, with significant implications for urban mobility and environmental sustainability [1,2]. Despite the growing diffusion of online grocery (e-grocery) with home delivery (HD), the dominant model remains in-store (IS) shopping, in which consumers travel to physical retail outlets, most commonly by car, to purchase products directly [3]. Private car usage persists even over short distances, driven by the physical burden of carrying grocery bags and the perceived time savings associated with motorised transport [4,5,6]. Moreover, the transition toward e-grocery with HD has not unambiguously improved this picture. While it can reduce the number of individual car trips [7], its environmental performance critically depends on vehicle type, delivery density and service speed [8]. For instance, instant delivery systems have been shown to be particularly unsustainable [9,10], while collection-based models such as click-and-pick (CP), in which consumers retrieve their order at a designated location, may reduce vehicle kilometres travelled when collection points are conveniently integrated into consumers’ existing travel patterns, although additional travel may occur when dedicated trips are required [8]. Therefore, these contrasting findings suggest that the environmental performance of different grocery-shopping models is highly context-dependent, pointing to the need for alternative service configurations that combine the advantages of both.
This issue is particularly relevant from a transportation perspective because grocery shopping represents one of the most frequent urban trips. Previous studies have shown that many grocery-shopping journeys are relatively short and potentially compatible with active modes such as walking and cycling, yet a substantial share of consumers continue to rely on private cars. The need to transport purchased goods is often identified as one of the main barriers preventing a modal shift towards more sustainable travel modes [4]. This challenge is particularly evident in medium- and large-sized urban areas, where grocery stores are often located within distances compatible with walking or cycling, but private car use remains widespread.
This issue is particularly relevant in the Italian context. According to the 2025 Audimob Report by ISFORT, 73% of all trips are made within urban areas, a share that has increased from 68% in 2023 and 72% in 2024. Moreover, 81% of trips are shorter than 10 km, and almost one third are shorter than 2 km, indicating substantial potential for greater use of active travel modes. Despite the predominance of relatively short journeys, private cars remain the dominant mode of transport, accounting for 61% of trips in the first half of 2025. These figures highlight the persistence of car dependency even in contexts where active travel could represent a feasible alternative. At the same time, Italy is experiencing a progressive decline in neighbourhood retail activities. Over the last decade, a substantial number of local shops have disappeared, contributing to the phenomenon often referred to as “commercial desertification”. Beyond its economic implications, this process affects the social vitality of neighbourhoods, reduces accessibility to essential services, and may disproportionately affect older residents in a country characterised by rapid population ageing. Maintaining the attractiveness and accessibility of local retail services therefore represents an increasingly important policy objective.
This study investigates a retailer-managed home delivery service designed to support active travel for grocery shopping, in which consumers reach the store on foot, by bicycle, or by other active modes and purchase groceries physically at the retail outlet, retaining the ability to inspect products directly and preserving the in-store shopping experience. The transportation of goods to consumers’ homes is instead managed through an organised delivery system operated by the retailer. Unlike conventional e-grocery services, the proposed configuration preserves direct interaction between consumers and retailers while eliminating the need to transport purchased goods from the store to the home. By maintaining consumers’ physical presence in local stores, it may also contribute to supporting the economic viability of neighbourhood retail activities while reducing the need for short, motorised shopping trips. By separating the shopping activity from the transport of purchased goods, this configuration may encourage greater use of active modes for grocery-related travel and strengthen proximity-based shopping patterns. Its potential relevance therefore lies not only in mobility and sustainability considerations, but also in its ability to support local retail accessibility and the broader objectives of proximity-oriented urban planning strategies such as the 15-min city [11,12,13,14].
Despite the potential of such a service configuration, empirical evidence on whether it can encourage a shift from motorised grocery-shopping trips to active travel modes remains scarce. More broadly, the application of stated preference (SP) experiments to grocery shopping behaviour remains comparatively limited [15,16]. Within this literature, existing studies have predominantly focused on the choice between online and physical shopping models [16,17,18,19]. Much less attention has been devoted to understanding whether removing the burden of transporting groceries could induce current car users to replace short, motorised shopping trips with active travel modes. Consequently, important questions remain unanswered. Would current car users be willing to walk or cycle to neighbourhood grocery stores if purchases were subsequently delivered to their homes? Which service attributes would most strongly influence such a behavioural change? And under what delivery conditions would consumers be prepared to substitute short, motorised shopping trips with active travel modes?
This paper therefore investigates whether consumers who currently rely on motorised modes for grocery shopping would be willing to switch to active travel modes when the burden of transporting groceries is removed through retailer-managed home delivery. Using a stated preference experiment and a Mixed Logit model to account for preference heterogeneity, the study identifies the service characteristics that may encourage such a behavioural shift. The contribution of the paper does not rest on the novelty of the service itself. Rather, it lies in examining the conditions under which current motorised grocery shoppers may be willing to adopt active travel modes when retailer-managed home delivery is available, while preserving the in-store shopping experience and supporting the accessibility and vitality of neighbourhood retail services in an ageing society.
The paper is organised as follows. Section 2 presents the literature review. Section 3 describes the methodology and data collection procedures. Section 4 reports the model specification. Section 5 presents the empirical results and discussion. Section 6 concludes with policy implications, limitations, and directions for future research.
2. Literature Review
Discrete choice methodology has been widely used to analyse consumer preferences in retail and shopping contexts [15]. However, its application to grocery shopping behaviour, particularly in SP experiments in which respondents choose among hypothetical alternatives, remains relatively limited [15,16]. The literature reviewed for this study can be grouped into three main themes that are particularly relevant to the present research: consumers’ preferences for different shopping channels, the service attributes influencing those preferences, and the socio-economic and attitudinal factors shaping channel choice.
2.1. Grocery Shopping Channel Preferences
The shopping channels most commonly considered are HD, where goods are delivered to the consumer’s home following an online order, e.g., [15,18,20]; IS shopping, where consumers travel to a physical retail outlet to select and purchase products, e.g., [17,19,21]; and CP, where orders are placed online and collected at a designated location, e.g., [15,22,23]. In addition, ref. [18] considered curbside pickup, whereby consumers collect their order directly from a designated parking area at the store.
The reviewed studies reveal substantial variation in channel preferences across geographical contexts. In European and Latin American studies, consumers tended to exhibit a preference for IS shopping over online alternatives, with everything else being equal. Ref. [19] found that IS shopping was preferred over HD, which in turn was preferred over CP. Similarly, [21], comparing IS and HD in Brazil, reported a preference for physical store shopping. In contrast, the study by [22], conducted in Shanghai, China, suggested a stronger inclination toward HD over IS and CP. Middle Eastern and North African contexts appeared more neutral, with everything else being equal. Ref. [20] found no statistically significant preference between IS and HD, though HD was preferred over CP. Ref. [17] reported no strong preference for either IS or HD when comparing the two in Qatar.
These findings highlight that channel preferences are highly context-dependent, reinforcing the need for country-specific analyses.
It should be noted that some studies were conducted during or shortly after the COVID-19 pandemic, notably [23], which may have temporarily distorted the preference for HD due to mobility restrictions and health concerns, potentially limiting the generalisability of their findings to normal market conditions. As a result, the strong preference for home delivery observed in such studies may partly reflect short-term behavioural adaptations rather than stable long-term consumer preferences.
2.2. Determinants of Channel Choice
Two main types of attributes emerged as predominant in the SP studies examined. Monetary and time-related attributes were found to be the primary determinants of channel choice, indicating that consumers are sensitive to economic and temporal considerations.
Among the time-related attributes, three distinct dimensions were identified. Lead time refers to the time elapsed between placing an order and receiving delivery. Ref. [19] found that longer lead times reduced the probability of choosing HD, a result confirmed across studies conducted in different geographical contexts, including China [22], Morocco [20], Qatar [17], and Brazil [21]. Travel time refers to the time required to physically reach the retail outlet or collection point. Higher values were found to reduce the attractiveness of IS shopping, as consumers become less willing to travel to a physical outlet as time increases [15,18,20]. Finally, delivery time-window concerns the time slot within which delivery is expected to occur. Wider time windows reduced the probability of choosing HD, suggesting that consumers value certainty and precision in delivery scheduling [15,19,23]. Overall, the evidence indicates that time-related attributes consistently influence grocery-shopping choices across different geographical contexts, although their relative importance may vary according to local urban structure, accessibility conditions, and the characteristics of the shopping alternatives under consideration. Direct comparisons across studies remain difficult because of differences in experimental designs, model specifications, and attribute definitions. Nevertheless, the literature consistently highlights consumers’ sensitivity to both travel-related and delivery-related time costs.
Beyond monetary and time-related factors, product-related attributes also proved relevant. These include product range, referring to the breadth of items available for purchase, and order fill rate, namely the percentage of ordered products available in stock at the time of purchase. Both attributes positively affected the attractiveness of online channels across multiple studies [15,19,22], with ref. [21] specifically highlighting the role of order fill rate in increasing the probability of choosing HD. Finally, ref. [23] found that higher minimum order requirements reduced the probability of choosing HD, suggesting that consumers are sensitive to purchasing constraints.
A related stream of literature has investigated consumers’ preferences for the environmental sustainability of agri-food supply chains, with particular attention to food miles and food-related carbon footprints. Food miles generally refer to the distance travelled by food products between the place of production and the point of consumption, while food-related carbon footprints capture the greenhouse gas emissions generated along the food supply chain, including production, processing, transportation, storage, and distribution stages. Recent contributions by [24], as well as the literature reviews by [25,26], highlight that transportation and logistics can contribute significantly to the environmental burden of food systems, although their relative importance varies across products, production systems, transport modes, and supply-chain configurations. In particular, both travel distance and the organisation of logistics activities may substantially influence transport-related emissions, implying that environmental outcomes depend not only on how far food travels but also on how transport operations are organised and consolidated. Similarly, ref. [27] shows that logistics organization and transportation arrangements may substantially affect the environmental performance of food-related activities.
Within this research area, numerous studies have examined consumers’ willingness to pay for food products and delivery services characterised by lower environmental impacts. Refs. [28,29,30,31,32,33,34,35,36] provide evidence that consumers may value information regarding food miles, transport-related emissions, local sourcing, carbon labels, and environmentally sustainable delivery options. However, the estimated willingness to pay and the relative importance assigned to these attributes vary considerably across countries, products, and consumer segments. Overall, these studies suggest that environmental considerations can influence purchasing decisions when consumers are provided with information about the sustainability performance of food products and supply chains.
Despite their relevance, the focus of these studies differs substantially from that of the present research. The food miles and carbon-footprint literature primarily examines the environmental sustainability of food production, distribution, and logistics systems, often with particular attention to short supply chains, local food systems, and the transportation of goods from producers to retailers or final consumers. By contrast, the present study does not investigate how grocery products are produced, where they originate from, or how they are transported along the supply chain. These aspects are assumed to remain unchanged. Instead, the analysis focuses exclusively on consumers’ travel behaviour when accessing grocery stores and examines whether removing the burden of transporting groceries may encourage a shift from motorised travel to walking or cycling for neighbourhood grocery shopping. Nevertheless, this broader literature provides an important motivation for considering environmental performance within grocery-shopping decisions and supports the inclusion of greenhouse gas emission reduction as one of the service attributes examined in the present study.
2.3. Socio-Economic and Attitudinal Determinants
Socio-economic characteristics remain underrepresented in the econometric models estimated in the reviewed SP experiments. Ref. [18] found that consumers with lower education, low-to-middle household income, and greater access to private vehicles, measured by household vehicle ownership and full vehicle availability, tended to prefer IS shopping, as did female respondents [15]. Regarding age, ref. [21] found that younger consumers were less willing to use e-grocery.
Alongside these socio-economic factors, attitudinal variables also proved relevant. Perceived security risk associated with online services, preference for local store shopping, and shorter distances to grocery stores were found to increase the likelihood of choosing IS shopping [18,37].
Although the reviewed literature has substantially improved our understanding of consumers’ preferences for existing grocery-shopping channels, most studies have focused on the choice among these channels and on the service attributes influencing their attractiveness. However, little attention has been devoted to investigating whether delivery services can be designed to encourage a shift away from private car use while preserving the in-store shopping experience. To the best of our knowledge, very few stated preference studies have examined whether consumers who currently rely on motorised modes for grocery shopping would be willing to switch to active travel modes if the burden of transporting groceries was removed through retailer-managed home delivery.
This question is particularly relevant in urban contexts such as Italy, where short car-based shopping trips remain common and neighbourhood retail activities are increasingly under pressure. The present study seeks to contribute to this gap by investigating the conditions under which a retailer-managed delivery service may encourage the adoption of active travel modes while maintaining consumers’ relationship with local stores.
3. Materials and Methods
3.1. Contextualization
Italy provides an interesting context for investigating the potential of retailer-managed home delivery services because grocery shopping remains predominantly store-based, while e-grocery penetration is still relatively limited. At the same time, neighbourhood retail activities are facing increasing competitive pressure, raising concerns about the long-term accessibility and vitality of local commercial services.
Grocery shopping represents a significant component of Italian household expenditure. In 2024, average monthly household consumption expenditure stood at about €2755, of which food and non-alcoholic products accounted for 19.3% at the national level, with considerable regional variation.
Italy has a well-established grocery retail sector, comprising approximately 25,100 stores across different formats, including convenience stores (42%), supermarkets (34%), discounters (23%), and hypermarkets (1%) [37]. In 2024, supermarkets remained the dominant channel, recording a 2.5% increase in turnover relative to 2023, while discounters continued to expand their market presence, maintaining a 22% market share. Hypermarkets, by contrast, experienced a decline in market share [37].
The prevalence of physical stores is particularly relevant for the present study, as the proposed service configuration preserves the in-store shopping experience while potentially reducing the need for consumers to transport groceries by private car.
Regarding e-grocery in Italy, this grocery channel remains comparatively underdeveloped. Food and beverage accounts for only 6% of Italy’s digital retail market, although the share of online grocery shoppers reached 27.1% in 2024, representing a 9% increase relative to the previous year. This suggests that while digital adoption is accelerating, the vast majority of grocery shopping in Italy continues to take place in physical stores.
3.2. Questionnaire Design
A focus group involving a small number of domain-relevant participants was con-ducted to support the questionnaire design, guide the selection of attributes and choice tasks for the stated preference experiment, and refine the attitudinal statements included in the survey. A pre-test was subsequently conducted with approximately ten respondents to verify that the questions, the branching logic, and the SP experiment were clear and functioned correctly on the web-based survey platform.
The questionnaire was administered in Italian via Google Forms in June 2025. No major events likely to affect grocery shopping behaviour, home-delivery services, or travel patterns occurred in Italy during the survey period. The questionnaire comprised five sections. The first section collected information on respondents’ place of residence, asking them to indicate the Italian region and provincial capital in which they lived. Respondents who did not reside in a provincial capital were excluded from the study at this stage. This criterion was adopted to focus the analysis on medium- and large-sized urban contexts, where grocery stores are more likely to be located within distances compatible with active travel modes and where reducing short, motorised shopping trips is a particularly relevant transportation policy objective. Accordingly, the results should be interpreted as applying primarily to urban residents rather than to the Italian population as a whole.
The second section focused on grocery shopping behaviour, including the main mode of transport used for this purpose.
The third section comprised the SP experiment, administered only to respondents who declared using motorised modes for grocery shopping. Before entering the SP experiment, these respondents were asked whether they would consider walking or cycling to the grocery store if a retailer-managed home delivery service was available. Respondents answering “Yes” or “Maybe” were invited to complete the SP choice tasks, whereas those answering “No” were not administered the SP experiment. The experiment aimed to examine the propensity of this subgroup to switch from motorised transport to active transport modes, contingent on the availability of a hybrid service. The choice experiment consisted of nine hypothetical choice tasks, each presenting two alternatives, Alternative A and Alternative B. To enhance realism and avoid forced responses, an opt-out option (“Neither of the two”) was also included, representing the respondent’s choice to forgo both alternatives and continue with their existing grocery shopping behaviour. Each task was introduced with the following statement: “If you could choose between the two home delivery alternatives presented below, which would you select?” The experimental design was developed using Ngene software 1.4 [38], and a graphical representation was adopted for the choice tasks, as illustrated in Figure 1.
Figure 1.
Example of a hypothetical choice task. Source: Authors’ elaboration.
The fourth section asked respondents to express their level of agreement with a set of statements related to environmental sustainability, trust and perceived risk associated with home delivery services, and social and ethical concerns related to delivery workers’ conditions. All statements were evaluated on a 5-point Likert scale (1 = strongly disagree; 5 = strongly agree).
Finally, the fifth section collected socio-economic information on the respondents, including age, gender, employment status, household characteristics, and vehicle ownership.
3.3. Stated Choice Experiment Design
The two hypothetical alternatives were characterized by five attributes with corresponding levels (see Table 1). The selection of attributes sought to balance comparability with previous SP studies and the need to reflect the operational and behavioural characteristics of the retailer-managed home delivery service investigated in this study.
Table 1.
Attributes and levels used in the choice experiment.
Delivery fee levels of €0, €5, and €10 were selected, broadly consistent with existing SP studies on grocery delivery, e.g., [15,18,20].
Delivery time ranged from 3 h to 3 days, reflecting the operational characteristics of a service potentially relying on active or low-emission transport modes. This range is broadly consistent with previous SP studies, which have considered minimum delivery times as short as 1 h [19] and maximum delivery times of one day [18]. It should be noted that delivery time was intended to capture the overall service performance experienced by consumers rather than the pure travel time of the delivery vehicle. In practice, delivery times may depend not only on vehicle characteristics but also on order preparation, scheduling decisions, delivery consolidation strategies, and broader organizational arrangements.
The delivery transport mode attribute captured the type of vehicle used by the retailer for last-mile delivery, including electric car or e-scooter, electric bicycle, drone or autonomous vehicle. While the first two levels reflect currently operational delivery modes, drone and autonomous vehicle delivery remain largely experimental in the Italian context. Their inclusion was intended to assess consumers’ attitudes towards innovative delivery technologies that, although still largely experimental in the Italian context, are frequently discussed as potential solutions for last-mile logistics and urban freight transport. The objective was not to evaluate their technical feasibility or operational performance, but rather to understand whether consumers react positively or negatively to the use of such technologies in grocery delivery services.
An attribute capturing the environmental impact of the delivery service was included, with levels of 0%, 50%, and 100% greenhouse gas emission reduction relative to conventional motorised transport. These levels were selected as simple and easily interpretable indicators of progressively greater environmental benefits, allowing respondents to evaluate different degrees of environmental improvement associated with the proposed service. This choice reflects the limited attention devoted to environmental attributes in previous SP studies of grocery delivery [15] and allows an assessment of whether environmental considerations influence consumers’ choices. The attribute was intended to capture the overall environmental performance of the delivery service rather than the emissions directly associated with a specific delivery technology. Consequently, the levels should not be interpreted as engineering estimates associated with specific delivery modes or operational configurations. Environmental outcomes may depend not only on the type of vehicle employed but also on factors such as delivery consolidation, route planning, delivery density, and broader logistical arrangements. For this reason, the environmental impact attribute was treated independently from the delivery mode attribute, allowing the separate identification of consumers’ sensitivity to environmental benefits and their attitudes towards different delivery technologies.
Finally, the possibility of booking a delivery time window was also included to capture service flexibility and convenience preferences, in line with previous studies [15,19,22].
Table 2 provides a simplified illustrative comparison of potential greenhouse gas emissions associated with alternative grocery-shopping and delivery configurations. The comparison is not intended as a life-cycle assessment, but rather as a transparent framework for interpreting the environmental attribute included in the stated preference experiment. The calculations are based on the average distance to the grocery store observed in the sample (1.9 km one way). For private car shopping trips, a round-trip distance of 3.8 km is assumed. Retailer-managed deliveries are assumed to be organised through consolidated delivery tours serving multiple customers along the same route (i.e., a milk-run configuration). Under such conditions, the distance attributable to each order would normally be substantially lower than that associated with a dedicated shopping trip. However, to adopt a conservative approach and avoid overstating the environmental benefits of delivery consolidation, each delivery is allocated 1.9 km, corresponding to the average one-way shopping distance observed in the sample. Consequently, the estimated emissions associated with retailer-managed delivery should be interpreted as conservative estimates, as actual emissions per delivery may be lower when delivery density is high and route consolidation is efficient.
Table 2.
Simplified comparison of potential greenhouse gas emissions across grocery-shopping and delivery configurations.
The emission factors adopted for electric delivery modes are based on the current Italian electricity generation mix published by the Italian Energy Services Manager (Gestore dei Servizi Energetici, GSE, Rome, Italy). According to the most recent GSE fuel-mix data, electricity supplied to the Italian grid is generated from approximately 51.8% renewable sources, 42.0% natural gas, and a small residual share of coal and other sources.
Using the average CO2 emission factor for passenger vehicles in Italy reported by the National Environmental Information System for 2022 (231.92 g CO2/km), a private car shopping trip would generate approximately 881 g CO2. A conventional light commercial vehicle, with an average emission factor of 322.56 g CO2/km, would generate approximately 613 g CO2 per delivery if 1.9 km was allocated to each order. By contrast, electric delivery options would generate substantially lower operational emissions under the current Italian electricity mix. Assuming an average value of 37 g CO2/km for electric vehicles and 2.2 g CO2/km for electric bicycles, emissions would amount to approximately 70 g CO2 and 4 g CO2 per delivery, respectively. Drone and autonomous delivery emissions are more uncertain, as they depend strongly on payload, energy consumption, routing, and operational conditions.
3.4. The Sample
Respondents were recruited through Prolific, an online platform that connects researchers with participants willing to be compensated for taking part in surveys. A total of 328 responses were collected. The sample selection process is summarized in Figure 2. As discussed in Section 3.2, this criterion was adopted to focus the analysis on urban contexts, where the proposed service is expected to be most relevant. Among these 200 respondents, 102 were excluded because they already reported travelling to grocery stores by walking, cycling, or public transport. The remaining 98 respondents, who relied on private motorised modes for grocery shopping, were then asked whether they would consider walking or cycling to the store if a retailer-managed home delivery service was available. Only respondents who answered “Yes” or “Maybe” (n = 88) were invited to complete the stated preference experiment. Respondents who answered “No” (n = 10), indicating that they would not consider the proposed service under any circumstances, were not administered the SP experiment. This screening procedure was adopted because these respondents effectively expressed a lexicographic preference against the proposed service. Since random utility models rely on the assumption that individuals are willing to make compensatory trade-offs among the attributes describing the alternatives, administering the stated preference experiment to respondents who categorically rejected the service could have introduced distortions into the estimation process. Consequently, the final estimation sample consisted of 88 urban motorised grocery shoppers (Figure 2).
Figure 2.
Flowchart of respondent screening and selection of the final sample used in the stated preference experiment. Source: Authors’ elaboration.
The adequacy of the final sample size involved in the SP experiment was assessed using [39] rule-of-thumb for stated preference experiments. Given 9 choice tasks, 2 experimentally designed alternatives, and a maximum of 3 levels per attribute, the recommended minimum sample size was approximately 84 respondents, which is slightly lower than the final estimation sample of 88 respondents. However, it should be noted that the Johnson and Orme criterion [39] provides a minimum recommendation primarily for main-effects experimental designs. The estimation of mixed logit models with random parameters generally benefits from larger samples to ensure more stable estimates of preference heterogeneity. Accordingly, the final sample should be regarded as sufficient for the exploratory objectives of this study, while the estimated heterogeneity effects should be interpreted with appropriate caution.
Table 3 reports the socio-economic characteristics of the 200 respondents residing in provincial capitals who were retained after the first screening stage. Given the absence of comparable studies on this service, the sample profile is benchmarked against national statistics provided by the Italian National Institute of Statistics (Istat, www.istat.it). The sample is predominantly male (58%), a proportion slightly higher than that observed in the Italian population (49%). The average age of respondents is 34 years, considerably lower than the Italian population average of approximately 47 years, with the largest age group being 23–31 years (51%), followed by respondents aged 32–39 years (about 23%). The sample is highly educated, with about 58% of respondents holding a bachelor’s or master’s degree, compared to a national average of 22%. These differences indicate that the sample is not representative of the Italian population as a whole. In particular, older adults and less educated or less digitally engaged groups are likely to be underrepresented, partly because respondents were recruited through an online platform. Accordingly, the findings should be interpreted as applying primarily to urban motorised grocery shoppers rather than to the Italian population at large. Being employed represents the main occupational category (about 47%). The sample is fairly distributed across Italy, with a slightly higher concentration in the northern part of the country (46%). More than half of the respondents (57%) live in the first-ring suburban area close to the city centre. To assess potential sample-selection effects associated with the screening procedure, the socio-demographic characteristics of respondents included in the SP experiment were also compared with those of the remaining urban respondents. The results are reported in Appendix A (Table A1).
Table 3.
Socio-demographic characteristics of the sample (200 respondents).
3.5. Shopping Habits
The data reveals a strong tendency towards frequent grocery shopping among respondents (Table 4). A substantial majority (83%) shop several times a week, while a further 11% shop daily. In addition, 74% of respondents purchase groceries within their own neighbourhood, highlighting the importance of local accessibility in shaping daily consumer behaviour.
Table 4.
Grocery shopping habits of the sample.
Store proximity also emerges as an important characteristic of respondents’ shopping behaviour. Over half of those surveyed (54%) live within 1 km of their most frequently visited grocery store, and a further 32% live within 3 km. These two distances are generally compatible with active modes of transport, such as walking or cycling.
However, the car remains the dominant mode of transport (48% of respondents), followed by walking (42%). This pattern is consistent with findings by [40] in West Seattle and [41] in Nagpur and aligns with previous studies reporting widespread reliance on private vehicles for grocery shopping trips [42].
Importantly, when asked why they do not use active or public transport (Figure 3), motorised vehicle users most frequently cited the perceived burden of carrying grocery bags (89%), as highlighted by [43].
Figure 3.
Main barriers to walking, cycling, or using public transport for grocery shopping. Source: Authors’ elaboration.
Distance was the second most common reason (reported by 33% of respondents), in line with the findings of [3].
Infrastructure quality also appears to influence travel behaviour. Eighteen percent of respondents cited poor or absent pavements and/or a lack of dedicated cycle lanes. Notably, cycling accounts for only 4% of grocery trips. Taken together, these findings suggest that the persistence of car use for grocery shopping cannot be explained solely by distance. Although most respondents live within distances generally compatible with walking or cycling, many continue to rely on private cars. This pattern indicates that practical considerations, particularly the burden of carrying groceries and the perceived quality of walking and cycling infrastructure, may play an important role in shaping grocery-shopping travel behaviour.
3.6. Attitudes Towards Sustainability and Grocery Shopping
The results suggest relatively high levels of self-reported environmental awareness. More than half of respondents (52%) said they are concerned about the environmental consequences of their daily choices, 77% said they try to reduce their use of single-use plastics, and 50% said they try to use low-impact means of transport whenever possible. While these findings indicate a relatively high degree of environmental commitment, the private car remained the predominant mode used for grocery shopping. As discussed above, practical barriers, such as the difficulty of carrying grocery bags, may help explain this apparent discrepancy.
Responses related to trust in home delivery services indicate generally favourable perceptions of service reliability. A large majority of respondents (86%) expressed confidence that their orders would be delivered in full, while 66% rejected the idea that selected products would be replaced with lower-quality alternatives. However, trust was somewhat lower when it came to hygiene. Only 48% expressed confidence that delivery personnel respect hygiene standards, while 29% remained neutral. It is also worth noting that 62% of respondents said they did not want to avoid direct contact with the delivery person, suggesting a generally positive attitude towards in-person delivery interactions. Overall, the results suggest that concerns regarding service reliability and delivery personnel are present among some respondents, although attitudes towards home delivery services appear generally favourable.
Social and ethical considerations were also found to be relevant, particularly with respect to the working conditions of delivery workers. The majority (62%) said that they consider delivery workers’ working conditions when choosing a delivery service, and 44% reported that these conditions influence their purchasing decisions to some extent. In addition, 78% of respondents agreed that it is not always clear how delivery workers are treated. Consistent with this finding, 77% said they would feel more comfortable using home delivery services if they were assured that workers operated under fair conditions (Table 5).
Table 5.
Responses to attitudinal statements.
4. Modelling Framework
The theoretical framework of the discrete choice experiment is grounded in Random Utility Theory (RUT) [44]. In each choice task, respondents were presented with a constant choice set consisting of three alternatives: two retailer-managed delivery service alternatives (A and B) and an opt-out option representing the continuation of current grocery-shopping habits. According to RUT, individuals are assumed to choose the option that provides the highest utility. The utility associated with each alternative depends on a set of observed attributes and on unobserved factors known to the decision maker but not to the analyst.
Accordingly, in each choice situation, individual n evaluates all available alternatives and selects alternative i if its utility exceeds that of all other alternatives in the choice set (Unit > Unjt, j i). Under this assumption, the observed choice is interpreted as the alternative that maximises the respondent’s utility in that specific choice situation.
To account for the heterogeneity of respondents’ preferences, this study employs a Mixed Logit (MMNL) model. Unlike the standard Multinomial Logit (MNL) model, the MMNL accounts for unobserved preference heterogeneity by allowing selected utility coefficients to vary across individuals according to a specified probability distribution.
The utility function of individual n for alternative j in task t is specified as follows:
where
Unjt = ASCj + β′nXnjt + γZn + εnjt
- ASCj is the alternative-specific constant for alternative j, capturing the average effect of all unobserved factors relative to the base alternative;
- Xnjt is the vector of observed attributes for alternative j presented to individual n in choice task t;
- β′n is the vector of random coefficients that vary across individuals with a density function g(β|Ω), where Ω represents the parameters of the distribution;
- Zn is a vector of individual-specific characteristics, including socio-economic and attitudinal variables. In the empirical specification, these variables enter the utility of the opt-out alternative and capture systematic differences in respondents’ propensity to reject the proposed retailer-managed delivery service;
- γ is the vector of fixed coefficients associated with the individual-specific characteristics;
- εnjt is the random error term, assumed to be independently and identically distributed (i.i.d.) following a Type I Extreme Value distribution.
Because βn is not fixed but varies across the population, the choice probability cannot be expressed in a closed-form solution, as in the case of the MNL model. Furthermore, given the panel nature of the data, where each respondent completes a sequence of T choice tasks, the model must account for the sequence of chosen alternatives in = {in1, in2, …, inT}. Therefore, the unconditional probability that individual n makes this specific sequence of choices is given by the integral of the product of standard Logit probabilities over the density of β [45]:
The MMNL model was estimated in Apollo using Maximum Simulated Likelihood (MSL) with 5000 Halton draws [46]. Estimation converged after 33 iterations according to Apollo’s relative function convergence criterion, and the final solution corresponded to a maximum with a negative definite Hessian matrix. The use of Halton sequences follows common practice in the mixed logit literature and helps reduce simulation error while maintaining computational tractability (e.g., [47,48]).
Model Specification
Several MNL and MMNL specifications were estimated following a stepwise modelling procedure. Alternative specifications were progressively tested and compared based on parameter significance, coefficient signs, behavioural plausibility, overall model stability, and goodness-of-fit indicators. A comparison of the principal model specifications is reported in Appendix A (Table A2). Table 6 reports the variables included in the final MMNL specification together with their coding scheme.
Table 6.
Variables used in the model.
The final specification comprises two utility formulations: one for the retailer-managed delivery alternatives (A and B), which share the same utility specification, and one for the opt-out alternative. For the retailer-managed delivery service alternatives, utility is specified as a function of the attributes included in the stated preference experiment, namely delivery transport mode, delivery fee, maximum delivery time, delivery time-window selection, and greenhouse gas emission reduction (Equation (3)). Since alternatives A and B are unlabelled and represent different configurations of the same service, they share the same utility specification and are distinguished only by the levels of their attributes.
The utility of the opt-out alternative includes an alternative-specific constant together with a set of socio-economic and attitudinal variables (Equation (4)). These variables were included to capture respondents’ propensity to reject the proposed retailer-managed delivery service and continue using their current grocery-shopping habits. Because alternatives A and B are unlabelled and represent different configurations of the same retailer-managed delivery service, the socio-economic and attitudinal variables were included only in the opt-out utility function. This specification implicitly assumes that these variables affect respondents’ propensity to reject the retailer-managed delivery service as a whole, rather than their preference for one delivery-service configuration over another. Equivalently, the effects of these variables are assumed to be identical across the two delivery alternatives. A broader set of socio-demographic and behavioural characteristics was initially tested for inclusion in the opt-out utility function. These included gender, age, employment status, education level, household size, and the number of motorised vehicles owned by the household. In addition, variables describing respondents’ shopping behaviour and residential context were examined, including the distance to the grocery store most frequently visited, the location of residence within the urban area (city centre or suburbs), and grocery-shopping frequency. None of these variables proved statistically significant and were therefore excluded from the final specification. This includes variables such as distance to the grocery store and household vehicle ownership, whose effects were explicitly tested but did not contribute significantly to model performance. The final model retains only those variables that contributed significantly to explaining the propensity to reject the proposed retailer-managed delivery service. In particular, the specification accounts for geographical location, perceived barriers to walking and cycling, environmentally related attitudes, concerns about potential damage during delivery, and sensitivity to the working conditions of delivery workers.
Several distributional assumptions for the random parameters were tested during model development, including Normal and triangular specifications. The final model adopts triangular distributions because they provide economically interpretable coefficient signs while maintaining a level of statistical fit comparable to alternative specifications. The coefficients associated with delivery fee, maximum delivery time, delivery time-window selection, and the socio-demographic and attitudinal variables are treated as fixed parameters. The coefficients associated with drone/autonomous vehicle delivery and greenhouse gas emission reduction are specified as random parameters following triangular distributions. The GHG coefficient is constrained to be positive, whereas no sign constraint is imposed on the drone/autonomous vehicle coefficient to capture potentially heterogeneous attitudes towards innovative delivery technologies. In addition, several interaction terms between the choice attributes and respondents’ socio-demographic characteristics were tested in order to investigate whether observable individual characteristics could explain part of the heterogeneity in preferences. Among the interaction effects tested, only two proved statistically significant and were therefore retained in the final model: an interaction between the drone/autonomous vehicle attribute and a dummy variable identifying younger respondents, and an interaction between the greenhouse gas emission reduction attribute and respondents’ gender. These terms allow part of the observed heterogeneity in preferences for innovative delivery technologies and environmental benefits to be linked to observable characteristics of the respondents.
The corresponding utility functions are specified as follows.
5. Results and Discussion
5.1. Model Results and Scenario Analysis
Table 7 reports the parameter estimates and goodness-of-fit measures of the final MMNL specification. The model was estimated on a final sample of 88 respondents, corresponding to 792 observations. Overall, the model provides a satisfactory fit to the data, with the log-likelihood improving from −870 to −572 and an adjusted rho-squared of 0.33 relative to the equal-shares model. All estimated parameters exhibit signs consistent with behavioural expectations and are statistically significant at conventional confidence levels.
Table 7.
Estimated MMNL model coefficients and model diagnostics.
Among the service attributes, delivery fee has a negative and highly significant effect on utility (βfee = −0.24), confirming that higher prices reduce the likelihood of adopting the service. This finding is consistent with rational economic behaviour, as well as with the results of previous stated preference studies [18,19,23]. Similarly, a maximum delivery time of three days, instead of one day or three hours, significantly decreases utility (βtime = −1.42), indicating that respondents place considerable value on timely delivery. Alternative codings of the delivery-time attribute were also tested during model development, but the adopted specification provided the most behaviourally plausible and statistically robust representation of respondents’ preferences. Similar results were obtained by [18,22,23]. In contrast, the possibility of selecting a preferred delivery time-window exerts a positive and statistically significant effect (βbooking = 0.97), highlighting the importance of flexibility and convenience in shaping consumers’ preferences. This result was also found by [49] with reference to Finnish households. Taken together, these results suggest that the attractiveness of the proposed service depends not only on its cost, but also on its ability to provide reliable and convenient delivery arrangements.
The results also reveal substantial heterogeneity in attitudes towards innovative delivery technologies. The coefficient associated with drone or autonomous vehicle delivery was specified as a random parameter following a triangular distribution with both lower and upper bounds estimated from the data (−1.80 and +1.55, respectively). Both distribution bounds are statistically significant, indicating the coexistence of positive and negative attitudes towards these technologies within the sample. While some respondents perceive automated delivery modes favourably, others appear more reluctant to adopt them. Based on the estimated triangular distribution bounds, approximately 57% of respondents are estimated to exhibit a negative preference for drone or autonomous vehicle delivery, while approximately 43% exhibit a positive preference. This finding suggests that attitudes towards innovative delivery technologies remain heterogeneous across respondents. Part of this heterogeneity is explained by age. The interaction between the drone/autonomous vehicle attribute and the dummy variable identifying younger respondents is positive and statistically significant (βdrone×young = 0.66), indicating that younger individuals are more receptive to innovative delivery technologies than older respondents. Taking this interaction effect into account, the implied distribution shifts upwards for younger respondents, suggesting that approximately 77% of them exhibit a positive preference for drone or autonomous vehicle delivery. This result is consistent with previous studies showing that younger consumers are generally more willing to adopt technological innovations and novel mobility solutions.
Environmental performance also influences consumers’ choices. The coefficient associated with a 100% reduction in greenhouse gas emissions relative to conventional motorised transport was specified as a random parameter following a positively constrained triangular distribution. The positive and statistically significant upper bound indicates that a 100% reduction in greenhouse gas emissions relative to conventional motorised transport increases the attractiveness of the service for a substantial share of respondents, although the magnitude of this effect varies across individuals. At the same time, the significant interaction between greenhouse gas reduction and gender (βGHG_female = −0.44) indicates that the positive effect of the highest level of greenhouse gas emission reduction is weaker among female respondents. Although the reasons underlying this difference cannot be directly inferred from the available data, the result suggests that environmental benefits are not valued uniformly across demographic groups.
More generally, the inclusion of the interaction terms demonstrates that part of the heterogeneity associated with innovative delivery technologies and environmental performance can be linked to observable respondent characteristics. No other interaction effects between the service attributes and respondents’ socio-demographic characteristics proved statistically significant.
The large negative alternative-specific constant associated with the opt-out alternative indicates a strong baseline preference for the retailer-managed delivery service relative to maintaining current grocery-shopping habits. This result should be interpreted in light of the sample selection procedure adopted in the study. The stated preference experiment was administered only to urban motorised grocery shoppers who expressed at least a minimum willingness to consider the proposed service. In particular, respondents who stated that they would never consider the proposed service were not administered the stated preference experiment, which further contributes to explaining the magnitude of the estimated constant. Furthermore, as with all stated preference experiments, the possibility of hypothetical bias cannot be entirely excluded. However, several socio-demographic and attitudinal factors significantly influence the probability of rejecting the proposed service. The positive coefficient associated with the macro-area of residence indicates that the propensity to reject the retailer-managed delivery service increases when moving from Northern to Central and Southern Italy. This finding suggests the existence of geographical differences in the acceptance of such services, although the underlying reasons cannot be directly inferred from the available data.
Similarly, respondents who perceive inadequate walking and cycling infrastructure as a barrier to active travel exhibit a higher propensity to choose the opt-out alternative. This result highlights the importance of the broader urban mobility environment in supporting behavioural change and suggests that retailer-managed delivery services may be more effective when accompanied by investments in active mobility infrastructure.
The attitudinal variables also provide important insights. Individuals expressing a stronger preference for purchasing local products are more likely to reject the proposed service. One possible explanation is that these respondents may already rely more heavily on neighbourhood retail outlets and therefore perceive less additional benefit from the proposed delivery option. Concerns that delivery personnel may damage or mishandle groceries also increase the probability of choosing the opt-out alternative, confirming that trust remains an important determinant of service adoption. Finally, respondents who place greater importance on the working conditions of delivery workers exhibit a higher propensity to choose the opt-out alternative. One possible interpretation is that these individuals are more sensitive to the social and ethical implications of delivery services and may therefore be less willing to adopt such services when the treatment of delivery workers is perceived as uncertain. These findings suggest that social sustainability considerations, alongside environmental and service-quality attributes, play a relevant role in shaping consumer acceptance of retailer-managed delivery services.
To provide a preliminary indication of the potential magnitude of the transport effect, an exploratory scenario simulation was conducted using the estimated model parameters and the individual socio-economic and attitudinal characteristics of the 88 respondents who completed the SP experiment. For the random coefficients, the mean of the estimated distribution was used. The results should be interpreted as illustrative rather than as forecasts of actual behavioural change.
In a low-attractiveness scenario, where the service costs €10, delivery takes more than one day, no delivery time-window booking is available, and delivery is performed by drone or autonomous vehicle, the average probability of choosing the service is 23%. Under these conditions, the expected adoption of the service would be limited, suggesting that little or no meaningful reduction in car-based grocery-shopping travel would be expected.
In a high-attractiveness scenario, where the service costs €5, delivery is completed within one day, delivery time-window booking is available, and delivery is performed by electric bicycle or electric van, the average probability of choosing the service increases to 77%. In this scenario, 86 out of 88 respondents exhibit an estimated probability of choosing the service above 50%. Assuming that respondents with a predicted probability above 50% would adopt the service, and combining this information with the reported distance to the grocery store and grocery-shopping frequency, the service could potentially replace approximately 956 car-kilometres per month within the analysed sample.
This estimate is purely exploratory and should not be interpreted as an observed or forecasted reduction in vehicle-kilometres travelled. Rather, it provides an order-of-magnitude indication of the potential transport relevance of the proposed service under favourable design conditions.
To further clarify the transportation relevance of the estimated service attributes, Table 8 summarises their influence on consumers’ willingness to use the proposed retailer-managed delivery service and discusses their potential implications for mode shift, vehicle-kilometres travelled, emissions, and urban accessibility. It is important to note that the effects on willingness to use the service are directly estimated by the econometric model, whereas the transportation implications should be interpreted as plausible behavioural and policy implications derived from the modelling results rather than as impacts directly measured in this study.
Table 8.
Transportation implications of the service attributes included in the stated preference experiment.
The results reported in Table 8 indicate that the attributes exerting the strongest influence on service adoption, namely delivery time, delivery time-window selection, and delivery fee, are also those most likely to affect the potential transport benefits associated with the service. In particular, the scenario analysis suggests that a well-designed retailer-managed delivery service could potentially contribute to reducing short, motorised grocery-shopping trips by making active travel more attractive. At the same time, the heterogeneous attitudes observed towards drone and autonomous delivery technologies suggest that technological innovation alone is unlikely to guarantee widespread adoption unless accompanied by service characteristics that consumers perceive as convenient, reliable, and affordable.
5.2. Willingness to Pay
To facilitate the economic interpretation of the results, an additional model specification was estimated directly in willingness to pay (WTP) space. Unlike the conventional approach, where WTP is derived as the ratio between attribute and cost coefficients estimated in utility space, this specification estimates WTP measures directly as model parameters. Following the WTP-space formulation proposed in the discrete choice literature [46], the utility functions were reparametrized by factoring out the cost coefficient, so that the remaining coefficients could be interpreted directly in monetary terms. The resulting WTP estimates are reported in Table 9.
Table 9.
Willingness-to-pay estimates from the WTP-space model.
The results indicate that respondents are willing to pay €5.82 to reduce the maximum delivery time from three days to one day or three hours. This result indicates that respondents place a substantial value on shorter delivery times and is consistent with the negative effect of longer waiting times observed in the utility-space specification.
The availability of delivery time-window selection is also positively valued. Respondents are willing to pay approximately €3.98 for the possibility of choosing their preferred delivery slot, suggesting that scheduling flexibility is positively valued by respondents and contributes to the attractiveness of the proposed service.
The estimated willingness to pay for environmental benefits is positive but varies by gender. Male respondents are willing to pay €2.47 for a 100% reduction in greenhouse gas emissions relative to conventional motorised transport, whereas the corresponding value for female respondents is lower (€0.68). This result is consistent with the interaction effect identified in the utility-space model and suggests that the valuation of environmental benefits may vary across demographic groups. However, given the exploratory nature of the study and the relatively small sample size, these differences should be interpreted with caution.
6. Conclusions
This study investigated the stated preferences of urban Italian motorised grocery shoppers towards a retailer-managed delivery service designed to support active travel for grocery shopping. Under this configuration, consumers continue to visit the store and personally select their groceries, while the retailer manages the home delivery of purchased goods.
The results suggest a strong baseline preference for the proposed service relative to maintaining current grocery-shopping habits. Among the service attributes, delivery fee, delivery time, and delivery time-window selection emerged as significant determinants of choice. In particular, respondents showed a clear preference for shorter delivery times and for the possibility of selecting a preferred delivery slot, highlighting the importance of convenience and reliability in the design of retailer-managed delivery services.
The analysis also revealed substantial heterogeneity in preferences towards innovative delivery technologies and environmental performance. Attitudes towards delivery by drone or autonomous vehicle were found to vary considerably across respondents, with both positive and negative preferences emerging within the sample. Part of this heterogeneity was explained by age, as younger respondents exhibited a more favourable attitude towards innovative delivery technologies. Similarly, preferences for greenhouse gas emission reduction varied across individuals, and the valuation of environmental benefits was found to differ by gender.
The WTP estimates provide additional insights into the economic value assigned to specific service characteristics. Respondents were willing to pay approximately €5.82 to reduce the maximum delivery time from three days to one day and €3.98 for the possibility of selecting a preferred delivery time-window. Positive willingness to pay was also observed for a 100% reduction in greenhouse gas emissions relative to conventional motorised transport, although the estimated values differed between male and female respondents.
Several socio-demographic and attitudinal factors also influenced the probability of rejecting the proposed service. In particular, the propensity to choose the opt-out alternative increased when moving from Northern to Central and Southern Italy. Respondents who perceived inadequate walking and cycling infrastructure as a barrier to active travel were also more likely to reject the service. Furthermore, concerns about potential damage to groceries during delivery increased the likelihood of opting out, while respondents who attached greater importance to fair working conditions for delivery workers were less inclined to accept the proposed service.
From a transportation and policy perspective, these findings suggest that retailer-managed delivery services may represent a useful complement to strategies aimed at reducing short, motorised shopping trips in urban areas. However, the results also indicate that such services should not be viewed as a substitute for investments in active mobility infrastructure. The positive effect of perceived infrastructure quality on service acceptance suggests that retailer-managed delivery services and active mobility policies may operate as complementary rather than alternative instruments for promoting more sustainable urban travel behaviour. More specifically, the results suggest that improving the quality of sidewalks and cycling infrastructure may increase the effectiveness of retailer-managed delivery services by making access to local stores safer and more attractive. Even when grocery stores are located within distances compatible with walking or cycling, consumers may remain reluctant to use active modes if they perceive the route as unsafe or uncomfortable. Consequently, local authorities seeking to reduce short car-based shopping trips should consider integrating investments in pedestrian and cycling infrastructure with policies aimed at supporting innovative retailer-managed delivery services.
The findings also highlight the potential role of retailer-managed delivery services in supporting neighbourhood retail activities. The descriptive analysis revealed that many respondents live relatively close to the grocery stores they regularly visit yet continue to rely on private cars. This suggests that the burden of transporting groceries may represent a more important barrier to active travel than distance itself. By removing this burden, retailer-managed delivery services may potentially help consumers continue shopping at local stores while reducing their reliance on motorised transport.
For retailers, the results provide practical guidance regarding service design. The estimated WTP values indicate that consumers place considerable value on delivery reliability and scheduling flexibility. Investments aimed at reducing delivery times and providing delivery-slot booking options may therefore be more effective in encouraging service adoption than strategies based solely on price competition. In particular, the results suggest that delivery services do not need to be instantaneous in order to be attractive. Consumers clearly value a reduction in delivery times from three days to one day, whereas the difference between delivery within one day and delivery within three hours appears considerably less important. Retailers may therefore obtain greater benefits from ensuring reliable next-day delivery than from investing in costly ultra-fast delivery systems.
These findings are especially relevant for neighborhood retailers and small local shops. Historically, home delivery services were relatively common among local retailers in Italy but have progressively disappeared, while being increasingly offered by large supermarket chains. The results suggest that reintroducing retailer-managed delivery services may represent an effective strategy for strengthening customer loyalty and improving the competitiveness of neighborhood retail activities. This may also generate indirect transport benefits. Unlike large retail outlets, which are often located in peripheral areas, neighborhood stores are typically situated within distances compatible with walking and cycling. Preserving a dense network of local retail services therefore helps maintain opportunities for active travel and may contribute to limiting growth in the average distance travelled for grocery shopping.
Finally, local authorities and retailers’ associations could explore mechanisms to facilitate access to low-emission delivery solutions for small retailers. While large retail chains often possess the financial resources required to operate dedicated delivery fleets, small neighbourhood retailers may face substantial barriers to investing in delivery services and low-emission vehicles. Shared logistics schemes, cooperative delivery systems, or targeted support programs for electric delivery vehicles could help overcome these constraints while preserving the accessibility and competitiveness of local retail activities. For example, municipalities and retailers’ associations could promote shared delivery platforms or cooperative fleets of low-emission vehicles, allowing small retailers to offer home delivery services without bearing the full investment and operating costs individually.
Some limitations should be acknowledged. The online recruitment through Prolific may have skewed the sample toward younger, more highly educated, and more digitally engaged respondents, potentially underrepresenting older consumers and other population groups. Moreover, the analytical sample was restricted to residents of provincial capitals who reported using motorised modes for grocery shopping. Consequently, the results should be interpreted as applying primarily to this specific segment of urban consumers rather than to the Italian population as a whole. In addition, the relatively limited sample size constrained the estimation of more complex specifications, such as hybrid choice models (i.e., integrated choice and latent variable models), which combine discrete choice modelling with structural equation modelling to explicitly account for psychological constructs through latent variables. Furthermore, the experimental design did not explicitly incorporate store proximity, travel distance, or travel time as attributes. This choice was made to isolate the effect of retailer-managed home delivery on consumers’ willingness to replace motorised grocery-shopping trips with active travel modes. However, store accessibility is likely to influence the attractiveness of such services and may interact with delivery-related preferences. Moreover, the survey was not designed to quantify the environmental impacts associated with potential changes in grocery-shopping travel behaviour. Estimating reductions in vehicle kilometres travelled, greenhouse gas emissions, congestion, or other transport-related externalities would require substantially more detailed information on respondents’ travel patterns and vehicle characteristics, including vehicle type, propulsion technology, vehicle age and efficiency, trip timing, and route characteristics. Consequently, the present study focuses on consumers’ preferences and potential service adoption rather than on the quantitative estimation of environmental impacts. Given the exploratory nature of this study and its non-representative composition, the results should be considered preliminary evidence rather than definitive conclusions, and replication in larger and more diverse samples is needed before broader generalisations can be drawn.
These limitations point directly to future research directions. Firstly, revealed preference studies in contexts where hybrid services are already operational would allow a more rigorous test of the behavioural patterns. Secondly, disaggregated analyses at the city level, particularly in urban contexts aligned with 15-min city principles, could inform how local infrastructure moderates service adoption. Future research could also investigate the role of additional transportation-related factors, such as parking availability and trip chaining behaviour, in shaping consumers’ willingness to adopt retailer-managed delivery services. These variables were not collected in the present survey in order to limit respondent burden and questionnaire length. Thirdly, future stated preference experiments could jointly investigate store choice, travel mode choice, and delivery-service characteristics, providing a more comprehensive understanding of the role of store accessibility in shaping consumers’ adoption decisions. Fourthly, a supply-side investigation of retailer and logistics operator feasibility would also complement the demand-side evidence provided by this study. Finally, future studies based on larger samples could investigate the sources of preference heterogeneity associated with innovative delivery technologies and environmental benefits in greater depth, potentially through the estimation of Integrated Choice and Latent Variable models.
Author Contributions
Conceptualization, L.R.; methodology, L.R.; software, C.R., J.O.; formal analysis, L.R., C.R., J.O.; data curation, C.R., J.O.; writing—original draft preparation, C.R., J.O.; writing—review and editing, L.R., C.R., J.O., G.L.; supervision, L.R.; funding acquisition, L.R. All authors have read and agreed to the published version of the manuscript.
Funding
Part of this research was conducted during and with the support of the Italian interuniversity PhD course in Sustainable Development and Climate Change (www.phd-sdc.it).
Institutional Review Board Statement
Ethical review and approval were waived for this study because we informed respondents with the following warning: “The data collected through this questionnaire will be used exclusively for scientific and research purposes. Privacy will be strictly respected, and the data will be processed in accordance with EU Regulation No. 2016/679, which defines the protection of persons and other subjects with regard to the processing of personal data, and the University of Trieste’s Policy on Research Integrity and Ethics”.
Informed Consent Statement
Informed consent was obtained from all subjects involved in the study.
Data Availability Statement
The data presented in this study are available on request from the corresponding author due to privacy or ethical restrictions.
Acknowledgments
The authors gratefully acknowledge the use of DeepL Write (https://www.deepl.com/it/write accessed on 13 May 2026) during the preparation of the manuscript to support minor language editing. No generative AI tools were used for study design, data collection, data analysis, or interpretation of results. The authors reviewed and edited all AI-assisted outputs and take full responsibility for the content of this publication.
Conflicts of Interest
The authors declare no conflicts of interest.
Appendix A
Table A1.
Comparison of socio-demographic characteristics between respondents included in the SP experiment and other urban respondents.
Table A2.
Comparison of alternative model specifications estimated during the model development process.
References
- Kısacık Burcu, A.; Koramaz Kerem, T. Urban food shopping trends: An analysis of Istanbul’s grocery preferences via multi group structural equation model. Cities 2025, 167, 106367. [Google Scholar] [CrossRef] [Scilit]
- Suel, E.; Polak, J.W. Development of joint models for channel, store, and travel mode choice: Grocery shopping in London. Transp. Res. Part A Policy Pract. 2017, 99, 147–162. [Google Scholar] [CrossRef] [Scilit]
- Hagberg, J.; Holmberg, U. Travel modes in grocery shopping. Int. J. Retail Distrib. Manag. 2017, 45, 991–1010. [Google Scholar] [CrossRef] [Scilit]
- Omwamba, J.; Puntel, S.; Rotaris, L.; Longo, G. Evaluating last-mile access in the 15-minute city. Discov. Cities 2025, 2, 90. [Google Scholar] [CrossRef] [Scilit]
- Rokseth, L.S.; Heinen, E.; Aukrust Hauglin, E.; Nordstrom, T.; Manum, B. Reducing private car demand, fact or finction? A study mapping changes in accessibility to grocery stores in Norway. Eur. Transp. Res. Rev. 2021, 13, 39. [Google Scholar] [CrossRef] [Scilit] [PubMed]
- Yu, C.Y. Influence of residential self-selection and built environment on walking behavior to grocery stores. J. Transp. Health 2025, 44, 102163. [Google Scholar] [CrossRef] [Scilit]
- Caspersen, E.; Navrud, S.; Bengtsson, J. Act locally? Are female online shoppers willing to pay to reduce the carbon footprint of last mile deliveries? Int. J. Sustain. Transp. 2021, 16, 1144–1158. [Google Scholar] [CrossRef] [Scilit]
- Motte-Baumvol, B.; Chevallier, L.B.; Bonin, O. Does e-grocery shopping reduce CO2 emissions for working couples’ travel in England? Int. J. Sustain. Transp. 2022, 17, 515–526. [Google Scholar] [CrossRef] [Scilit]
- Shi, K.; Shao, R.; De Vos, J.; Witlox, F. Do e-shopping attitudes mediate the effect of the built environment on online shopping frequency of e-shoppers? Int. J. Sustain. Transp. 2021, 17, 41–51. [Google Scholar] [CrossRef] [Scilit]
- van Loon, P.; Deketele, L.; Dewaele, J.; Mckinnon, A.; Rutherford, C. A comparative analysis of carbon emissions from online retailing of fast moving consumer goods. J. Clean. Prod. 2015, 106, 478–486. [Google Scholar] [CrossRef] [Scilit]
- Allam, Z.; Bibi, S.E.; Chabaud, D.; Moreno, C. The “15-Minute City” concept can shape a net-zero urban future. Humanit. Soc. Sci. Commun. 2022, 9, 15. [Google Scholar] [CrossRef] [Scilit]
- Omwamba, J.; Rotaris, L.; Longo, G. An Assessment of Proximity in the 15-Minute City: A Systematic Literature Review. Urban Transit. 2025, 3, 100012. [Google Scholar] [CrossRef] [Scilit]
- Oostenbach, L.H.; Burnet, A.J.; Lamb, K.E.; Thornton, L.E. Exploring food shopping behaviours in 20-minute neighbourhoods: A cross-sectional analysis of ProjectPLAN. Cities Health 2024, 8, 588–600. [Google Scholar] [CrossRef] [Scilit]
- Moreno, C.; Allam, Z.; Chabaud, D.; Gall, C.; Pratlong, F. Introducing the “15-Minute City”: Sustainability, Resilience and Place Identity in Future Post-Pandemic Cities. Smart Cities 2021, 4, 93–111. [Google Scholar] [CrossRef] [Scilit]
- Marcucci, E.; Gatta, V.; Le Pira, M.; Chao, T.; Li, S. Bricks or clicks? Consumer channel choice and its transport and environmental implications for the grocery market in Norway. Cities 2021, 110, 103046. [Google Scholar] [CrossRef] [Scilit]
- Meister, A.; Winkler, C.; Schmid, B.; Axhausen, K. In-store or online grocery shopping before and during the COVID-19 pandemic. Travel Behav. Soc. 2023, 30, 291–301. [Google Scholar] [CrossRef] [Scilit] [PubMed]
- Alkhiyami, H.; Padmanabhan, R.; Hadid, M.; Kerbache, L. Drivers of change to e-grocery: An investigation of consumers’ channel choice. Electron. Commer. Res. 2025, 1–33. [Google Scholar] [CrossRef] [Scilit]
- Titiloye, I.; Sarker Al Adib, M.; Watts, J.X. Investigating e-grocery shopping behaviour and its travel effect. Int. J. Transp. Sci. Technol. 2024, 13, 91–105. [Google Scholar] [CrossRef] [Scilit]
- Maltese, I.; Le Pira, M.; Marcucci, E.; Gatta, V.; Evangelinos, C. Grocery or @grocery: A stated preference investigation in Rome and Milan. Res. Transp. Econ. 2021, 87, 101096. [Google Scholar] [CrossRef] [Scilit]
- Aziz, S.; Maltese, I.; Marcucci, E.; Gatta, V.; Benmoussa, R.; Irhirane, E.H. Energy Consumption and Environmental Impact of E-Grocery: A Systematic Literature Review. Energy 2022, 15, 7289. [Google Scholar] [CrossRef] [Scilit]
- de Magalhães, D.J.A.V. Analysis of critical factors affecting the final decision-making for online grocery shopping. Res. Transp. Econ. 2021, 87, 101088. [Google Scholar] [CrossRef] [Scilit]
- Gatta, V.; Marcucci, E.; Maltese, I.; Iannaccone, G.; Fan, J. E-Groceries: A Channel Choice Analysis in Shanghai. Sustainable 2021, 13, 3625. [Google Scholar] [CrossRef] [Scilit]
- Grashuis, J.; Skevas, T.; Segovia, M.S. Grocery shopping preferences during the Covid-19 pandemic. Sustainability 2020, 12, 5369. [Google Scholar] [CrossRef] [Scilit]
- Lee, E.H.; Stoeltje, G. How far does your food travel on the highway? Food miles and carbon footprint. J. Clean. Prod. 2025, 518, 145915. [Google Scholar] [CrossRef] [Scilit]
- Biancolin, M.; Codato, F.; Nassivera, F.; Rotaris, L. Sostenibilità ambientale della filiera agro-alimentare e Food Miles: Una rassegna della letteratura. Riv. Econ. Polit. Trasp. 2023, 1. Available online: https://arts.units.it/retrieve/ce6e49c4-201f-430c-9d52-ce71ada7e5fd/REPoT%2023-1%20FULL%20ISSUE-51-56.pdf (accessed on 1 March 2025).
- Biancolin, M.; Codato, F.; Nassivera, F.; Rotaris, L. Environmental sustainability of the agri-food chain and food miles: A literature review. Towards Eff. Effic. Just Energy Transit. 2025, 247–275. Available online: https://arts.units.it/handle/11368/3117779 (accessed on 1 April 2025).
- Zhang, L.; Li, H.; Yang, L.; Du, X.; Zhou, Y.; Sun, G.; Liu, J. Carbon footprints of centralized and decentralized food waste utilization pathways. Renew. Sustain. Energy Rev. 2025, 208, 115040. [Google Scholar] [CrossRef] [Scilit]
- Caputo, V.; Nayga, R.M., Jr.; Scarpa, R. Food miles or carbon emissions? Exploring labelling preference for food transport footprint with a stated choice study. Aust. J. Agric. Resour. Econ. 2013, 57, 465–482. [Google Scholar] [CrossRef] [Scilit]
- Grebitus, C.; Lusk, J.L.; Nayga, R.M., Jr. Effect of distance of transportation on willingness to pay for food. Ecol. Econ. 2013, 88, 67–75. [Google Scholar] [CrossRef] [Scilit]
- De-Magistris, T.; Gracia, A. Consumers’ willingness-to-pay for sustainable food products: The case of organically and locally grown almonds in Spain. J. Clean. Prod. 2016, 118, 97–104. [Google Scholar]
- Carroll, K.A.; Zepeda, L. Food Miles and Regional Logos: Investigating Consumer Preferences in the Midwestern United States. Sustainability 2024, 16, 2735. [Google Scholar] [CrossRef] [Scilit]
- Huang, C.L.; Jaenicke, E.C.; Vecchi, M.; Sheu, S.J. Effects of environmental and health information on willingness to pay for local and organic foods in Taiwan. Agribusiness 2025. Early View. [Google Scholar] [CrossRef] [Scilit]
- Liu, M. Chinese consumer preferences and willingness to pay for carbon-labeled eggs: An analysis based on choice experiment method. Front. Sustain. Food Syst. 2025, 9, 1569674. [Google Scholar] [CrossRef] [Scilit]
- Amorim, K.A.; Passos, L.P.; Galdino, M.L.S.; Souza, A.H.S.; Ribeiro, F.B.; de Oliveira Ferreira, T.; Rodrigues, J.F. Impact of carbon footprint of food production on consumer perceptions and attitudes: Insights from text highlighting. Food Qual. Prefer. 2025, 129, 105498. [Google Scholar] [CrossRef] [Scilit]
- Gastaldello, G.; Bošnjak, M.; Schäufele-Elbers, I.; Schamel, G. Are consumers willing to pay more for sustainable wine? A pre-registered systematic review and meta-analysis. Food Qual. Prefer. 2025, 134, 105655. [Google Scholar] [CrossRef] [Scilit]
- Biancolin, M.; Rotaris, L.; Pernot, D. Willingness to pay for sustainable delivery: Evidence from young consumers in Italy and Norway. Transp. Res. Part A Policy Pract. 2025, 199, 104580. [Google Scholar] [CrossRef] [Scilit]
- Savills. Italian Grocery Report 2025. 2025. Available online: https://pdf.euro.savills.co.uk/italy/italian-grocery-report-2025.pdf (accessed on 1 April 2026).
- Rose, J.M.; Bliemer, M.C. Constructing efficient stated choice experimental designs. Transp. Rev. 2009, 29, 587–617. [Google Scholar] [CrossRef] [Scilit]
- Johnson, R.; Orme, B. Getting the Most from CBC; Sawtooth Software Research Paper Series; Sawtooth Software: Sequim, WA, USA, 2003. [Google Scholar]
- Jiao, J.; Vernez Moudon, A.; Drewnowski, A. Does urban form influence grocery shopping frequency? A study from Seattle, Washington, USA. Int. J. Retail Distrib. Manag. 2016, 44, 903–922. [Google Scholar] [CrossRef] [Scilit]
- Kumar, A.; Landge, V.S.; Jaiswal, S. Analysing changes in grocery shopping trips after COVID-19: Nagpur case study. Transp. Res. Part D 2024, 128, 104073. [Google Scholar] [CrossRef] [Scilit]
- Gustat, J.; O’Malley, K.; Luckett, B.G.; Johnson, C.C. Fresh produce consumption and the association between frequency of food shopping, car access, and distance to supermarkets. Prev. Med. Rep. 2015, 2, 47–52. [Google Scholar] [CrossRef] [Scilit] [PubMed]
- Wainer, A.; Robinson, L.; Mejia Argueta, C.; Cash, S.B.; Satin-Hernandez, E.; Chomitz, V.R. At the nexus of grocery access and transportation: Assessing barriers and preferences for alternative approaches to enhancing food access. J. Transp. Health 2023, 33, 101712. [Google Scholar] [CrossRef] [Scilit]
- McFadden, D.L. Conditional logit analysis of qualitative choice behaviour. In Frontiers in Econometrics; Zarembka, P., Ed.; Academic Press: Cambridge, MA, USA, 1974. [Google Scholar]
- Train, K. Discrete Choice Methods with Simulation; Cambridge University Press: Cambridge, UK, 2009. [Google Scholar]
- Hess, S.; Palma, D. Apollo: A flexible, powerful and customisable freeware package for choice model estimation and application. J. Choice Model. 2025, 32, 100170. [Google Scholar] [CrossRef] [Scilit]
- Train, K. Halton sequences for mixed logit. In Working Paper 2000 University of California Berkeley; University of California Berkeley: Berkeley, CA, USA, 2000. [Google Scholar]
- Bhat, C.R. Quasi-random maximum simulated likelihood estimation of the mixed multinomial logit model. Transp. Res. Part B 2001, 35, 677–693. [Google Scholar] [CrossRef] [Scilit]
- Hagström, R.; Stenius, M.; Eriksson, N. Online grocery shopping (OGS) as scripted behavior: Insights on shopping routines of households with children. Br. Food J. 2025, 127, 489–499. [Google Scholar] [CrossRef] [Scilit]
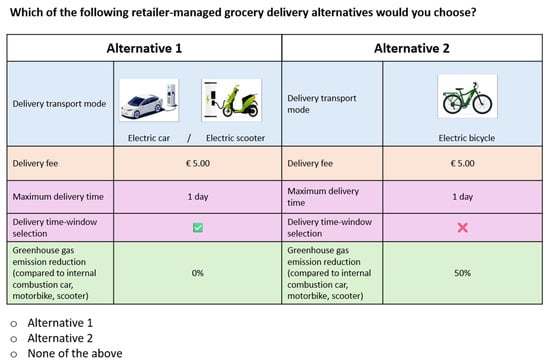
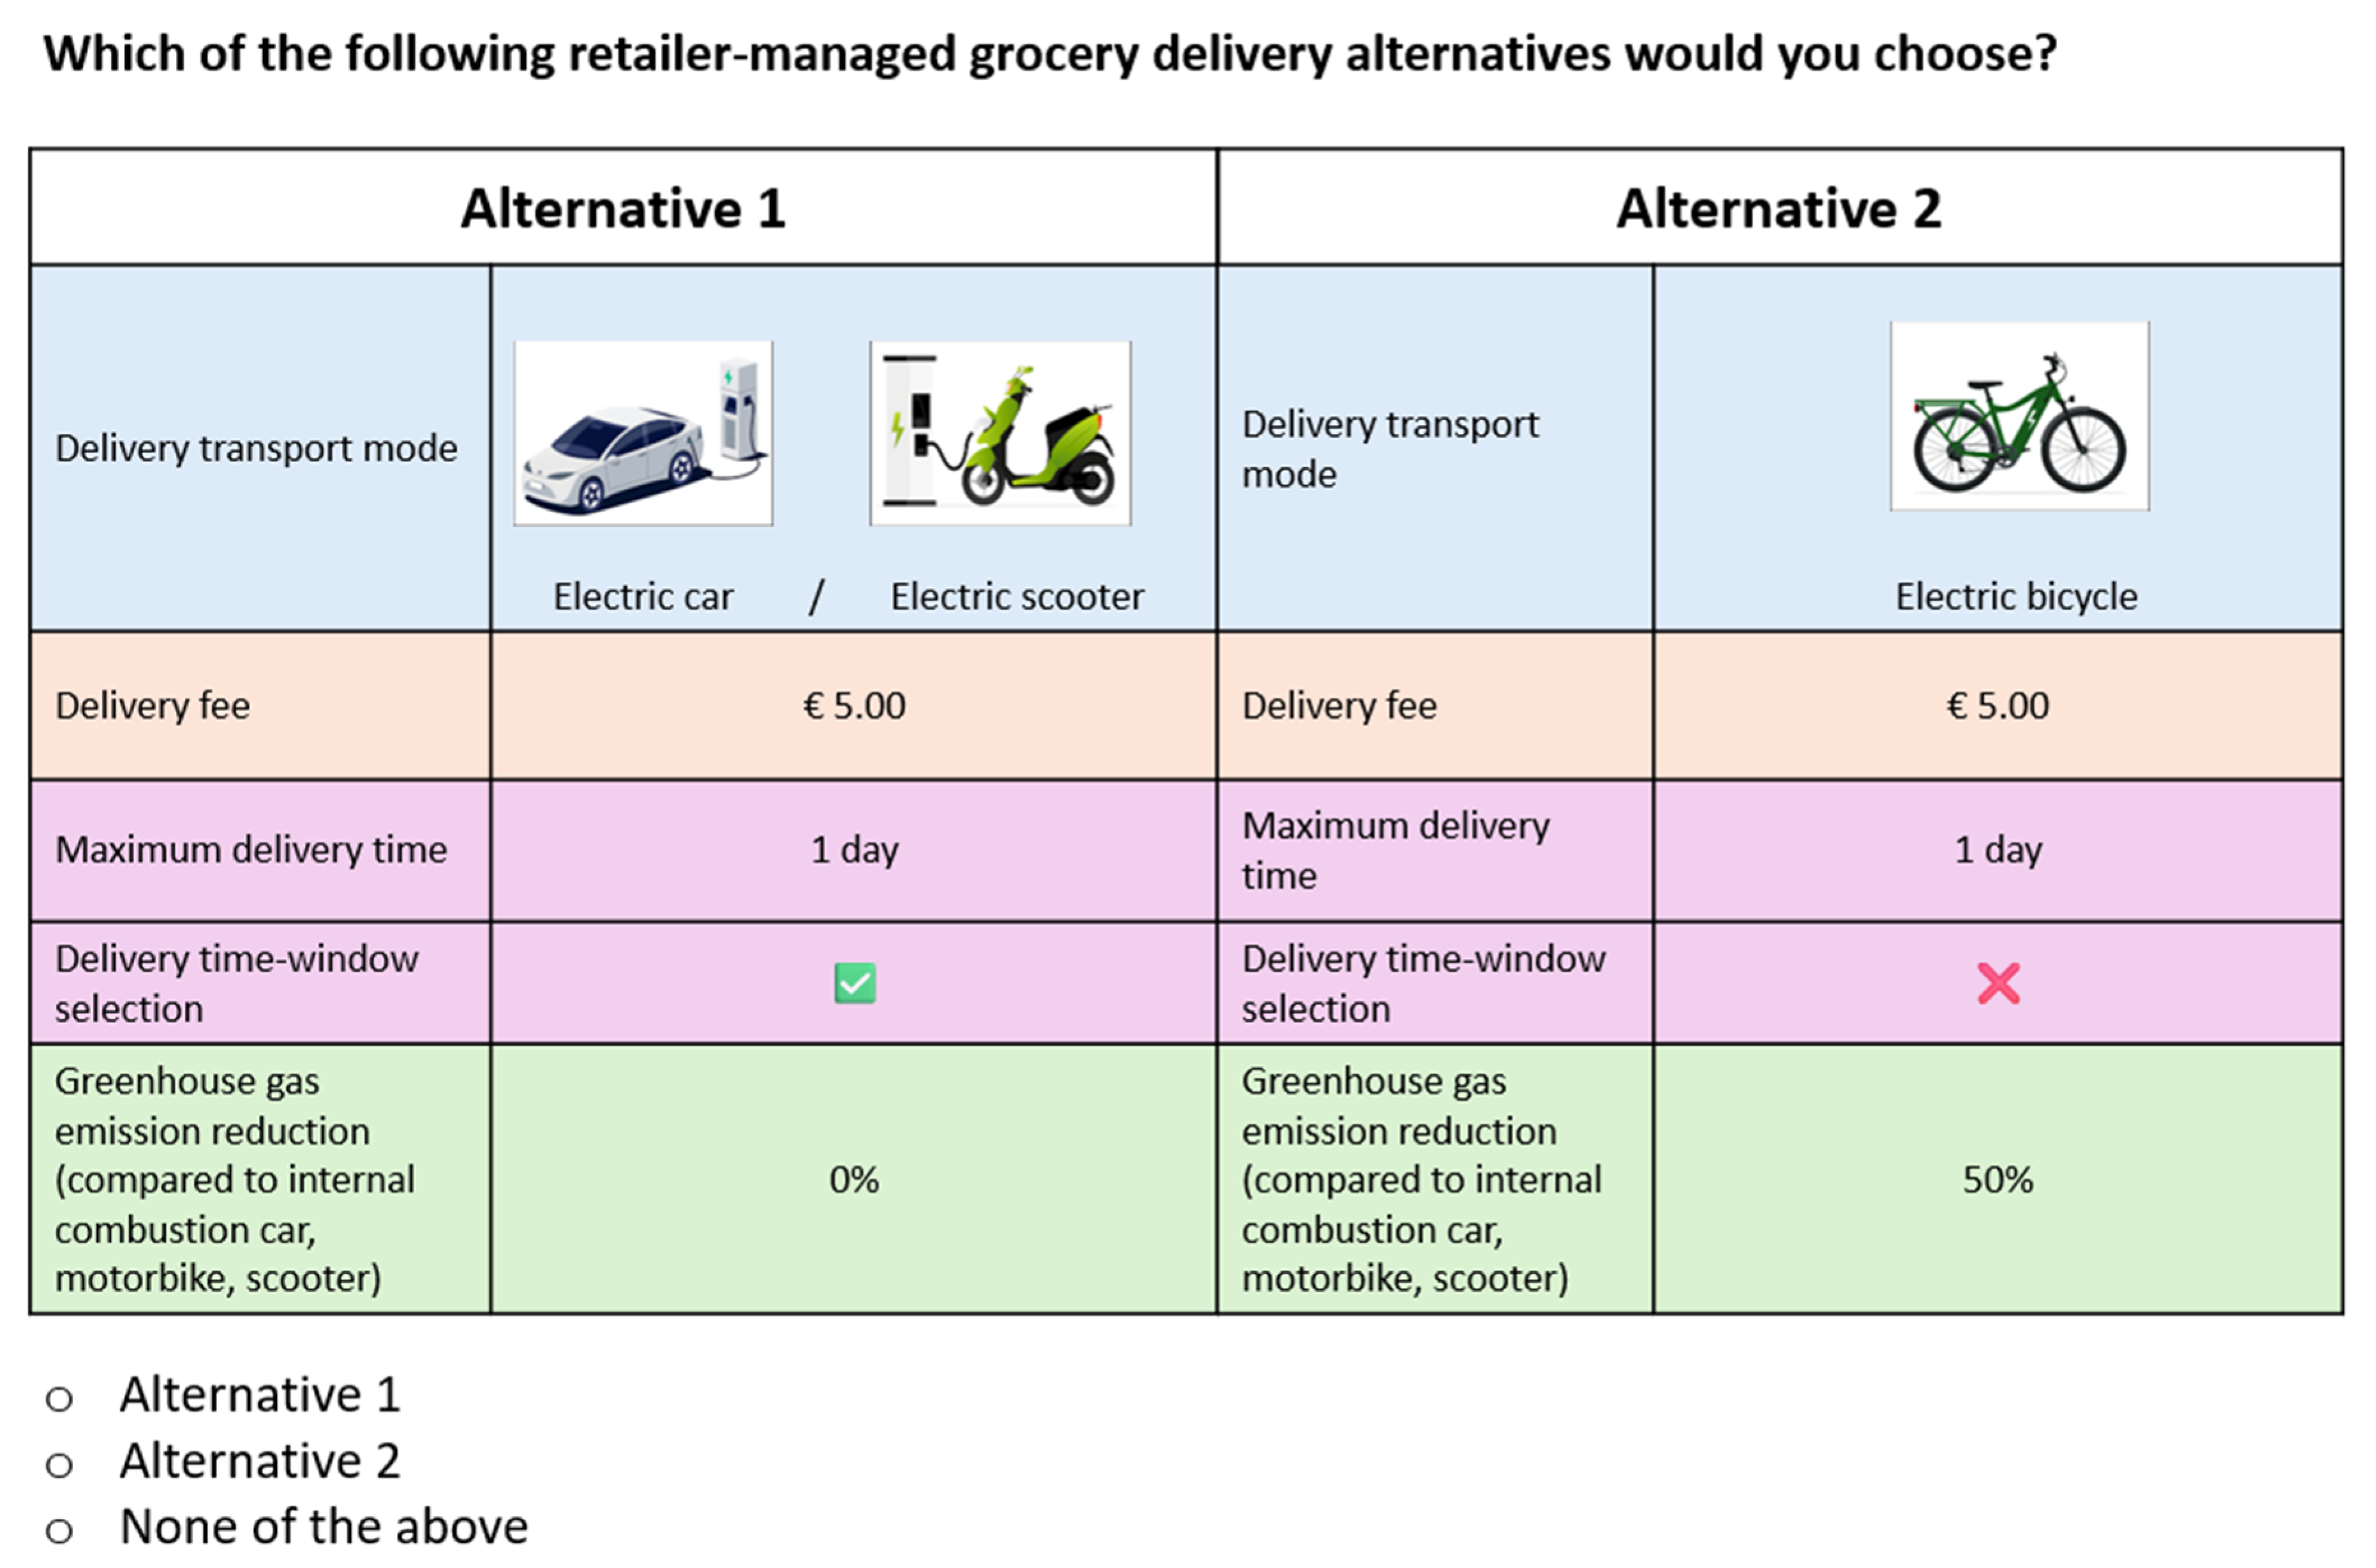
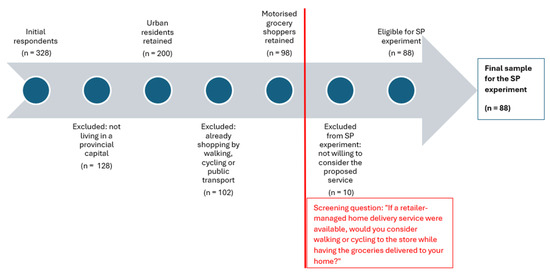
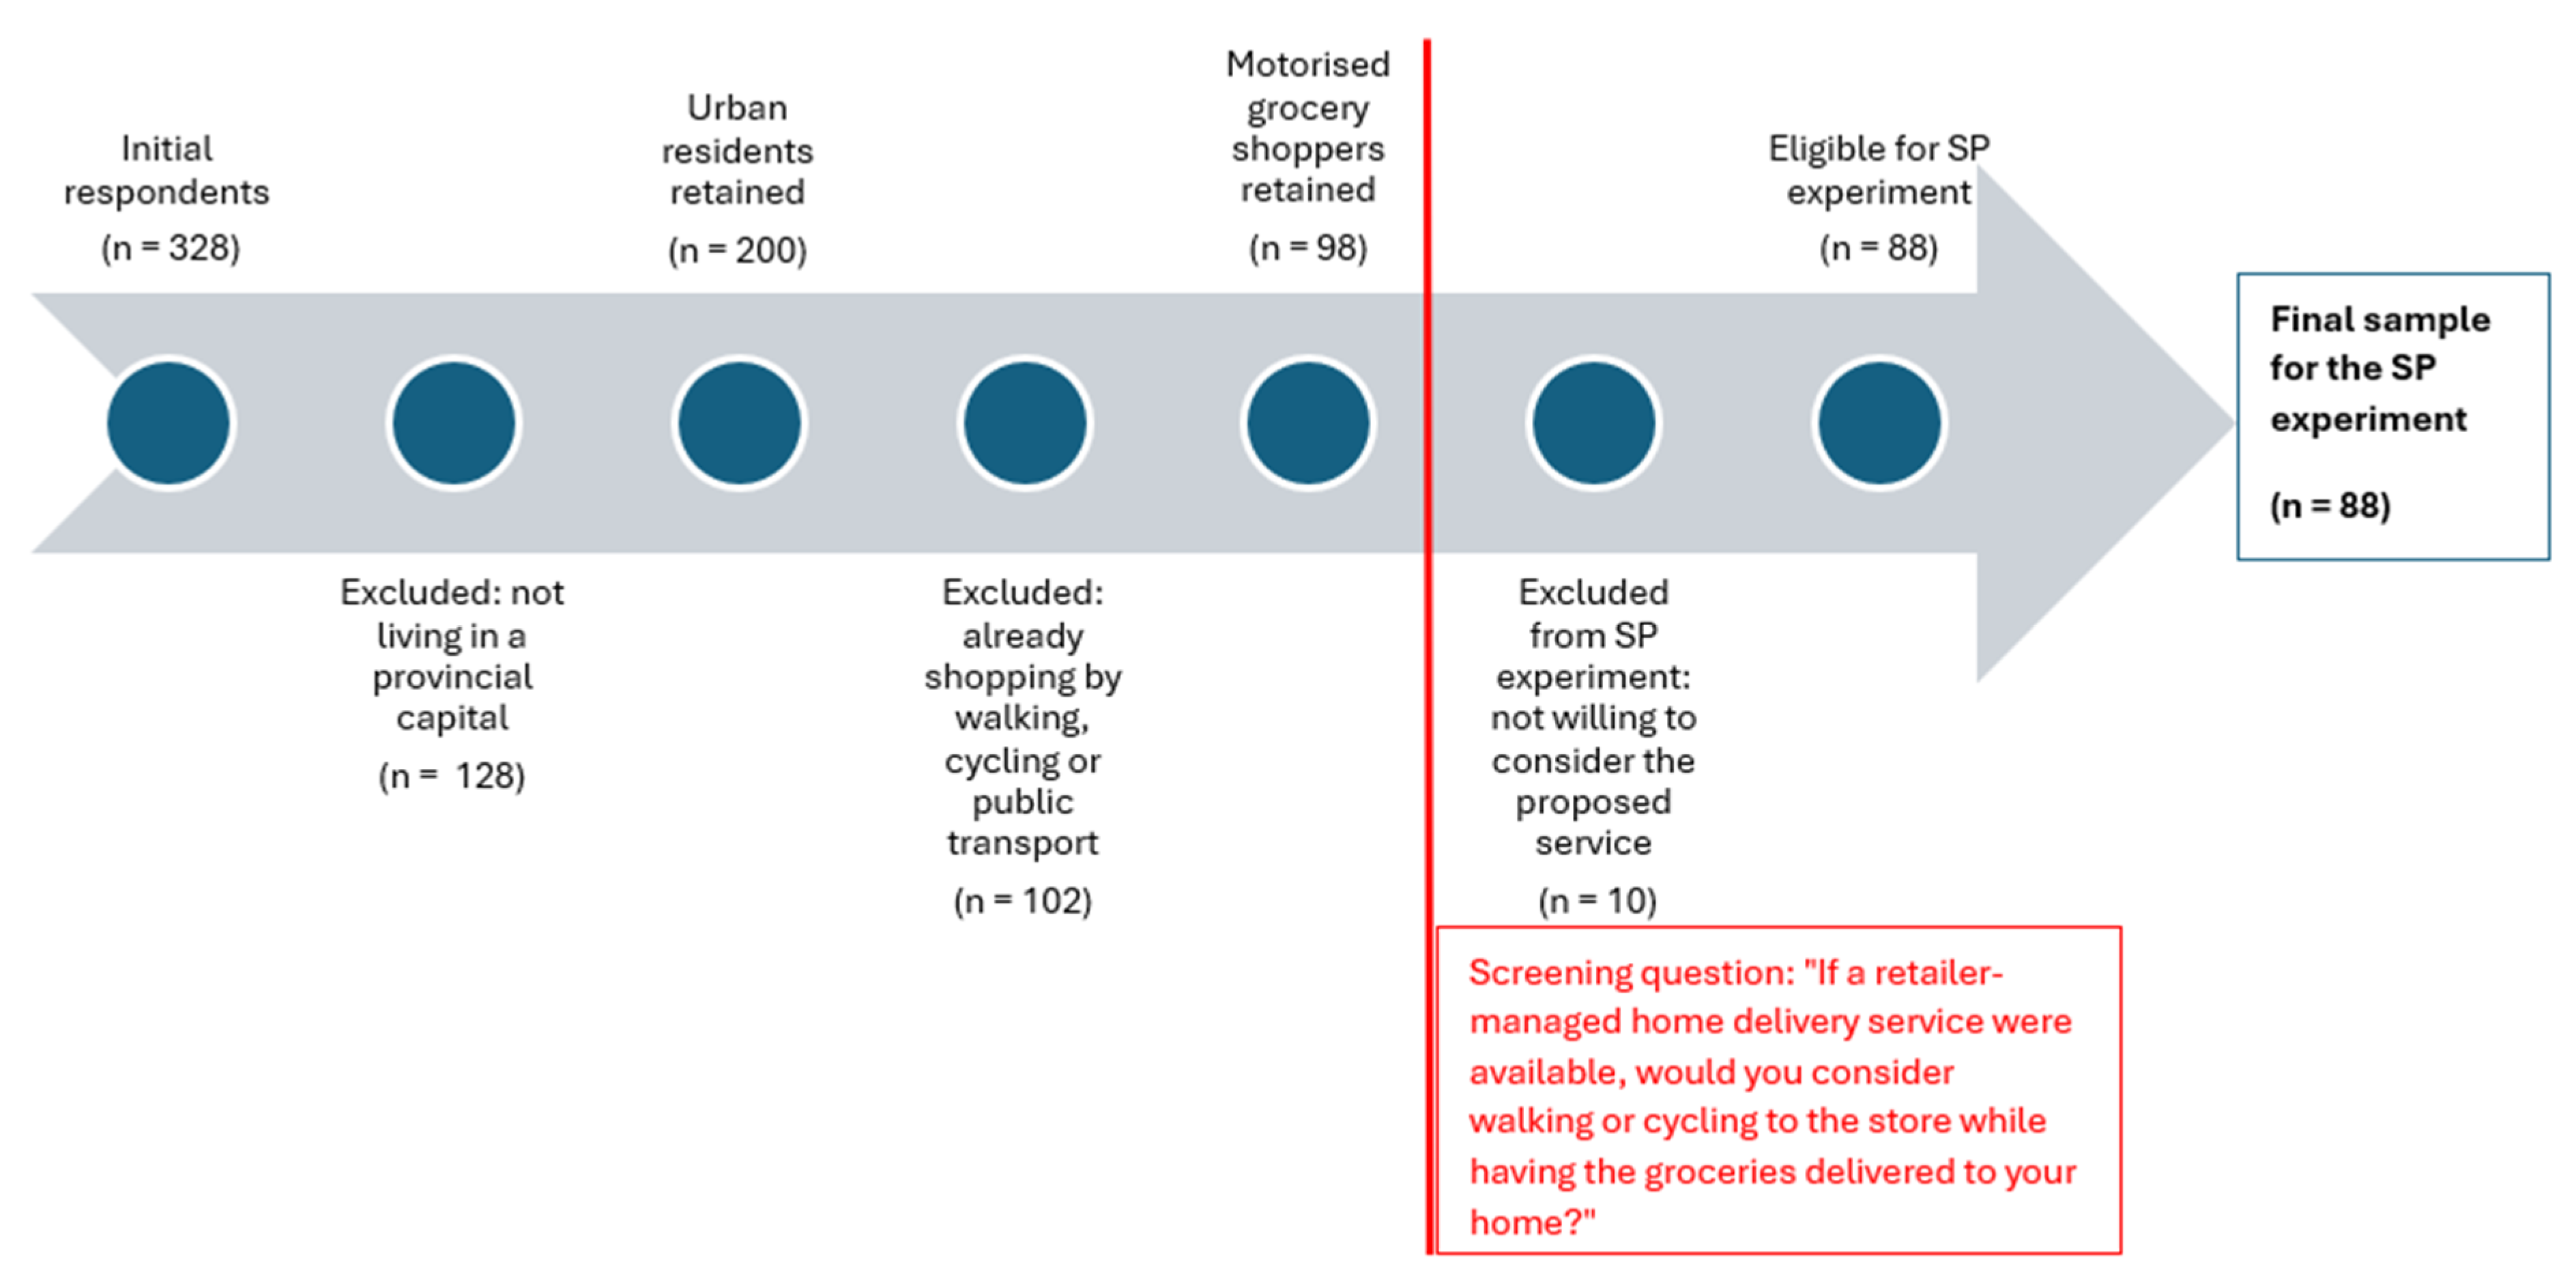
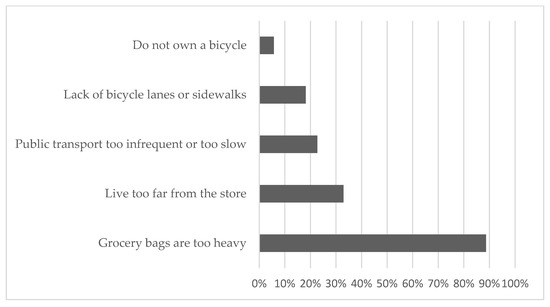

Disclaimer/Publisher’s Note: The statements, opinions and data contained in all publications are solely those of the individual author(s) and contributor(s) and not of MDPI and/or the editor(s). MDPI and/or the editor(s) disclaim responsibility for any injury to people or property resulting from any ideas, methods, instructions or products referred to in the content. |
© 2026 by the authors. Licensee MDPI, Basel, Switzerland. This article is an open access article distributed under the terms and conditions of the Creative Commons Attribution (CC BY) license.