Abstract
This study investigates the potential of Floating Car Data (FCD) collected from Volkswagen Group vehicles since 2022 for monitoring pavement conditions along two Italian road stretches. While such data are primarily gathered to analyze vehicle dynamics and mechanical behaviour, here, they are repurposed to support road network assessment through the estimation of the International Roughness Index (IRI). Daily aggregated datasets provided by NIRA Dynamics were analyzed to evaluate their reliability in detecting spatial and temporal variations in surface conditions. The results show that FCD can effectively identify critical sections requiring maintenance, track IRI variations over time, and assess the performance of surface rehabilitation, with high consistency on single-lane roads. On multi-lane roads, limitations emerged due to data aggregation across lanes, leading to reduced accuracy. Nevertheless, FCD proved to be a cost-efficient and continuously available source of information, particularly valuable for identifying temporal changes and supporting the evaluation of maintenance interventions. Further calibration is needed to enhance alignment with high-performance measurement systems, considering data density at the section level. Overall, the findings highlight the suitability of FCD as a scalable solution for real-time monitoring and long-term maintenance planning, contributing to more sustainable management of road infrastructure.
1. Introduction
The road is a space where citizens spend time daily, whether for occasional travel or routine commutes, such as home-to-work trips. Basically, road users’ primary expectations are safety, environmental quality, and smooth interaction with other users.
Road authorities, in response to these needs, must address challenges such as ensuring the safety of all user categories and integrating new technologies, including the gradual introduction of autonomous vehicles. To ensure a prompt and effective response to potential issues within the road network, it is essential to have a comprehensive understanding of the infrastructure’s condition, and timely maintenance can significantly impact user safety and network efficiency. In this context, an integrated cost-effectiveness and highly informative management system proves essential. Such a system allows for the optimization of available resources, enabling administrations to strategically and efficiently allocate often limited budgets to maintenance, preservation, and improvement of existing infrastructures [1,2,3].
Adopting an approach based on an effective management system not only ensures greater comfort and safety for users but also enhances the overall reliability of the road system, while keeping costs to an absolute minimum.
The ability to continuously monitor road conditions and respond promptly to emerging needs is fundamental for maintaining and optimizing road infrastructure, with direct benefits for all users of the road network.
In recent years, the development of advanced technologies has significantly increased the availability of data, revolutionizing road infrastructure management. Floating Car Data (FCD) has become an essential resource for optimizing the planning, monitoring, and maintenance of the road network, offering detailed and real-time information on pavement and traffic conditions. With the advent of new-generation vehicles equipped with advanced onboard sensors, it is now possible to collect large volumes of data related both to vehicle performance and the surrounding road infrastructure [4,5,6,7,8].
These extensive collections of georeferenced data, gathered from vehicles in motion, represent a powerful and innovative tool for monitoring infrastructure parameters. The data are collected by specific devices installed on the vehicles, which record the vehicle’s position, speed, direction of travel, and other route-related parameters at predefined time or distance intervals.
The information obtained from FCD can be used in real time to support immediate decision-making or stored and processed later as historical series, enabling longer-term analyses of specific road segments over defined periods. In both cases, it is crucial to accurately correlate the GPS measurements from the vehicles to the digital map of the road network, which serves as the spatial reference framework for localising and interpreting the collected data [9].
Although this approach departs from the standardised methodologies conventionally employed to assess the functional condition of pavement, such as profilometric measurements or reference devices for surface roughness, its main potential lies in the capability to derive large-scale, continuous and cost-efficient information directly from vehicles in operation. However, aspects related to reliability, accuracy and comparability with traditional reference techniques must be thoroughly investigated to ensure consistent and interpretable outcomes across different sections of the road network.
The collaboration with NIRA Dynamics has made it possible to explore the potential of data collected from Volkswagen Group vehicles equipped with sophisticated measurement systems. The goal is to verify whether and how information from FCD can describe, even on a macroscopic level for network-level analysis, the functional condition of road pavements, using parameters such as “grip” and “longitudinal roughness.” This approach, which takes advantage of data collected by vehicles as they travel along the road network, could optimize resources allocated to routine monitoring, reducing the need for visual inspections and improving process efficiency [10,11,12,13].
The creation of a database to collect this information, combined with the processing of data through dedicated procedures, is crucial for performing a comprehensive screening of the road network. Therefore, it is possible to accurately identify the sections that most urgently require maintenance, ensuring the preservation of safety and comfort standards. The FCD, produced by the Volkswagen Group vehicle fleet and recorded since 2022, enables the description of key pavement parameters by aggregating data in different ways. In the present analysis, particular attention was paid to “longitudinal roughness,” which is essential for assessing road pavement quality and planning maintenance activities.
The approach proposed aims to integrate and compare traditional methods with FCD in order to achieve more precise and continuous monitoring of road conditions in terms of roughness. This more flexible and dynamic approach not only allows for the identification of road sections maintenance needs (budget allocation), but also for the assessment of the effectiveness of maintenance work conducted (budget review), thereby improving the overall management of infrastructure [14,15].
The physical evaluation of pavement conditions is generally performed using specialized, high-cost vehicles and requires experienced operators [2,16]. However, various inevitable factors (infrastructure characteristics, natural degradation, structural deficiencies, and excessive heavy vehicle traffic) gradually cause surface deformations, significantly affecting driving comfort and safety. Currently, pavement condition monitoring primarily relies on manual surveys conducted with specially equipped vehicles [17]. However, the high labour and equipment costs make these operations unsuitable for large-scale, periodic road inspections. Pavement condition monitoring is typically carried out on a limited spatial and temporal scale and is predominantly driven by research objectives [18].
Compared to high-resolution and high-cost devices equipped in instrumented vehicles, smartphones are rather cost-effective and supplied with embedded communication channels. The widespread availability and affordability of smartphones have opened new opportunities for crowdsourced data collection, enabling participatory pavement monitoring over large-scale road networks.
However, the sensing capabilities of low-cost smartphone sensors are limited in terms of positioning accuracy and acceleration measurement frequency, which affects the reliability of IRI estimates and makes their results less consistent than those obtained with professional-grade equipment. Although the latter ensure higher precision, they require significant installation and maintenance costs, making smartphone-based methods a trade-off between affordability and measurement accuracy [19,20].
In this context, FCD collected from OEM-equipped vehicles represents a promising middle ground between high-cost on-site testing and low-accuracy smartphone-based methods. These data offer a balance of measurement quality, spatial coverage, and cost-efficiency, enabling continuous and scalable monitoring of pavement conditions without the logistical and economic burdens associated with traditional surveys.
Therefore, the main objective of this study is to evaluate the potential of Floating Car Data (FCD) as a reliable and scalable source of information for assessing the functional condition of road pavements, with particular focus on longitudinal roughness. The research aims to compare and integrate FCD-derived indicators with traditional survey-based methods, to verify their consistency and to explore the feasibility of adopting FCD for network-level monitoring. The study contributes to the existing methods by demonstrating a data-driven approach capable of improving the efficiency, continuity, and cost-effectiveness of pavement condition monitoring and management.
In the future, combining these data with machine learning and predictive models could significantly enhance analysis accuracy, enabling the development of reactive maintenance strategies aimed at optimizing resource allocation and strengthening pavement management systems (PMS) through more informed, data-driven decision-making [21,22,23].
Literature Reviews: Road Roughness
When discussing pavement roughness, reference is not made to surface texture defects but to macroscopic irregularities, characterized by wavelengths greater than the size of a tire footprint. These irregularities mainly manifest as longitudinal and transverse deformations, including cracks, ruts, and step-offs. Their formation depends on various factors such as traffic loads, environmental conditions, the nature and performance of pavement and subgrade materials, as well as construction methods. According to the classification proposed by PIARC during the 1987 World Congress in Brussels, these irregularities fall within the megatexture and unevenness ranges, with wavelengths exceeding 50 mm, clearly distinguishing them from micro- and macrotexture, which are related to skid resistance rather than roughness [24,25].
Irregularities can result not only from structural issues but also from poor-quality workmanship or uneven laying surfaces, both longitudinally and transversely, as also highlighted by Plati et al. (2023) [26], who demonstrated that surface irregularities may originate from both construction deficiencies and variations in the structural condition of the underlying pavement layer.
Consequently, even newly constructed pavements, not yet subjected to traffic, may exhibit surface irregularities. The longitudinal roughness of the pavement is defined as the vertical variation, in the direction of travel, of a portion of the actual surface of the pavement relative to an ideal reference plane, characterized by undulations with wavelengths greater than 0.5 m, as per ISO 13473–2:2002 [27].
This parameter significantly affects driving comfort, the stresses applied on the road structure, noise emissions, and overall driving safety. Different types of longitudinal irregularities are classified below:
- Single Event Bump: localized irregularities that occur over lengths of less than 100 m.
- Profile Roughness: irregularities distributed over significant lengths, generally greater than 100 m, which cause fatigue in structural components and reduce braking effectiveness [28].
Systems for measuring road surface irregularities are generally based on Non-Destructive Testing (NDT) techniques, which enable continuous evaluation of pavement conditions without altering the structure. These systems can be divided into two main categories: those that assess the vehicle’s response to stresses caused by surface irregularities and those that directly measure the longitudinal profile of the road surface.
The equipment in the first category, known as RTRRMS (Response Type Road Roughness Measuring System), consists of vehicles equipped with instruments called “road meters”. These devices measure the dynamic effect of road surface irregularities on the vehicle by recording the cumulative displacement of the suspension system.
On the other hand, systems that measure irregularities based on the acquisition of the road’s longitudinal profile are known as profilometers. These instruments provide a two-dimensional digital profile of the pavement, sampled point by point at a predefined interval. Profilometers offer a more objective and stable measurement of pavement roughness and are increasingly replacing the measurements obtained from RTRRMS devices, which are influenced by the inertial and mechanical characteristics of the vehicles on which they are installed.
At the same time, it is important to highlight that even measurements obtained from profilometers represent an approximation of the actual pavement profile, sometimes resulting in appreciable differences between the profiles detected by two different profilometers.
The ISO 13473–3 standard [29], “Characterization of pavement texture utilizing surface profiles—Part 3: Specification and classification of profilometers,” classifies profilometers based on four fundamental properties: mobility, detectable wavelength range, contact nature, and operating principle of the device.
Laser profilometers, currently among the most widely used, are installed on test vehicles and detect the longitudinal profile of the pavement along the route, recording every height variation. These devices consist of two main components: an emitter source and a receiver transducer. Their operation is based on the optical principle of triangulation, generating a signal proportional to the distance between the point of incidence of the laser on the pavement and the emitter source. A well-known example of a laser profilometer is the Road Surface Profilometer (RSP), an advanced instrument equipped with 19 lasers that detect the pavement profile along three tracks—right, left, and centre.
In recent years, numerous data-driven and machine learning-based approaches have been proposed to enhance the accuracy and efficiency of pavement condition evaluation. One relevant example is the work by Li et al. [30], who proposed a CPSO-XGBoost segmented regression model for predicting the deflection basin area of asphalt pavements based on full-scale testing data from RIOHTrack. Their method, which uses road temperature, load time, and pressure as input variables, demonstrated superior performance over classical machine learning models, and highlighted the potential to reduce testing frequency without compromising accuracy.
Another relevant contribution is a promising short-term rutting depth prediction model that was introduced using an extreme learning machine (RELM) optimized through an adaptive particle swarm algorithm, developed by Li et al. [31]. This model, also tested on RIOHTrack data, integrates cognitive analysis of production parameters and uses complex network clustering (Louvain algorithm) to detect structural similarities across pavement sections. The results showed high predictive performance and robustness across non-linear datasets, reinforcing the feasibility of machine learning tools for real-time monitoring and maintenance decision-making.
These recent developments reflect the growing interest in applying AI and network science to road engineering, shifting from traditional inspection-based systems to predictive, data-driven models based on real-world sensor data. In this context, the present work explores the use of Floating Car Data (FCD) as a low-cost, high-frequency alternative for road roughness monitoring and maintenance planning at the network level.
Supporting this approach, a recent case study conducted on a 112 km segment of Interstate-65 in Indiana demonstrated a strong correlation (R2 = 0.79, p < 0.001) between crowdsourced vehicle data and inertial profiler measurements, confirming the potential of this approach for large-scale monitoring of pavement conditions [32]. These results align closely with the aim of the present study, which leverages NIRA FCD to support network-level assessment and maintenance planning
To quantitatively assess the condition of the road pavement, specific roughness indices are used, which provide an objective measure of surface quality and help identify sections that require maintenance, promoting effective management. Some of these indices are derived from a direct observation of the road surface conditions, while others are calculated through surveys of the road’s longitudinal profile. Among them are the International Roughness Index (IRI) and the Present Serviceability Index (PSI).
The IRI is the most widely used index worldwide to represent longitudinal roughness. It is a dimensionless parameter, generally expressed in m/km or mm/m, and can range from 0, for a perfectly smooth profile, to higher values associated with roads with reduced drivability, even at low speeds, as shown in Figure 1 [33]. Thanks to its stability over time and transferability across different contexts, the IRI has become a truly international standard (Alonso-Solorzano et al., 2023) [34], with successful applications in both developed and developing countries (Barzegaran et al., 2022) [35].
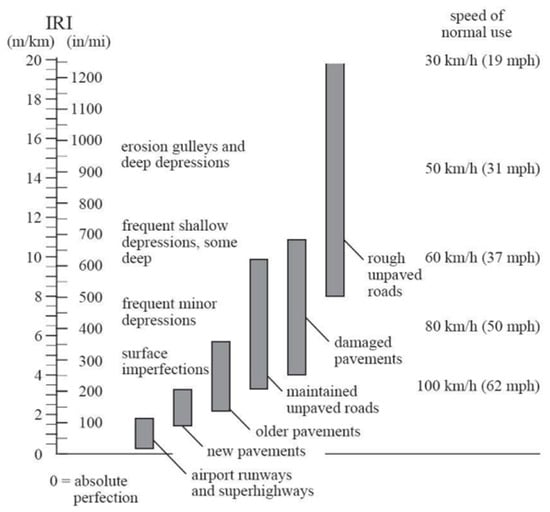
Figure 1.
IRI Roughness Scale. Source: Data from Creative Commons License (Sayers and Karamihas 1998) [36].
The ASTM E 1170-97 (2023) [37] standard defines the calculation of the IRI based on the longitudinal profile of the pavement, using a mathematical model known as the Quarter Car Simulation. The IRI is defined as the ratio between the sum of the relative displacements between the body and the wheel of a standard vehicle moving at a speed of 80 km/h and the length of the road segment being analyzed.
The IRI is not suitable for characterizing localized discontinuities such as potholes, speed bumps, or bridge joints, as it is strongly influenced by the length of the calculation base. According to EN 13036–6:2008, the calculation base should be at least 100 m; however, this value is not universally adopted, as various standards around the world apply different calculation lengths (Mucka, 2017) [38]. Shorter segments can lead to elevated IRI values even in the absence of significant defects, thus limiting its sensitivity to highly localized surface irregularities [39].
The PSI, developed by AASHTO, historically served as a key measure to evaluate the overall condition of the pavement by considering both surface irregularities and other forms of structural degradation [40].
For new pavements, the PSI typically ranges between 4 and 4.5, while values between 2 and 2.5 usually indicate the need for maintenance. Based on experimental observations, relationships have been proposed to correlate PSI and IRI using coefficients α and β, as documented in Table 1:

Table 1.
Proposed α and β coefficients as correlation factors between PSI and IRI value.
From Equation (1), it can be observed that increasing IRI values correspond to decreasing PSI values. The limit values for driving comfort proposed by the “Catalogo delle Pavimentazioni Stradali” (CNR B.U. 178/1995) can be considered for operational terms, as shown in Table 2 [46]. From this, it is possible to derive the corresponding IRI values for different types of roads.

Table 2.
Reliability and PSI for different roads—“Catalogo delle Pavimentazioni Stradali” [46].
Otherwise, the technical paper “The Highway Development and Management Model (HDM-4) Road Use Costs Model”, designed by the World Bank, provides default IRI values corresponding to different road classes and pavement condition levels, as shown in Table 3. These reference values are widely used in road pavement management systems (PMS) to estimate serviceability and prioritize maintenance activity [47].

Table 3.
Default values for road roughness—“HDM 4 Road Use Costs Model” [47].
2. Materials and Methods
2.1. Research Overview
Floating Car Data collected since 2022 from Volkswagen Group were intended for vehicle dynamics and mechanical behaviour analysis. In this study, those data are repurposed to describe the functional condition of road infrastructure at the network level.
The methodological approach is based on the aggregation and analysis of daily data provided by NIRA Dynamics, aimed at tracking IRI variations over time and space, identifying critical sections that exceed predefined thresholds, and evaluating the effectiveness of surface rehabilitation works. By comparing FCD with data collected through high-performance measurement systems, the study explores the strengths and limitations of this approach. During the analysis, the distinction between single-lane and multi-lane road contexts emerged as a relevant factor, as differences in measurement accuracy became evident. This observation subsequently led to a focused examination of how spatial data aggregation affects reliability in multi-lane environments.
2.2. Data Overview
To achieve the objectives of this study, longitudinal roughness measurements were obtained using both Floating Car Data (FCD) provided by NIRA Dynamics and standardized in-situ tests. The continuous and real-time collection of FCD enabled the creation of a particularly comprehensive dataset, which was compared with the results of traditional tests to assess the effectiveness of NIRA’s innovative and cost-effective methodology. As illustrated in Figure 2, after identifying homogeneous road sections of 25 m and 100 m, both daily and long-term IRI values are extracted and subsequently compared through a coefficient of determination.
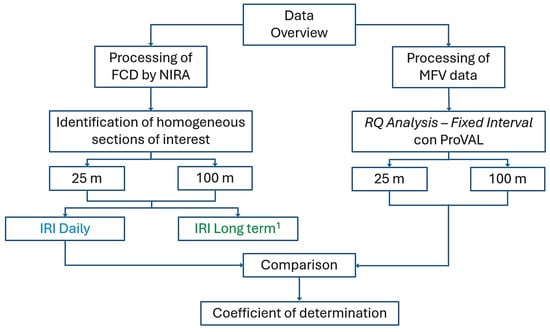
Figure 2.
Flowchart of data processing for IRI analysis. 1 IRI Long Term is obtained through the application of a Kalman filter on a 14-day period on daily values of IRI.
The selection of spatial segment lengths of 25 m and 100 m was determined based on both the data structure and technical standards. Specifically, NIRA Dynamics provides FCD already aggregated over 25 m segments, which therefore represent the minimum available spatial resolution for comparison purposes. Consequently, the first analysis was conducted on homogeneous 25 m sections to enable a direct comparison with standardised field measurements. Subsequently, a 100 m segment length was adopted in accordance with UNI EN 13036–6:2008, which recommends this base length for capturing extended surface irregularities along the pavement. Shorter base lengths may result in artificially elevated IRI values even in the absence of significant defects, whereas a 100 m interval ensures a more reliable representation of widespread roughness conditions.
2.2.1. Longitudinal Roughness Data—NIRA Dynamics
Longitudinal roughness data are generated through software installed in the vehicle during the production phase. To measure pavement roughness, NIRA utilizes signals from accelerometers installed on fleet vehicles. Modern vehicles are equipped with accelerometers able to record vertical acceleration, which are ideal for obtaining information about the International Roughness Index. However, to obtain a larger volume of data, the procedure also makes use of signals of transverse and longitudinal accelerations, available in all vehicles of the fleet.
The accelerometer transmits a signal at a frequency of 200 Hz to the CANBUS, which acts as a filter, outputting a signal at 50 Hz. Before reaching the CANBUS, the signal is processed to calculate the pavement’s roughness by applying a Band-Pass Filter that selects only the relevant frequencies for the calculation of the IRI. The analysis then moves to the amplitude domain using a Fourier Transform, and a linear regression model is applied to obtain roughness measurement in terms of the IRI. The band-pass filter and the linear regression model used to derive the IRI are part of the algorithms of NIRA. Consequently, their specific design and parameterisation are not publicly disclosed. Nevertheless, these algorithms are optimised to isolate the frequency range associated with pavement roughness and to ensure an accurate estimation of the IRI from vehicle acceleration data.
The data collected by the NIRA system pertains to each vehicle that travels on the road network and is aggregated both spatially and temporally. The information is provided every 25 m, averaging the data collected from each pass on one or more traffic lanes, depending on the characteristics of the road section.
Temporal aggregation is performed daily, by the arithmetic mean value of the roughness generated by different vehicles, along with the corresponding variance. An additional roughness value, defined as “long term roughness”, is made available after the application of a Kalman Filter, which reduces the impact of daily data affected by events that may have significantly altered vehicle trajectories. This filter assigns greater weight to more recent data and data with lower variance. The specific characteristics and parameters of the Kalman Filter employed for temporal smoothing are not publicly disclosed, as they are part of NIRA Dynamics’ internal data processing framework.
The recorded information is always geolocated and can be displayed in any GIS system; in this study, QGIS was used [48]. It includes information on the IRI, expressed in mm/m and calculated over a 25 m segment, as well as the variance of the IRI, which is used to assess the homogeneity of the data within the reference segment. Values below 0.8 mm/m are not recorded by the system.
2.2.2. Longitudinal Roughness Data—Standard Measurement
When adopting new technologies, such as the NIRA system for monitoring road conditions, it is essential to ensure that the results provided are both valid and reliable. Standardized tests play a central role in this validation process, as they serve as a universal reference. They are conducted under controlled conditions, following standardized procedures and protocols established by technical standards. These tests define objective and measurable criteria that new technologies must satisfy to be validated.
For the roughness measurements carried out on the studied road sections, the Multi-Functional Vehicle (MFV), shown in Figure 3, was used. This vehicle is equipped with numerous additional subsystems compared to a basic system, allowing simultaneous measurement of IRI and RN, longitudinal and transverse profiles, macrotexture, as well as surface and geometric irregularities.
The basic system includes a standard vehicle, a computer mounted on a rack, and various measurement devices: a Road Surface Profilometer (RSP) equipped with 17 Class 1 lasers (according to ASTM E 950) [49], a Distance Measuring Instrument (DMI), up to 8 cameras, a GPS system, and a Laser Crack Measurement System (LCMS). The laser sensors detect the elevation of the bar relative to the pavement surface at various points along the lane, while accelerometers monitor the vertical oscillations of the vehicle body. The sensors, installed on the front bar, record signals along three specific path alignments, Right Wheel Path, Left Wheel Path, and Centerline, ensuring accurate measurement of the road profile for each track [50].
The processing of the profile, aimed at obtaining data comparable to the NIRA Dynamics database, was carried out through a Ride Quality Analysis using the ProVAL 4.0.60.0 [51] software (FHWA), which provides the IRI along the examined alignment as output.
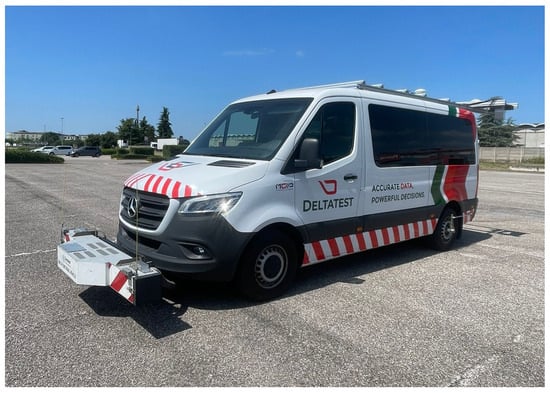
Figure 3.
Multi-Functional Vehicle. Source: Reprint with permission of Deltatest srl [50].
2.3. Data Analysis
The data processing initially focused on exploring the information contained in the FCD, with the aim of assessing its reliability in representing the IRI indicator estimated using the standard methodology. The procedure was structured to ensure methodological consistency across the two case studies.
The analysis began with the selection of two distinct observation periods: one prior to the rehabilitation works (before-rehabilitation) and one following them (after-rehabilitation), to assess the changes in pavement condition over time. FCD were then spatially aggregated at regular intervals (25 m and 100 m) to obtain average IRI indicators along the analyzed road sections. For the long-term evaluation, temporal smoothing techniques, such as the Kalman filter, were applied to better observe the trend evolution.
The spatial and temporal variability of the IRI was graphically represented, enabling a clear visualization of the impact of the maintenance works and the identification of areas with significant changes. Subsequently, the IRI values obtained from FCD were compared with those obtained from standard measurement instruments, resulting from data processing with ProVAL [51], ensuring alignment using a common 100 m calculation base.
To assess the consistency between the two data sources, a linear regression analysis, a popular method for comparing methods of measurement, was performed, and the resulting coefficients of determination allowed the evaluation of the reliability of FCD for network-level applications [52].
The analysis further enabled the identification of substantial improvements in the IRI following maintenance works and revealed localized variations not initially documented, confirming the potential of FCD for detailed and widespread monitoring.
2.4. Case Study
The longitudinal roughness data recorded by the fleet was extracted and post-processed for two roads with different classifications, cross-sections, and functional classes—defined by NIRA on a scale from 1 to 5 according to traffic type and travel speed—to ensure a wide range of information collected with Floating Car Data. Specifically, the following roads were analyzed:
- Strada extraurbana Regionale 429 di Val d’Elsa (SR 429): a rural two-lane, two-way road with a single carriageway and one lane per direction, classified as functional class 2; according to DM 05.11.2001 [53], it is a C1 type.
- Strada di Grande Comunicazione Firenze–Pisa–Livorno (SGC FI-PI-LI): a freeway with separated carriageways and two lanes per direction, classified as functional class 1; according to DM 05.11.2001 [53], it is a B type.
The Strada Regionale 429 di Val d’Elsa (SR 429), located in Tuscany, stretches for 38 km, connecting Poggibonsi in the province of Siena to Empoli in the province of Florence. The new SR 429 was built to address the inadequacy of the existing road network in Val d’Elsa, with the aim of creating a fast connection between the Florence-Siena link road and the FI-PI-LI, capable of accommodating increasing traffic volumes.
The analysis was conducted on the Empoli–Castelfiorentino segment (Figure 4), from km 18 + 900 to km 33 + 400, in both the northbound and southbound directions. This section bypasses the towns of Dogana, Castelnuovo d’Elsa and Brusciana, easily accessible through three roundabouts. Road lanes and shoulder widths are respectively 3.75 m and 1.50 m.
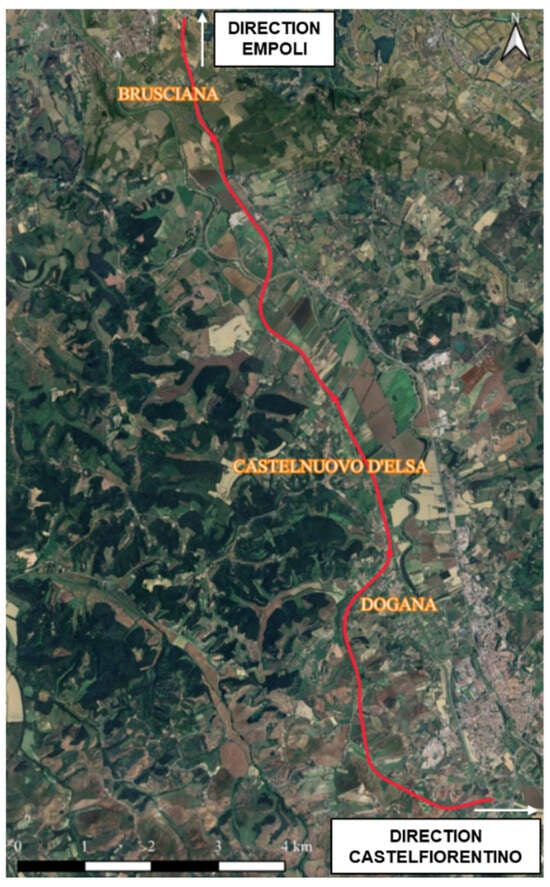
Figure 4.
Territorial context of the analyzed section: SR 429, Empoli–Castelfiorentino.
The analyzed section has an Annual Average Daily Traffic (AADT) of 13,089 vehicles/day, recorded during 2024 by the monitoring station located at km 57 + 650 on the section of the former SR 429 within the municipality of Castelfiorentino. Although the monitoring station is not positioned directly on the analyzed segment, it provides a reliable estimate of traffic volumes. This is due to the balanced traffic flow observed at the three roundabouts located along the route, where the number of entering and exiting vehicles is comparable, ensuring consistency in traffic levels throughout the section. Vehicles instrumented with NIRA Dynamics sensors constitute about 5% of the overall vehicle flow along the section, which can be considered a representative subset for the evaluation of pavement surface conditions.
The Strada di Grande Comunicazione Firenze–Pisa–Livorno (SGC FI-PI-LI) is one of the most important regional roads in Tuscany. It runs along the east-west axis of the region, stretching for approximately 100 km, and connects the cities of Florence, Pisa, and Livorno, as well as their respective provincial areas. This infrastructure experiences a high level of traffic as it links the main hubs in the northern part of Tuscany (port, airport, and freight village) to each other and to the key routes crossing the area, such as the A1 motorway, A12 motorway, and S.S.1 Aurelia.
The SGC FI-PI-LI features a dual-carriageway configuration with two lanes per direction. The analyzed section (Figure 5) extends from km 18 + 900 to km 27 + 200, located between the Montelupo Fiorentino and Empoli Centro exits, both within the municipality of Florence.
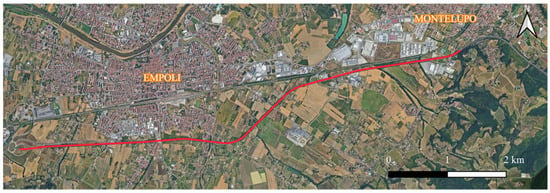
Figure 5.
Territorial context of the analyzed section: SGC FI-PI-LI.
The analyzed section records an Average Daily Traffic (ADT) of 50,081 vehicles/day, registered during 2024 by monitoring station No. 79, located at km 26 + 100, on the stretch between Empoli Est and Empoli Centro. The value is considered representative of the entire segment, as there is no entry or exit points along this section that would significantly alter traffic volumes. Similarly to the SR 429 case, vehicles instrumented with NIRA Dynamics sensors constitute about 5% of the overall traffic stream.
It is important to specify that part of the analyzed sections underwent a maintenance of the wearing course, thanks to which it was possible to assess the variation of the roughness value measured through the FCD. The presence of maintenance interventions, along with data collected before and after these events, allows for the determination of the accuracy of NIRA data.
The database related to the measurement of the longitudinal roughness of SR 429 covers the period from December 2023 to April 2024 and, therefore, includes the effects of the surface maintenance carried out during the first week of February 2024.
The database for the SGC Firenze–Pisa–Livorno covers the period from September 2023 to May 2024. Similarly, this database reflects the impact of pavement maintenance carried out from 13 May to 16 May 2024, on several sections (from km 19 + 400 to km 20 + 200 and from km 21 + 000 to km 21 + 400).
A specific campaign of roughness tests using a standard methodology was also conducted along both studied roads—on the SR 429 at the end of April 2024 and on the SGC FI-PI-LI at the end of May 2024—with the primary aim of verifying the accuracy of the data obtained from floating vehicles through a direct comparison between the two available datasets.
3. Results and Discussion
3.1. Case of SR 429
The data analysis focused on assessing the rehabilitations carried out during the first week of February 2024, which involved the section shown in green in Figure 6: the roundabouts of Dogana (Section A), Castelnuovo d’Elsa (Section B), and Brusciana (Section D), including the entry and exit branches in both travel directions. These rehabilitations included milling and the application of a new wearing course.
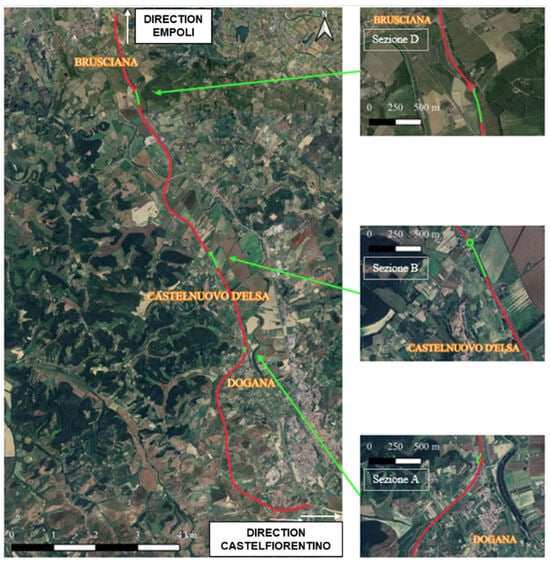
Figure 6.
Context of the analyzed section: SR 429.
To analyze the effects of the maintenance on the pavement condition, data collected by NIRA from December 2023 to April 2024 were used.
The analysis period was divided into two intervals: before rehabilitation (December 2023 and January 2024) and after rehabilitation (February, March, and April 2024). The trend of the IRI was graphically represented as a function of the chainage (Figure 7), using a spatial resolution of 25 m, with the values averaged for each time interval.
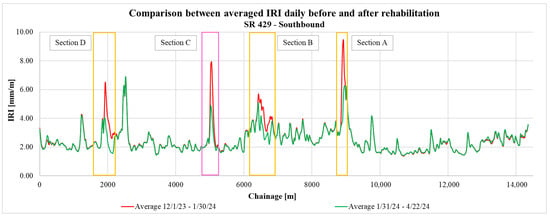
Figure 7.
Analysis of the averaged IRI Daily in the spatial domain—SR 429 Southbound.
The graphical representation, featuring a clear colour distinction (red for the before-rehabilitation period and green for the after-rehabilitation period), highlights the variations in the IRI along the entire analyzed section.
The data recorded by the NIRA Dynamics fleet showed a significant reduction in IRI in the sections affected by the maintenance, confirming their effectiveness. Additionally, the analysis revealed an unexpected improvement in Section C, between km 05 + 000 and km 05 + 150, attributed to maintenance work related to trenching for the expansion of a water pipeline, as identified through the data analysis.
This analysis confirms the potential of Floating Car Data not only to detect and quantify improvements in surface roughness following maintenance, but also to provide detailed information on local variations not documented in the initial data.
To assess the effectiveness of the maintenance, detailed time-domain analyses were conducted on the sections highlighted in Figure 7, corresponding to Sections A, B, C, and D, which were the focus of the maintenance. The analyses were carried out after verifying the homogeneity of the selected sections, in accordance with the criteria defined in the report title “European Cooperation in the Field of Scientific and Technical Research—COST 336—Use of Falling Weight Deflectometers (FWD) in Pavement Evaluation” [54].
The trends of the IRI daily indicator for each section are shown in Figure 8, using averaged values over a 25 m base, as provided by the Floating Car Data.
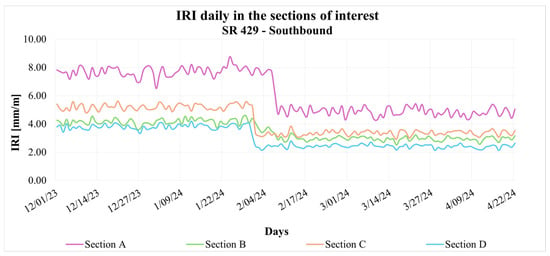
Figure 8.
Trend of the IRI daily in the sections of interest during the analysis period—SR 429 Southbound.
The data analysis reveals a significant reduction in IRI in all the sections considered, with an average decrease of around 50% of the index during the week in which the maintenance was carried out. To confirm that this reduction is significant, a statistical t-test between before and after rehabilitation data was conducted, given a p-value < 0.05, supporting the observed improvement in surface regularity.
However, as highlighted in Section A, the post-rehabilitation IRI values remain relatively high, suggesting that some residual roughness or underlying issues may persist. Irregularities can result both from the type of maintenance and from poor-quality workmanship or uneven laying surfaces, occurring in either the longitudinal or transverse direction. This aspect will be further investigated as part of future analyses.
At this preliminary stage, no definitive considerations can be made regarding the absolute value of the indicator, because the value is not fully representative of actual conditions due to two main factors: the limited calculation base (25 m) used for averaging and the need to define a scaling factor that allows for a proper comparison with the IRI parameter calculated using high-performance methodologies.
Section A has a more pronounced initial IRI, that after maintenance reaches a value around 5 mm/m, higher than mean values accepted by road authorities in many developed countries; it suggests that interventions on severely deteriorated sections may require stronger and wider maintenance strategies [22].
To gain further insight into the evolution of roughness in the sections of interest, the long term IRI file was processed.
In Figure 9, a smoothing of the IRI curve peaks can be observed in the analyzed sections. This effect is due to the application of the Kalman filter over a 14-day interval, hence the name IRI long term, which introduces a lag in reaching the after-rehabilitation IRI value compared to the instantaneous value recorded, shown in the graph in Figure 8.
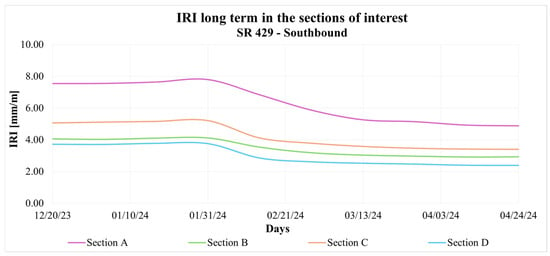
Figure 9.
Trend of IRI long term in the sections of interest during the analysis period—SR 429 Southbound.
For an accurate evaluation of the data collected on SR 429, a comparison between NIRA data and data acquired using standard instrumentation was conducted, focusing on the measurements performed on the survey day. This approach aims to identify similarities and differences between the two detection techniques, with the goal of establishing a correlation between the data obtained from NIRA and those recognized as valid by technical standards.
The results of the Ride Quality (RQ) Analysis, performed using a 100 m measurement base, allowed for the determination of the IRI trend for each measurement alignment, as shown in Figure 10.
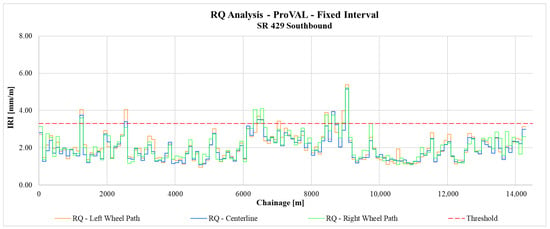
Figure 10.
IRI trend obtained with RQ Fixed Interval every 100 m—SR 429 Southbound.
To perform the RQ Analysis with the ProVAL [51] software, it was necessary to define the threshold value for the IRI, derived from the conversion of PSI limit value obtained following the procedure described in Section 2.
According to “Catalogo delle Pavimentazioni Stradali” [46], the SR 429 is classified as a Category 4, for which is established a PSI limit value of 2.5, as indicated in Table 2. This value was converted using Equation (1), and the average IRI value, calculated using the various methodologies reported in the literature (Table 1), was found to be 3.30 mm/m.
Figure 11 shows the comparison between the IRI for the Left Wheel Path (in orange) obtained from the RQ—Fixed Interval analysis and the NIRA data (in red), both calculated using a 100 m measurement base for the southbound direction. The coefficient of determination obtained from the linear regression of IRI values derived from the Centerline and the Right Wheel Path revealed a significantly lower correlation compared to the one obtained with the Left Wheel Path.
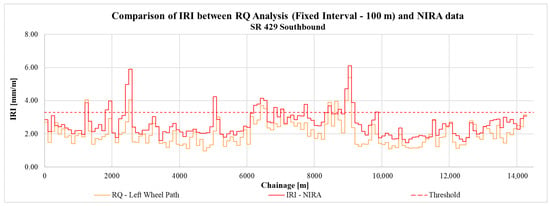
Figure 11.
Comparison of IRI between RQ Fixed Interval (100 m) Left Wheel Path and NIRA Data—SR 429 Southbound.
It can be observed that the peaks of irregularities are spatially aligned, and the trends of the two functions are consistent, indicating that both methodologies detect the same characteristics of the road surface. However, in absolute terms, FCD tend to overestimate the IRI value compared to the one obtained through the Ride Quality Analysis. The data for the Left and Right Wheel Paths, obtained through the RQ Analysis, were averaged to reduce differences in the detection of irregularities, thereby minimizing the deviation between the two datasets, as shown in Figure 12. The graph highlights a good consistency between the two data series, which follow a similar trend. Therefore, the considerations made can also be deemed representative of this case, confirming the reliability of the methodology used.
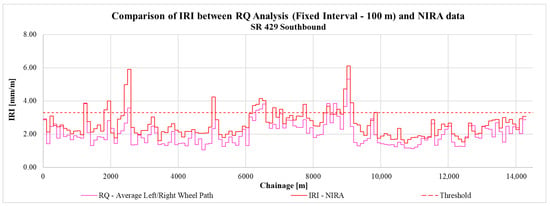
Figure 12.
Comparison of IRI between RQ Fixed Interval (100 m) Average Left/Right and NIRA Data—SR 429 Southbound.
The graph provides an overall view of the road surface quality, highlighting the sections that may require maintenance, especially where the IRI exceeds the critical threshold of 3.30 mm/m. Subsequently, a correlation analysis was conducted using linear regression to assess the equivalence of the data (Figure 13 and Figure 14).
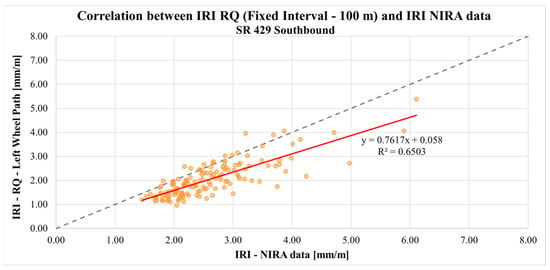
Figure 13.
Correlation between IRI from RQ Fixed Interval (100 m) Left Wheel Path and IRI from NIRA Data—SR 429 Southbound.
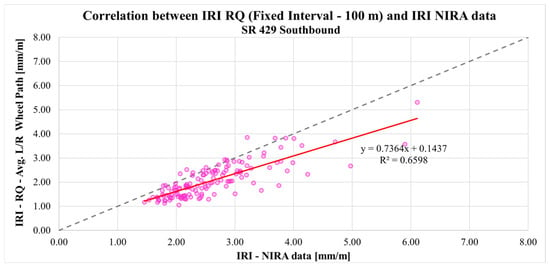
Figure 14.
Correlation between IRI from RQ Fixed Interval (100 m) Avg L/R Wheel Path and IRI from NIRA data—SR 429 Southbound.
Figure 14 confirms a better fit for the NIRA data, achieving a higher coefficient of determination (R2 = 0.66 and p < 0.05) compared to other paths. This better fit is attributed to the fact that averaging left and right wheel paths reduces the influence of local irregularities, and also to the fact that most distresses are located along the wheel paths, whereas the central parts of the road are generally less damaged since they are not directly subjected to wheel loads. It is also due to the algorithm behind the NIRA data, which accounts for the constantly varying trajectories of all floating vehicles, effectively smoothing out individual path irregularities. The correlation was also evaluated individually for the right wheel path and the centerline profile, but lower R2 values were observed, whose reliability is nonetheless verified due to a p-value lower than 0.05.
Considering that the number of vehicle passages during the day considered for the comparison is low, authors included data from 14 days before the measurement date, as it is well known that IRI values do not vary significantly from one day to the next. In Figure 15 is shown the linear regression made with the new set of NIRA data, from which can be observed that, using more days, and consequently more vehicle passages, the coefficient of determination obtained is higher than the previous case.
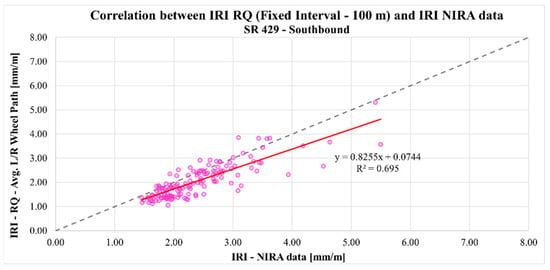
Figure 15.
New correlation between IRI from RQ Fixed Interval (100 m) Avg L/R Wheel Path and IRI from NIRA data (14 days)—SR 429 Southbound.
Also in this case, the reliability of the correlation obtained through linear regression was verified by determining the p-value associated with the slope coefficient of the regression line, which results in a value lower than 0.05.
Figure 15 is, therefore, used as a reference for subsequent analyses, which are valid for all paths and for both travel directions of SR 429. A positive correlation is observed between the NIRA data and the data obtained from MFV surveys, with a coefficient of determination of approximately 0.69. This value quantifies the quality of fleet data for use in network-level screening, but it is not sufficient to be used as an absolute indicator.
The obtained R2 values do not allow us to conclude that the procedure is fully reproducible, that is, as a complete agreement of absolute values under different conditions. However, the approach exhibits a trend-based reproducibility, demonstrating its ability to capture patterns consistent with the reference measurements and suggesting that, with more accurate data, it could yield comparable and more stable results.
3.2. Case of SGC FI-PI-LI
The same analyses were also replicated for the SGC Firenze–Pisa–Livorno, to verify whether the regularity information provided by the FCD can be used for network-level screening on roads with multiple lanes per direction. In this context, it is important to say that the recorded data is aggregated across all lanes within the same travel direction, without distinguishing individual lane trajectories.
Figure 16 shows the IRI trend in the homogeneous section between Montelupo Fiorentino and Empoli Est, using a spatial interval of 25 m and averaging the values over two observation periods: before rehabilitation (from 1 May 2024, to 12 May 2024) and after rehabilitation (from 17 May 2024, to 28 May 2024).
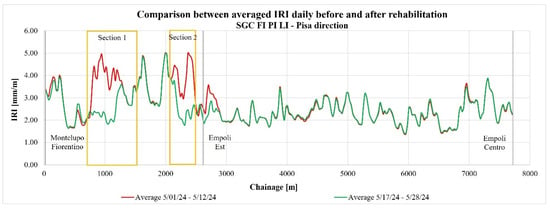
Figure 16.
Comparison between averaged IRI before and after rehabilitation periods—SGC FI-PI-LI Pisa Direction.
The fleet data clearly reflects maintenance effects in Section 1 and Section 2, where a significant improvement in regularity parameters can be observed. In contrast, in the sections that have not been rehabilitated, the data remains substantially stable.
The time-domain analysis highlights a rapid and consistent reduction in the IRI indicator, with values decreasing by up to 50% from the initial value. This unequivocally confirms the effectiveness of the maintenance and the improvement in pavement quality in the treated sections.
The graph in Figure 17 shows the daily evolution of IRI for Section 1 and Section 2, confirming a clear reduction for the indicator at the end of April 2024 corresponding to the period in which maintenance works were performed. This drop indicates a significant improvement in surface roughness, confirming the effectiveness of the maintenance intervention.
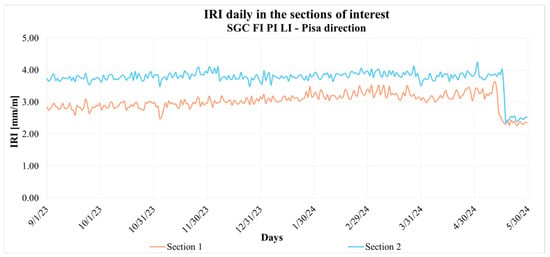
Figure 17.
Trend of the IRI daily in the sections of interest—SGC FI-PI-LI Pisa Direction.
At this preliminary stage, no definitive considerations can be made regarding the absolute value of the indicator, because the initial calculation was based on a limited averaging length of only 25 m, which did not adequately reflect actual conditions. To improve representativeness and reliability, the averaging base has been extended to 100 m. Additionally, it remains necessary to define a suitable scaling factor to ensure consistency with the IRI parameter derived from high-performance methodologies.
The results of the RQ Analysis, performed using a 100 m measurement base, enabled the identification of the IRI trend for each measurement alignment, as shown in Figure 18.
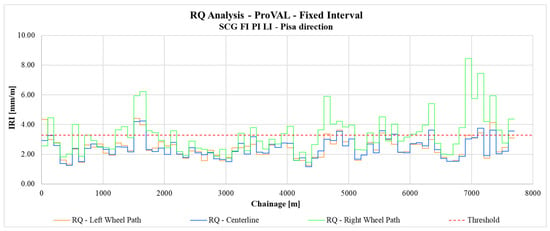
Figure 18.
IRI trend obtained with RQ Fixed Interval every 100 m—SGC FI-PI-LI Pisa Direction.
Figure 19 illustrates the comparison between NIRA data, aggregated according to the number of lanes in each direction, and the survey conducted on the right lane using a 100 m calculation base. It is observed that Floating Car Data reproduce the peaks of irregularities with lower precision compared to the case of the SR 429. This result is expected since that type of data is averaged across the two lanes, leading to a smoothing effect on localized irregularities. The coefficient of determination obtained from the linear regression of IRI values derived from the Centerline and the Right Wheel Path revealed a significantly lower correlation compared to that obtained with the Left Wheel Path. This outcome is consistent with the configuration of a two-lane road per direction, where the left alignment of the survey performed on the right lane most closely approximates the average IRI value produced by the NIRA algorithm, which aggregates data from the varying trajectories of floating vehicles.
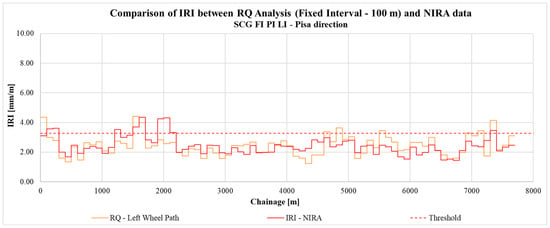
Figure 19.
Comparison between IRI from RQ Fixed Interval (100 m) Left Wheel Path and NIRA Data—SGC FI-PI-LI Pisa Direction.
Despite this difference, the values obtained from the two methods are overall comparable, suggesting that, despite some discrepancies, both methodologies can provide useful information to assess pavement quality. This comparison highlights the ability of FCD to effectively detect the main characteristics of the road surface, although with a lower resolution compared to standard measurement methods.
In Figure 20, a linear regression analysis was conducted between the two datasets, revealing relatively low values of the coefficient of determination (R2 = 0.35 and p < 0.05) [53].
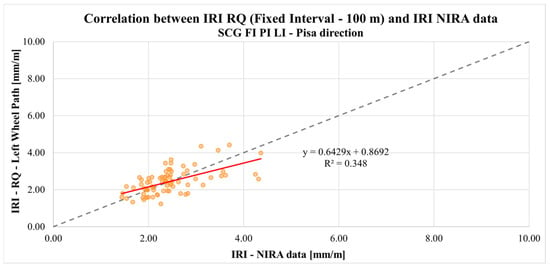
Figure 20.
Correlation between IRI from RQ Fixed Interval (100 m) Left Wheel Path and IRI from NIRA Data—SGC FI-PI-LI Pisa Direction.
This result indicates that, despite the correlation between the two data series, further calibrations are needed to achieve a more precise and accurate description of the observed phenomenon. One possible reason for the relatively low coefficient of determination lies in the fact that vehicle localization does not account for the specific lane on which the data were recorded. It is likely that vehicles from the NIRA fleet, such as those from Volkswagen, tend to travel in the fast lane—especially on roads like the FI-PI-LI—while the MFV surveys were conducted exclusively in the slow lane. This mismatch may lead to comparisons between data collected on different lanes, which can have significantly different pavement conditions.
The correlation was also evaluated individually for the right wheel path and the centerline profile, but lower R2 values were observed, whose reliability is nonetheless verified due to a p-value lower than 0.05.
Given the low number of vehicle passages recorded on the day selected for the comparison, the authors decided to include data from 14 days period before to the measurement date. This choice is justified by the well-established stability of IRI values over short time intervals. Figure 21 presents the linear regression obtained using the expanded NIRA dataset, showing that the inclusion of additional days—and therefore a greater number of vehicle passages—results in a higher coefficient of determination (R2 = 0.41) compared to the previous case.
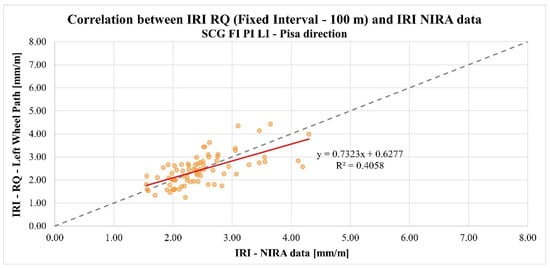
Figure 21.
New correlation between IRI from RQ Fixed Interval (100 m) Left Wheel Path and IRI from NIRA Data (14 days)—SGC FI-PI-LI Pisa Direction.
Also in this case, the reliability of the correlation obtained through linear regression was confirmed by evaluating the p-value of the slope coefficient, which was found to be lower than 0.05.
However, although the coefficient of determination is not optimal, both data series are still able to reliably detect the spatial and temporal trend of the parameter of interest. This suggests that, despite the limitations in individual measurements, the data provided is still useful for a macroscopic network-level analysis.
The study demonstrates the potential of Floating Car Data (FCD) for pavement roughness monitoring, showing good consistency on single-lane roads, where the data reliably represent actual surface conditions. On multi-lane rural roads, however, accuracy decreases due to lane aggregation effects, since NIRA Dynamics provided an averaged value for the entire road section in a given direction rather than for individual lanes. Despite these limitations, the information obtained can be used for the overall assessment of pavement roughness on a large scale, significantly contributing to road quality monitoring and supporting decision-making for a more accurate maintenance planning of the road network.
3.3. Practical and Scientific Implications
The analyses conducted on roughness data confirmed a significant correlation between the datasets collected using the two measurement methods. The daily aggregation of NIRA data enables high-precision monitoring of the temporal trend of the International Roughness Index, quickly identifying sections that exceed the critical threshold. This makes NIRA data particularly useful for road infrastructure monitoring, as it allows for the prompt identification of areas requiring maintenance.
An additional advantage of NIRA data is the ability to monitor pavement maintenance, as it can precisely identify the sections and periods when such works were carried out. Although NIRA data are reliable, the comparison with data collected via the MFV method highlighted that FCD recordings are particularly dependable for single-lane roads.
For the sections analyzed along the SGC FI-PI-LI, NIRA provided IRI values aggregated across all lanes in the same travel direction. However, standard surveys using the MFV method were conducted exclusively on the right lane. This misalignment between the aggregation of the NIRA data and the lane-specific nature of the MFV measurements prevents a direct comparison of the values. As a result, the analysis on the FIPILI should be considered indicative rather than conclusive. Conversely, on the SR 429—where the road consists of a single lane per direction—the correspondence between the two data sources is stronger. Given this context, the lower correlation observed on the SGC FI-PI-LI was expected and highlights the importance of lane configuration in such comparisons.
The effect of vehicle speed was not explicitly considered in this study, as speed information was not available in the analyzed dataset. The Floating Car Data provided by NIRA Dynamics included only acceleration-based roughness indicators, aggregated over fixed spatial segments, without the corresponding speed records. As a result, it was not possible to assess the sensitivity of the IRI conversion coefficient to variations in speed.
Despite these limitations, monitoring multi-lane roads remains essential, as it provides a broader understanding of overall pavement conditions. Future research should develop a model as a critical step toward eliminating current systematic biases and achieving absolute measurements.
This study allowed us to state that leveraging crowdsourced data for pavement monitoring enables more effective intervention scheduling, improves resource allocation, and reduces maintenance costs; this approach also facilitates the identification of high-priority sections, ensuring targeted and timely maintenance, an outcome also achieved by Ceriani et al. (2025) [22].
For these reasons, data collected from connected vehicles can serve as a valuable support tool for pavement management systems (PMS), which are defined by the American Association of State Highway and Transportation Officials (AASHTO) as “a set of tools or methods that assist decision-makers in finding optimum strategies for providing, evaluating, and maintaining pavements in a serviceable condition over a period of time” [40].
4. Conclusions
The main objective of this research was to preliminarily assess the reliability of Floating Car Data (FCD) collected from Volkswagen Group vehicles starting in 2022. Although these data are originally gathered for purposes related to vehicle dynamics and mechanical performance, this study explores their potential for a different application: the development of a simple, fast, and efficient operational methodology for targeted road network screening. This approach enables the identification of specific network sections requiring maintenance, thereby optimizing the use of available resources.
Results obtained from this study reflect the influence of factors such as vehicle dynamics, speed, and operational conditions of the vehicle on roughness measurements, as reported in the studies by G. Loprencipe et al. [55]. These factors tend to overestimate road irregularities detected through FCD compared to those measured using MFV instrumentation: the same distress is perceived differently depending on the travel speed. Taking these considerations into account, it would be possible to develop a model that enables the translation of measurements from one survey method to another.
It is essential to analyze these results as a starting point, which can be further optimized through proper calibrations in the comparison between the two roughness assessment models. The development of a calibration algorithm for fleet data would allow for both a relative evaluation (based on temporal evolution) and an absolute and predictive assessment. This approach would enable the development of more accurate performance decay models that have to take into account variables like weather conditions [56], traffic volumes, and pavement aging [57].
The analysis conducted on the SGC FI-PI-LI, a divided carriageway road with two lanes in each direction, aimed to evaluate the effectiveness of the NIRA method in contexts with such infrastructural characteristics.
The results confirmed the lower reliability of NIRA data for multi-lane roads, as standard tests were conducted exclusively on the rightmost lane.
This limitation specifically applies to multi-lane highways, where NIRA aggregates data across the entire carriageway rather than by lane. As a result, lane-specific variations in pavement condition are not captured, which limits the ability to accurately represent the actual state of the road section. Future developments should therefore aim to separate FCD by lane to improve spatial resolution and ensure a more detailed assessment of pavement performance.
The data collected through Floating Car Data (FCD) proved highly reliable and demonstrated significant utility for network-level analyses, particularly when considered in relative terms. This approach enables monitoring of fluctuations related to pavement maintenance, even for superficial rehabilitation. However, in absolute terms, the data requires further analysis to be calibrated for 100 m measurement sections, to achieve a more accurate representation comparable to values obtained from standardized tests using high-performance profilometric instruments. Once the measurement base has been fixed, it will be necessary to develop a model capable of estimating true IRI values from NIRA data to construct reliable pavement decay curves.
A distinctive and particularly advantageous feature of FCD is their capacity to provide daily updated data. This capability not only facilitates monitoring of the current state of the road network but also allows for timely corrective maintenance and the development of predictive models to optimize long-term maintenance planning.
Future research should aim to combine FCD with complementary data sources to enhance the predictive capability of pavement performance models. In particular, integrating FCD with Weigh-in-Motion (WIM) traffic load data could provide valuable insights into pavement deterioration mechanisms. As heavy vehicles represent a major contributor to pavement distress, this integration would support a more comprehensive and predictive approach to road asset management, enabling the development of models that better forecast performance and optimize maintenance strategies [55,58,59].
Author Contributions
Conceptualization, C.M., C.C., A.M., A.P. and M.M.; methodology, C.M., C.C. and M.M.; software, C.M. and C.C.; validation, A.P., M.M. and A.M.; formal analysis, A.P. and M.M.; investigation, C.M. and C.C.; resources, A.M.; data curation, C.M. and C.C.; writing—original draft preparation, C.M. and C.C.; writing—review and editing, C.M., C.C., A.P. and M.M.; visualization, C.M. and C.C.; supervision, A.P., M.M. and A.M.; project administration, M.M. and A.M.; funding acquisition. All authors have read and agreed to the published version of the manuscript.
Funding
This research received no external funding.
Institutional Review Board Statement
Not applicable.
Informed Consent Statement
Not applicable.
Data Availability Statement
Restrictions apply to the availability of these data. Data were obtained from NIRA Dynamics and are available from the authors only with the permission of NIRA Dynamics.
Conflicts of Interest
The authors declare no conflict of interest.
Abbreviations
The following abbreviations are used in this manuscript:
| AASHTO | American Association of State Highway and Transportation Officials |
| ADT | Average Daily Traffic |
| CANBUS | Controller Area Network Bus |
| CPSO-XGBoost | Center Particle Swarm Optimization-XGBoost |
| DMI | Distance Measuring Instrument |
| FCD | Floating Car Data |
| FHWA | Federal Highway Administration |
| FWD | Falling Weight Deflectometer |
| GIS | Geographical Information System |
| IRI | International Roughness Index |
| LCMS | Laser Crack Measurement System |
| MFV | Multi-Functional Vehicle |
| OEM | Original Equipment Manufacturer |
| PIARC | Permanent International Association of Road Congresses |
| PMS | Pavement Management System |
| PSI | Present Serviceability Index |
| RIOHTrack | Research Institute of Highway Track |
| RN | Ride Number |
| RQ | Ride Quality |
| RSP | Road surface profilometer |
| RTRRMS | Response Type Road Roughness Measuring System |
| SGC FI-PI-LI | Strada Grande Comunicazione Firenze–Pisa–Livorno |
| SR 429 | Strada Regionale 429 |
| V2X | Vehicle to everything |
References
- Creswell, J.W. Research Design: Qualitative, Quantitative, and Mixed Methods Approaches; Sage: Los Angeles, CA, USA, 2009; ISBN 9781412965576. [Google Scholar]
- Coenen, T.B.J.; Golroo, A. A Review on Automated Pavement Distress Detection Methods. Cogent Eng. 2017, 4, 1374822. [Google Scholar] [CrossRef]
- Queiroz, C.; Gautam, S. Road Infrastructure and Economic Development: Some Diagnostic Indicators. Policy Res. Work. Pap. Ser. 1992. Available online: https://documents.worldbank.org/en/publication/documents-reports/documentdetail/383071468739248249/road-infrastructure-and-economic-development-some-diagnostic-indicators (accessed on 18 April 2024).
- Pirolo, L. Analisi del Fenomeno dei Big Data supervisor: Luca Pirolo Candidate: Davide Signori. Bachelor’s Thesis, Luiss Guido Carli, Roma, Italy, 2015. [Google Scholar]
- Manyika, J.; Chui, M.; Brown, B.; Bughin, J.; Dobbs, R.; Roxburgh, C.; Byers, A.H. Big Data: The next Frontier for Innovation, Competition, and Productivity; McKinsey & Company: New York, NY, USA, 2011. [Google Scholar]
- Chang, J.-R.; Hung, C.-T.; Tseng, P.-J. Preliminary Study on the Long-Term Pavement Performance (LTPP) Program Under the Big Data Concept. Available online: http://www.see.eng.osaka-u.ac.jp/seeit/icccbe2016/Proceedings/Full_Papers/235-379.pdf (accessed on 23 May 2024).
- El-Wakeel, A.S.; Li, J.; Noureldin, A.; Hassanein, H.S.; Zorba, N. Towards a Practical Crowdsensing System for Road Surface Conditions Monitoring. IEEE Internet Things J. 2018, 5, 4672–4685. [Google Scholar] [CrossRef]
- Bridgelall, R. Precision Bounds of Pavement Distress Localization with Connected Vehicle Sensors. J. Infrastruct. Syst. 2014, 21, 04014045. [Google Scholar] [CrossRef]
- Ambros, J.; Jurewicz, C.; Chevalier, A.; Valentová, V. Speed-Related Surrogate Measures of Road Safety Based on Floating Car Data. Lect. Notes Netw. Syst. 2021, 207, 129–144. [Google Scholar] [CrossRef]
- Jurewicz, C.; Espada, I.; Makwasha, T.; Han, C.; Alawi, H.; Ambros, J. Validation and Applicability of Floating Car Speed Data for Road Safety. In Proceedings of the 2017 Australasian Road Safety Conference, Perth, Australia, 10–12 October 2017. [Google Scholar]
- Houbraken, M.; Audenaert, P.; Colle, D.; Pickavet, M.; Scheerlinck, K.; Yperman, I.; Logghe, S. Real-Time Traffic Monitoring by Fusing Floating Car Data with Stationary Detector Data. In Proceedings of the 2015 International Conference on Models and Technologies for Intelligent Transportation Systems, MT-ITS 2015, Budapest, Hungary, 3–5 June 2015; pp. 127–131. [Google Scholar] [CrossRef]
- Mahlberg, J.A.; Li, H.; Zachrisson, B.; Mathew, J.K.; Bullock, D.M. Applications of Using Connected Vehicle Data for Pavement Quality Analysis. Front. Future Transp. 2024, 4, 1239744. [Google Scholar] [CrossRef]
- NIRA Dynamics. NIRA Dynamics—The Next Level of Mobility. Available online: https://www.niradynamics.com/ (accessed on 12 April 2024).
- Laubis, K.; Simko, V.; Schuller, A.; Weinhardt, C. Road Condition Estimation Based on Heterogeneous Extended Floating Car Data. In Proceedings of the Hawaii International Conference on System Sciences, Waikoloa Village, HI, USA, 4–7 January 2017. [Google Scholar]
- France-Mensah, J.; O’Brien, W.J. Budget Allocation Models for Pavement Maintenance and Rehabilitation: Comparative Case Study. J. Manag. Eng. 2018, 34, 05018002. [Google Scholar] [CrossRef]
- Kilpeläinen, P.; Jaakkola, M.; Alanaatu, P. Development of a Control System for a Multipurpose Road Repairing Machine. Autom. Constr. 2011, 20, 662–668. [Google Scholar] [CrossRef]
- Fernández-Caballero, A.; Gómez, F.J.; López-López, J. Road-Traffic Monitoring by Knowledge-Driven Static and Dynamic Image Analysis. Expert. Syst. Appl. 2008, 35, 701–719. [Google Scholar] [CrossRef]
- Smart Pavement Monitoring System; Report No. FHWA-HRT-12-072; Federal Highway Administration: Washington, DC, USA, 2013.
- Chuang, T.Y.; Perng, N.H.; Han, J.Y. Pavement Performance Monitoring and Anomaly Recognition Based on Crowdsourcing Spatiotemporal Data. Autom. Constr. 2019, 106, 102882. [Google Scholar] [CrossRef]
- Kropáč, O.; Múčka, P. Be Careful When Using the International Roughness Index as an Indicator of Road Unevenness. J. Sound. Vib. 2005, 287, 989–1003. [Google Scholar] [CrossRef]
- Issa, A.; Samaneh, H.; Ghanim, M. Predicting Pavement Condition Index Using Artificial Neural Networks Approach. Ain Shams Eng. J. 2022, 13, 101490. [Google Scholar] [CrossRef]
- Ceriani, R.; Vignali, V.; Chiola, D.; Pazzini, M.; Pettinari, M.; Lantieri, C. Exploring the Effectiveness of Road Maintenance Interventions on IRI Value Using Crowdsourced Connected Vehicle Data. Sensors 2025, 25, 3091. [Google Scholar] [CrossRef] [PubMed]
- Siverio, S.; Szozda, B.; Ponzoni, M.; Barabino, B.; Maternini, G. Integrating Floating Car Data in a Pavement Management System: Some Empirical Evidence from Brescia (Italy). Transp. Res. Procedia 2025, 90, 480–487. [Google Scholar] [CrossRef]
- Anas S.p.A. I Quaderni Tecnici per La Salvaguardia Delle Infrastrutture. 2019. Available online: https://www.stradeanas.it/sites/default/files/comunicazione/doc/Quaderni_Tecnici_Volume_5.pdf (accessed on 30 October 2025).
- Expérience Internationale AIPCR de Comparaison et D’harmonisation des Mesures D’adhérence et de Texture; Association Internationale Permanente des Congres de la Route: Paris, France, 1995; ISBN 8487825966.
- Plati, C.; Gkyrtis, K.; Loizos, A. A Practice-Based Approach to Diagnose Pavement Roughness Problems. Int. J. Civil. Eng. 2024, 22, 453–465. [Google Scholar] [CrossRef]
- ISO 13473-2; Characterization of Pavement Texture by Use of Surface Profiles-Terminology and Basic Requirements Related to Pavement Texture Profile Analysis. ISO: Geneva, Switzerland, 2002.
- ENAC-Ente Nazionale per L’aviazione Civile Airport Pavement Management System-Linee Guida Sulla Implementazione del Sistema di Gestione Della Manutenzione Delle Pavimentazioni; Ente Nazionale per l’Aviazione Civile: Rome, Italy, 2015; Volume 3.
- ISO 13473-3; Characterization of Pavement Texture by Use of Surface Profiles-Specifications and Classifications of Profilometers. ISO: Geneva, Switzerland, 1997.
- Li, Z.X.; Shi, X.L.; Cao, J.D.; Wang, X.D.; Huang, W. CPSO-XGBoost Segmented Regression Model for Asphalt Pavement Deflection Basin Area Prediction. Sci. China Technol. Sci. 2022, 65, 1470–1481. [Google Scholar] [CrossRef]
- Li, Z.; Korovin, I.; Shi, X.; Gorbachev, S.; Gorbacheva, N.; Huang, W.; Cao, J. A Data-Driven Rutting Depth Short-Time Prediction Model with Metaheuristic Optimization for Asphalt Pavements Based on RIOHTrack. IEEE/CAA J. Autom. Sin. 2023, 10, 1918–1932. [Google Scholar] [CrossRef]
- Mahlberg, J.A.; Li, H.; Zachrisson, B.; Leslie, D.K.; Bullock, D.M. Pavement Quality Evaluation Using Connected Vehicle Data. Sensors 2022, 22, 9109. [Google Scholar] [CrossRef] [PubMed]
- Sayers, M.W.; Gillespie, T.D.; Queiroz, C.A.V. The International Road Roughness Experiment: Establishing Correlation and a Calibration Standard for Measurements; University of Michigan: Ann Arbor, MI, USA, 1986; p. 453. [Google Scholar]
- Alonso Solórzano, Á.; Acebo, H.P.; Unamunzaga, A.L.; Orden, H.G. Probabilistic International Roughness Index (IRI) Prediction Model for a Climate Homogeneous Region. Transp. Res. Procedia 2023, 71, 46–52. [Google Scholar] [CrossRef]
- Barzegaran, J.; Shahni Dezfoulian, R.; Fakhri, M. Estimation of IRI from PASER Using ANN Based on K-Means and Fuzzy c-Means Clustering Techniques: A Case Study. Int. J. Pavement Eng. 2022, 23, 5153–5167. [Google Scholar] [CrossRef]
- Karamihas, S.M.; Sayers, M.W. The Little Book of Profiling, Second Edition, Basic Information about Measuring and Interpreting Road Profiles; UMTRI-2025-4; UMTRI: Ann Arbor, MI, USA, 2025. [Google Scholar] [CrossRef]
- ASTM E1170−97; Standard Practice for Simulating Vehicular Response to Longitudinal Profiles of Traveled Surfaces. ASTM: West Conshohocken, PA, USA, 2023.
- Múčka, P. Road Roughness Limit Values Based on Measured Vehicle Vibration. J. Infrastruct. Syst. 2016, 23, 04016029. [Google Scholar] [CrossRef]
- Vangi, D.; Rivano, V. Ricostruzione Della Dinamica Degli Incidenti Stradali: L’ambito Giuridico, La Strada, Il Conducente e Il Veicolo; Firenze University Press: Firenze, Italy, 2002. [Google Scholar]
- AASHTO Guide for Design of Pavement Structures: 1993; American Association of State Highway and Transportation Officials: Washington, DC, USA, 1986; ISBN 1560510552.
- Paterson, W.D.O. Relationship of the International Roughness Index to Other Measures of Roughness and Riding Quality; Transportation Research Record, No. 1084; Transportation Research Board: Washington, DC, USA, 1986; Available online: https://onlinepubs.trb.org/Onlinepubs/trr/1986/1084/1084-007.pdf (accessed on 30 October 2025).
- Al-Omari, B.; Darter, M.I. Relationship Between IRI and PSR. In Transportation Research Record 1435; National Academy Press: Cambridge, MA, USA, 1994. [Google Scholar]
- Livneh, M.; Ravina, A.; Nesichi, S. Deriving California-Type Profilograph Outputs from RSP Roughness Measurements. In Proceedings of the 9th International Symposium on Concrete Roads, Istanbul, Turkey, 27–30 May 2003; PIARC: Istanbul, Turkey, 2003. [Google Scholar]
- Baladi, G.Y.; Novak, E.C., Jr.; Kuo, W.H. Pavement Condition Index-Remaining Service Life. In Pavement Management Implementation; ASTM STP 1121; Holt, F.B., Gramling, W.L., Eds.; American Society for Testing and Materials: Philadelphia, PA, USA, 1992. [Google Scholar]
- FHWA, Federal Highways Administration. Appendix J: Roughness Equipment, Calibration and Data Collection; FHWA, Federal Highways Administration: Washington, DC, USA, 1993.
- Fondazione Politecnica per il Mezzogiorno d’Italia. Catalogo Delle Pavimentazioni Stradali-CNR B.U. 178/1995; Ministero dei Lavori Pubblici Ispettorato Generale per la Circolazione e la Sicurezza Strad: Roma, Italy, 1995.
- World Bank HDM-4 Road Use Costs Model Version 2.00 (Documentation); World Bank Group: Washington, DC, USA, 2010.
- QGIS Develompent Teams. QGIS, version 3.36.3; QGIS.ORG: Gossau, Switzerland, 2002.
- ASTM E950; Standard Test Method for Measuring the Longitudinal Profile of Traveled Surfaces with an Accelerometer-Established Intertial Profiling Reference. ASTM: West Conshohocken, PA, USA, 2018.
- Dynatest-Multi Fucntional Vehicle (MFV). Available online: https://dynatest.com/equipment/multi-functional-vehicle/ (accessed on 10 September 2024).
- The Transtec Group, Inc. ProVAL-Version 4.0.60.0. Available online: https://apps.microsoft.com/detail/9pg2t0bpbgj0?rtc=1&hl=it-it&gl=IT,%202022 (accessed on 23 October 2025).
- Ludbrook, J. Linear Regression Analysis for Comparing Two Measurers or Methods of Measurement: But Which Regression? Clin. Exp. Pharmacol. Physiol. 2010, 37, 692–699. [Google Scholar] [CrossRef]
- Ministero delle Infrastrutture e dei Trasporti Norme Funzionali e Geometriche per La Costruzione Delle Strade (DM 05.11.2001); Ministero dei Lavori Pubblici Ispettorato Generale per la Circolazione e la Sicurezza Strad: Roma, Italy, 2001.
- European Commission-Directorate general Transport Cost Action 336. In Use of Falling Weight Deflectometers in Pavement Evaluation; European Commission: Brussels, Belgium, 2005.
- Loprencipe, G.; Zoccali, P.; Cantisani, G. Effects of Vehicular Speed on the Assessment of Pavement Road Roughness. Appl. Sci. 2019, 9, 1783. [Google Scholar] [CrossRef]
- Abohassan, A.; El-Basyouny, K.; Kwon, T.J. Exploring the Associations between Winter Maintenance Operations, Weather Variables, Surface Condition, and Road Safety: A Path Analysis Approach. Accid. Anal. Prev. 2021, 163, 106448. [Google Scholar] [CrossRef] [PubMed]
- Al-Suleiman, T.I.; Sinha, K.C.; Riverson, J.D. Effects of Pavement Age and Traffic on Maintenance Effectiveness. J. Transp. Eng. 1991, 117, 644–659. [Google Scholar] [CrossRef]
- Sujon, M.; Dai, F. Application of Weigh-in-Motion Technologies for Pavement and Bridge Response Monitoring: State-of-the-Art Review. Autom. Constr. 2021, 130, 103844. [Google Scholar] [CrossRef]
- Ventura, R.; Maternini, G.; Barabino, B. Traffic Hazards on Main Road’s Bridges: Real-Time Estimating and Managing the Overload Risk. IEEE Trans. Intell. Transp. Syst. 2024, 25, 12239–12255. [Google Scholar] [CrossRef]
Disclaimer/Publisher’s Note: The statements, opinions and data contained in all publications are solely those of the individual author(s) and contributor(s) and not of MDPI and/or the editor(s). MDPI and/or the editor(s) disclaim responsibility for any injury to people or property resulting from any ideas, methods, instructions or products referred to in the content. |
© 2025 by the authors. Licensee MDPI, Basel, Switzerland. This article is an open access article distributed under the terms and conditions of the Creative Commons Attribution (CC BY) license (https://creativecommons.org/licenses/by/4.0/).