


Abstract
Lithium(Li)-rich pegmatites are an important source of Li for the energy transition, but their detection using remote sensing data/techniques remains challenging due to subpixel occurrence. This study presents an integrated prospectivity mapping framework combining hyperspectral PRISMA data, multispectral Sentinel-2 imagery, and a fuzzy logic overlay to improve the detection of Li-rich pegmatites in the Barroso–Alvão pegmatite field (Northern Portugal). Hyperspectral processing was performed using Mixture Tuned Matched Filtering (MTMF) targeting alteration minerals associated with Li mineralization, while multispectral classification was conducted using supervised machine learning algorithms. Among the tested models, the Support Vector Machine (SVM) achieved the best generalization performance. The integration of hyperspectral mineralogical information with multispectral spatial consistency successfully identified known pegmatite occurrences and improved prospectivity mapping in complex subpixel occurrences. The proposed methodology is transferable to other regions and particularly suitable for greenfield mineral exploration.
1. Introduction
The growing demand for critical raw materials required for the energy transition has reinforced the need for Europe to increase its autonomy in the supply of strategic minerals, particularly lithium. Lithium-bearing pegmatites represent an important source of this resource, making their detection and mapping economically and strategically relevant to Europe’s technological and industrial development [1,2,3,4]. Remote sensing offers an efficient means of supporting regional mineral exploration; however, pegmatite detection remains challenging because individual bodies are often smaller than the spatial resolution of satellite sensors. Hyperspectral sensors provide high spectral resolution but generally have limited spatial resolution, whereas multispectral sensors such as Sentinel-2 offer finer spatial detail but lower spectral discrimination. Integrating these complementary datasets may therefore help overcome the limitations associated with using either sensor type independently.
The Barroso–Alvão aplite–pegmatite field, located within the Variscan geological domain of northern Portugal, contains hundreds of Li-bearing pegmatite bodies hosted mainly by Silurian parautochthonous metasedimentary units of the Galicia–Trás-os-Montes Zone. Lithium mineralisation is hosted primarily by spodumene and petalite, whereas Sn, Nb and Ta are mainly associated with cassiterite and columbite-group minerals. Most natural pegmatite outcrops are less than 10 m wide, although the largest exposed outcrops may reach approximately 20 m and form discontinuous alignments extending for nearly 100 m. Some occur as prominent fresh-rock outcrops, whereas others are exposed as strongly weathered, white, clay-rich surfaces. Their detection is further constrained by mountainous terrain, limited accessibility and dense vegetation [5]. Previous studies have demonstrated the potential of multispectral classification and hyperspectral unmixing for pegmatite exploration [6,7,8,9,10,11,12]. Specifically, Cardoso-Fernandes et al. [13] investigated multispectral band ratios and selective principal component analysis for Li-bearing pegmatite detection, while Cardoso-Fernandes et al. [14] developed a Sentinel-2 SVM classification workflow for the Fregeneda–Almendra region. At finer observational scales, Booysen et al. [15] demonstrated hyperspectral mapping of Li-bearing minerals in samples and outcrops at Uis, Namibia. Moving towards integrated prospectivity assessment, Santos et al. [16] combined multispectral MTMF and LightGBM outputs with LiDAR-derived structural information through fuzzy logic in Tysfjord, Norway. Despite these advances, the detection of subpixel Li-bearing pegmatites and the transferability of models across geographically distinct geological settings remain important challenges [5]. Building on these contributions, the present study investigates the decision-level integration of Sentinel-2 machine learning classification and PRISMA hyperspectral subpixel detection results in Barroso–Alvão, alongside a training strategy incorporating geographically diverse pegmatite provinces. Its specific contribution lies in evaluating this complementary satellite configuration and training strategy for detecting small Li-bearing pegmatites.
These characteristics, together with the extensive geological and mineralogical knowledge available for the region, make Barroso–Alvão an appropriate test area for developing and evaluating an integrated and potentially transferable pegmatite-mapping methodology. Accordingly, this study investigates whether the complementary spatial and spectral information provided by Sentinel-2 and PRISMA can improve the detection of subpixel Li-bearing pegmatites, and whether geographically diverse training data can increase the robustness of multispectral classification across different geological settings. We hypothesize that decision-level fusion of multispectral machine learning classification and hyperspectral spectral unmixing results can produce a more reliable mineral prospectivity map than either approach used independently. Sentinel-2 data were processed using Support Vector Machine [17,18], Random Forest [19] and eXtreme Gradient Boosting models [20], with band ratios and principal components used as input features. The training dataset incorporated pegmatite and host-lithology information from Li-pegmatite provinces in Africa, North America, South America and Europe to improve model generalization. PRISMA data were processed using Mixture Tuned Matched Filtering, with reference spectra selected through spectral analysis of the INOVMINERAL and USGS spectral libraries. The Sentinel-2 and PRISMA outputs were subsequently standardized using fuzzy membership functions and integrated at the decision level through fuzzy overlay to generate a mineral prospectivity map. Developed within the MineSpot project (COMPETE2030-FEDER-02302900), this approach seeks to improve the detection of small and partially obscured pegmatite occurrences and support more efficient lithium exploration in poorly exposed and geologically complex regions.
2. Geological Setting
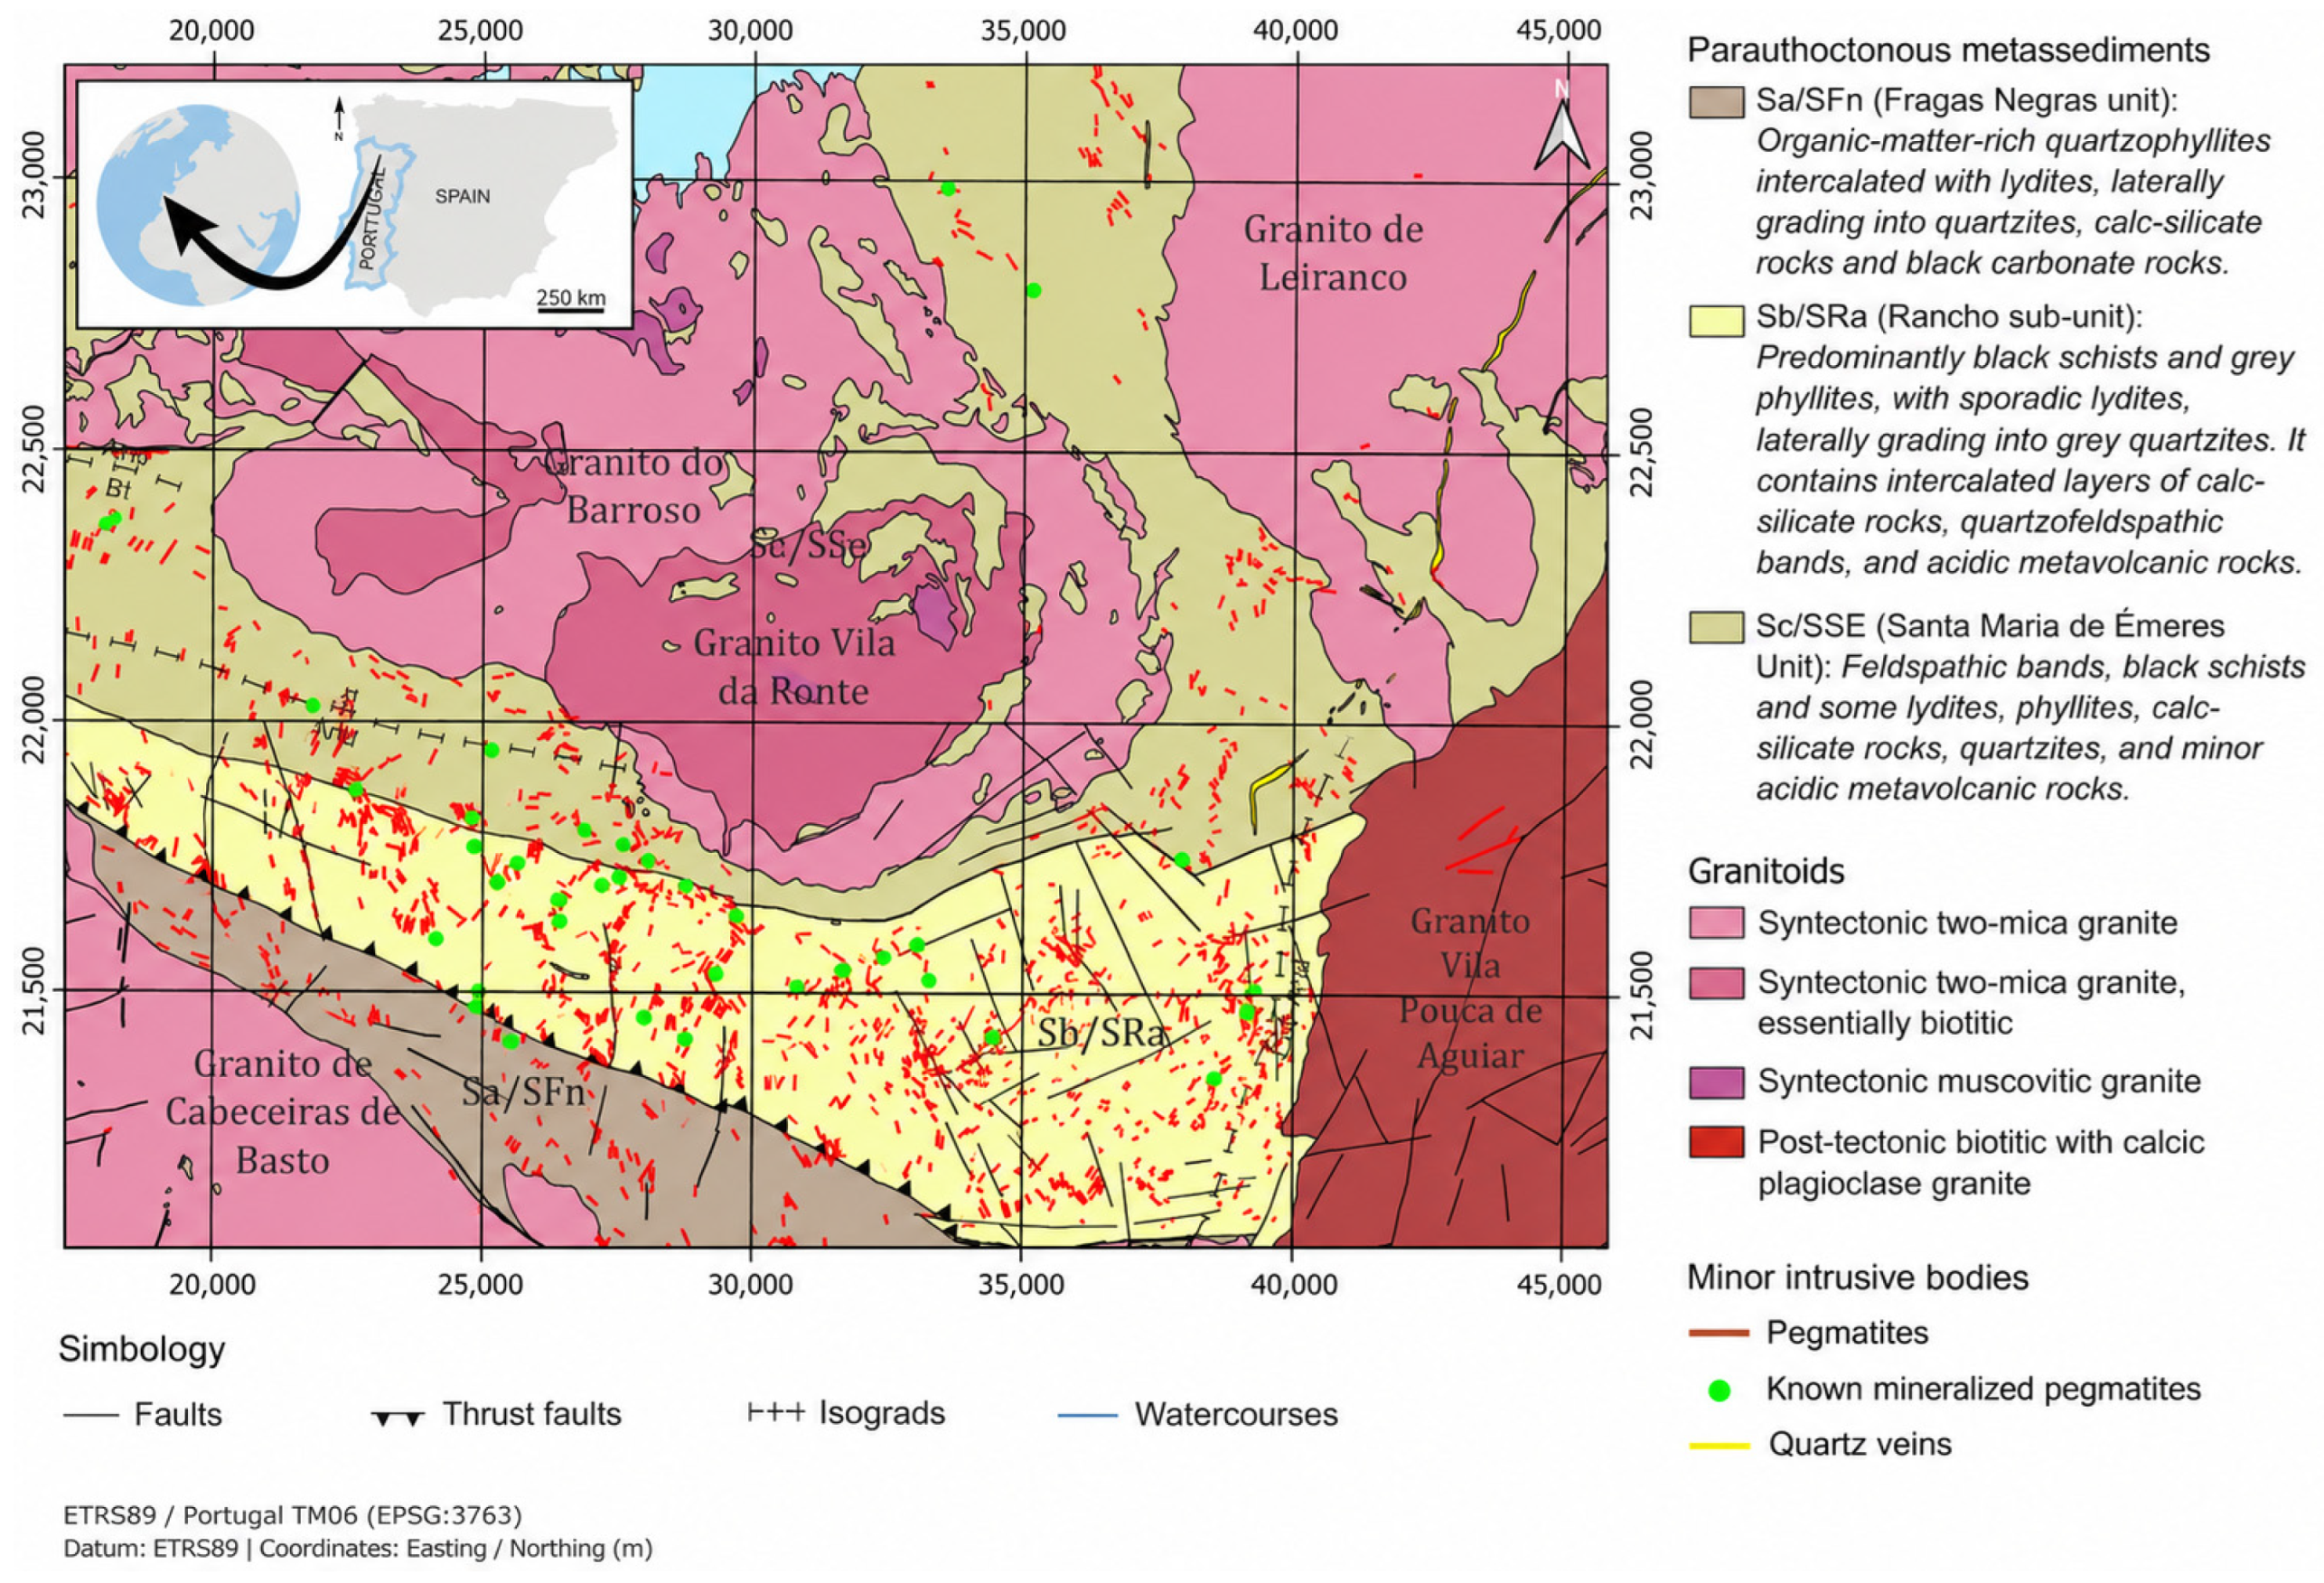
The Barroso–Alvão aplite–pegmatite field (Figure 1) developed in the context of the Variscan Orogeny (Early Devonian to Late Carboniferous) within the parautochthonous Galicia–Trás-os-Montes Zone (ZGTM). It comprises Silurian metasedimentary rocks intruded by Variscan orogenic and post-orogenic granites. Although both metasedimentary and granitic rocks occur throughout the field, Li pegmatites are exclusively hosted by the metasedimentary sequence, whereas pegmatites emplaced within the granitic units are Li barren. During the Variscan orogeny, the collision between the continents of Laurussia and Gondwana led to the thrusting of Gondwana margin terranes over the autochthonous terrains of the same continent. The autochthonous part of the Iberian Peninsula is referred to as the Central Iberian Zone (CIZ), while the parautochthonous domain is designated as the Galicia–Trás-os-Montes Zone (ZGTM) [19,20,21].
The metasedimentary sequence comprises the Sa/SFn, Sb/SRa, and Sc/SSE units [21,22]. Structurally, the Sc/SSE unit is thrust over the Sb/SRa unit, which in turn overlies the Sa/SFn unit. These units were deposited along the Gondwana margin and record a compositional evolution from more reducing to more oxidizing conditions.
The Sa/SFn unit is dominated by lydites and organic-matter–rich quartzophyllites and hosts only a small number of Li pegmatites. In contrast, Li pegmatites are significantly more abundant in the Sb/SRa and Sc/SSE units, which are characterized by phyllites and quartz–feldspathic lithologies, locally associated with calc-silicate rocks. Despite their abundance, not all of these bodies are Li-mineralized (Figure 1). These bodies, referred to here as pegmatites for simplicity, are more accurately described as aplite–pegmatites, as they display internal structures characterized by alternating aplitic and pegmatitic zones [23].
Figure 1.
Geological map of the Barroso–Alvão pegmatite field, compiled and adapted from the Geological Map of Portugal at a scale of 1:50,000 [21,24]; the Geological Map of Spain and Portugal at a scale of 1:1,000,000, © Instituto Geológico y Minero de España (IGME) and © Laboratório Nacional de Energia e Geologia (LNEG) [25], and the geological setting of the Barroso–Alvão pegmatite field presented by Dias et al., 2025 [5]. Hydrographic data © Agência Portuguesa do Ambiente (APA) [26].
2.1. Characteristics of the Li-Bearing Pegmatites
Among the Li-mineralized pegmatites, spodumene and petalite are the dominant Li-bearing minerals, although their relative abundances vary considerably between pegmatite bodies. Other Li-bearing minerals, including montebrasite and eucryptite, occur in much smaller amounts and are only identifiable under the microscope [27,28,29]. Cookeite, a Li-bearing chlorite, is also present and can be readily observed in hand specimens. It is interpreted as a late hydrothermal alteration mineral associated with spodumene. In addition, the pegmatites have undergone supergene alteration, predominantly of meteoric origin, resulting in the formation of secondary minerals, including clay minerals of the montmorillonite and illite groups and phosphate minerals such as phosphoferrite, dufrenite, and fairfieldite [29].
In the Barroso–Alvão aplite–pegmatite field, a few Li-rich pegmatites are already being exploited for the ceramics and glass industry, further demonstrating the economic relevance of these mineralized bodies in the region. Examples include the Alijó pegmatite, where spodumene is the dominant Li-bearing mineral, and the Lousas pegmatites, which are characterized by petalite-dominant mineralization [5].
Pegmatites in the Barroso–Alvão field occur as in situ outcrops (Figure 2). In the mountainous terrain of the study area, bedrock is generally well exposed wherever it is not concealed by vegetation. Consequently, metasedimentary rocks, granites, and pegmatites are commonly exposed at the surface. The greater resistance of pegmatites to weathering relative to the surrounding metasedimentary rocks commonly results in small positive-relief outcrops. Continuous bedrock exposure rarely exceeds 200 m and, in many areas, dense vegetation further obscures these outcrops, reducing their visible extent to less than 10–20 m of continuous exposure. In the Barroso–Alvão region, the main limitation to bedrock exposure is not soil or superficial deposits but dense vegetation dominated by pine forests and shrub communities, particularly broom (Cytisus spp.), gorse (Ulex spp.), and brambles (Rubus spp.). Firebreaks and road cuts, therefore, provide valuable additional exposures where excavation has intersected pegmatite bodies.
Figure 2.
Field photographs of an in situ spodumene-rich pegmatite in the Barroso–Alvão aplite–pegmatite field. (A) Natural outcrops partially covered by pine trees, moss, and lichens. (B) Spodumene crystals visible on the outcrops.
2.2. Mineralogical and Geochemical Characterization of the District
The Barroso–Alvão aplite–pegmatite field has been the subject of extensive geological, petrographic, mineralogical, and geochemical investigations over the past decades through numerous academic studies, including investigations carried out by the Portuguese Geological Survey (then known as the Instituto Geológico e Mineiro, IGM) [27,28,30,31,32]. Among these studies, Charoy et al. (1992) [28] carried out petrographic and mineralogical investigations of several Barroso–Alvão pegmatites, complemented by whole-rock geochemical analyses using ICP spectrometry and classical wet-chemical techniques, together with chemical analyses of separated spodumene crystals. Lima (2000) [29] subsequently conducted detailed petrographic investigations and whole-rock geochemical analyses of the Veral, Adagói, and Alijó spodumene-bearing pegmatites, the latter being located within the present study area. K-feldspar, quartz, spodumene, and muscovite were described as the main mineral phases, whereas montebrasite, triphylite, fluorapatite, dufrenite, phosphoferrite, fairfieldite, tourmaline, eucryptite, illite, montmorillonite, chlorite, cookeite, and sulphides were reported as accessory phases. Whole-rock geochemistry was determined using ICP-OES, ICP-MS, XRF, and classical chemical analyses.
Martins (2009) [27] complemented the existing mineralogical framework through petrographic investigations of petalite-rich pegmatites, in which petalite, Na-rich plagioclase, quartz, K-feldspar, and muscovite constitute the main mineral phases. Accessory and trace minerals include montebrasite, spodumene, fluorapatite, cassiterite, columbite–tantalite, eucryptite, cookeite, ferrisicklerite, beryl, Fe- and Mn-oxides, zinnwaldite, montmorillonite, pyrite, zircon, monazite, uraninite, sphalerite, bastnäsite, eosphorite, thorite, and löllingite. Martins (2009) [27] also performed electron microprobe (EPMA) analyses of feldspars, micas, and phosphate minerals, together with trace-element analyses of muscovite and K-feldspar using direct-coupled plasma (DCP) spectrometry.
Dias (2025) [5] further expanded the mineralogical and geochemical characterization of the district through more petrographic investigations and mineral geochemistry, including ICP-MS analyses of individual spodumene, petalite, and K-feldspar crystals from numerous barren and Li-mineralized pegmatites, together with in situ LA-ICP-MS analyses of individual spodumene and cookeite crystals.
Collectively, these investigations provide a comprehensive geological, petrographic, mineralogical, and geochemical characterization of the Barroso–Alvão aplite–pegmatite field, independently confirming the Li-bearing nature of the pegmatites investigated in the present study.
3. Data
The spectral reference data used in this work were obtained from the INOVMineral Spectral Library, ref. [33] and the USGS Spectral Library (version 7) [34]. Spectra from the INOVMINERAL spectral library were analyzed to identify the minerals most representative of the study area. Reference spectra for the identified minerals were then selected from the USGS spectral library. Table 1 lists the reference spectra tested in the hyperspectral unmixing workflow.
Table 1.
USGS spectral library reference spectra tested in the hyperspectral unmixing processing.
All multispectral data were acquired and processed using an automated workflow implemented in Python 3.11.14, leveraging open-source libraries such as xarray, rioxarray, and geopandas for geospatial data handling, raster processing, and numerical computation. Sentinel-2 imagery was obtained as Level-2A surface reflectance products from the Sentinel-2 L2A collection available through the Microsoft Planetary Computer. A total of 13 training zones, covered by multiple Sentinel-2 scenes, were used to increase the spatial and spectral diversity of the training dataset. As Level-2A products already include atmospheric correction, no additional atmospheric correction was applied.
The Sentinel-2 bands with a native spatial resolution of 20 m, including B11 and B12, were resampled to a common 10 m spatial grid during the data loading process using the resampling method implemented by the ODC-STAC workflow.
PRISMA hyperspectral data were obtained from the Italian Space Agency (ASI) data portal (https://prisma.asi.it/ accessed on 15 November 2025). The PRISMA image was censored on 14 November 2023. The image was obtained at level L2D, already provided in bottom-of-atmosphere (BOA) surface reflectance. This image was selected because it was the most suitable acquisition available in the mission catalogue, considering cloud cover, vegetation conditions, and data quality. Although the PRISMA and Sentinel-2 images were acquired under different seasonal illumination conditions, both products provide BOA surface reflectance rather than raw digital numbers, reducing the influence of atmospheric conditions and acquisition geometry and improving their radiometric comparability.
Sentinel-2 MSI data were selected due to their relatively high spatial resolution among open-access optical satellite sensors, with 10 m resolution in the VNIR bands and 20 m resolution in the SWIR bands. Hyperspectral PRISMA satellite data were selected due to their high spectral resolution (239 bands) and the availability of images in the mission’s data catalogue. The images were selected based on minimal vegetation cover and low cloud cover.
The PRISMA L2D product is orthorectified and atmospherically corrected, but it does not include radiometric topographic correction, unlike the Sentinel-2 L2A product, which is processed with Sen2Cor. Because the study area is located in a mountainous region, surface reflectance may be affected by illumination effects. However, to ensure the reproducibility of this work, we opted to use the L2D product as distributed.
4. Methodology
The methodology was divided into hyperspectral and multispectral image processing. Multispectral instruments (MSIs) acquire Earth observation data in a limited number of relatively broad and discrete spectral bands, whereas hyperspectral instruments (HSIs) acquire data in hundreds of narrow, contiguous spectral bands, providing high spectral resolution.
This approach allows us to leverage the high spectral resolution of PRISMA and the moderate spatial resolution of Sentinel-2, thereby exploiting the strengths of each satellite.
Mineral identification is strongly dependent on the spectral resolution of the sensor [35], as most minerals exhibit diagnostic absorption features only 20–40 nm wide, requiring narrow, contiguous spectral bands for reliable discrimination [36]. Consequently, hyperspectral satellites are better suited for mineral identification. However, their lower spatial resolution (pixel size of 30 m) may limit the detection of small pegmatites because of spectral mixing within mixed pixels.
Therefore, the proposed methodology combines the complementary strengths of both datasets: Sentinel-2 provides the spatial delineation of pegmatite bodies, whereas PRISMA provides mineralogical evidence through the detection of alteration minerals associated with lithium-bearing pegmatites [37].
The step-by-step processing methodology is illustrated in Figure 3. The processing of the PRISMA hyperspectral image starts with the co-registration using the Sentinel-2 image as the geometric reference to ensure spatial alignment between the two datasets. Following co-registration, spectral unmixing algorithms were applied to reduce subpixel effects [6,36]. Subpixel occurrence arises when the pixel size is significantly larger than the target of interest, resulting in a mixed spectral signature composed of contributions from all materials within the pixel [37,38]. This is a recurrent challenge in remote sensing applied to pegmatite exploration and is also observed in the Barroso–Alvão region, where pegmatite bodies are typically small. The applied spectral unmixing method was MTMF (ENVI software version 6.0).
Figure 3.
Step-by-step of the methodology applied in this work.
Although spectral unmixing can also be applied to multispectral imagery, it is widely reported that these methods achieve better performance with hyperspectral data [38]. For this reason, a supervised classification approach based on machine learning algorithms was applied. Three different models were tested: the SVM, XGBoost, and RF.
To minimize spatial inconsistencies between sensors, the PRISMA data were processed at their native 30 m spatial resolution, and only the final MTMF outputs were resampled to the 10 m Sentinel-2 grid using the nearest-neighbour method before fuzzy integration. This approach preserved the original MTMF output values without introducing interpolated values. Consequently, the fuzzy overlay and the final mineral prospectivity map were generated with a 10 m pixel size, while the effective spatial information provided by PRISMA remained consistent with its native 30 m resolution [39].
4.1. Hyperspectral Image Processing
The PRISMA image was processed using spectral unmixing techniques. The proposed workflow includes co-registration, spectral analysis of rock samples, data reduction using Minimum Noise Fraction (MNF) transformation, selection of reference spectra identified during the spectral analysis stage, and abundance mapping using the MTMF algorithm (Figure 3).
4.1.1. Image Co-Registration
Co-registration was performed using the Image Registration Workflow available in ENVI. This tool geometrically aligns two images acquired under different viewing geometries and/or affected by different terrain-induced distortions, placing them in the same coordinate system so that corresponding pixels represent the same ground features. The workflow requires a base image and a warp image, while a digital elevation model (DEM) can be provided to improve the initial prediction of corresponding positions, particularly in areas with topographic variation. The tool then automatically generates tie points, which are used to align and resample the warp image.
The cross-correlation method was selected for tie point matching because it is particularly suitable for registering images acquired by sensors of similar modalities. The rotation, scaling, and translation (RST) model was used for geometric warping, while nearest-neighbour resampling was applied to the PRISMA data. The RST model limits the geometric transformation to rotation, scaling, and translation, thereby minimizing unnecessary deformation of the image. Nearest-neighbour resampling assigns the value of the closest original pixel to each output pixel without generating interpolated spectral values. This combination was selected to preserve the original spectral values while minimizing alterations to the spatial structure of the PRISMA data.
A total of 22 tie points were initially generated. Points with residual errors greater than one pixel were subsequently removed. The final transformation was calculated using 14 tie points and produced an RMS error of 0.4066 pixels.
Table 2 presents the 14 final tie points. BASEX and BASEY represent the pixel coordinates in the Sentinel-2 reference image, whereas WARPX and WARPY represent the corresponding pixel coordinates in the PRISMA image. SCORE indicates the quality of the automatically generated match, and ERROR represents the residual error associated with each tie point, expressed in pixels.
Table 2.
Tie points used to co-register the PRISMA image with the Sentinel-2 reference image.
4.1.2. Spectral Analysis
Spectral analysis examines how electromagnetic energy interacts with matter. In mineral materials, these interactions are mainly controlled by electronic and vibrational mechanisms [40]. In reflectance spectroscopy, the analysis focuses on wavelengths where reflectance is reduced, which correspond to diagnostic absorption features. Minerals can be distinguished based on the depth, width, and spectral position of their absorption features [40,41,42].
In this study, spectra from the INOVMINERAL spectral library were used for spectral analysis. This library comprises 47 spectra acquired from rock samples collected from the Aldeia spodumene-rich pegmatite, located in the Barroso–Alvão aplite–pegmatite field [33]. The spectra were acquired using an ASD FieldSpec 4 spectroradiometer, a portable, battery-operated instrument covering the spectral range of 350–2500 nm [33].
Spectral analysis was used to identify the most representative alteration minerals in these samples and assess their potential as indicators of pegmatite occurrences in the study area. Continuum removal was applied during spectral interpretation to highlight diagnostic absorption features and facilitate mineral identification and comparison. This procedure normalized each spectrum relative to its continuum, setting the continuum to unity and allowing absorption positions, relative depths, and shapes to be compared more clearly [43].
Spectra from both the USGS and INOVMINERAL libraries were tested as reference spectra for MTMF processing of the PRISMA imagery (Table 1). Before processing, the original reflectance spectra were resampled using the PRISMA spectral response functions to account for the sensor’s band centres and bandwidths. This step approximated how the reference spectra would be sampled by PRISMA and enabled their comparison with the image spectra on a common spectral basis.
Among the spectra tested, the USGS reference spectra Montmorillonite SCa-2.a and Cookeite CAr-1.b yielded the most favourable mapping results for montmorillonite and cookeite, respectively. Their selection was based on a qualitative assessment of spatial correspondence with known pegmatite occurrences and the lower level of apparent noise in the resulting MTMF maps.
4.1.3. Spectral Unmixing
Spectral unmixing is a mathematical method used to separate a complex, mixed spectrum into its pure components, which are called endmembers, and to determine their abundance [44,45]. There are several methods for spectral unmixing; in this work, we used the MTMF.
The MTMF algorithm combines two complementary outputs: the Matched Filtering (MF) score and the infeasibility metric. The MF score indicates the relative response of each pixel to the reference endmember, with higher values representing greater spectral similarity to the target [46]. However, a high MF score alone does not necessarily indicate a physically plausible target occurrence, because spectrally anomalous pixels or noise may also produce strong responses. The infeasibility metric evaluates whether the MF response is statistically consistent with a realistic mixture of the target and background materials, considering the noise and background variability in the transformed data. Consequently, pixels displaying high MF scores and low infeasibility values are interpreted as the most reliable target candidates, whereas high MF scores associated with high infeasibility values are more likely to represent false positives [46].
The workflow involves four main steps: (1) Spectral analysis of spectra obtained from rock samples. In this step, the most relevant indicator minerals for identifying mineralized pegmatites are selected; (2) spectral data reduction, where MNF separates the signal from noise and selects the most informative components for further processing, thereby reducing both noise and computational requirements; (3) abundance mapping, where spectral unmixing is performed using the MTMF algorithm; and (4) post-classification rules, where we apply thresholds to control false positives/negatives.
The main advantage of using external reference spectra is that they provide reference spectral signatures with known and well-defined mineralogical identities. This facilitates the attribution of mapped spectral responses to specific minerals and, consequently, improves the interpretability of the results.
However, due to variations in illumination, atmospheric conditions, sensor characteristics, and surface properties, this method is still subject to the effects of Spectral Mixture Analysis-Induced Linearity Error (SMILE) and the Signal-to-Noise Ratio (SNR) of the satellites [47,48].
4.2. Multispectral Image Processing
4.2.1. Machine Learning Classification
Three supervised classifiers were trained and evaluated: a Support Vector Machine (SVM) with a Radial Basis Function (RBF) kernel, an eXtreme Gradient Boosting ensemble (XGBoost), and a Random Forest (RF).
The SVM finds the optimal hyperplane maximizing the margin between classes, using the RBF kernel to handle the non-linear separability typical of spectral data [49].
XGBoost and RF are both tree ensemble methods but differ in their learning strategy: XGBoost builds trees sequentially, each correcting the residual errors of the previous [20], while RF trains trees independently in parallel and combines them by majority vote [50].
The SVM was capable of mapping Lithium–Cesium–Tantalum (LCT) and NYF pegmatites [51] across different environments and achieved better performance compared to ensemble tree-based classifiers [51,52,53].
4.2.2. Inputs Selection
Input features were derived from Sentinel-2 Level-2A imagery acquired over multiple geographically independent regions across Africa, North America, South America, and Europe, including Namibia, Brazil and Portugal, selected to represent a range of Li pegmatite assemblages. Prior to feature extraction, a BRDF normalization step was applied to each scene to reduce the radiometric variability introduced by differences in solar and sensor geometry across acquisition dates and geographic locations, following the c-factor method of Roy et al. [50] and the reference angle formulation of Claverie et al. [51].
The spectral indices, band ratios, and PCA features were derived from previously published formulations for Li-pegmatite detection [54]. For Sentinel-2, these include the band ratios (BRs) and selective Principal Components Analyses (PCAs).
BR consists of dividing the band with the highest reflectance of the target mineral by the band with the strongest absorption of that mineral in order to enhance specific spectral differences [55,56]. Band ratios (BRs) are among the most widely used image processing techniques for lithological applications [54]. The band ratios applied in this study were B3 (560 nm)/B8 (842 nm) for spodumene and B4 (665 nm)/B12 (2190 nm) for lepidolite and alteration minerals [57]. PCA is a multivariate statistical technique that transforms the original correlated variables into a new set of uncorrelated principal components, ordered according to the amount of variance explained [58]. The method applied is the Crosta Technique, also known as Selective PCA [58]. Instead of using all spectral bands as input to the PCA, only bands that are directly related to the target mineral are selected, specifically those corresponding to its characteristic reflectance and absorption features. The selective principal components calculated in this study were derived from bands 3 and 8, and from bands 2, 3, 8 and 11.
4.2.3. Class Definition and Separability
Seven thematic classes were defined to represent the main lithological units and land cover types present across the training regions: pegmatite, granite, schist, vegetation, water, agricultural land/exposed soil, and urban area. The pegmatite class specifically comprised known Li-mineralized pegmatite bodies, while barren pegmatites were not included in the training samples.
Given that the primary objective of this work is pegmatite detection, a binary classification model was adopted as the final approach. This formulation operates as a One-vs-Others strategy, in which the target class (pegmatite) is directly contrasted against all remaining classes combined into a single non-pegmatite category. By reducing the problem to a binary decision, the model directly optimizes the margin of separation for the specific mineral of interest, avoiding the computation of boundaries between background classes that are irrelevant to the exploration objective. Class imbalance between the pegmatite and non-pegmatite categories was addressed through a geometric synthetic oversampling technique applied to the minority class prior to training, generating artificial samples that preserve the local structure of the original data distribution [59].
4.2.4. Model Creation
All models were trained on the same training dataset comprising 19,713 labelled samples, corresponding to 66.7% of the total labelled dataset (n = 29,570). The training set was balanced using geometric synthetic minority oversampling (G-SMOTE) applied to the pegmatite class. Input features were standardized to zero mean and unit variance prior to training for all three classifiers.
Hyperparameters were selected via grid search with stratified 5-fold cross-validation, maximizing the pegmatite F1-score in the inner loop.
4.2.5. Model Validation
The best models were evaluated using four different metrics for each class (non-pegmatite and pegmatite). The applied metrics were precision, recall, F1-score, and accuracy. These metrics were selected to provide a comprehensive evaluation of the model’s performance, considering both overall accuracy and the balance between false positives and false negatives [58].
Model performance was further assessed through a Leave-One-Zone-Out (LOZO) cross-validation scheme, in which each geographically independent training zone is iteratively withheld and the remaining zones are used for retraining. While the held-out test set quantifies discriminative performance under a matched distribution, the LOZO scheme directly tests geographic generalization by simulating deployment over regions the model has never encountered. The analysis was conducted across five geographically independent zones spanning distinct pegmatite assemblages across multiple continents, namely Africa, North America, South America and Europe. Zone identities are not disclosed for commercial confidentiality reasons.
4.3. Mineral Prospectivity Mapping Through Fuzzy Overlay
Before applying the fuzzy overlay, the PRISMA-derived MTMF output and the Sentinel-2-derived SVM output were independently transformed using fuzzy membership functions. This standardized both products to a common scale ranging from 0 to 1, allowing their subsequent integration at the decision level [60]. Equation (1) presents the fuzzy membership function used in this transformation.
Fuzzy overlay is a multicriteria approach that allows the integration and analysis of multiple spatial datasets (criteria) by assigning each one a degree of membership, representing its relevance to mineral prospectivity [7,61]. This method enables the evaluation of how different criteria interact spatially through fuzzy logic operators [62].
The fuzzy overlay operators are AND, OR, SUM, PRODUCT, and GAMMA, each representing a different model of interaction between criteria [63,64].
- Fuzzy AND: Selects the lowest membership value among the input layers. It is a restrictive operator because all criteria must show high suitability.
- Fuzzy OR: Selects the highest membership value among the input layers. It is a permissive operator because a high value in one criterion can determine the final result.
- Fuzzy PRODUCT: Multiplies the membership values of all input layers. It produces conservative results because a low value in any layer substantially reduces the final membership.
- Fuzzy SUM: Combines the input values by increasing the final membership while keeping it between 0 and 1. It is generally more permissive than Fuzzy PRODUCT.
- Fuzzy GAMMA: Combines Fuzzy SUM and Fuzzy PRODUCT. The gamma parameter controls the balance between their permissive and restrictive behaviours. Values close to 0 produce results similar to Fuzzy PRODUCT, whereas values close to 1 produce results similar to Fuzzy SUM.
In this work, the fuzzy OR operator was applied to ensure that high membership values from any of the input datasets were preserved in the MPM. The value of each pixel in the prospectivity map corresponds to its degree of membership related to the target.
4.4. Field Validation
A single field campaign was conducted in April 2026 to validate part of the results obtained from remote sensing in the surroundings of the Alijó mine. The validation consisted of field verification to check whether pegmatites were present in the target areas. The campaign was carried out by geologists from the MineSpot project with extensive experience in the Barroso region and accustomed to the visual identification of pegmatites [5]. The field observations obtained during the April 2026 campaign were used to assess the performance of the previously trained models in the field and to evaluate their applicability to newly investigated areas.
5. Results
5.1. Spectral Analyses
Only the most representative minerals identified in the samples are presented in this section. The main mineral groups include white mica, smectite-group minerals, and chlorite. In addition, regular chlorite and a Li-chlorite (cookeite) were identified. Although it occurs in lower abundance, cookeite is of particular importance as a late hydrothermal alteration mineral associated with spodumene mineralization. Smectite-group minerals are also considered relevant, although they are not exclusive indicators of Li mineralization.
Figure 4 shows selected spectra illustrating the spectral behaviour of white mica/sericite group minerals. Diagnostic features include a characteristic double absorption feature (~2347 nm and ~2435 nm), a sharp Aluminum–Hydroxyl (Al–OH) absorption, and a distinct OH absorption near ~1409 nm. In addition, a subtle iron-related slope (iron ramp), particularly evident in sample INOV2_3, may indicate the presence of biotite and/or chlorite.
Figure 4.
Spectra selected to exemplify the spectral behaviour of the white mica group in four different samples from a Li-rich pegmatite of the Barroso–Alvão field.
Figure 5 shows a prominent Al–OH absorption feature at ~2198 nm, along with two broad and asymmetric water absorption features at ~1919 nm and ~1411 nm. These features are indicative of smectite-group minerals. The position of the Al–OH absorption suggests an Al-rich smectite (probable montmorillonite).
Figure 5.
Spectra selected to exemplify the spectral behaviour of white mica mixed with montmorillonite in three different samples from a Li-rich pegmatite of the Barroso–Alvão field.
Figure 6 shows a similar Al–OH absorption feature at ~2195 nm and deep, irregular water absorption features at ~1411 nm and ~1912 nm, consistent with smectite-group minerals. Additionally, a secondary absorption feature near ~2359 nm, probably resulting from combination vibrations involving Li–Al–OH and Si–O groups, may indicate the presence of cookeite [63]. The absorption feature at approximately 2359 nm may also be attributed to chlorite. Kamps et al. [64] demonstrated that the position of the ~2359 nm absorption band varies according to the chemical composition of Fe-Mg chlorites, although this relationship was established exclusively for Fe-Mg chlorites and should not be directly extended to Li-rich chlorite (cookeite). Perhaps, Fe-bearing chlorite and biotite commonly exhibit a broad Fe2+-related ramp-like absorption in the VNIR, whereas this feature is generally absent from cookeite spectra [65]. Therefore, interpretation of the complete VNIR-SWIR spectral range provides additional evidence for distinguishing these minerals [40,65].
Figure 6.
Spectra of two samples containing cookeite and montmorillonite from a Li-rich pegmatite of the Barroso–Alvão field.
Sample INOV1_4 most likely represents a mixture dominated by smectite-group minerals, with possible minor contributions from biotite and/or chlorite, as suggested by the Fe2+-related ramp-like absorption. In contrast, INOV4_6 probably represents a mixture of smectite-group minerals and cookeite, supported by the absence of a comparable Fe2+-related VNIR ramp-like absorption. Furthermore, previous mineralogical and geochemical studies conducted on rock samples from the Barroso–Alvão pegmatite field have confirmed the occurrence of cookeite, providing independent evidence that supports its interpretation in the spectral data [5]. Appendix A (Figure A1) presents a comparison of the diagnostic absorption features of Fe-rich chlorite, Mg-rich chlorite, kaolinite, muscovite, montmorillonite, and cookeite.
5.2. Minimum Noise Fraction (MNF)
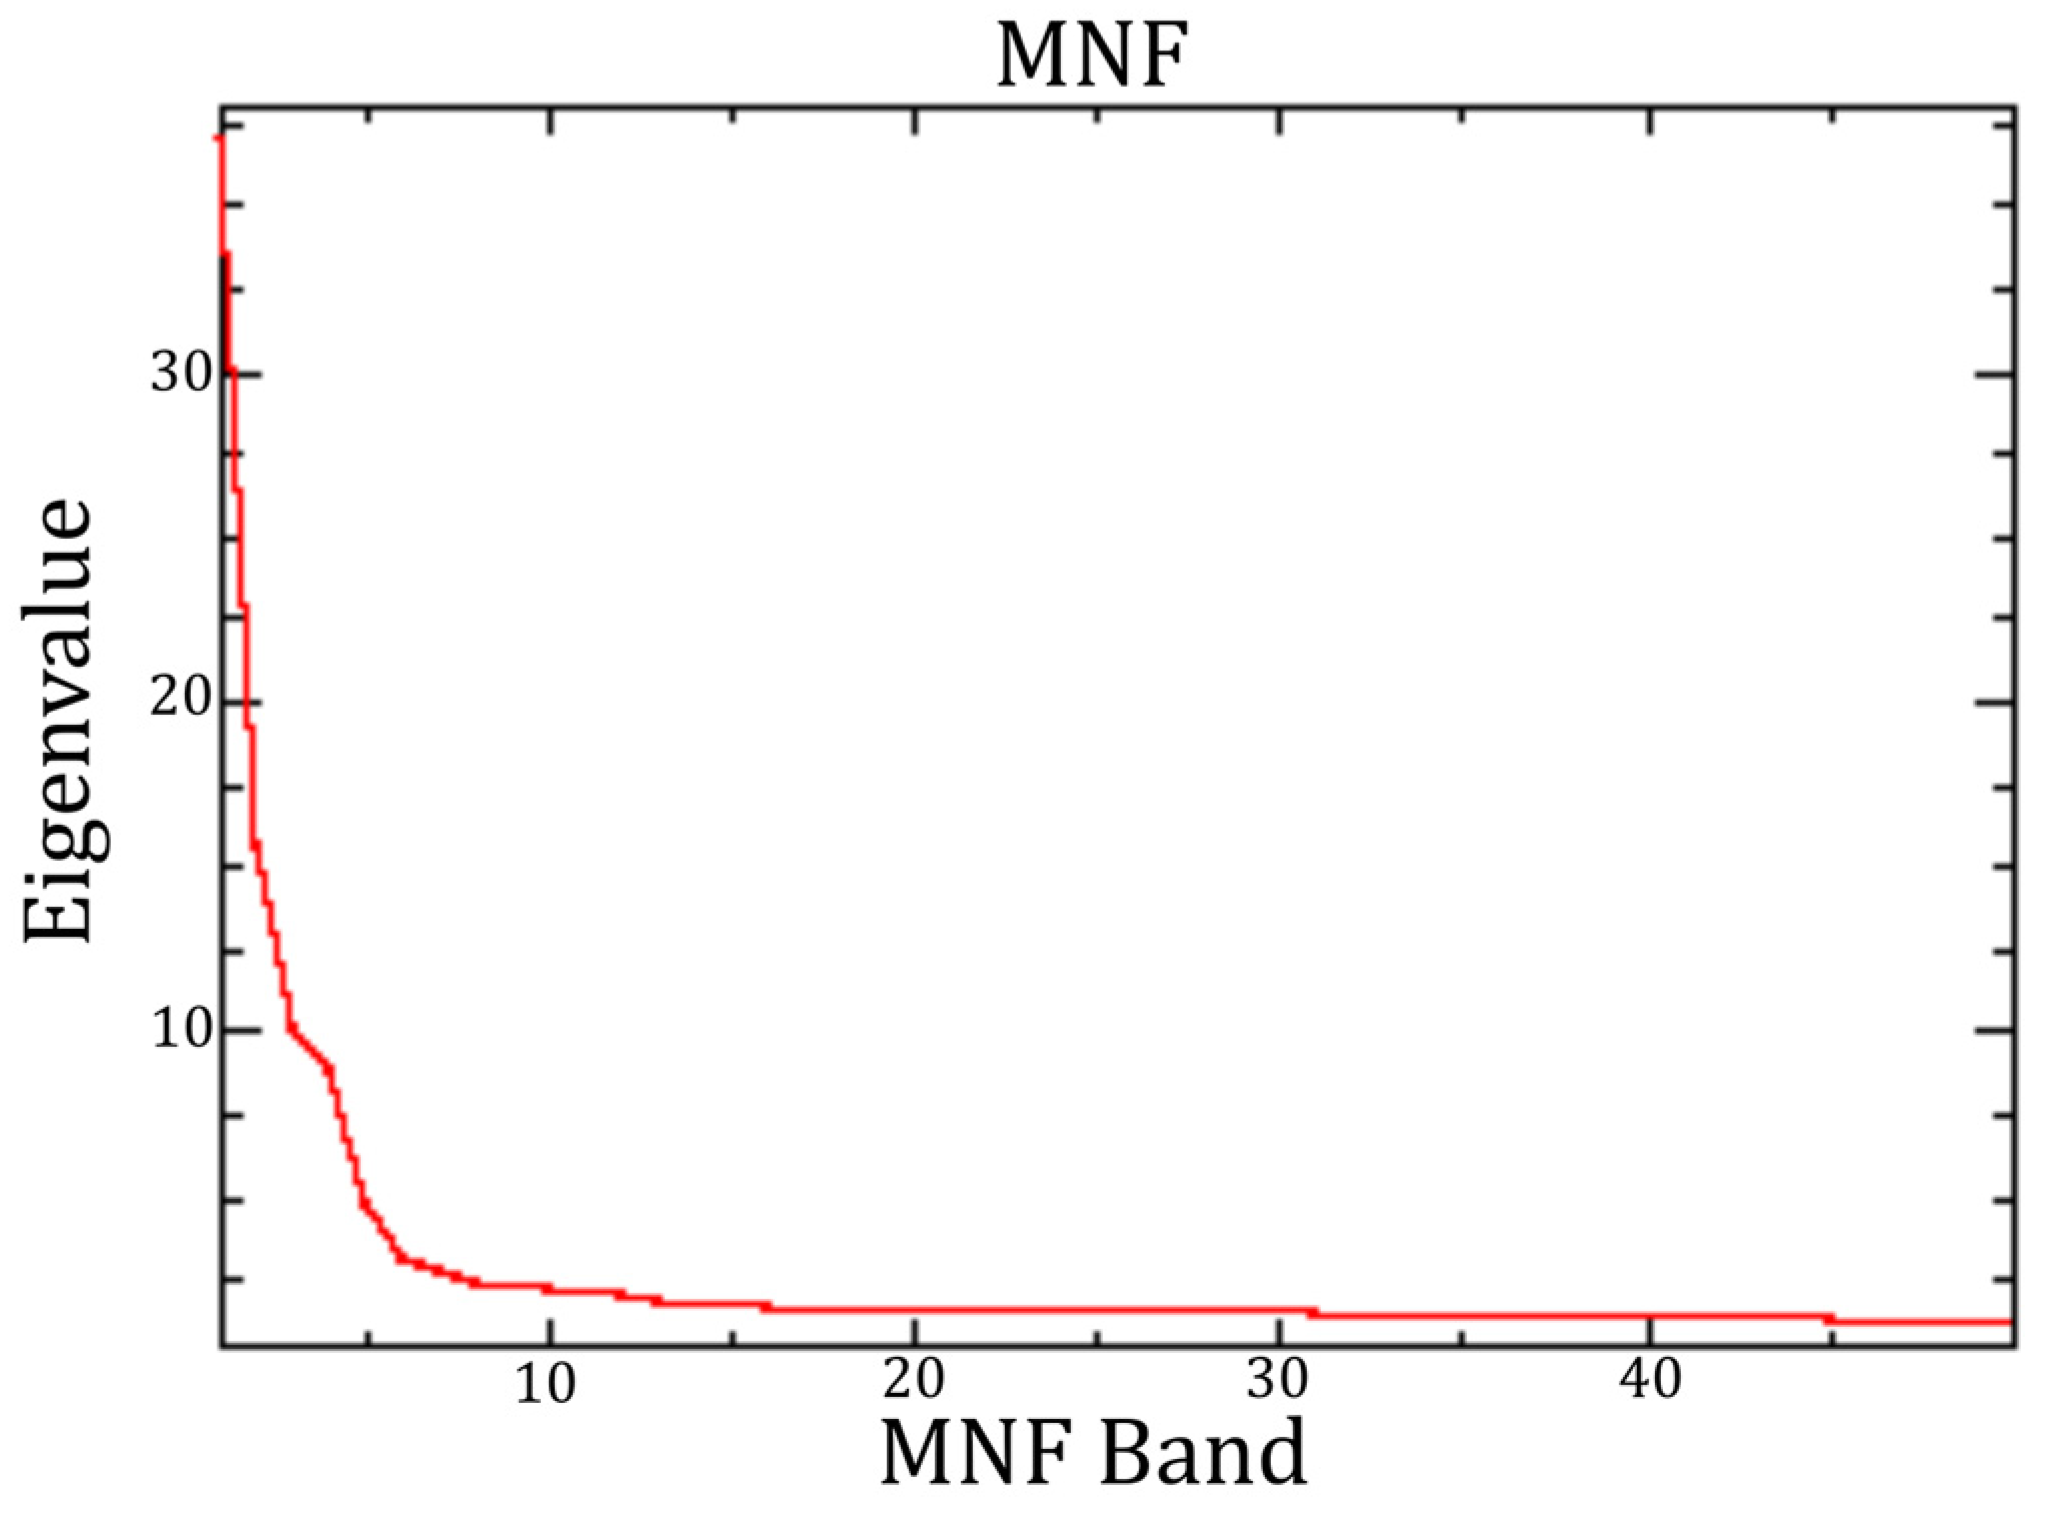
According to the graph presented in Appendix A (Figure A2), the ideal cut-off threshold would be around MNF band 5 (at the elbow of the curve). The eigenvalue curve presents its first pronounced elbow at approximately MNF band 5 [66]. However, the eigenvalues continue to decrease until the curve becomes nearly linear between MNF bands 15 and 20, indicating a progressive reduction in the information content of the subsequent components. Tests conducted with fewer than 20 MNF bands resulted in the loss of relevant spectral information together with noise. Therefore, MNF band 20 was selected as the cut-off, and bands 1–20 were retained for the subsequent spectral unmixing analysis.
Several tests showed that using fewer than 20 MNF bands resulted in the loss of relevant information along with the noise removed. Therefore, MNF band 20 was selected as the cut-off threshold, and all bands above MNF 20 were dominated by noise. The resulting dataset was subsequently used as input for the spectral unmixing processes.
5.3. MTMF Classification
By mapping montmorillonite and cookeite, it was possible to identify known mineralized pegmatites in the study area. In the Alijó mine, only cookeite was detected, which is consistent with the spodumene-dominant nature of the pegmatite and with the interpretation of cookeite as a late hydrothermal alteration mineral associated with spodumene [67].
The NDVI calculated from the PRISMA image indicates a strong vegetation contribution to the pixels associated with pegmatites 1 (Figure 7b and Figure 8b) and 6 (Figure 7f and Figure 8f), with NDVI values of 0.86 and 0.96, respectively. These high values suggest that the spectral response of these pixels is strongly influenced by dense vegetation, potentially masking or weakening the diagnostic spectral features of the underlying pegmatites. Nevertheless, MTMF successfully detected the pegmatite-related spectral signatures within these mixed pixels.
Figure 7.
Mapping of cookeite and montmorillonite using external reference spectra, resampled to PRISMA resolution, in Alijó. (a) Overview of the study area. From (b–g), known pegmatite occurrences identified by the method are highlighted.
Figure 8.
NDVI for PRISMA image in Alijó. (a) Overview of the study area. From (b–g), known pegmatite occurrences identified by the method are highlighted.
By analyzing the scatter plots in Figure 9 and Figure 10, we can observe the relationship between true positives, false positives, and background pixels. True positives tend to exhibit higher MF scores and lower infeasibility values. In contrast, false positives show both high MF scores and high infeasibility values. Meanwhile, background pixels generally have MF scores around or below zero.
Figure 9.
(a) Scatter plot showing the relationship between infeasibility and MF score for cookeite. (b) MTMF result for cookeite with selected reference spectra highlighted in red. The red rectangle marks the location of the Alijó mine.
Figure 10.
(a) Scatter plot showing the relationship between infeasibility and MF score for montmorillonite. (b) MTMF result for montmorillonite with selected reference spectra highlighted in red. The red rectangle marks the location of the Lousas mine.
5.4. Machine Learning Classification
The optimal hyperparameter configurations were identified through 5-fold stratified cross-validation grid search. This procedure provides an efficient and consistent criterion for comparing model configurations: although standard k-fold cross-validation does not enforce strict geographic independence between training and validation sets, causing scores to reflect within-distribution consistency rather than generalization to unseen regions, it reliably ranks candidate hyperparameter combinations relative to one another, making it a practical and widely adopted tool for hyperparameter selection in remote sensing classification tasks. The resulting CV scores (>0.99) therefore represent an upper bound on internal consistency and should not be interpreted as estimates of operational performance. Geographic generalization is assessed independently and rigorously via the Leave-One-Zone-Out evaluation, which constitutes the primary performance metric of this study (Table A1).
The results on the held-out validation set (n = 9857) were partitioned by stratified random sampling from the labelled training pool (Table A2). This partition quantifies within-distribution discrimination, the ability of each model to classify pixels spectrally similar to those seen during training, and complements the geographically independent LOZO evaluation by confirming the absence of underfitting. All three models exceed 98% accuracy, and the SVM achieved the highest pegmatite F1-score (0.9865) and precision (0.9926), indicating the most discriminative and spectrally stable decision boundary within the training distribution.
The complete list of hyperparameters and training settings is provided in Appendix B (Table A1 and Table A2).
The confusion matrices summarized in Table 3 reveal error profiles that aggregate metrics alone do not capture. The SVM produces by far the fewest false positives (FP = 36), compared to XGBoost (FP = 63) and RF (FP = 65). The higher recall of XGBoost (0.9853 vs. 0.9804 for the SVM) corresponds to 49 fewer missed pegmatite pixels out of 4905.
Table 3.
Absolute confusion matrices (held-out test set).
The Leave-One-Zone-Out (LOZO) evaluation reported in Table 4 constitutes the primary performance metric of this study, providing a geographically honest estimate of model generalization. In each of the five LOZO folds, all pixels from one zone were entirely withheld as the test set and the model was retrained from scratch on the remaining four zones, directly replicating the operational scenario of applying a trained classifier to a previously unseen geographical region. This procedure eliminates the spatial autocorrelation that inflates stratified k-fold scores and is therefore the appropriate benchmark for evaluating models intended for prospectivity mapping in new areas.
Table 4.
LOZO pegmatite F1-score by zone.
The SVM achieves the highest mean LOZO F1 of 0.885 and the most stable profile across zones, including the most challenging (Zone 1, F1 = 0.747). The reduction from CV score (0.9956) to LOZO F1 (0.885) reflects the expected effect of spatial autocorrelation inflation and confirms that the LOZO evaluation is genuinely independent. The SVM achieves the highest F1-score in four of the five zones, while XGBoost slightly outperforms SVM in Zone 2 (0.829 vs. 0.817). Overall, SVM achieves the highest mean LOZO F1 (0.885), followed by XGBoost (0.830) and RF (0.680). XGBoost shows a pronounced drop in Zone 1 (F1 = 0.626), while RF records F1-scores below 0.60 in two zones. The SVM was accordingly selected for deployment over the Barroso–Alvão study area.
The application of the best trained model to the Barroso–Alvão region produced a binary pegmatite classification map, where each pixel is labelled as pegmatite (1) or non-pegmatite (0), providing a spatially explicit measure of prospectivity across the study area (Figure 11).
Figure 11.
Pegmatite occurrence binary mapping using AI-based supervised classification of Sentinel-2 multispectral data for the Alijó pegmatite area. (a–i) Known pegmatites.
5.5. Mineral Prospectivity Mapping Through Fuzzy Overlay
The MTMF results for cookeite and montmorillonite, along with the SVM classification output, were used as inputs to a fuzzy-logic overlay procedure. The fuzzy OR operator was applied to generate the MPM.
The MPM (Figure 12) shows that integrating HIS and MSI data could improve pegmatite detection. As expected, all pegmatites individually identified by the methods were also recognized in the final MPM.
Figure 12.
Prospectivity map generated through fuzzy overlay integration. (a) Overview of the MPM results and the distribution of known pegmatites. (b) Selected point of interest for field validation.
Due to operational and accessibility limitations, it was necessary to select a priority area for field validation (Figure 12b). This area was chosen because it was highlighted by the MPM, indicating the presence of targets identified in both the hyperspectral and Sentinel-2 datasets. Within this area, several pegmatites were identified by the SVM model, together with a cookeite anomaly detected using the MTMF approach.
5.6. Field Validation
The field campaign validated a subset of the results obtained from satellite-based analyses. Field validation was carried out within the Alijó mining concession by two of the co-authors, Dias and Ribeiro, with extensive research experience in the Barroso–Alvão aplite–pegmatite field gained through previous studies in the area [21,22,67,68] conducted under the scientific supervision of Lima, a co-author of the present study, and of Martins and Noronha [21,22,28]. When analyzing Figure 13, it can be observed that the distribution of pixels classified by the SVM model (applied to Sentinel-2 data) as true positives is mainly concentrated along roads and within the mining area. Field investigation of a subset of 632 of these points confirmed that 600 were validated as pegmatite, whereas the remaining 32 were validated as not being pegmatite, resulting in a confirmation rate of 94.9%. Among the points validated as pegmatite, 72% were associated with the open-pit mining area, 22% with dirt roads covered with pegmatitic material, and 6% with in situ pegmatite outcrops. The high proportion of detections along roads can be explained by the use of pegmatitic material to improve the condition of the dirt road providing access to the mine. The road crosses schist, which is prone to becoming muddy and developing potholes, particularly under the frequent traffic of mine haul trucks. To facilitate vehicle circulation, the road surface was therefore covered with pegmatitic material ranging in grain size from sand to gravel and cobbles, with occasional boulders along the roadsides. This material provides a strong spectral response that can be detected by the model. Importantly, despite the small size and sporadic distribution of the in situ pegmatite outcrops, the SVM model also identified these occurrences, demonstrating its ability to detect pegmatite in different field settings.
Figure 13.
Field validation in the Alijó area of the individual results produced by each method. Green points indicate Sentinel-2 true positives, while red points indicate false positives. Green polygons correspond to cookeite anomalies derived from PRISMA data, whereas red polygons correspond to montmorillonite anomalies.
The analysis of stops 1 to 5 and 8 supports this pattern (see stop descriptions below), highlighting the presence of pegmatite fragments along the road and in situ pegmatites, which were likely detected by Sentinel-2 and classified as true positives.
On the other hand, the MTMF model mapped a pegmatite abundance anomaly (associated with cookeite) in the vicinity of stops 5 and 7. This anomaly covers approximately 2700 m2 and includes both pegmatite fragments present along the road and in situ pegmatite outcrops. However, false positives were also observed, in areas of whitish schist with a kaolinised appearance. The alteration of these schists may be related to their proximity to pegmatite bodies and may have influenced their spectral signatures.
The field campaign comprised more than 40 observation stops across the study area. The following eight stops, located within the area shown in Figure 13, are presented as examples of the geological observations made during the field campaign, including field-based interpretations that may help explain the satellite-derived anomalies discussed in this section: Stop 1—Wide dirt road (~5 m wide) providing access to the mine, with frequent vehicle traffic and covered with crushed pegmatite material derived from mining operations. The material exhibits variable grain size, ranging from coarse sand to cobbles and some larger blocks (Supplementary Materials, Figure S1).
Stop 2—Accumulation of pegmatite cobbles at a road widening. Locally, cookeite, greenish clay-rich zones, and more siliceous areas are observed. Approximately 10 m upslope, metasomatized schist outcrops are present.
Stop 3—Continuation of the same unpaved access road, also covered with crushed pegmatite material.
Stop 4—Road section with large, dumped pegmatite blocks; outcropping schist is visible along the road margins.
Stop 5—Highly kaolinised in situ pegmatite exposed in a road cut at the intersection with the firebreak, showing small Fe-oxide alignments (~1–2 mm). The kaolinised pegmatite material was sampled at this location (Supplementary Materials, Figure S2).
Stop 6—Area consisting exclusively of schist and quartz fragments.
Stop 7—Whitish schist in a firebreak area, showing a kaolinised appearance, which may be related to the proximity of in situ pegmatite bodies exposed along the firebreak (Stop 8) and at the intersection of the firebreak with a dirt road (Stop 5).
Stop 8—Moderately altered in situ pegmatite outcropping within schist along a firebreak, featuring centimetre-sized white mica (muscovite) up to 2 cm. A small branch extends up to a maximum of 1.5 m. A sample was collected from the finer-grained pegmatite zone near the contact (N94°; 38°S; Supplementary Materials, Figure S3).
6. Discussion
The spectral analysis results indicate a strong presence of white mica/sericite in the samples. However, this mineral occurs not only in pegmatites but also in the host rock, which limits its effectiveness as a direct indicator of lithium mineralization.
Although low-Mg chlorites may also exhibit a strong absorption feature near 2350–2360 nm, the spectral behaviour of cookeite differs markedly from that of common Mg-Fe chlorites, including Fe-rich chlorites. Cookeite is a Li-rich di-trioctahedral chlorite with the ideal composition LiAl4(Si3Al)O10(OH)8, in which Li occupies octahedral sites and Al dominates the structure [63]. As a result, Fe2+ is largely absent or occurs only in very minor amounts, and the Fe2+ ramp-like absorption band typically observed in Fe-Mg chlorites is not expected to be prominent [63].
Therefore, the distinction between cookeite and other chlorites should not be based solely on the absorption near 2359 nm, but rather on the complete spectral behaviour, including the SWIR absorption pattern and the absence or weakness of Fe2+-related features [63]. In contrast, other minerals more closely associated with lithium-bearing systems, such as cookeite and smectite-group minerals, were identified. For this reason, these minerals were selected for mineral abundance mapping in MTMF classification.
It is evident that noise control is a critical task when working with PRISMA data. Dead strips in PRISMA imagery make noise reduction particularly important during data processing and classification procedures. The MNF transformation proves an effective method for noise reduction; however, multiple tests are required to balance noise reduction with information preservation [66].
The field campaign results showed that, for hyperspectral data, cookeite mapping was more effective in detecting lithium-rich pegmatites. This can be explained by the fact that cookeite exhibits characteristic Al–OH absorption features at approximately 2200 nm, as a doublet, and at ~2350 nm. These spectral characteristics differentiate it from other aluminosilicates, such as montmorillonite, which typically presents a single diagnostic Al–OH absorption feature around 2200 nm and may therefore generate a higher number of false positives with other rock types.
The contrasting spatial distribution of cookeite and montmorillonite observed in the MTMF classification may reflect their different alteration settings. Cookeite was mainly detected at the spodumene-dominant Alijó mine, particularly in areas where the pegmatite is more exposed and less weathered, consistent with its interpretation as a late hydrothermal alteration mineral associated with spodumene. As a Li-bearing chlorite formed during the alteration of spodumene, its presence provides a direct mineralogical indication of Li mineralization. In contrast, montmorillonite was mainly detected at the petalite-dominant Lousas mine. Within the Barroso–Alvão pegmatite field, petalite-rich pegmatites tend to be strongly altered and argillized at the surface and are characterized by abundant cassiterite and columbite-group minerals, with cassiterite being much more abundant than in spodumene-rich pegmatites [21]. These cassiterite-bearing aplite–pegmatites were historically exploited for Sn during the Second World War [67], while small-scale mining also occurred after the Second World War wherever argillic alteration made digging by hand possible [27,28]. This strong surface alteration therefore contributes to the spectral expression of montmorillonite. Thus, although both minerals can be used as indicators of mineralized pegmatites, their significance differs: cookeite provides a direct mineralogical indicator of Li mineralization, whereas montmorillonite may act as an indirect surface-weathering vector for petalite-rich pegmatites.
However, the detected cookeite anomalies also include false positives associated with schists. This can be explained by the fact that the method estimates the relative abundance of cookeite within each pixel, which may incorporate schists or other lithologies located between or near pegmatite bodies.
The use of external reference spectra, particularly collected in detail under controlled conditions, will always be affected by intrinsic differences related to atmospheric correction procedures and other sensor-related factors. Nevertheless, despite the limitations mentioned above, the method proved effective in identifying pegmatite-rich zones within the study area.
One of the main advantages of using external reference spectra is the ability to map lithium-rich pegmatites even in greenfield exploration areas.
On the other hand, native reference spectra tend to provide better subpixel classification results, as they more accurately represent the specific sensor and scene conditions. However, their applicability is limited to areas where representative spectral signatures can be reliably extracted, and the exact spectral composition of the reference spectra is not known a priori. Consequently, the interpretation of the results may become more subjective.
The PRISMA satellite identified a cookeite anomaly, which includes true positives corresponding to both in situ pegmatite and fragmented material along the road. Although this anomaly occurs in a similar area to that detected using Sentinel-2 data, the SVM applied to Sentinel-2 identified more pegmatite occurrences than the MTMF approach applied to PRISMA data.
This suggests that, although mineral detection is strongly dependent on the sensor’s spectral resolution, PRISMA’s performance was affected by spectral mixing. In addition, the absence of radiometric topographic correction in the L2D product, in contrast to the Sentinel-2 L2A product, may have introduced illumination-related variability in the reflectance spectra, particularly on steep and shaded slopes, which may also have contributed to the lower detection performance [68].
The SVM with RBF kernel emerged as the most suitable classifier for operational deployment, leading in pegmatite F1-score, precision, and mean LOZO F1, while producing the fewest false positives of the three models. In satellite-based mineral exploration, false positives correspond to pixels incorrectly labelled as pegmatite and translate directly into unproductive field verification campaigns, a non-negligible operational cost when ground-truth resources are limited [69]. The lower false positive rate of the SVM is therefore a practically meaningful advantage beyond what aggregate accuracy metrics convey.
The LOZO results further reveal a divergence between within-distribution and geographic performance that aggregate metrics alone cannot capture. RF, despite competitive results on the internal validation set, generalizes poorly across independent zones, indicating overfitting to the spectral distributions encountered during training. The SVM, by contrast, maintains consistent performance across all five zones, including the most spectrally challenging, and produces the most stable ranking regardless of the zone withheld, reflecting a decision boundary that is both discriminative and geographically transferable. This robustness is particularly relevant for prospectivity mapping applications, where the classifier must perform reliably in regions with no available training labels [69,70].
Several previously confirmed occurrences from fieldwork were successfully detected using multispectral data, as illustrated in Figure 13. This result demonstrates the effectiveness of combining the SVM algorithm with the spatial resolution of Sentinel-2 data.
The fact that the SVM model was able to identify both in situ pegmatite outcrops and dispersed pegmatite fragments along the road indicates that the algorithm is sufficiently sensitive to detect pegmatite occurrences in different contexts.
Non-detections of known pegmatite occurrences are primarily attributable to the subpixel scale of many outcrops relative to the 10 m spatial resolution of Sentinel-2, and to the persistent masking of geological signals by dense vegetation cover, a recognized limitation of optical multispectral approaches in vegetated terrains.
Due to the typical dimensions of the Barroso–Alvão pegmatites, which generally reach up to 10 m in thickness and 100 m in outcrop width, many exposed pegmatite bodies can be resolved or delineated by Sentinel-2 owing to its 10 m spatial resolution. In contrast, PRISMA, with a spatial resolution of 30 m, cannot fully resolve many of these small pegmatites, and narrower bodies are frequently represented as mixed pixels. This limitation justifies the application of subpixel detection methods and spectral analysis techniques, which exploit the distinctive spectral signatures of lithium-bearing pegmatites and their associated alteration minerals to identify targets that are not spatially resolved.
Considering the dimensions of the pegmatite bodies identified during field validation, the practical detection limit of the PRISMA approach appears to depend not only on pegmatite size but also on the spectral contribution of pegmatite-related alteration minerals within the mixed pixel. For example, at Stop 5, PRISMA successfully detected a pixel containing an approximately 5 m wide pegmatite outcrop together with several smaller pegmatite outcrops and pegmatite fragments distributed within the surrounding 30 × 30 m pixel. In contrast, the 1.5 m thick pegmatite exposed at Stop 8 was not detected. These observations indicate that PRISMA is capable of detecting relatively small pegmatite bodies when the cumulative spectral contribution of pegmatite-related alteration minerals within a mixed pixel is sufficiently strong.
Conversely, the Sentinel-2 approach successfully identified narrow pegmatite bodies owing to its higher spatial resolution combined with the SVM classifier. Integrating Sentinel-2 and PRISMA results mitigates many of the limitations of each individual dataset, combining the superior spatial resolution of Sentinel-2 with the enhanced mineral discrimination provided by PRISMA. This complementary approach enables the identification of pegmatite bodies across a broader range of sizes and exposure conditions.
Evaluating results individually is essential for proper model calibration. However, when analyzing the final MPM, it can be observed that, although some points correspond to true positives with higher pertinence values, many others still show low or intermediate values.
This situation is most likely due to the fact that these points are influenced by a single input, which limits their overall pertinence. As a result, the partial contribution of each criterion leads to lower final values.
However, further field validation points are still required to reinforce and consolidate these interpretations and to improve the robustness of the final model.
7. Conclusions
This study demonstrates the effectiveness of a fuzzy integration framework combining hyperspectral (PRISMA) and multispectral (Sentinel-2) data for mapping Li-rich pegmatite prospectivity in challenging exploration environments. By integrating hyperspectral mineralogical information with Sentinel-2 spatial information and machine learning outputs, the proposed methodology improves the identification of prospective targets under conditions of dense vegetation and small pegmatite dimensions, both in subpixel occurrence situations.
The results further demonstrate that the SVM model, trained using a globally distributed spectral dataset and supported by the spatial resolution of Sentinel-2 imagery, represents a robust and transferable approach for detecting small-scale (narrow) pegmatites bodies, although with more limited mineral discrimination capability. The incorporation of spectral signatures from multiple geological environments enhanced the model’s spectral generalization capability, improving its adaptability to complex geological conditions and enhancing sensitivity to local spectral variability. In contrast, Sentinel-2, with its moderate spatial resolution (pixel size of 10 m) and the SVM classifier, can directly identify narrow pegmatite bodies.
Although hyperspectral data provide detailed mineralogical information, their performance was affected by spectral mixing. In addition, given the mountainous terrain of the study area, the absence of a topographic correction may have introduced illumination-related variability in the reflectance spectra and influenced the results. Incorporating this correction is planned for future work. Overall, these findings highlight the complementary strengths of multispectral data, which contribute greater spatial consistency to the MPM.
Among the alteration minerals indicative of lithium mineralization, cookeite showed the best performance in identifying true positives. Its diagnostic absorption features differ more clearly from those of montmorillonite, which, because it presents a single Al–OH absorption feature around ~2200 nm, is more susceptible to false positives. The contrasting spatial distribution of these minerals also reflects their different alteration settings: cookeite was mainly detected in the spodumene-dominant Alijó mine, whereas montmorillonite was mainly detected in the petalite-dominant Lousas mine. In the Barroso–Alvão pegmatite field, the strong surface alteration and argillization of petalite-rich pegmatites contributes to the spectral expression of montmorillonite, which can therefore act as an indirect surface-weathering vector for petalite-rich pegmatites.
Cookeite is a Li-bearing chlorite formed during the alteration of spodumene and therefore provides a direct mineralogical indication of Li mineralization. It achieved the best field validation results when compared with montmorillonite. However, the entire spectrum, including both the VNIR and SWIR regions, should be used as the reference spectrum, since relying solely on the SWIR absorption features (~2359 nm) is insufficient to distinguish cookeite from Fe-rich chlorite.
Overall, the fuzzy integration approach improves prospectivity mapping by combining the complementary information provided by multispectral classification and hyperspectral mineral mapping. Sentinel-2 contributes finer spatial detail, whereas PRISMA provides greater spectral discrimination of alteration minerals associated with pegmatites. The results demonstrate that the integration of mineralogical and spatial information can support the detection of small and partially exposed pegmatite occurrences in complex exploration environments.
However, further field validation is still required to refine the model outputs and improve the robustness of the predictive framework.
Supplementary Materials
The following supporting information can be downloaded at: https://www.mdpi.com/article/10.3390/geomatics6050116/s1, Figure S1: Field photographs from Stop 1.; Figure S2: Field photographs from Stop 5, showing a kaolinised pegmatite outcrop right next to the road. Figure S3: Field photographs from Stop 8, showing moderately altered pegmatite exposed in the firebreak.
Author Contributions
Conceptualization, D.S., N.E., A.C.T. and A.L.; methodology, D.S., N.E. and N.P.; software, N.E., D.S.; validation, A.C.T., F.D. and R.R.; formal analysis, D.S., N.E.; investigation, D.S., N.E., B.A., and A.A.; data curation, D.S., N.E.; writing—original draft preparation, D.S.; N.E. and F.D. writing—review and editing, D.S., N.E., A.C.T., N.P., R.R. and F.D.; visualization, D.S.; supervision, A.C.T., N.P.; project administration, F.D., R.R.; funding acquisition, A.L. All authors have read and agreed to the published version of the manuscript.
Funding
This work was co-funded by the MineSpot project (reference: COMPETE2030-FEDER-02302900), co-financed by the European Union through the COMPETE 2030 and Portugal 2030 Programs.
Data Availability Statement
The data will be made available upon request.
Acknowledgments
The authors would like to thank AMG Lithium Portugal and Grupo Lagoa for granting access to the mining concession, which was essential for validating the findings of this study. Special thanks are also extended to geologist Filipe Gonçalves for accompanying the team and supporting the fieldwork within the study area.
Conflicts of Interest
Author Douglas Santos, Nuno Eusébio, Filipa Dias, Beatriz Araújo, Ricardo Ribeiro were employed by the company Spotmine. The remaining authors declare that the research was conducted in the absence of any commercial or financial relationships that could be construed as a potential conflict of interest.
Appendix A. Hyperspectral Processing
Figure A1.
Continuum-removed USGS reference spectra of Fe-rich chlorite (Clinochlore GDS157), Mg-rich chlorite (Chlorite SMR-13.a), kaolinite (KGa-1), muscovite (GDS108), montmorillonite (SCa-2.a), and cookeite (CAr-1.b), shown from top to bottom. Spectra are vertically offset for clarity.
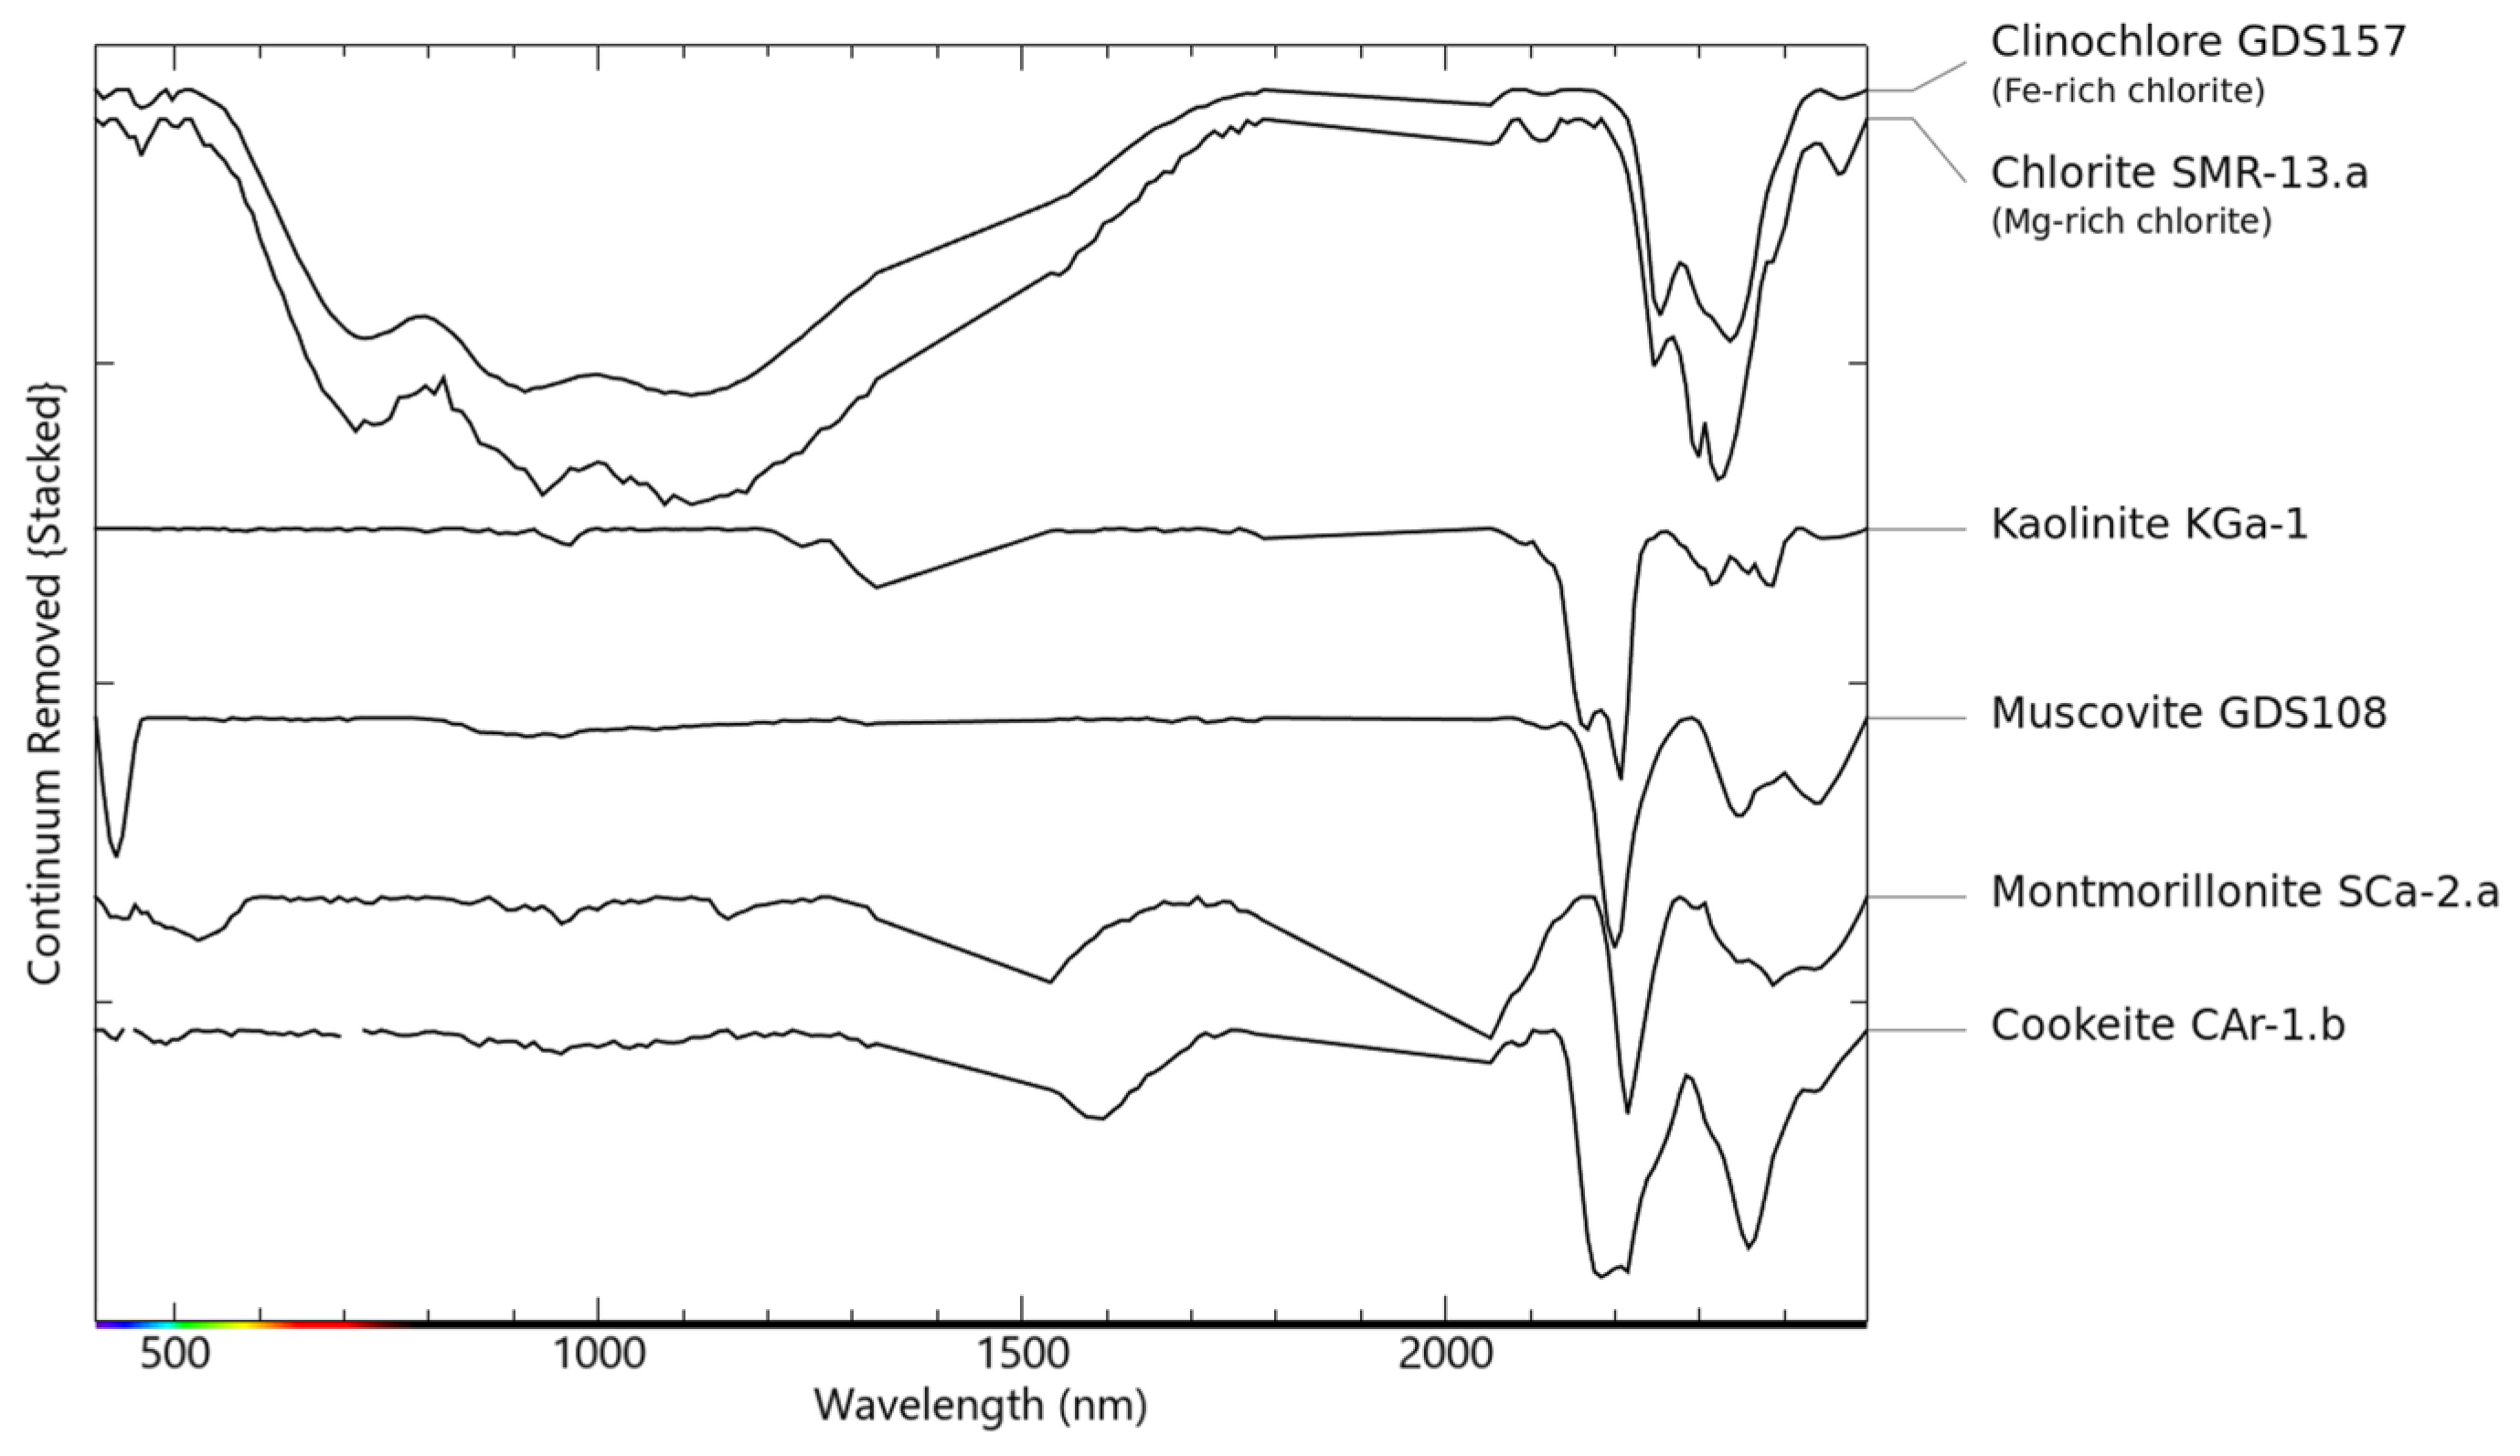
Figure A2.
The eigenvalue curve of the MNF transformation is used to determine the cut-off threshold between signal and noise.
Appendix B. SVM Hyperparameters
Table A1.
Optimal hyperparameters and 5-fold cross-validation F1 (pegmatite).
Table A2.
Test set performance (held-out, n = 9857).
References
- European Commission. Study on the Critical Raw Materials for the EU 2023—Final Report. Directorate-General for Internal Market, Industry, Entrepreneurship; European Commission: Brussels, Belgium, 2023. [Google Scholar]
- European Commission. Critical Raw Materials Act Data; European Commission: Brussels, Belgium, 2024. [Google Scholar]
- IEA (International Energy Agency). Energy and AI; Birol, F., Cozzi, L., Spencer, T., Singh, S., Eds.; International Energy Agency: Paris, France, 2025. [Google Scholar]
- European Union Regulation (EU). 2024/1252 of the European Parliament and of the Council of 11 April 2024 Establishing a Framework for Ensuring a Secure and Sustainable Supply of Critical Raw Materials and Amending Regulations (EU) No 168/2013, (EU) 2018/858, (EU) 2018/1724 and (EU) 2019/1020; Official Journal of the European Union: Luxembourg, 2024; Volume L 1252. [Google Scholar]
- Dias, F. Mineral Geochemistry for Lithium Exploration in the Barroso-Alvão Pegmatite Field, Portugal: Insights and Applications. Ph.D. Thesis, University of Porto, Porto, Portugal, 2025. [Google Scholar]
- Morsli, Y.; Zerhouni, Y.; Maimouni, S.; Alikouss, S.; Kadir, H.; Baroudi, Z. Pegmatite Mapping Using Spectroradiometry and ASTER Data (Zenaga, Central Anti-Atlas, Morocco). J. Afr. Earth Sci. 2021, 177, 104153. [Google Scholar] [CrossRef] [Scilit]
- Ousmanou, S.; Fodoue, Y.; Wadjou, J.W.; Kepnamou, A.D.; Fozing, E.M.; Kwékam, M.; Ikfi, M. Fuzzy-Logic Technique for Gold Mineralization Prospecting Using Landsat 9 OLI Processing and Fieldwork Data in the Bibemi Goldfield, North Cameroon. Heliyon 2024, 10, e23334. [Google Scholar] [CrossRef] [Scilit] [PubMed]
- Boadi, B.; Sunder Raju, P.V.; Wemegah, D.D. Analysing Multi-Index Overlay and Fuzzy Logic Models for Lode-Gold Prospectivity Mapping in the Ahafo Gold District—Southwestern Ghana. Ore Geol. Rev. 2022, 148, 105059. [Google Scholar] [CrossRef] [Scilit]
- Abrams, M.J.; Brown, D.; Lepley, L.; Sadowski, R. Remote Sensing for Porphyry Copper Deposits in Southern Arizona. Econ. Geol. 1983, 78, 591–604. [Google Scholar] [CrossRef] [Scilit]
- Pour, A.B.; Hashim, M. Identification of Hydrothermal Alteration Minerals for Exploring of Porphyry Copper Deposit Using ASTER Data, SE Iran. J. Asian Earth Sci. 2011, 42, 1309–1323. [Google Scholar] [CrossRef] [Scilit]
- Hu, B.; Xu, Y.; Wan, B.; Wu, X.; Yi, G. Hydrothermally Altered Mineral Mapping Using Synthetic Application of Sentinel-2A MSI, ASTER and Hyperion Data in the Duolong Area, Tibetan Plateau, China. Ore Geol. Rev. 2018, 101, 384–397. [Google Scholar] [CrossRef] [Scilit]
- Son, Y.-S.; Lee, G.; Lee, B.H.; Kim, N.; Koh, S.-M.; Kim, K.-E.; Cho, S.-J. Application of ASTER Data for Differentiating Carbonate Minerals and Evaluating MgO Content of Magnesite in the Jiao-Liao-Ji Belt, North China Craton. Remote Sens. 2022, 14, 181. [Google Scholar] [CrossRef] [Scilit]
- Cardoso-Fernandes, J.; Teodoro, A.C.; Lima, A. Remote Sensing Data in Lithium (Li) Exploration: A New Approach for the Detection of Li-Bearing Pegmatites. Int. J. Appl. Earth Obs. Geoinf. 2019, 76, 10–25. [Google Scholar] [CrossRef] [Scilit]
- Cardoso-Fernandes, J.; Teodoro, A.C.; Lima, A. Semi-Automatization of Support Vector Machines to Map Lithium (Li) Bearing Pegmatites. Remote Sens. 2020, 12, 2319. [Google Scholar] [CrossRef] [Scilit]
- Booysen, R.; Lorenz, S.; Thiele, S.T.; Fuchsloch, W.C.; Marais, T.; Nex, P.A.M.; Gloaguen, R. Accurate Hyperspectral Imaging of Mineralised Outcrops: An Example from Lithium-Bearing Pegmatites at Uis, Namibia. Remote Sens. Environ. 2022, 269, 112790. [Google Scholar] [CrossRef] [Scilit]
- Santos, D.; Azzalini, A.; Mendes, A.; Cardoso-Fernandes, J.; Lima, A.; Müller, A.; Teodoro, A.C. Optimizing Exploration: Synergistic Approaches to Minimize False Positives in Pegmatite Prospecting—A Comprehensive Guide for Remote Sensing and Mineral Exploration. Ore Geol. Rev. 2025, 175, 106347. [Google Scholar] [CrossRef] [Scilit]
- Yu, L.; Porwal, A.; Holden, E.J.; Dentith, M.C. Towards Automatic Lithological Classification from Remote Sensing Data Using Support Vector Machines. Comput. Geosci. 2012, 45, 229–239. [Google Scholar] [CrossRef] [Scilit]
- Maepa, F.; Smith, R.S.; Tessema, A. Support Vector Machine and Artificial Neural Network Modelling of Orogenic Gold Prospectivity Mapping in the Swayze Greenstone Belt, Ontario, Canada. Ore Geol. Rev. 2021, 130, 103968. [Google Scholar] [CrossRef] [Scilit]
- Breiman, L. Random Forests. Mach. Learn. 2001, 45, 5–32. [Google Scholar] [CrossRef] [Scilit]
- Lin, N.; Fu, J.; Jiang, R.; Li, G.; Yang, Q. Lithological Classification by Hyperspectral Images Based on a Two-Layer XGBoost Model, Combined with a Greedy Algorithm. Remote Sens. 2023, 15, 3764. [Google Scholar] [CrossRef] [Scilit]
- Noronha, F.; Lima, J. Folha 6C-Cabeceiras de Basto. In Carta Geológica de Portugal à Escala 1:50,000; Serviços Geológicos de Portugal: Lisboa, Portugal, 1992. [Google Scholar]
- Ribeiro, M.A.; Martins, H.C.B.; Almeida, A.; Noronha, F. Notícia Explicativa Da Folha 6-C-Cabeceiras de Basto. Carta Geológica de Portugal Na Escala 1/50,000; Geologia, D.d., Ed.; Instituto Geológico e Mineiro: Lisboa, Portugal, 2000.
- Charoy, B.; Noronha, F.; Lima, A. Spodumene-Petalite-Eucryptite; Mutual Relationships and Pattern of Alteration in Li-Rich Aplite-Pegmatite Dykes from Northern Portugal. Can. Mineral. 2001, 39, 729–746. [Google Scholar] [CrossRef] [Scilit]
- Noronha, F.; Ribeiro, M.A.; Martins, H.C.; Lima, J. Folha 6D-Vila Pouca de Aguiar. In Carta Geológica de Portugal à Escala 1:50,000; Instituto Geológico e Mineiro: Lisboa, Portugal, 1998. [Google Scholar]
- Rodríguez Fernández, L.R.; López Olmedor, F.; Oliveira, J.T.; Medialdea Cela, T.; Terrinha, P.; Matas González, J.; Martín-Serrano García, A.; Martín Parra, L.M.; Rubio Pascual, F.; Marín Lechado, C.; et al. Mapa Geológico de Espanha e Portugal à Escala 1:1.000.000; Rodríguez Fernández, L.R., Oliveira, J.T., López Olmedo, F., Días, R.P., Medialdea Cela, T., Terrinha, P., Eds.; Instituto Geológico y Minero de España (IGME): Madrid, Spain; Laboratório Nacional de Energia e Geologia (LNEG): Amadora, Portugal, 2015. [Google Scholar]
- Agência Portuguesa do Ambiente. Massas de Água Superficiais Albufeiras de Portugal Continental: Conjunto de Dados Geográfico SNIAmb. Available online: https://sniamb.apambiente.pt/content/geo-visualizador (accessed on 10 July 2025).
- Martins, T. Multidisciplinary Study of Pegmatites and Associated Li and Sn-Nb-Ta Mineralisation from the Barroso-Alvão Region. Ph.D. Thesis, University of Porto, Porto, Portugal, 2009. [Google Scholar]
- Charoy, B.; Lhote, F.; Dusausoy, Y.; Noronha, F. The Crystal Chemistry of Spodumene in Some Granitic Aplite-Pegmatite of Northern Portugal. Can. Mineral. 1992, 30, 639–651. [Google Scholar]
- Lima, A. Estrutura, Mineralogia e Génese dos Filões Aplitopegmatíticos Com Espodumena da Região do Barroso-Alvão; Tese de Doutoramento em Ciências-Geologia; Faculty of Sciences of the University of Porto: Porto, Portugal, 2000. [Google Scholar]
- Pires, M. Prospeção de Jazigas Litiníferas e de Metais Associados Entre as Serras Do Barroso e Alvão—Ribeira de Pena. In Prospecção Geológica e Geoquímica 1993–1994; DPMM-IGM: Alfragide, Portugal, 1995. [Google Scholar]
- Farinha Ramos, J. Sondagens de Reconhecimento Em Filões Aplitopegmatíticos Mineralizados Em Espodumena, Região Do Alto Tâmega (Concelhos de Boticas, Vila Pouca de Aguiar e Ribeira de Pena). In Relatório Interno #5733; Instituto Geológico e Mineiro: Lisboa, Portugal, 1998. [Google Scholar]
- Noronha, F. Nota sobre a ocorrência de filões com espodumena na folha de Dornelas. (Occurrence of pegmatite bodies with spodumene in the Dornelas geological map). In Portuguese Geological Survey Internal Report; Laboratório Nacional de Energia e Geologia (LNEG): Amadora, Portugal, 1987. [Google Scholar]
- de Almeida, C.R.; Santos, D.; Vasques, J.T.; Cardoso-Fernandes, J.; Lima, A.; Teodoro, A.C. A LCT Pegmatite Spectral Library of the Aldeia Spodumene Deposit: Contributes to Mineral Exploration; IEEE: New York, NY, USA, 2022. [Google Scholar] [CrossRef] [Scilit]
- Kokaly, R.F.; Clark, R.N.; Swayze, G.A.; Livo, K.E.; Hoefen, T.M.; Pearson, N.C.; Wise, R.A.; Benzel, W.M.; Lowers, H.A.; Driscoll, R.L.; et al. USGS Spectral Library Version 7; U.S. Geological Survey (USGS): Reston, VA, USA, 2017.
- van der Meer, F.D.; van der Werff, H.M.A.; van Ruitenbeek, F.J.A.; Hecker, C.A.; Bakker, W.H.; Noomen, M.F.; van der Meijde, M.; Carranza, E.J.M.; de Smeth, J.B.; Woldai, T. Multi- and Hyperspectral Geologic Remote Sensing: A Review. Int. J. Appl. Earth Obs. Geoinf. 2012, 14, 112–128. [Google Scholar] [CrossRef] [Scilit]
- Goetz, A.F.H.; Vane, G.; Solomon, J.E.; Rock, B.N. Imaging Spectrometry for Earth Remote Sensing. Science 1985, 228, 1147–1153. [Google Scholar] [CrossRef] [Scilit] [PubMed]
- El-Omairi, M.A.; Garouani, A. El Satellite Based Lithological Mapping: A Review of Sensors, Methods, and Emerging Machine-Learning Approaches. Int. J. Appl. Earth Obs. Geoinf. 2026, 149, 105309. [Google Scholar] [CrossRef] [Scilit]
- Dixit, A.; Agarwal, S. Non-Linear Spectral Unmixing of Hyperspectral Data Using Modified PPNMM. Appl. Comput. Geosci. 2021, 9, 100053. [Google Scholar] [CrossRef] [Scilit]
- Simões, M.; Bioucas-Dias, J.; Almeida, L.B.; Chanussot, J. Hyperspectral Image Superresolution: An Edge-Preserving Convex Formulation. In Proceedings of the 2014 IEEE International Conference on Image Processing (ICIP), Paris, France, 27–30 October 2014; pp. 4166–4170. [Google Scholar]
- Roge. Clark Spectroscopy of Rocks and Minerals, and Principles of Spectroscopy. In Remote Sensing for the Eartb Sciences: Manual of Remote Sensing, 3rd ed.; U.S. Geological Survey: Denver, CO, USA, 1999; pp. 3–58, Volume 3. [Google Scholar]
- Zhou, Y.; Wang, T.; Fan, F.; Chen, S.; Guo, W.; Xing, G.; Sun, J.; Xiao, F. Advances on Exploration Indicators of Mineral VNIR-SWIR Spectroscopy and Chemistry: A Review. Minerals 2022, 12, 958. [Google Scholar] [CrossRef] [Scilit]
- Thompson, A.J.B.; Hauff, P.L.; Robitaille, A.J. Alteration Mapping in Exploration: Application of Short-Wave Infrared (SWIR) Spectroscopy. In SEG Discovery; Society of Economic Geologists, Inc.: Littleton, CO, USA, 1999; pp. 1–27. [Google Scholar] [CrossRef] [Scilit]
- Clark, R.N.; Roush, T.L. Reflectance Spectroscopy: Quantitative Analysis Techniques for Remote Sensing Applications. J. Geophys. Res. Solid Earth 1984, 89, 6329–6340. [Google Scholar] [CrossRef] [Scilit]
- Quintano, C.; Fernández-Manso, A.; Shimabukuro, Y.E.; Pereira, G. Spectral Unmixing. Int. J. Remote Sens. 2012, 33, 5307–5340. [Google Scholar] [CrossRef] [Scilit]
- Mundt, J.T.; County, A.; Pest, W.; Streutker, D.R.; Glenn, N.F. Partial Unmixing of Hyperspectral Imagery: Theory and Methods. In Proceedings of the Event ASPRS Annual Conference 2007: Identifying Geospatial Solutions, Tampa, FL, USA, 7–11 May 2007. [Google Scholar]
- Zhang, X.; Zhao, Z.; Chen, Q.; Chai, W.; Li, Z.; Zhang, G.; Yang, H.; Niu, L. Mapping Hydrothermal Alteration of the Pulang Porphyry Copper Deposit, SW China, Using ASTER and ZY1-02D Satellite Data. Ore Geol. Rev. 2023, 161, 105605. [Google Scholar] [CrossRef] [Scilit]
- Hosseinjani Zadeh, M.; Tangestani, M.H.; Roldan, F.V.; Yusta, I. Sub-Pixel Mineral Mapping of a Porphyry Copper Belt Using EO-1 Hyperion Data. Adv. Space Res. 2014, 53, 440–451. [Google Scholar] [CrossRef] [Scilit]
- Chirico, R.; Mondillo, N.; Laukamp, C.; Mormone, A.; Di Martire, D.; Novellino, A.; Balassone, G. Mapping Hydrothermal and Supergene Alteration Zones Associated with Carbonate-Hosted Zn-Pb Deposits by Using PRISMA Satellite Imagery Supported by Field-Based Hyperspectral Data, Mineralogical and Geochemical Analysis. Ore Geol. Rev. 2023, 152, 105244. [Google Scholar] [CrossRef] [Scilit]
- Vapnik, V. The Nature of Statistical Learning Theory; Springer Science\& Business Media: Berlin/Heidelberg, Germany, 1995. [Google Scholar]
- Xi, J.; Jiang, Q.; Liu, H.; Gao, X. Lithological Mapping Research Based on Feature Selection Model of ReliefF-RF. Appl. Sci. 2023, 13, 11225. [Google Scholar] [CrossRef] [Scilit]
- Teodoro, A.C.M.; Santos, D.; Cardoso-Fernandes, J.; Lima, A.; Brönner, M. Identification of Pegmatite Bodies, at a Province Scale, Using Machine Learning Algorithms: Preliminary Results. Earth Resour. Environ. Remote Sens. 2021, 1186308, 40–52. [Google Scholar] [CrossRef] [Scilit]
- Roy, D.P.; Zhang, H.K.; Ju, J.; Gomez-Dans, J.L.; Lewis, P.E.; Schaaf, C.B.; Sun, Q.; Li, J.; Huang, H.; Kovalskyy, V. A General Method to Normalize Landsat Reflectance Data to Nadir BRDF Adjusted Reflectance. Remote Sens. Environ. 2016, 176, 255–271. [Google Scholar] [CrossRef] [Scilit]
- Claverie, M.; Ju, J.; Masek, J.G.; Dungan, J.L.; Vermote, E.F.; Roger, J.C.; Skakun, S.V.; Justice, C. The Harmonized Landsat and Sentinel-2 Surface Reflectance Data Set. Remote Sens. Environ. 2018, 219, 145–161. [Google Scholar] [CrossRef] [Scilit]
- Pournamdari, M.; Hashim, M.; Pour, A.B. Spectral Transformation of ASTER and Landsat TM Bands for Lithological Mapping of Soghan Ophiolite Complex, South Iran. Adv. Space Res. 2014, 54, 694–709. [Google Scholar] [CrossRef] [Scilit]
- Laukamp, C. Geological Mapping Using Mineral Absorption Feature-Guided Band-Ratios Applied to Prisma Satellite Hyperspectral Level 2D Imagery. In IGARSS 2022—2022 IEEE International Geoscience and Remote Sensing Symposium; IEEE: New York, NY, USA, 2022; pp. 5981–5984. [Google Scholar]
- Madani, A.A.; Emam, A.A. SWIR ASTER Band Ratios for Lithological Mapping and Mineral Exploration: A Case Study from El Hudi Area, Southeastern Desert, Egypt. Arab. J. Geosci. 2011, 4, 45–52. [Google Scholar] [CrossRef] [Scilit]
- Cardoso-Fernandes, J.; Teodoro, A.; Lima, A. Potential of Sentinel-2 Data in the Detection of Lithium (Li)-Bearing Pegmatites: A Study Case. Earth Resour. Environ. Remote Sens. 2018, 10790, 201–215. [Google Scholar] [CrossRef] [Scilit]
- Crosta, A.P.; Moore, J.M. Enhancement of Landsat Thematic Mapper Imagery for Residual Soil Mapping in SW Minais Gerais State, Brazil: A Prospecting Case History in Greenstone Belt Terrain. In 7th Thematic Conference on Remote Sensing for Exploration Geology; Environmental Research Institute of Michigan (ERIM): Ann Arbor, MI, USA, 1989; pp. 1173–1187. [Google Scholar]
- Douzas, G.; Rauch, R.; Bacao, F. G-SOMO: An Oversampling Approach Based on Self-Organized Maps and Geometric SMOTE. Expert Syst. Appl. 2021, 183, 115230. [Google Scholar] [CrossRef] [Scilit]
- Mamouch, Y.; Attou, A.; Miftah, A.; Ouchchen, M.; Dadi, B.; Achkouch, L.; Et-Tayea, Y.; Allaoui, A.; Boualoul, M.; Randazzo, G.; et al. Mapping of Hydrothermal Alteration Zones in the Kelâat M’Gouna Region Using Airborne Gamma-Ray Spectrometry and Remote Sensing Data: Mining Implications (Eastern Anti-Atlas, Morocco). Appl. Sci. 2022, 12, 957. [Google Scholar] [CrossRef] [Scilit]
- Esri Fuzzy Overlay (Spatial Analyst). Available online: https://pro.arcgis.com/en/pro-app/latest/tool-reference/spatial-analyst/fuzzy-overlay.htm (accessed on 30 June 2023).
- Abdelkareem, M.; Al-Arifi, N. Synergy of Remote Sensing Data for Exploring Hydrothermal Mineral Resources Using GIS-Based Fuzzy Logic Approach. Remote Sens. 2021, 13, 4492. [Google Scholar] [CrossRef] [Scilit]
- Wang, R.; Ramanaidou, E.; Kirkland, C.L.; Pejcic, B.; Laukamp, C.; Verrall, M.; Schoneveld, L.E.; Owen, N.; Huang, S.; Bath, A.; et al. Genesis of Cookeite, the Primary Lithium Mineral in the Late Carboniferous Strata of the North China Craton. Ore Geol. Rev. 2025, 186, 106903. [Google Scholar] [CrossRef] [Scilit]
- Kamps, O.M.; van Ruitenbeek, F.J.A.; Mason, P.R.D.; van der Meer, F.D. Near-Infrared Spectroscopy of Hydrothermal versus Low-Grade Metamorphic Chlorites. Minerals 2018, 8, 259. [Google Scholar] [CrossRef] [Scilit]
- King, T.V.V.; Clark, R.N. Spectral Characteristics of Chlorites and Mg-Serpentines Using High-Resolution Reflectance Spectroscopy. J. Geophys. Res. 1989, 94, 13997–14008. [Google Scholar] [CrossRef] [Scilit]
- Pereira, I.; García-Meléndez, E.; Ferrer-Julià, M.; van der Werff, H.; Valenzuela, P.; Cruz, J.A. Multi-Temporal Mineral Mapping in Two Torrential Basins Using PRISMA Hyperspectral Imagery. Remote Sens. 2025, 17, 2582. [Google Scholar] [CrossRef] [Scilit]
- Dias, F.; Ribeiro, R.; Gonçalves, F.; Lima, A.; Roda-Robles, E.; Martins, T. Calibrating a Handheld LIBS for Li Exploration in the Barroso–Alvão Aplite-Pegmatite Field, Northern Portugal: Textural Precautions and Procedures When Analyzing Spodumene and Petalite. Minerals 2023, 13, 470. [Google Scholar] [CrossRef] [Scilit]
- Santini, F.; Palombo, A. Impact of Topographic Correction on PRISMA Sentinel 2 and Landsat 8 Images. Remote Sens. 2022, 14, 3903. [Google Scholar] [CrossRef] [Scilit]
- Arian, H.; Alaminia, Z.; Ahmadi, H.; Pour, A.B.; Tabatabaei Manesh, S.M.; Lentz, D.R.; Parsa, L. Mapping Potential Zones of Lithium-Bearing Pegmatites Using ASTER and Sentinel-2 Remote Sensing Imagery in the Tagablor Pegmatite Field, Central Afghanistan. Remote Sens. Appl. 2025, 38, 101625. [Google Scholar] [CrossRef] [Scilit]
- Osman, H.; Azer, M.K.; Zaky, K.S.; Ali, S.; Farahat, E.S.; Abo Khashaba, S.M. Integrating Multi-Source Remote Sensing, Field Work, and Petrography for Automatic Lithological Mapping and Mineralization Potential in the Gabal El-Faraid, Egypt. Sci. Rep. 2026, 16, 17370. [Google Scholar] [CrossRef] [Scilit] [PubMed]
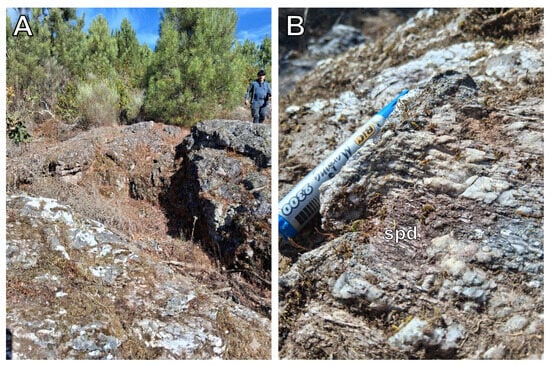
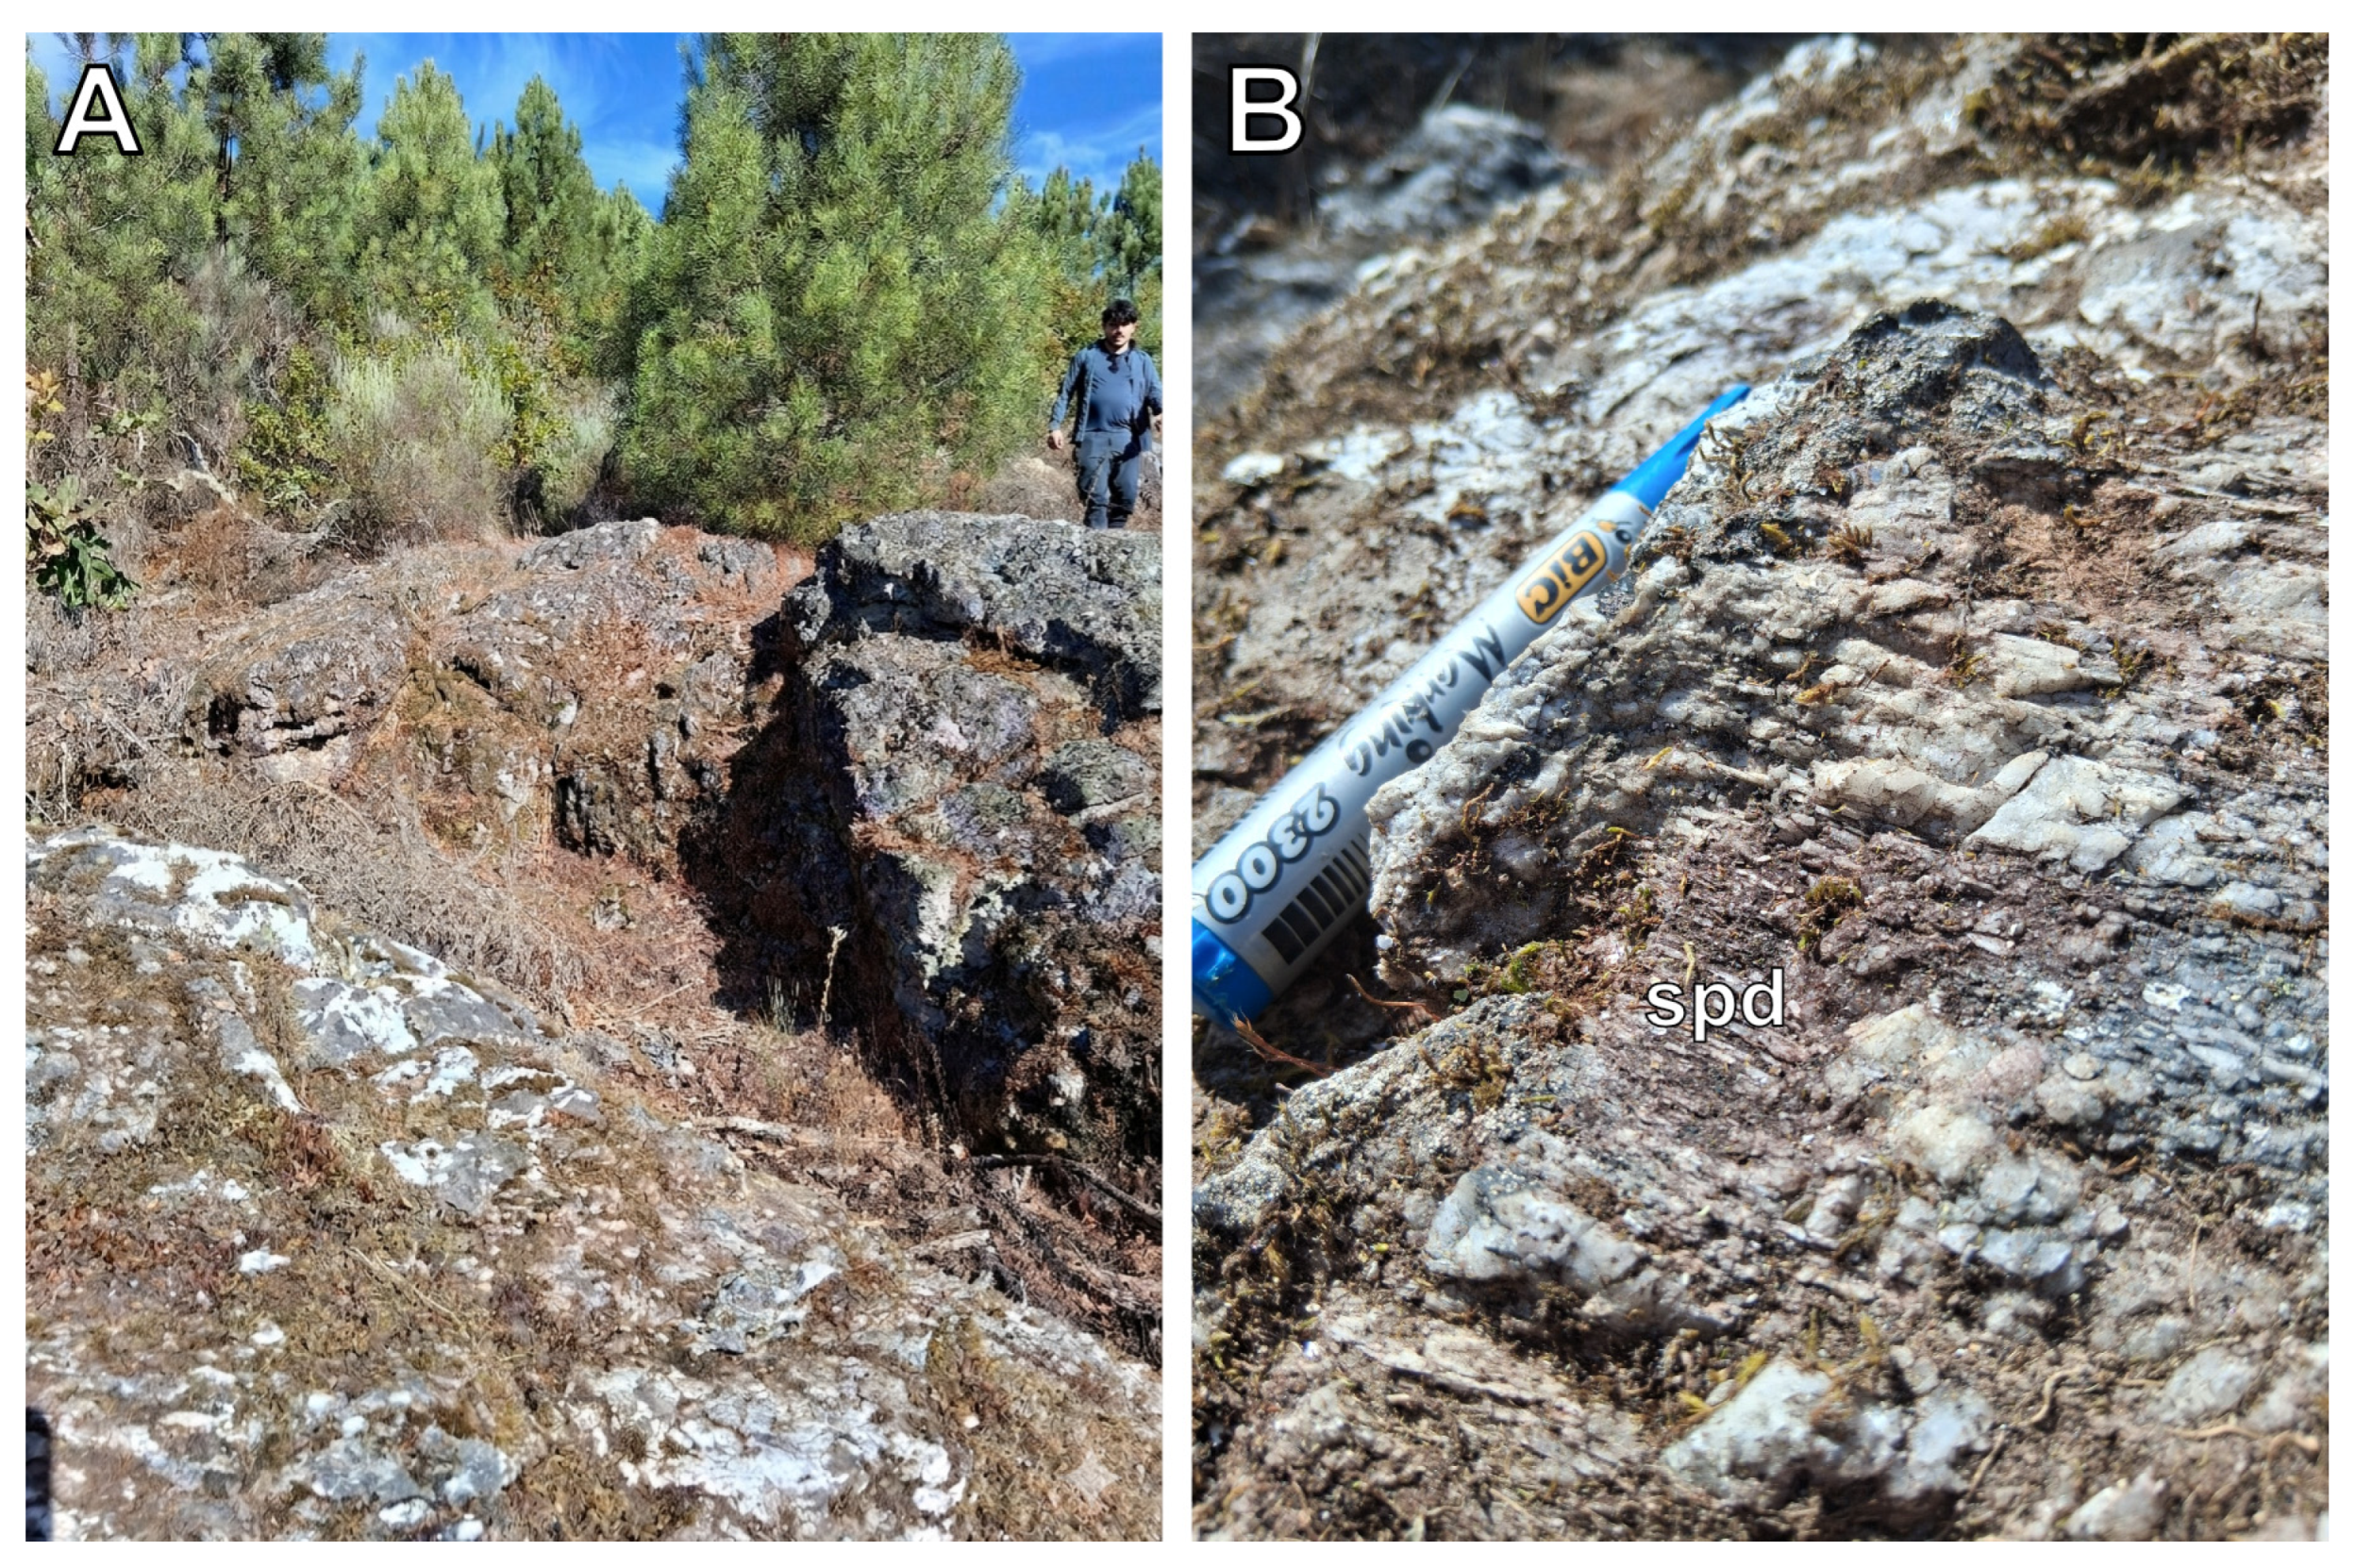
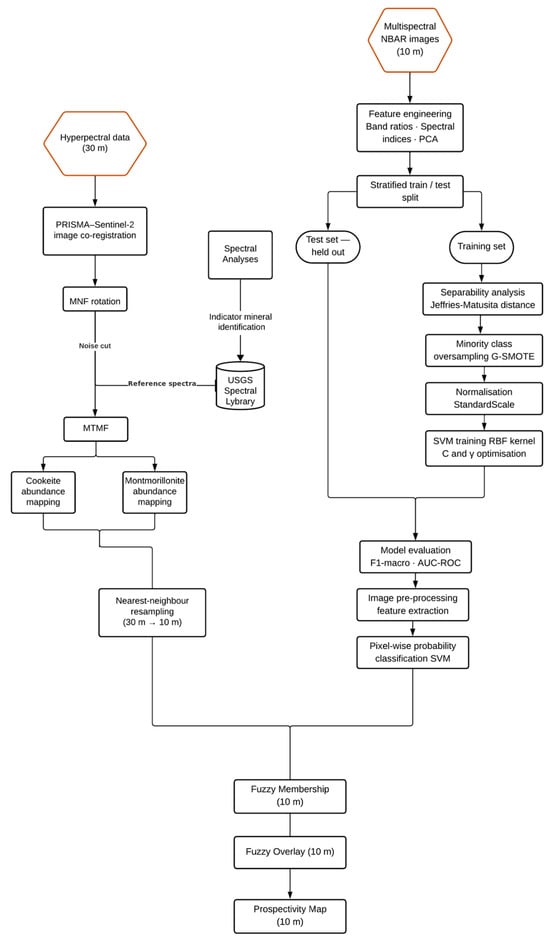
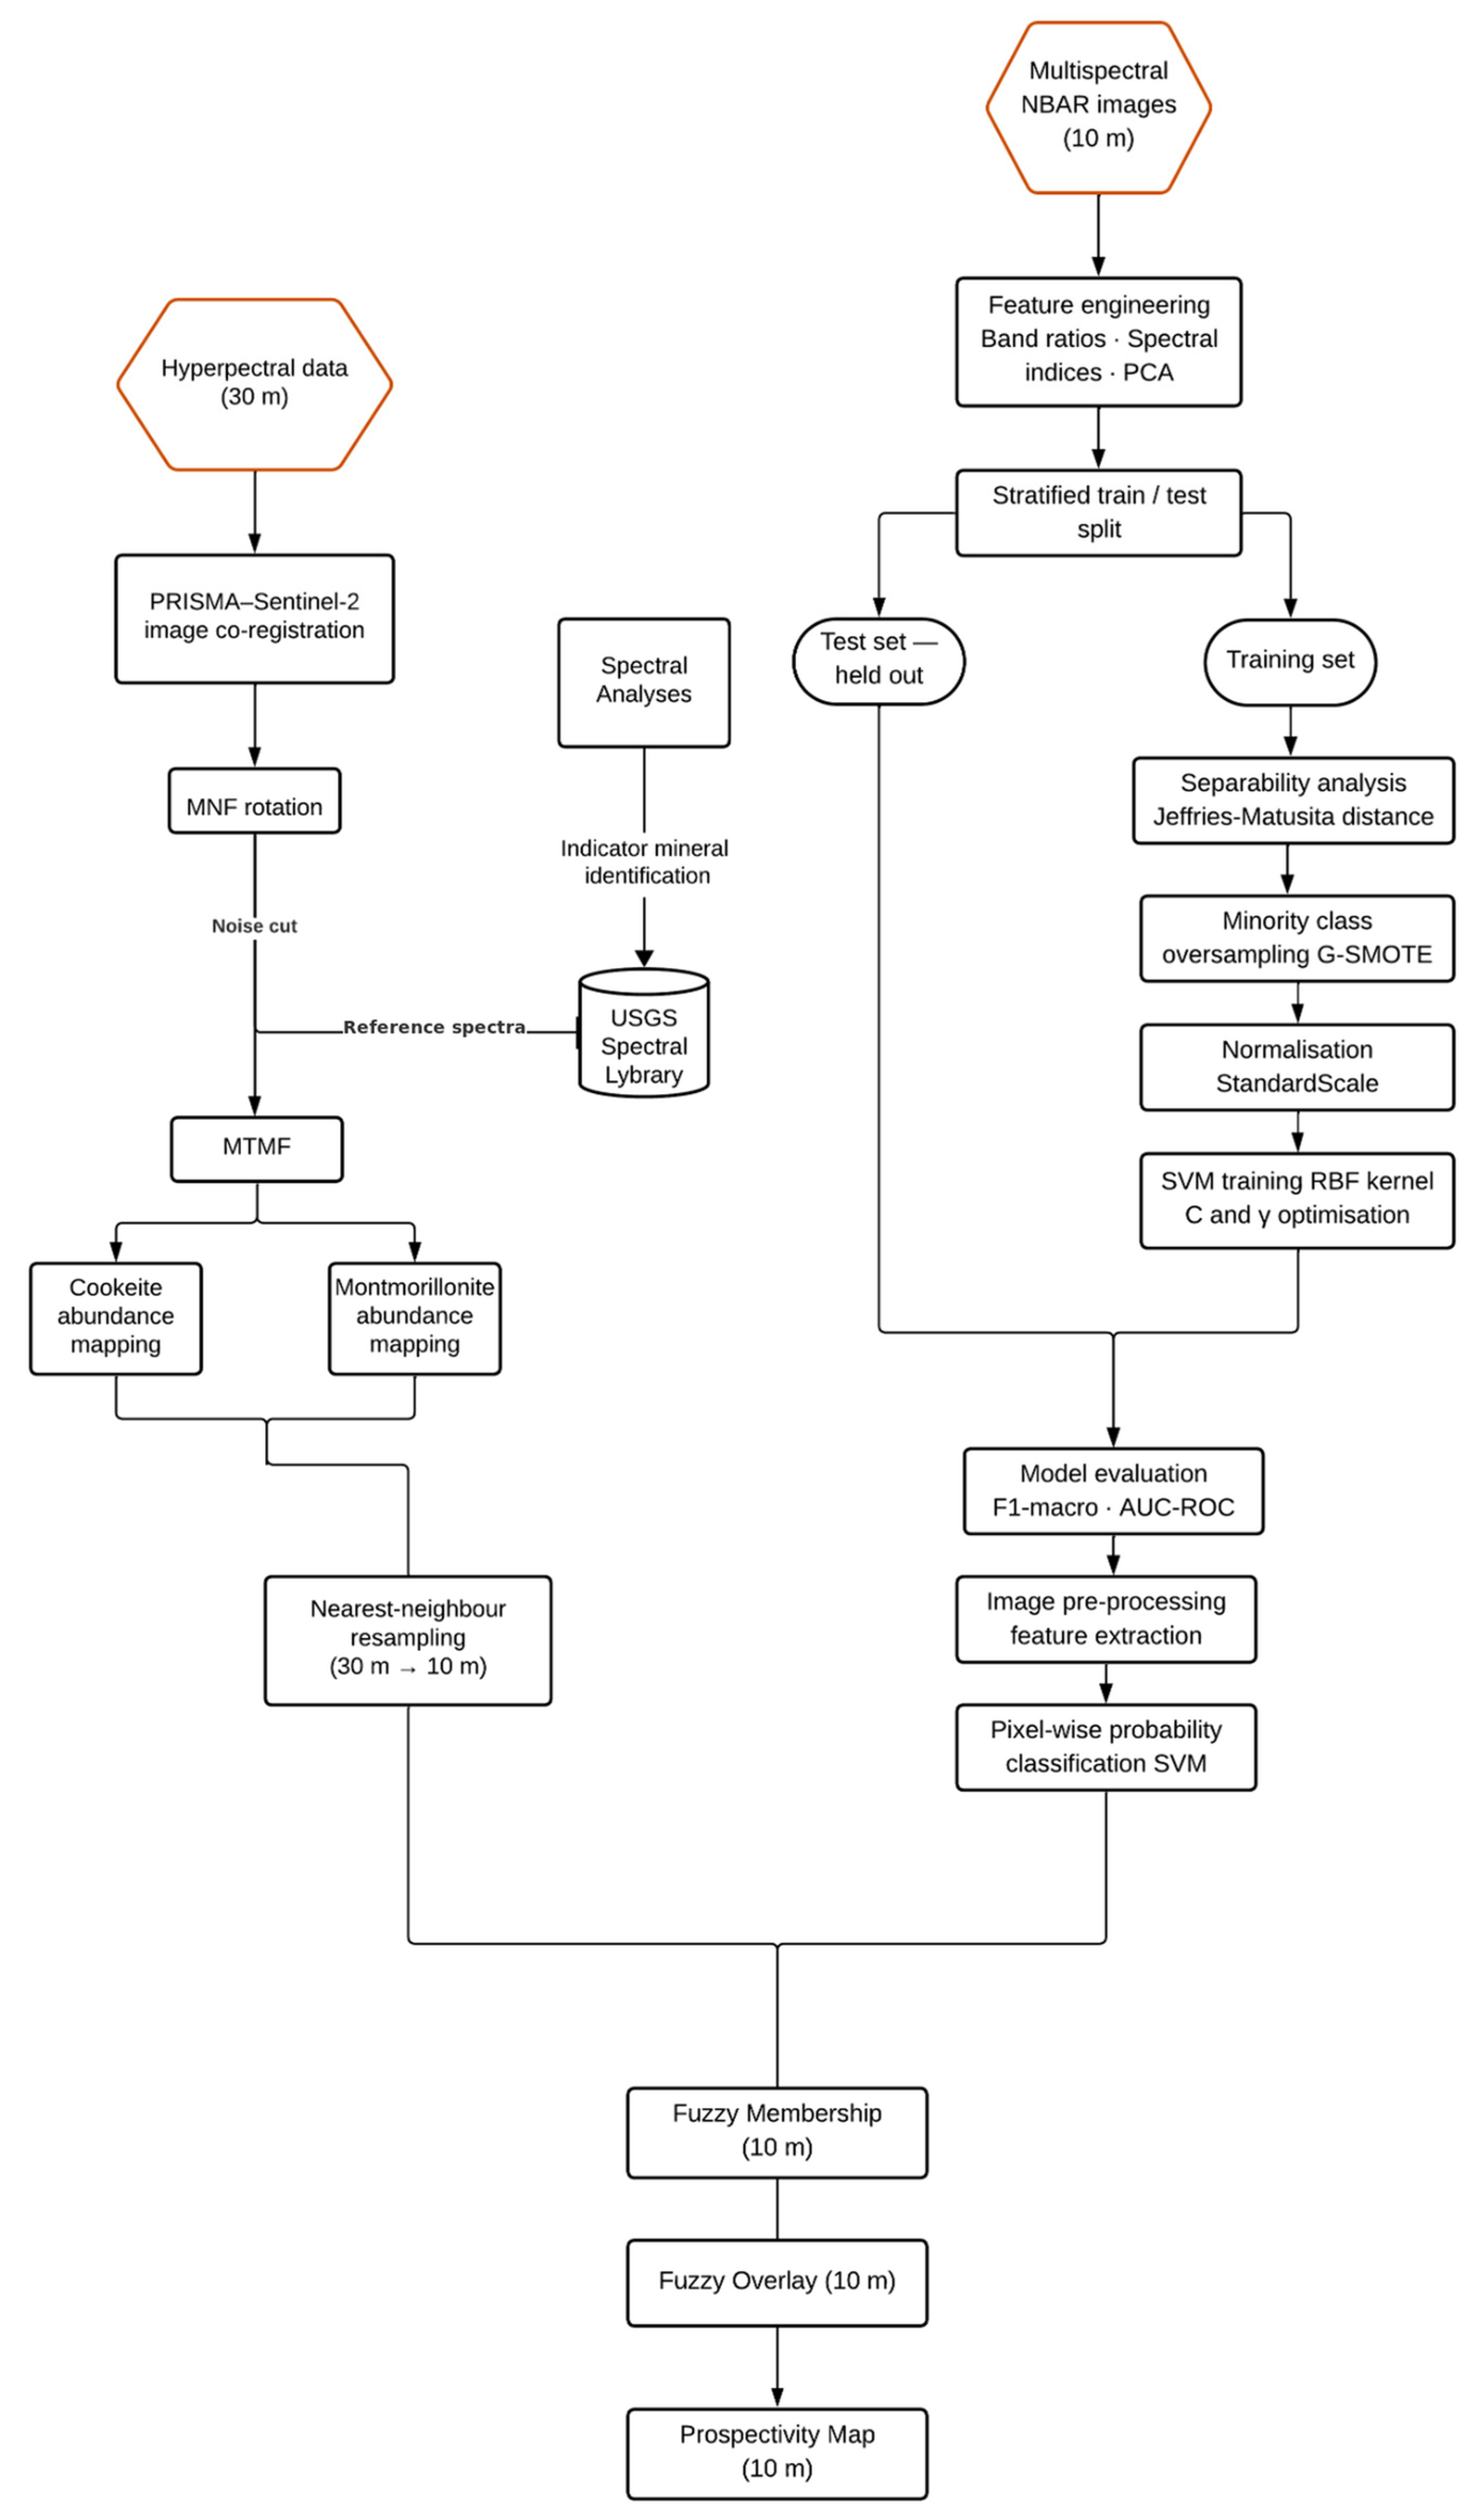
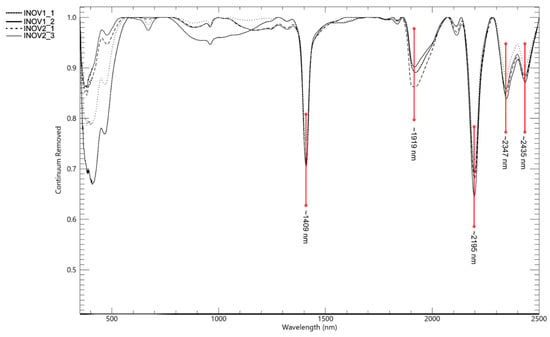
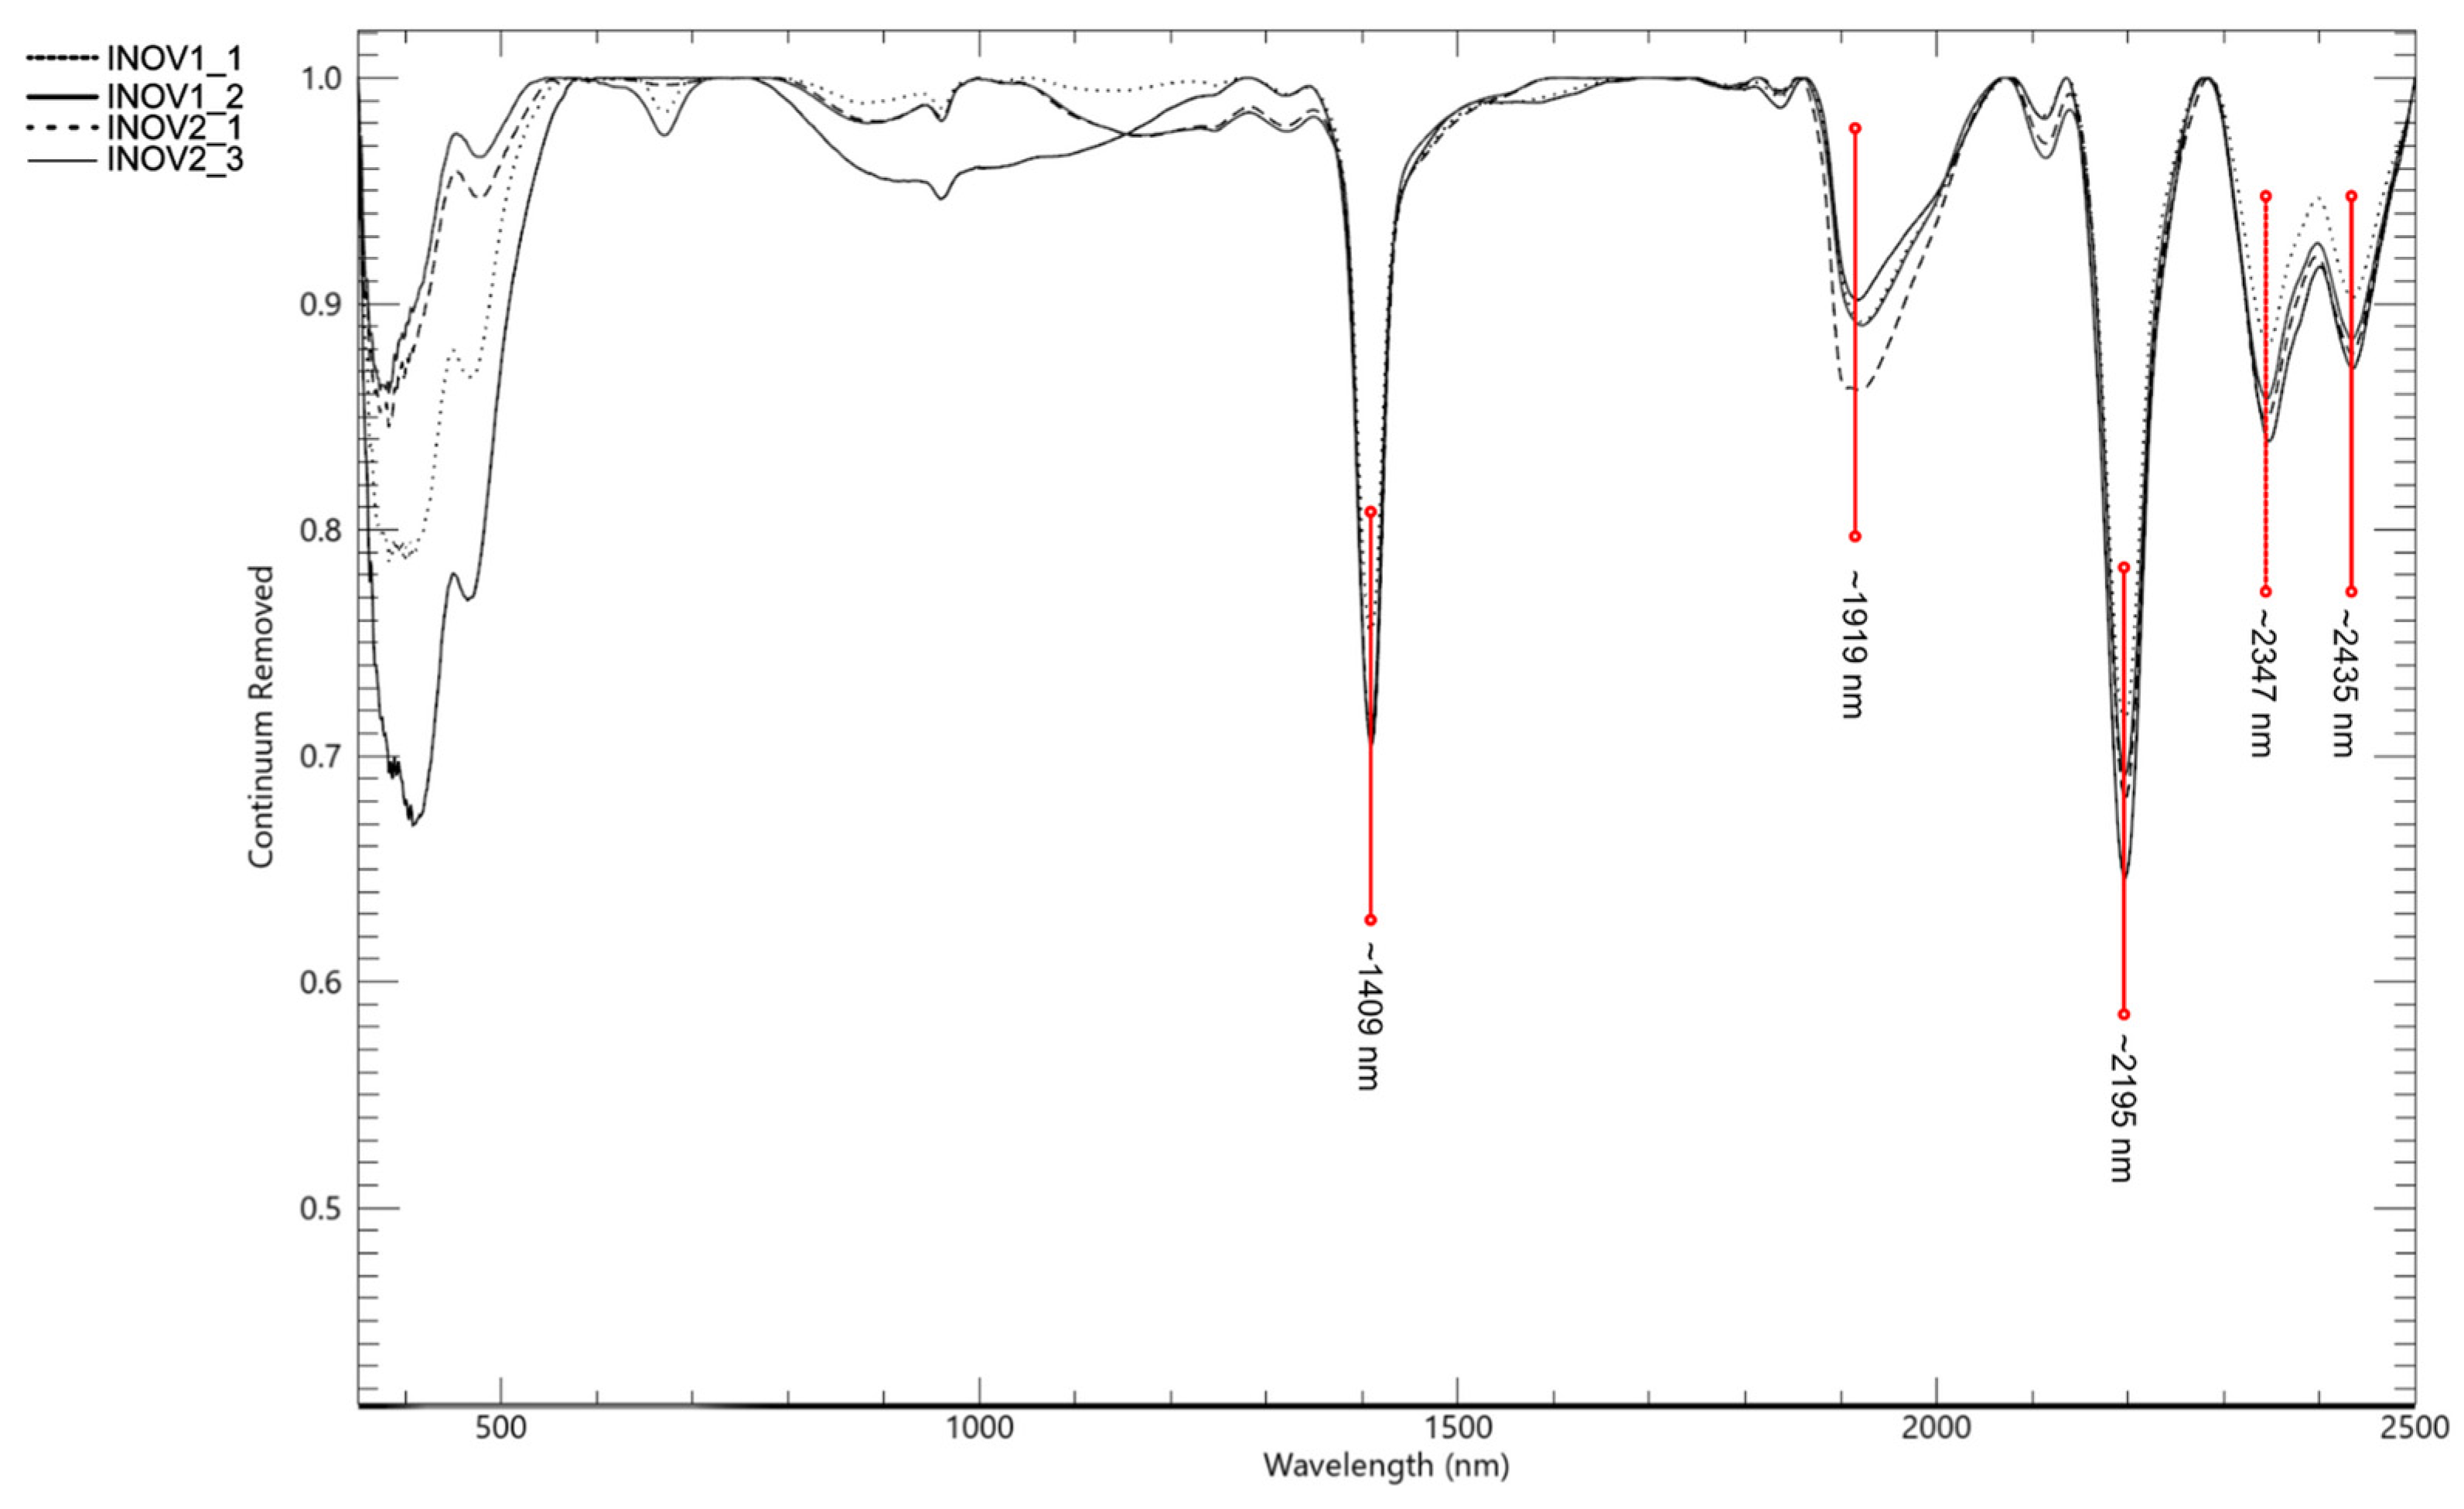
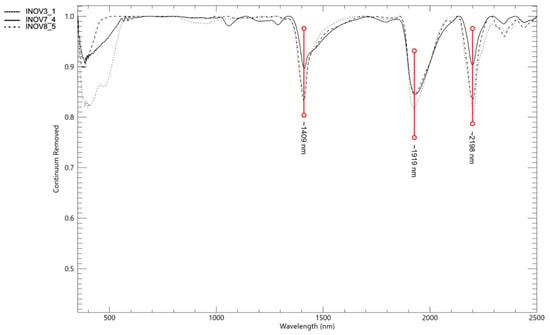
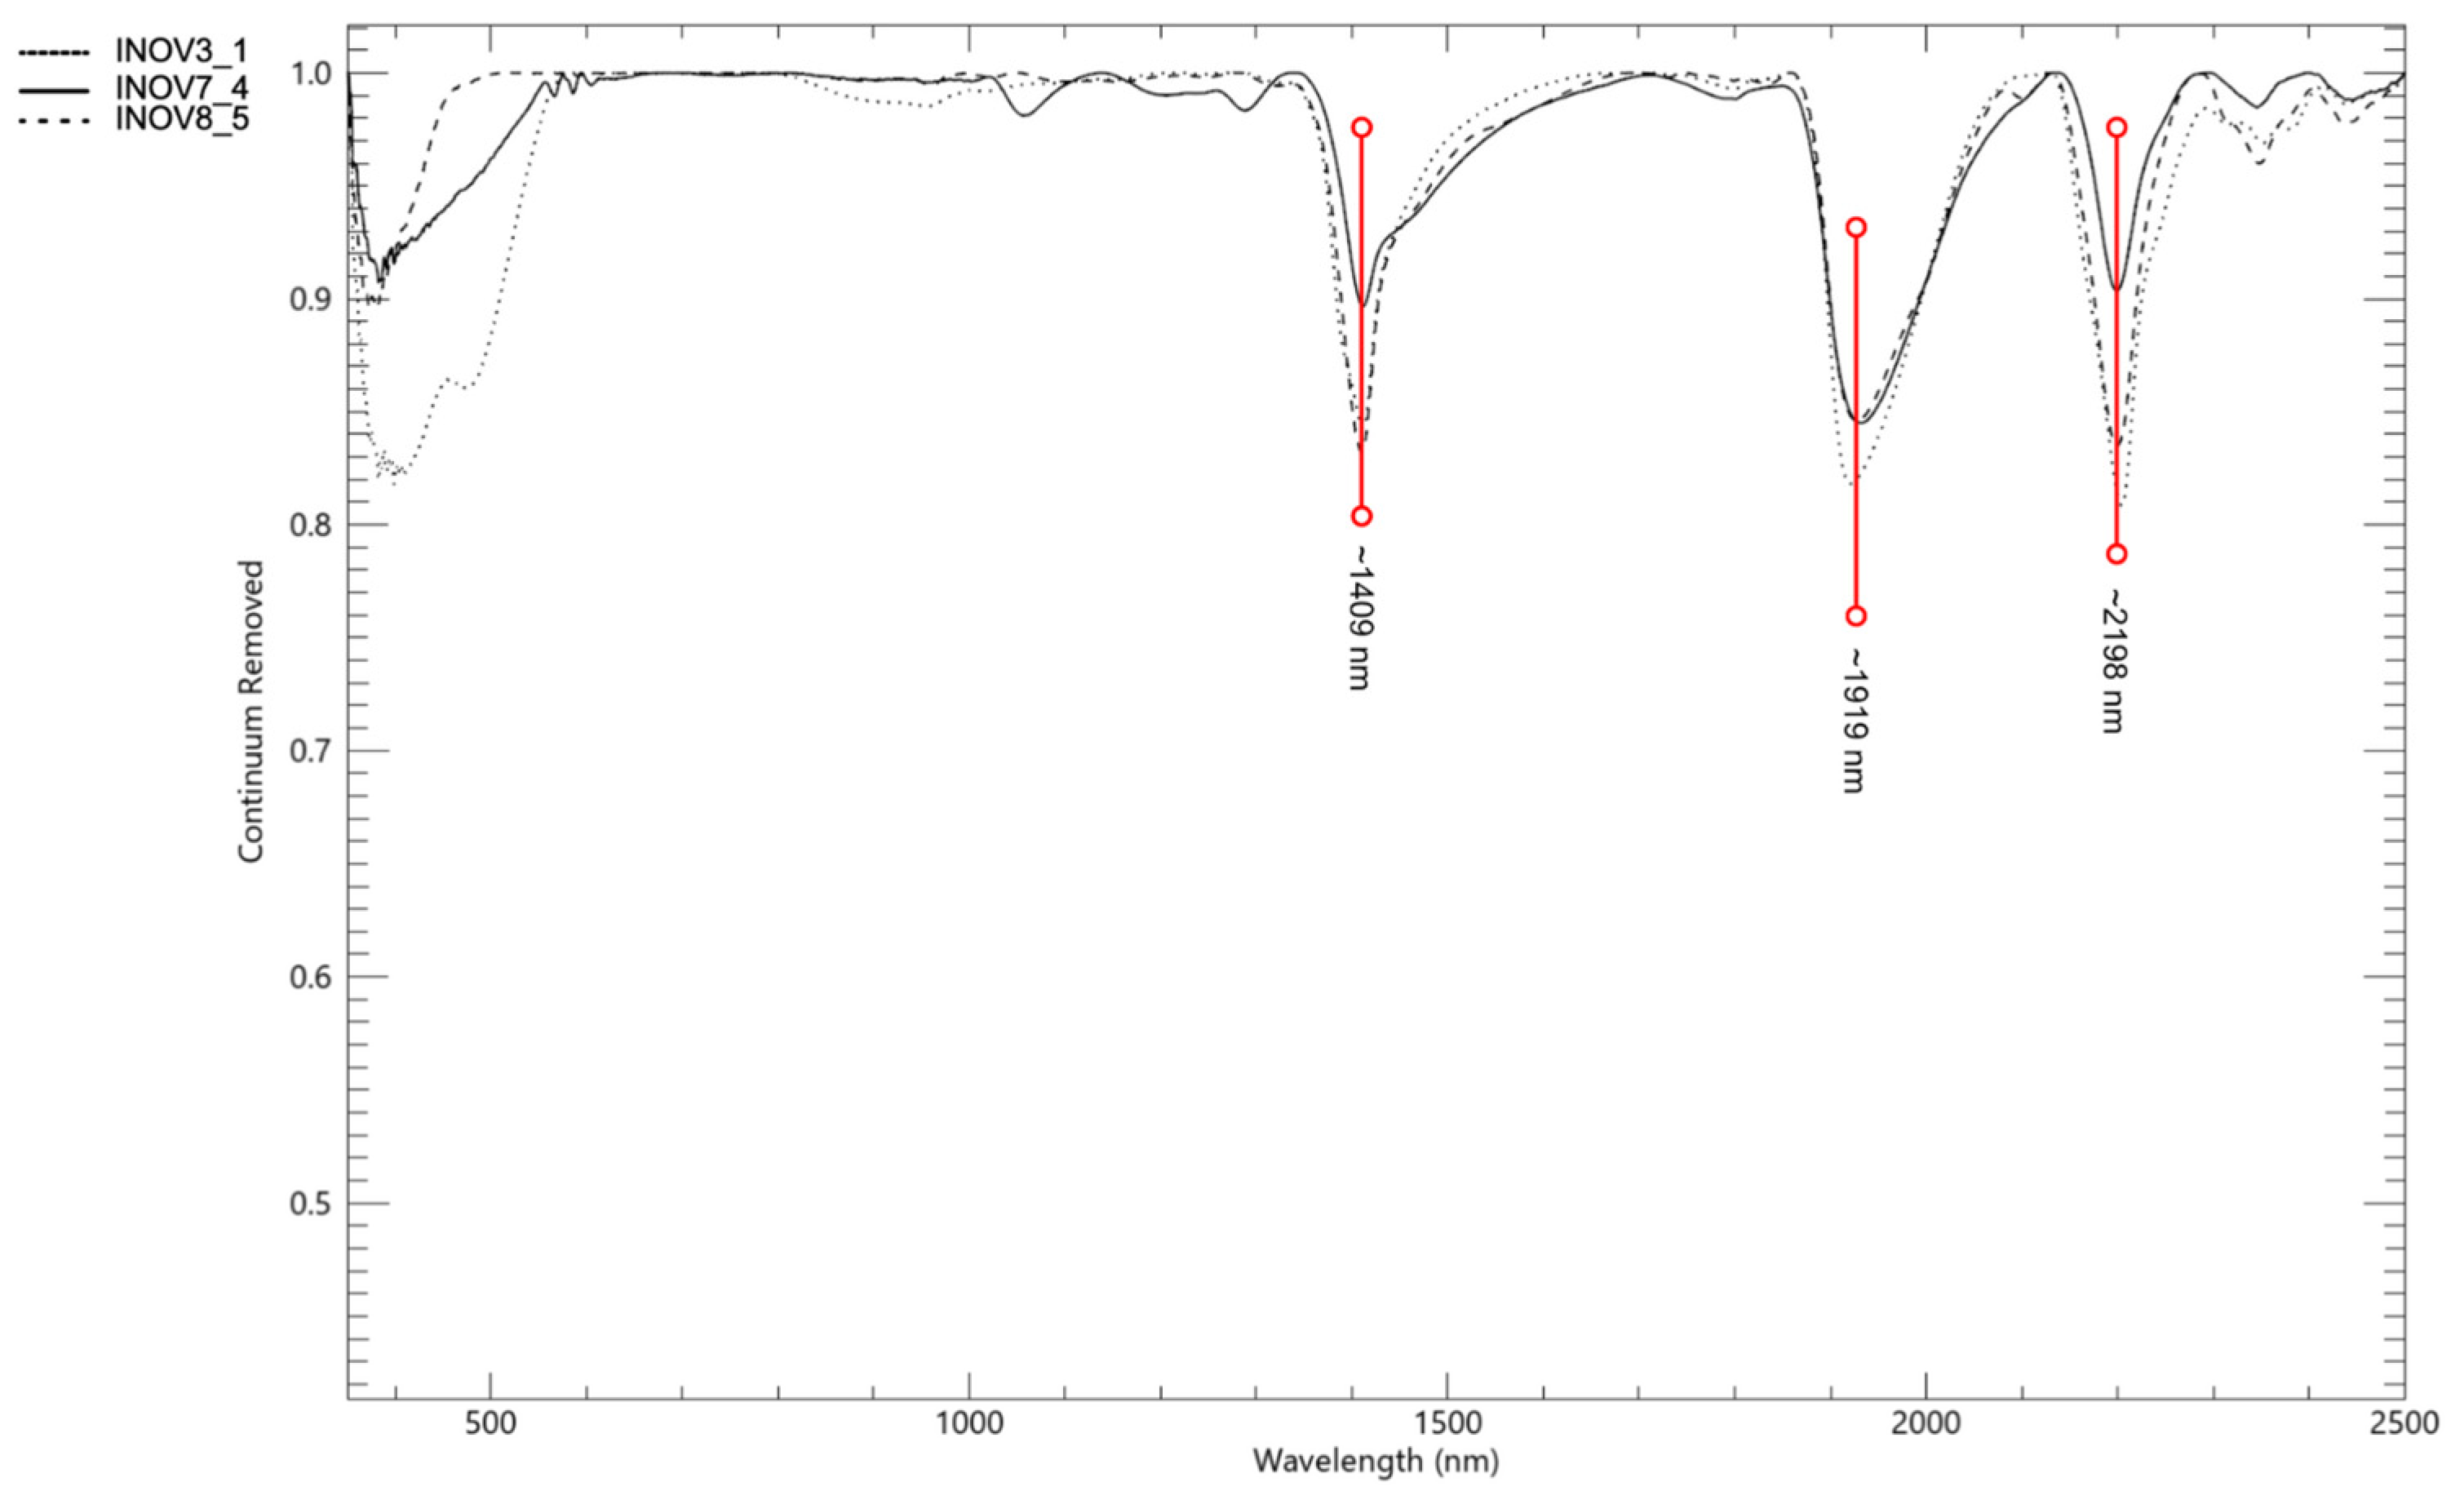
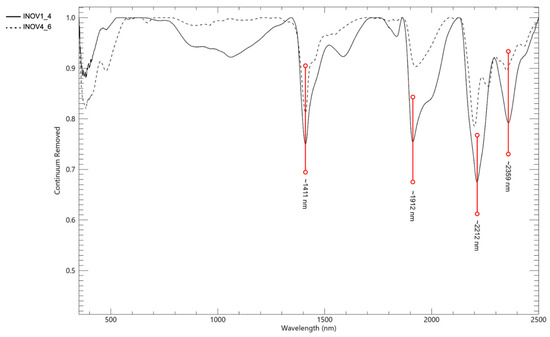
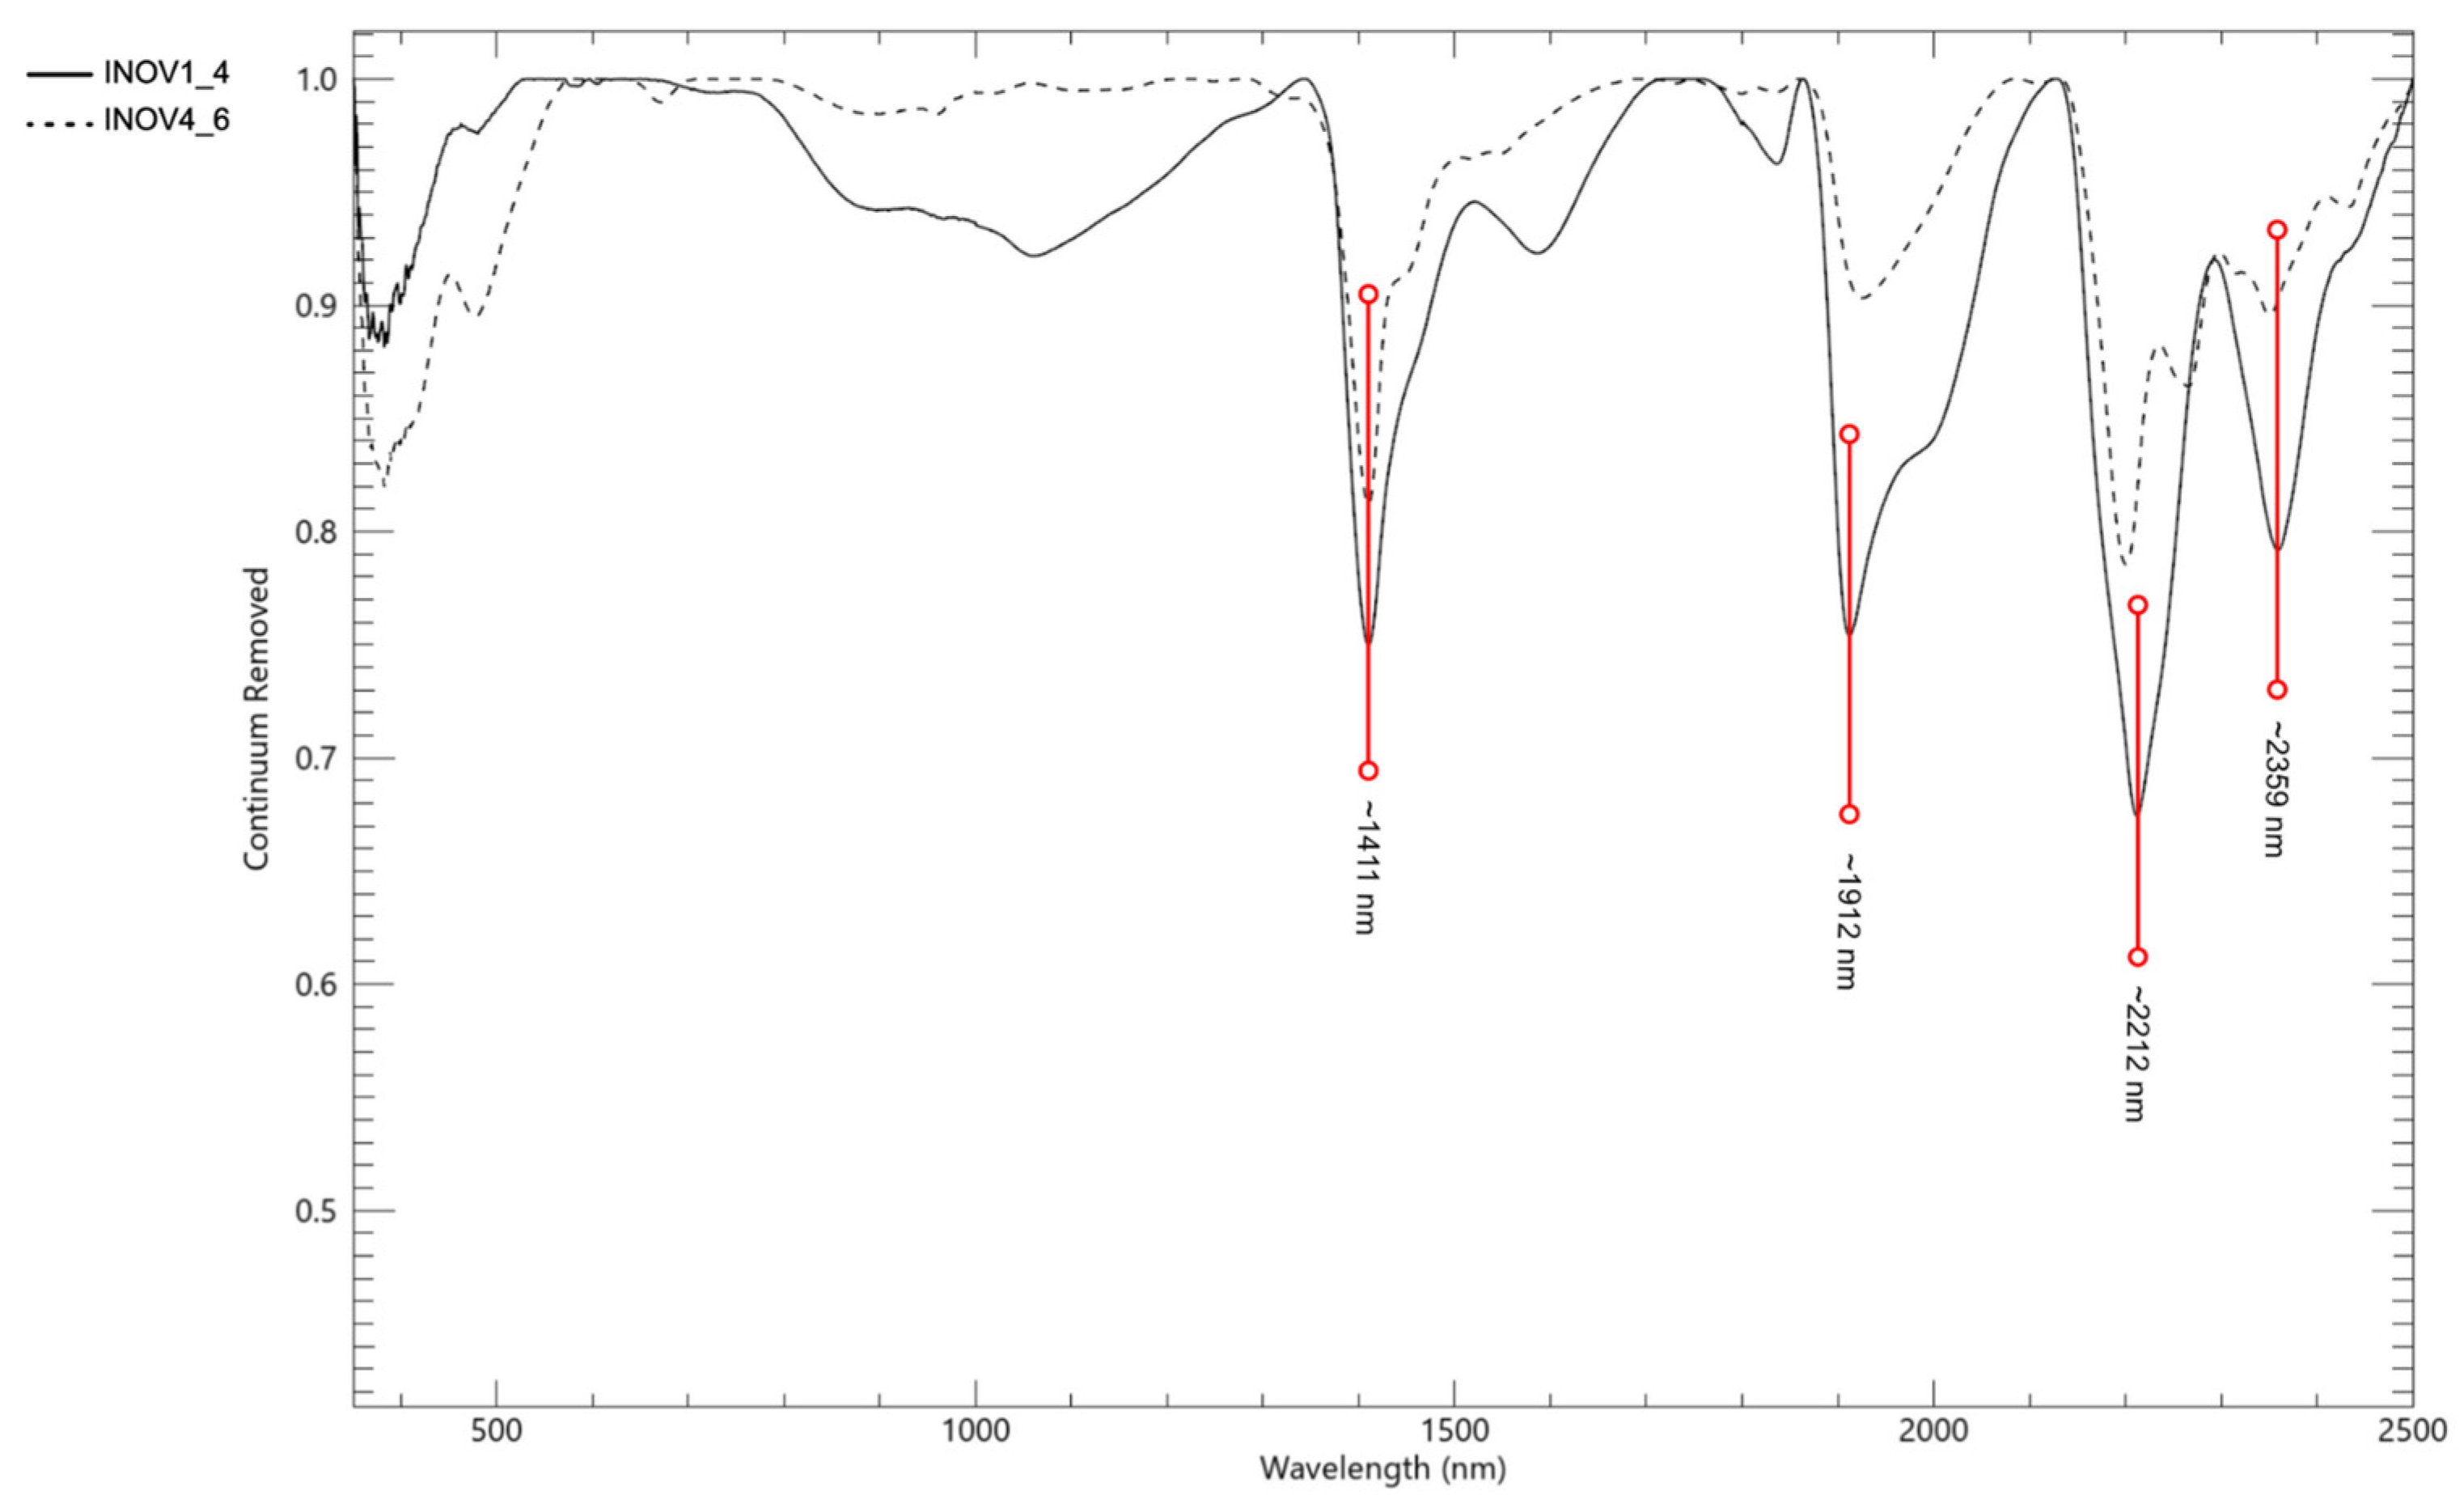
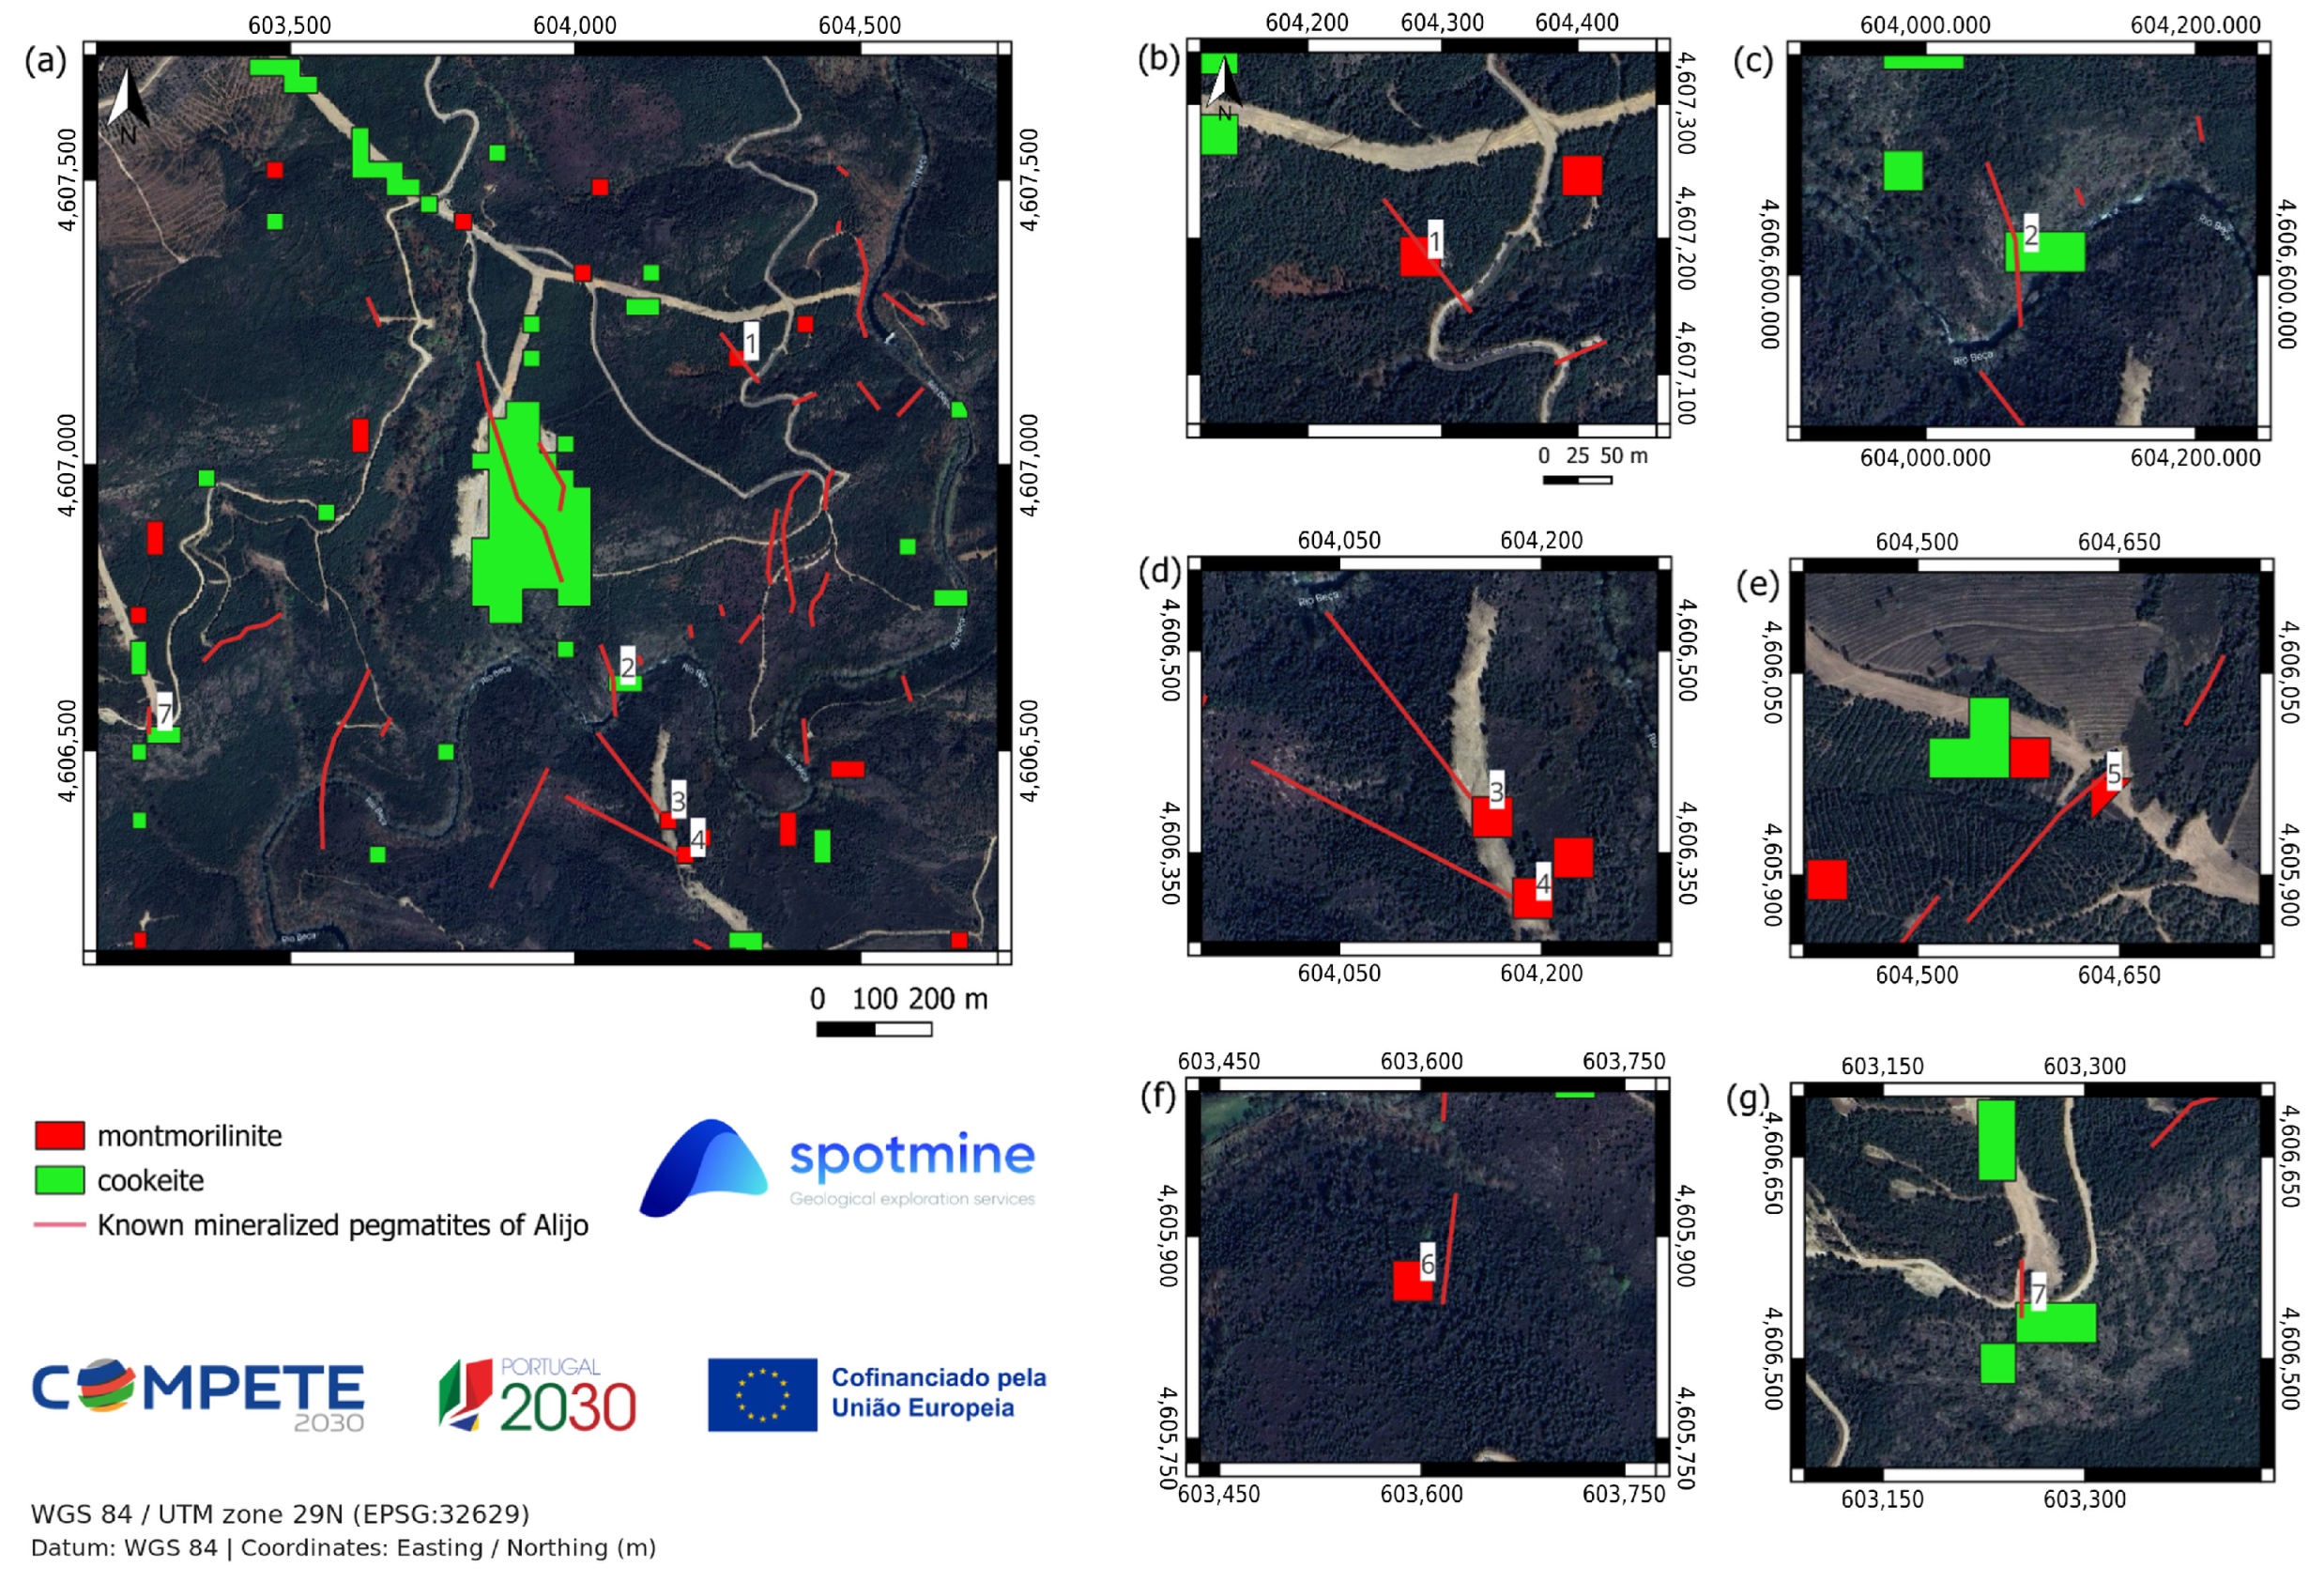
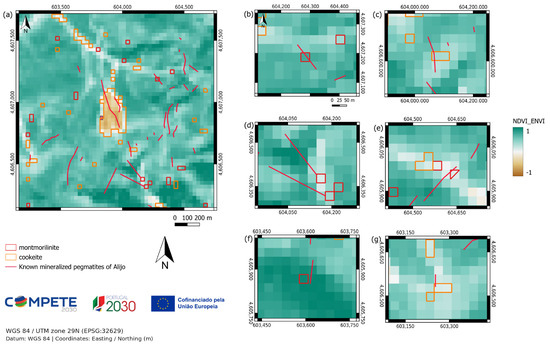
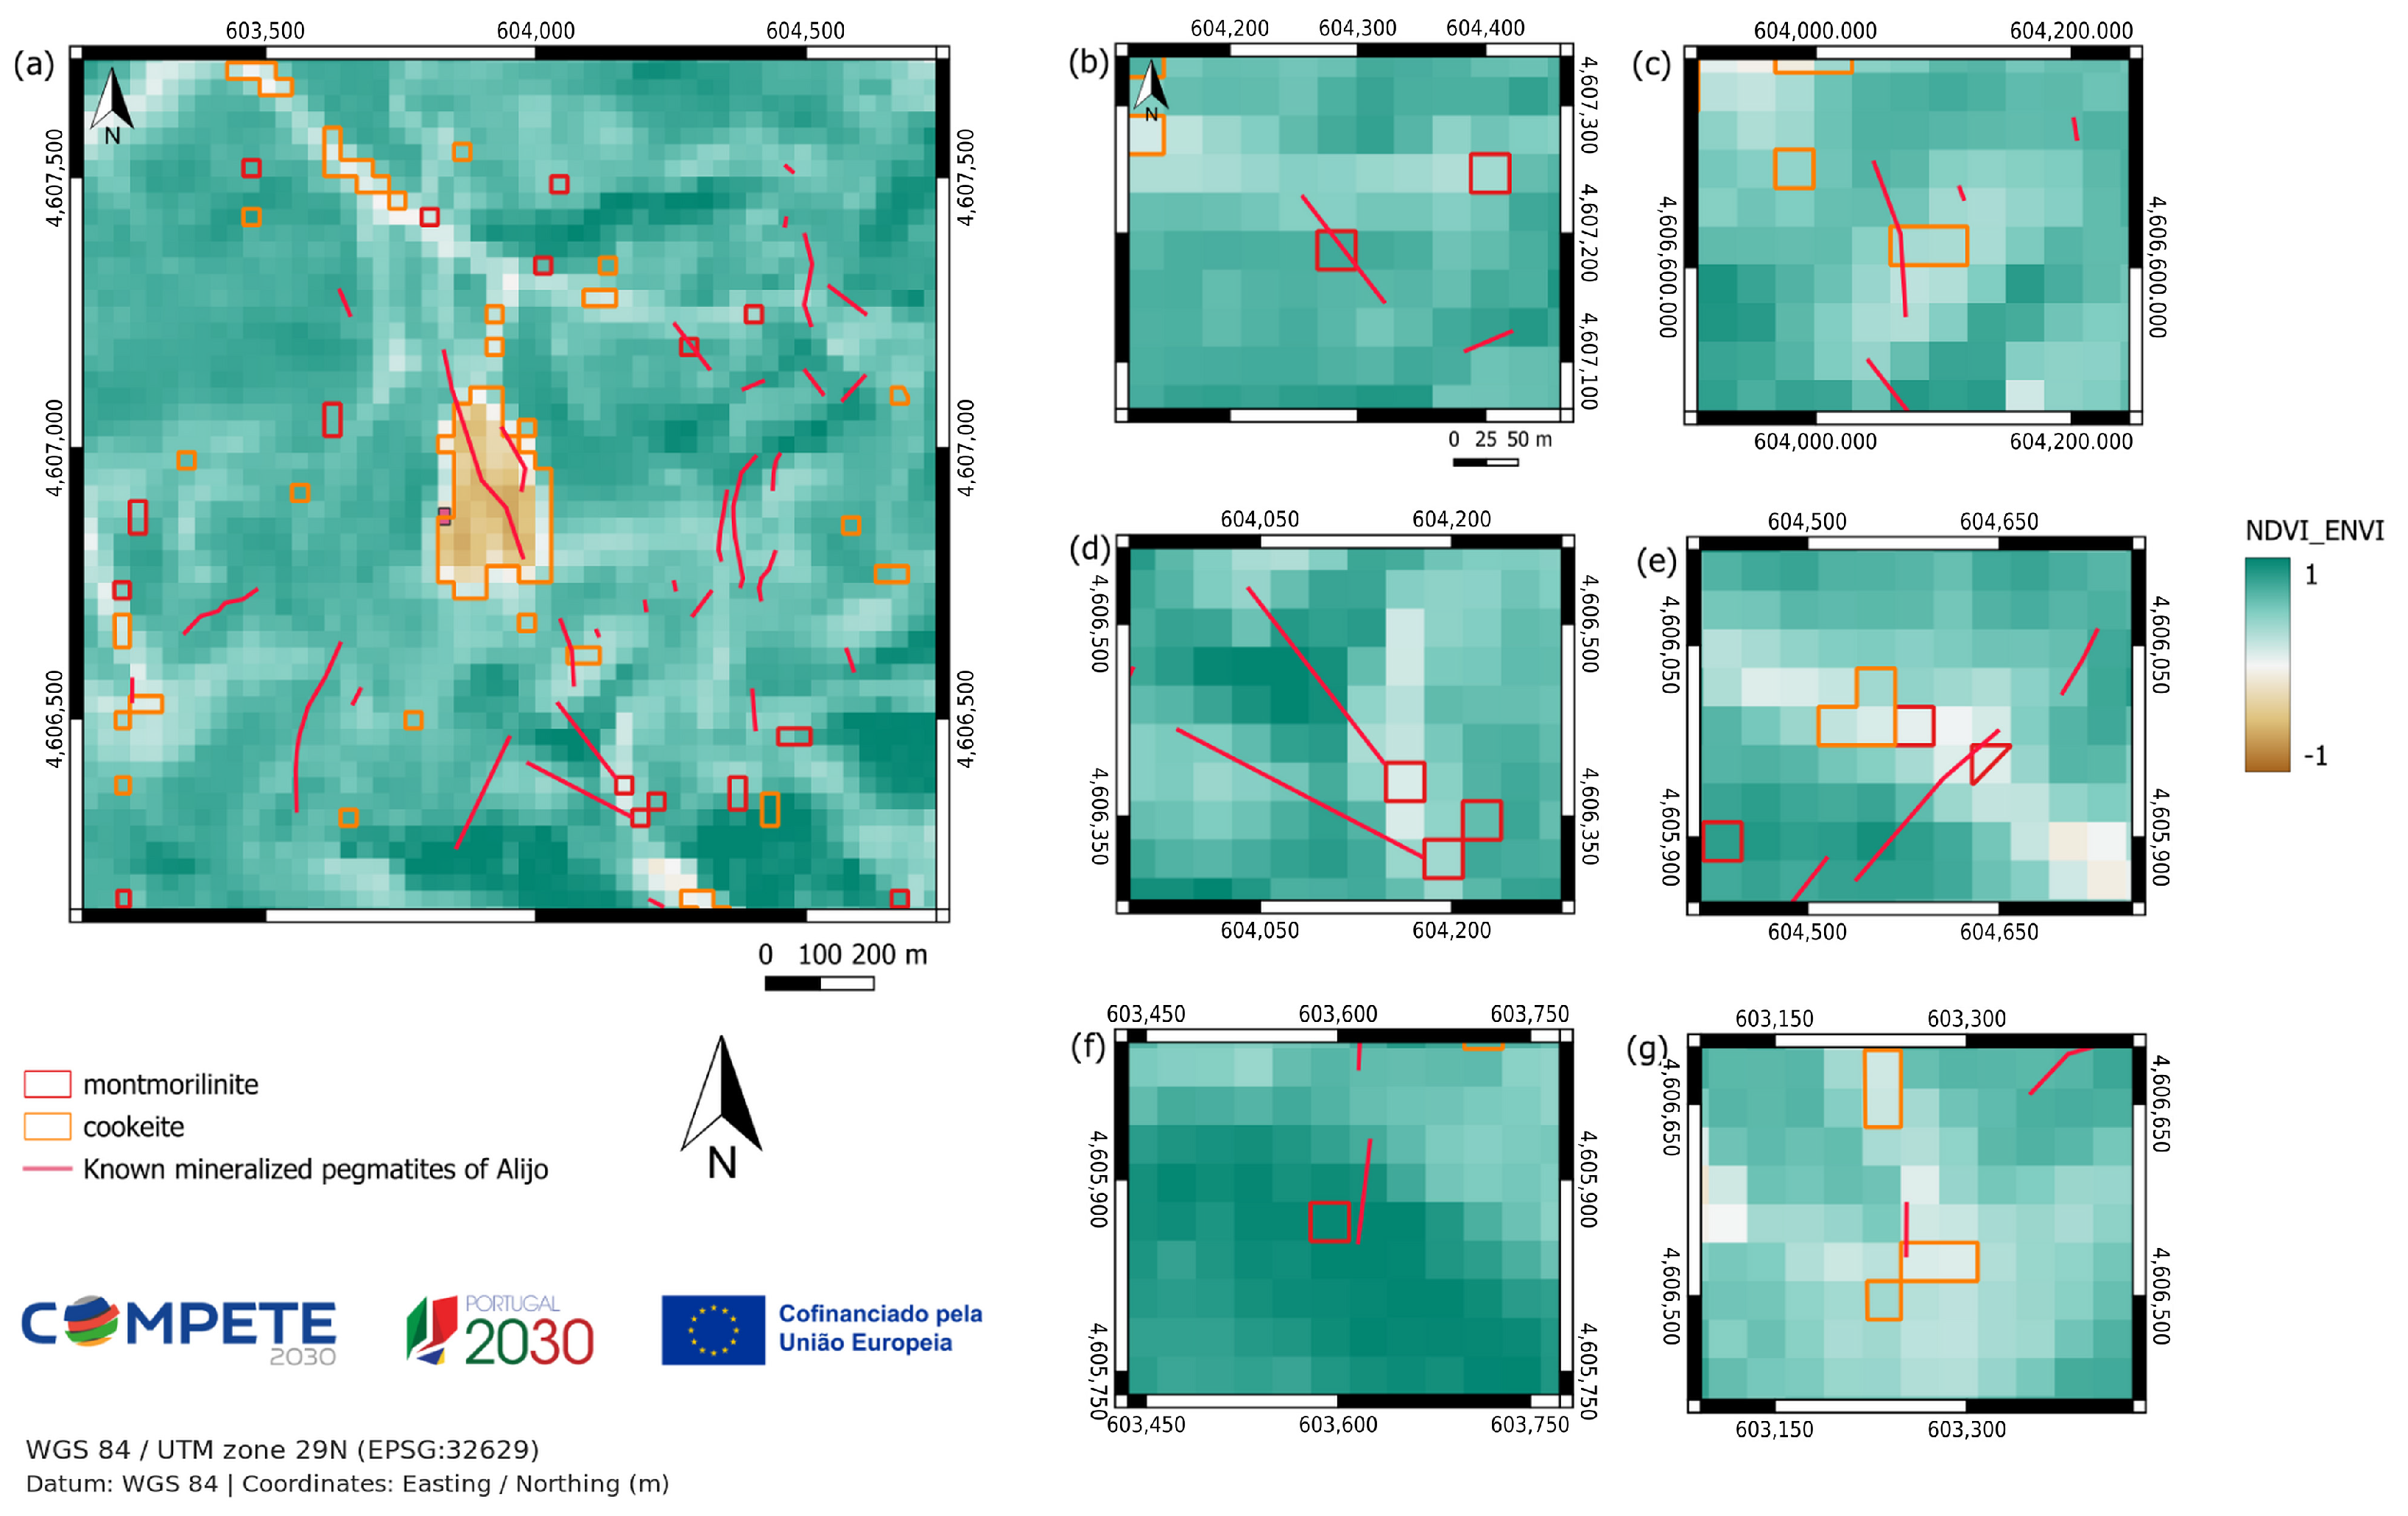
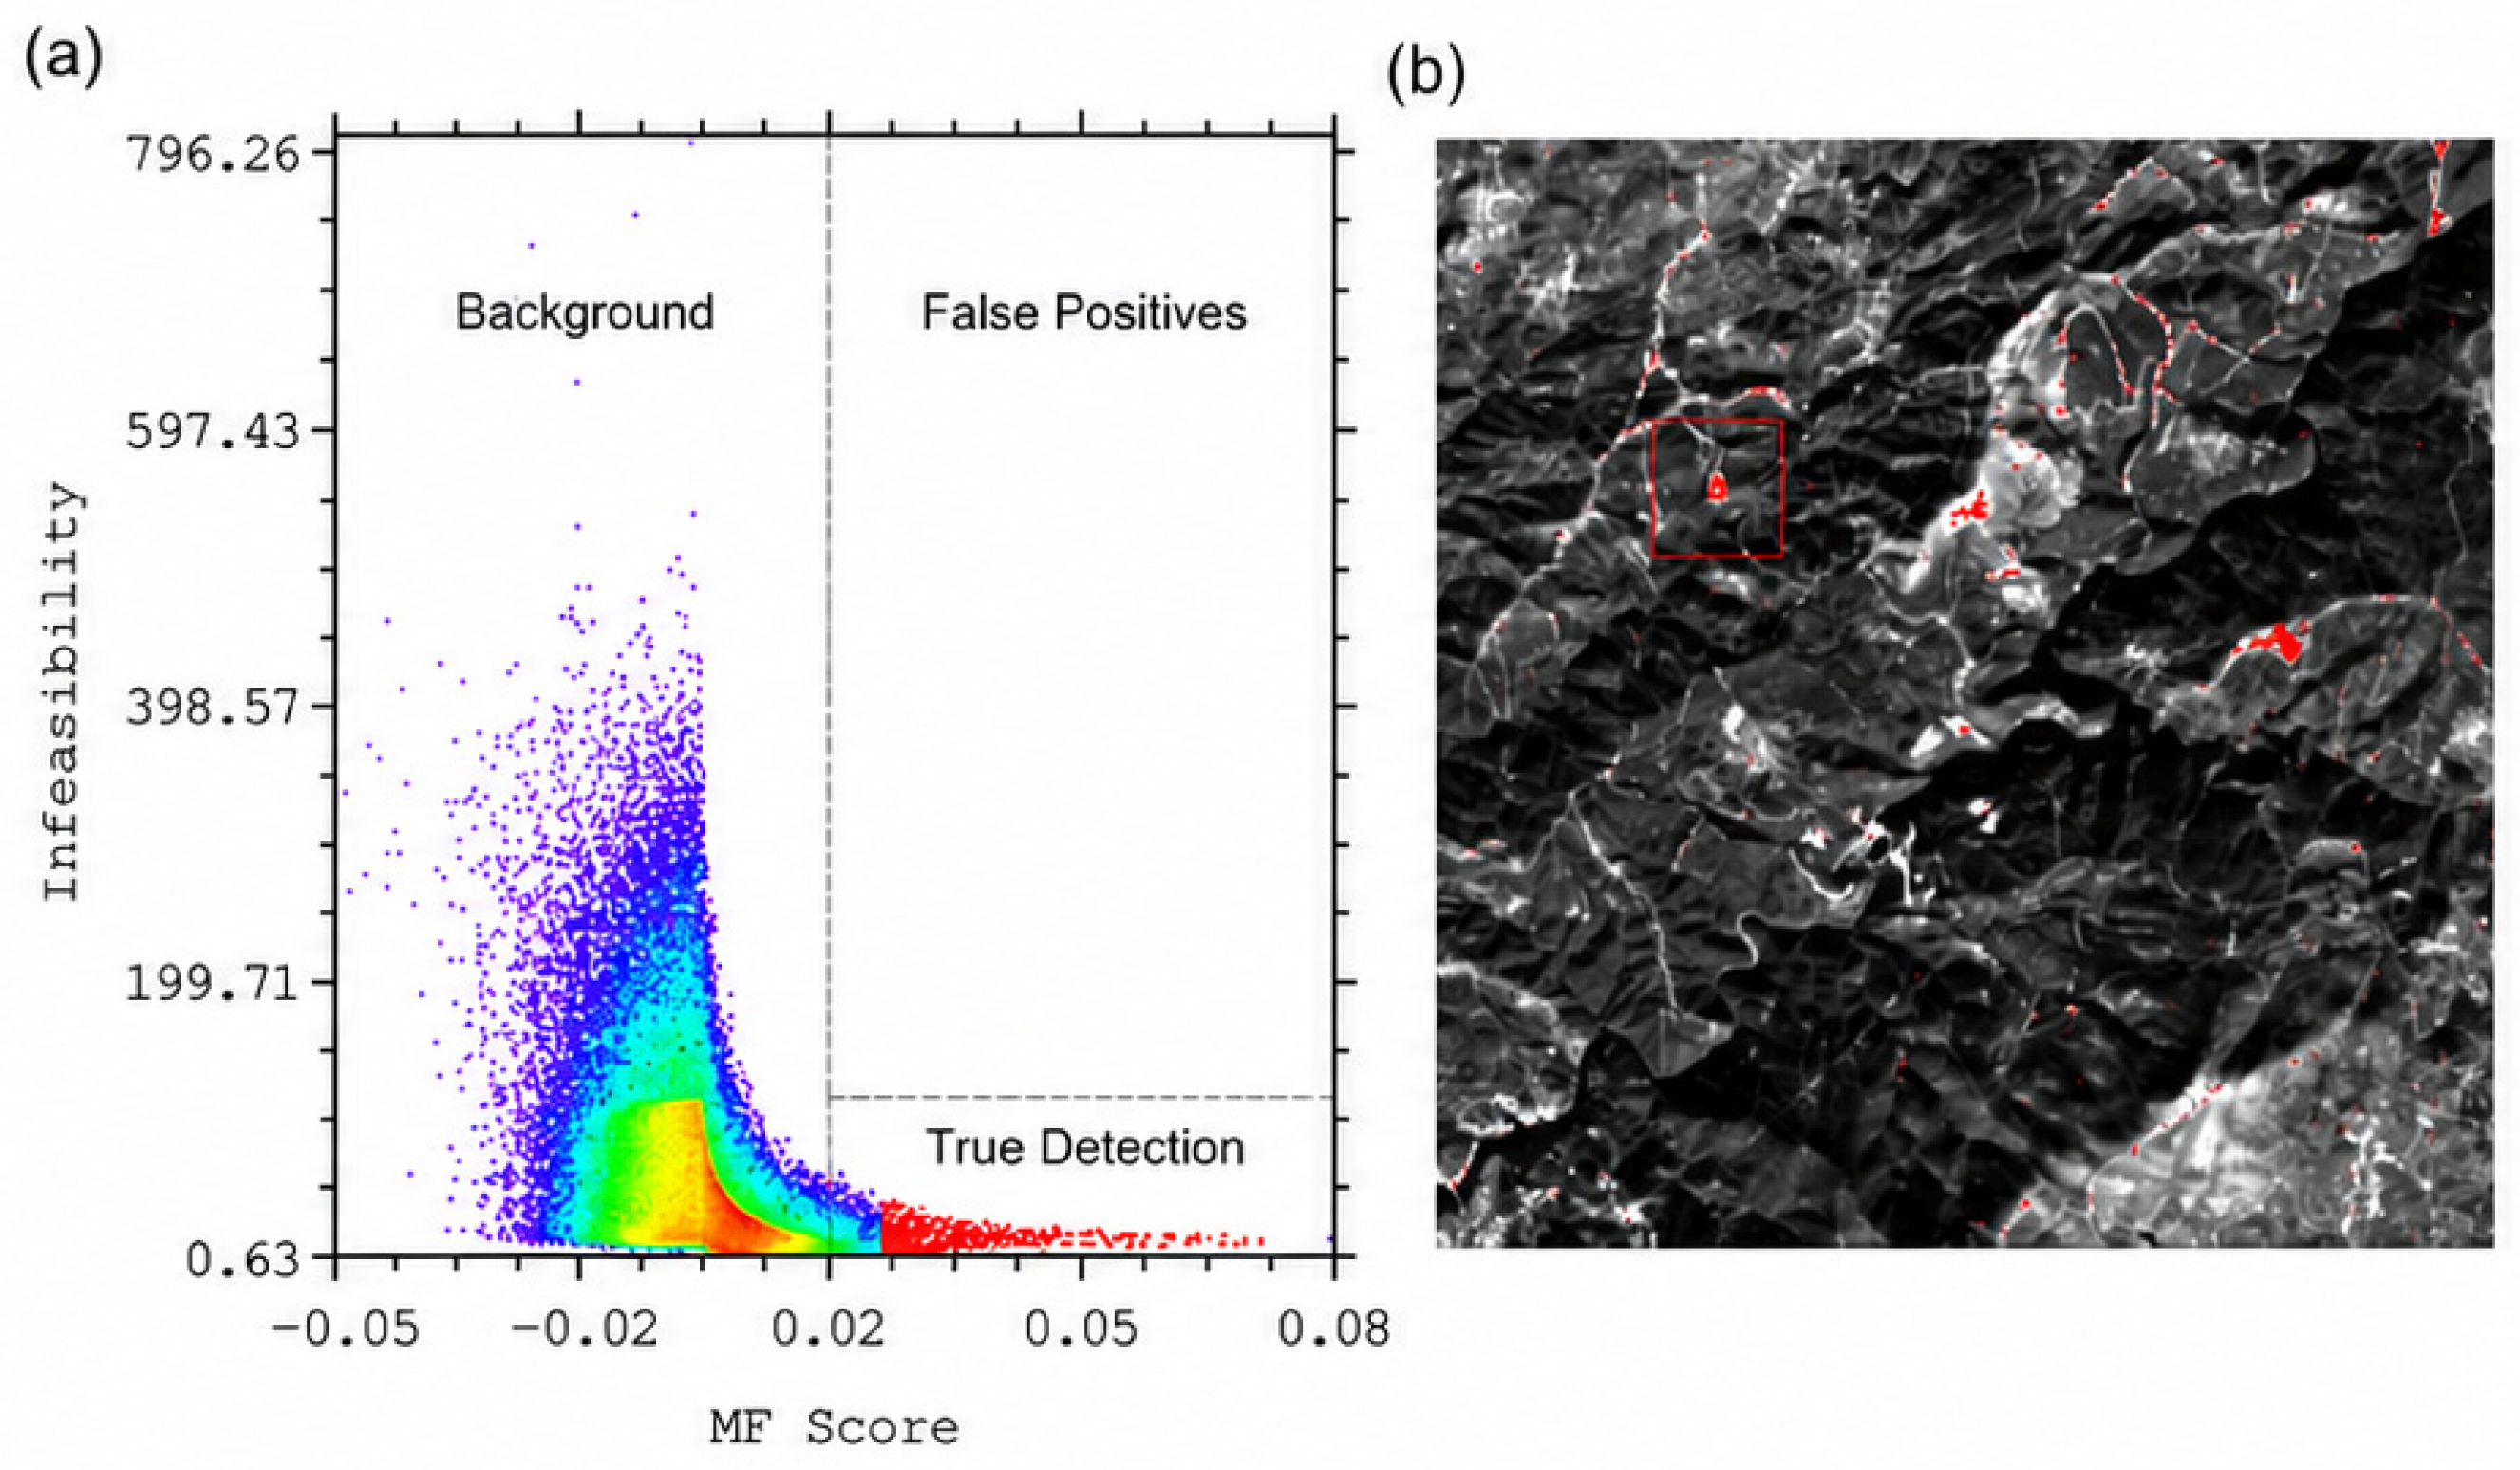
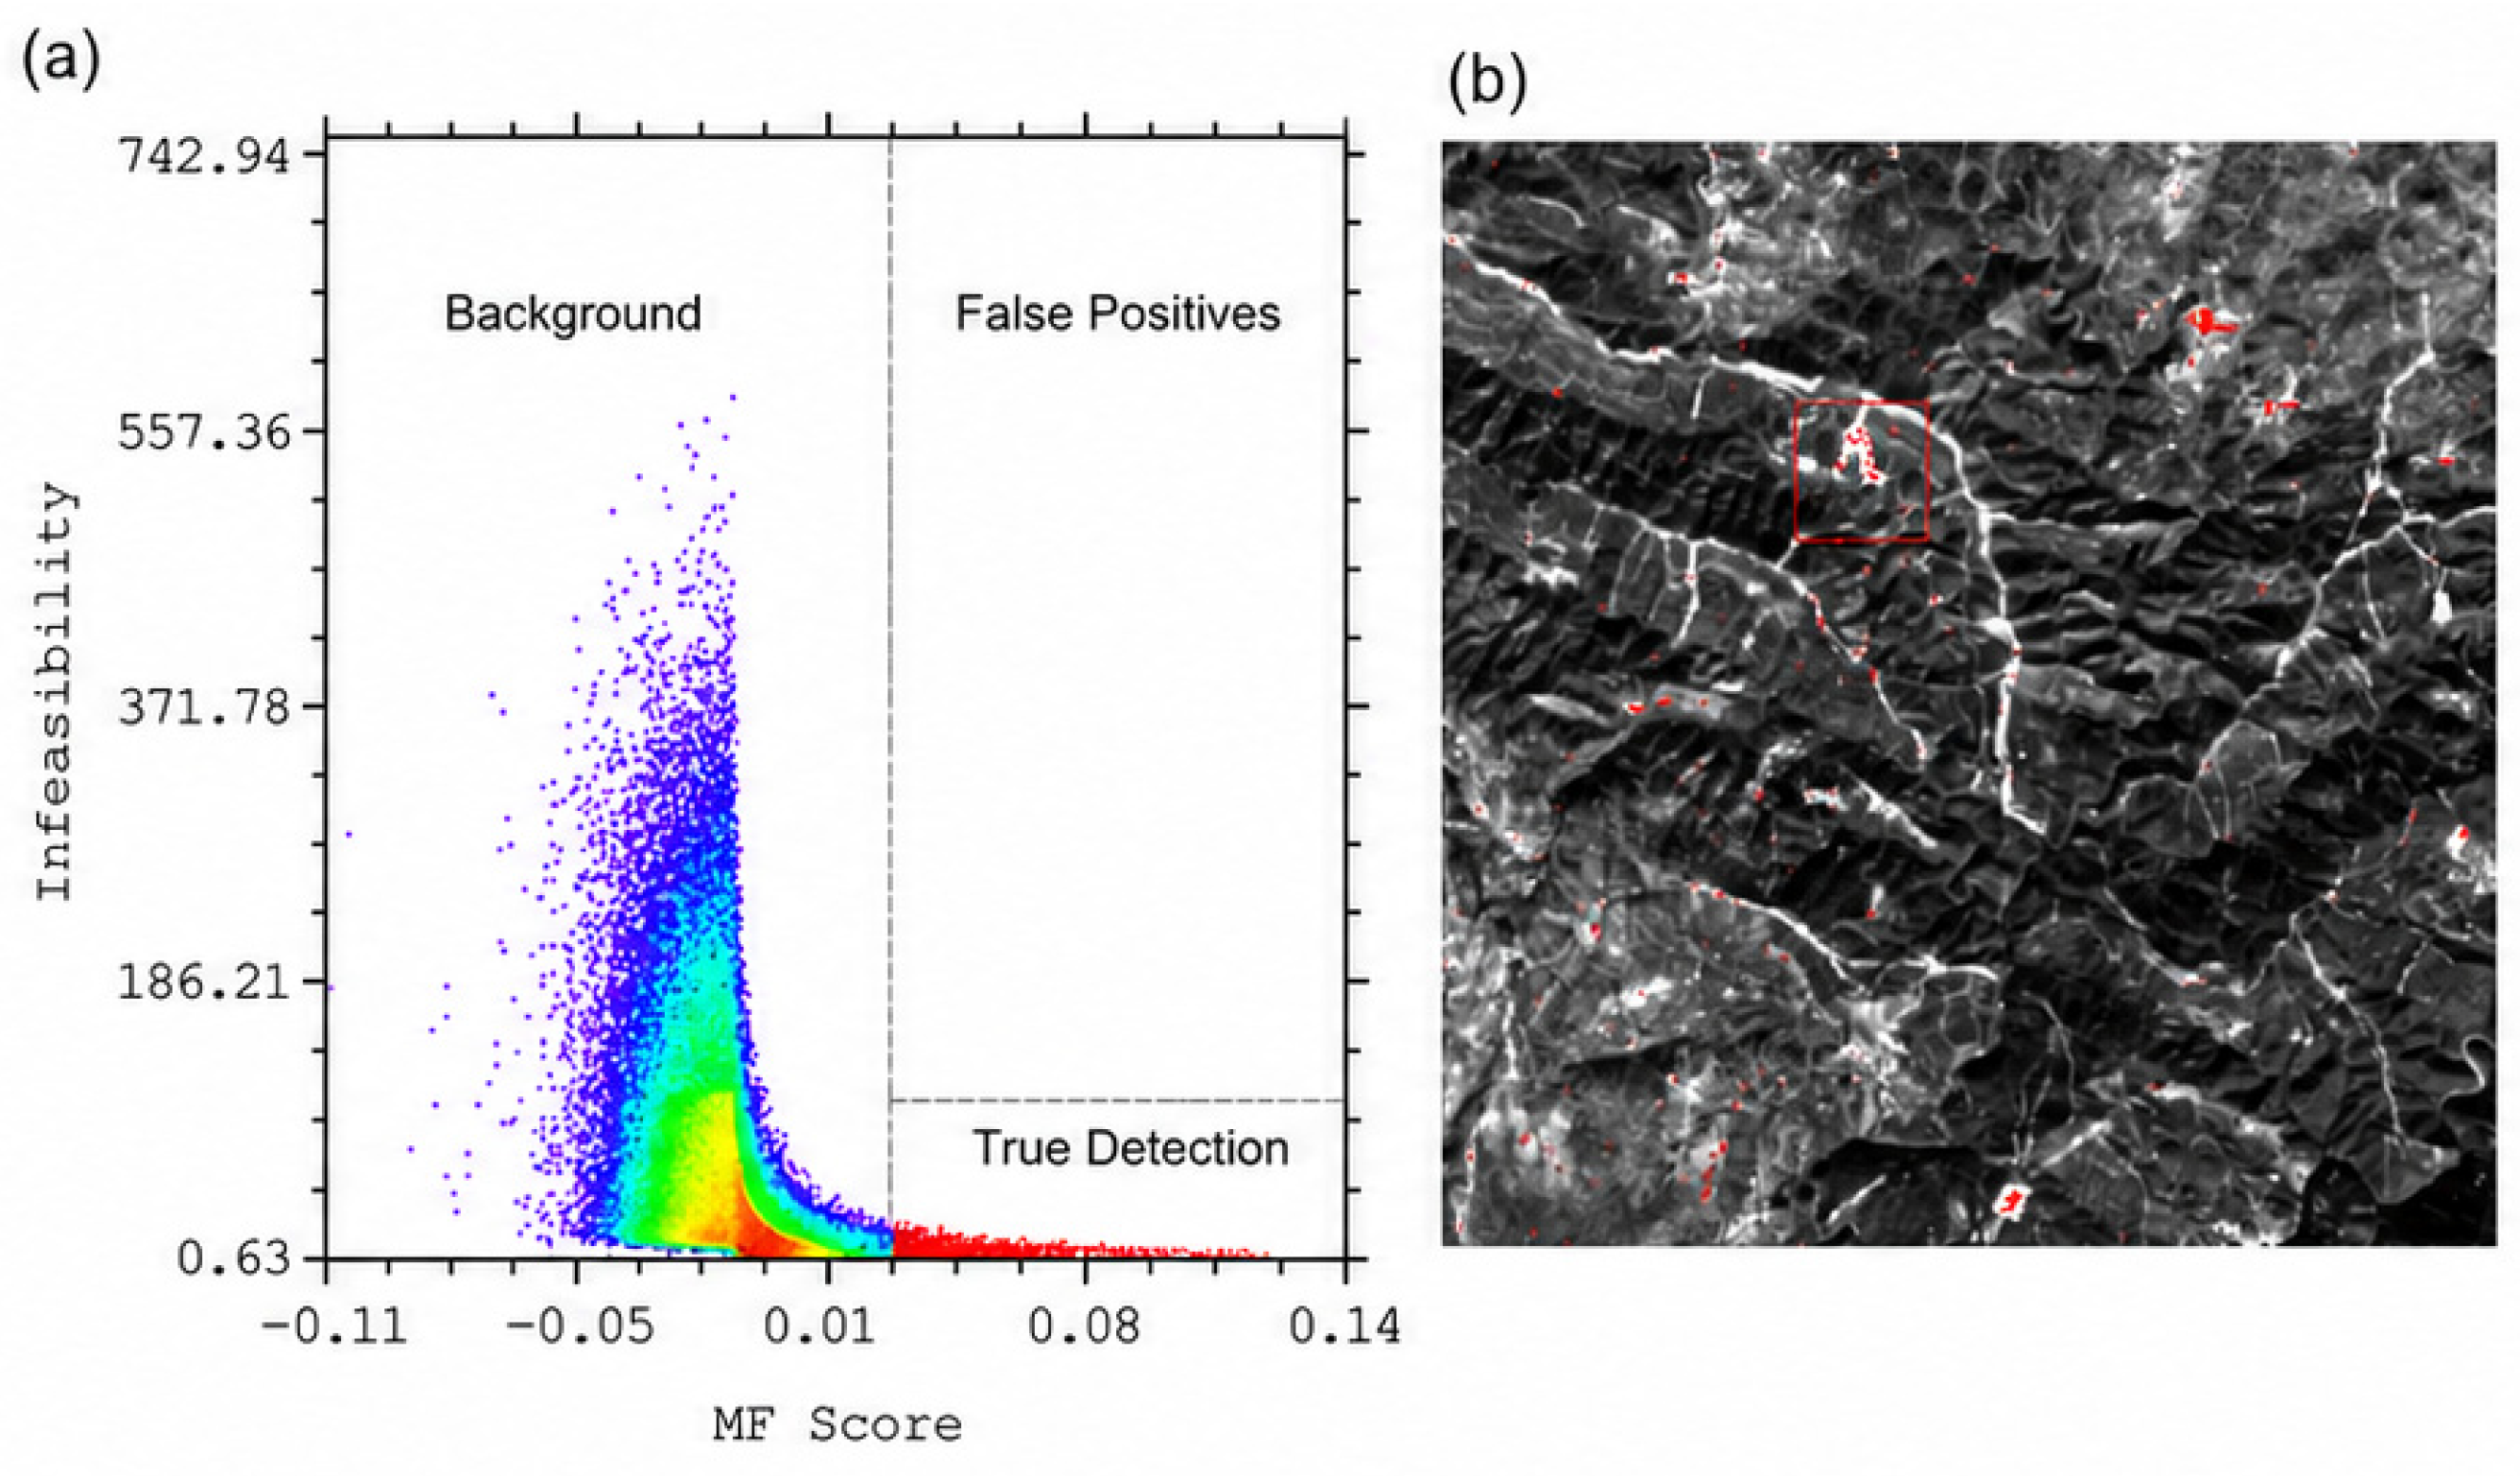
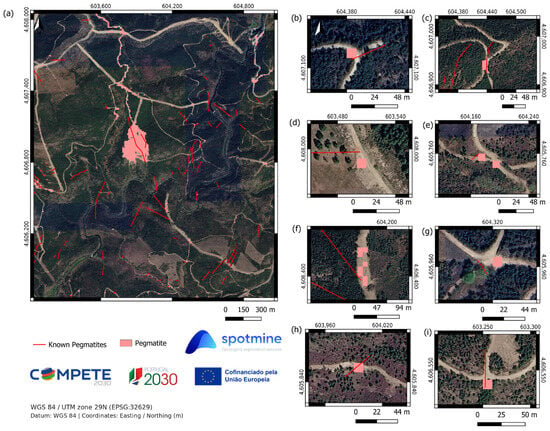
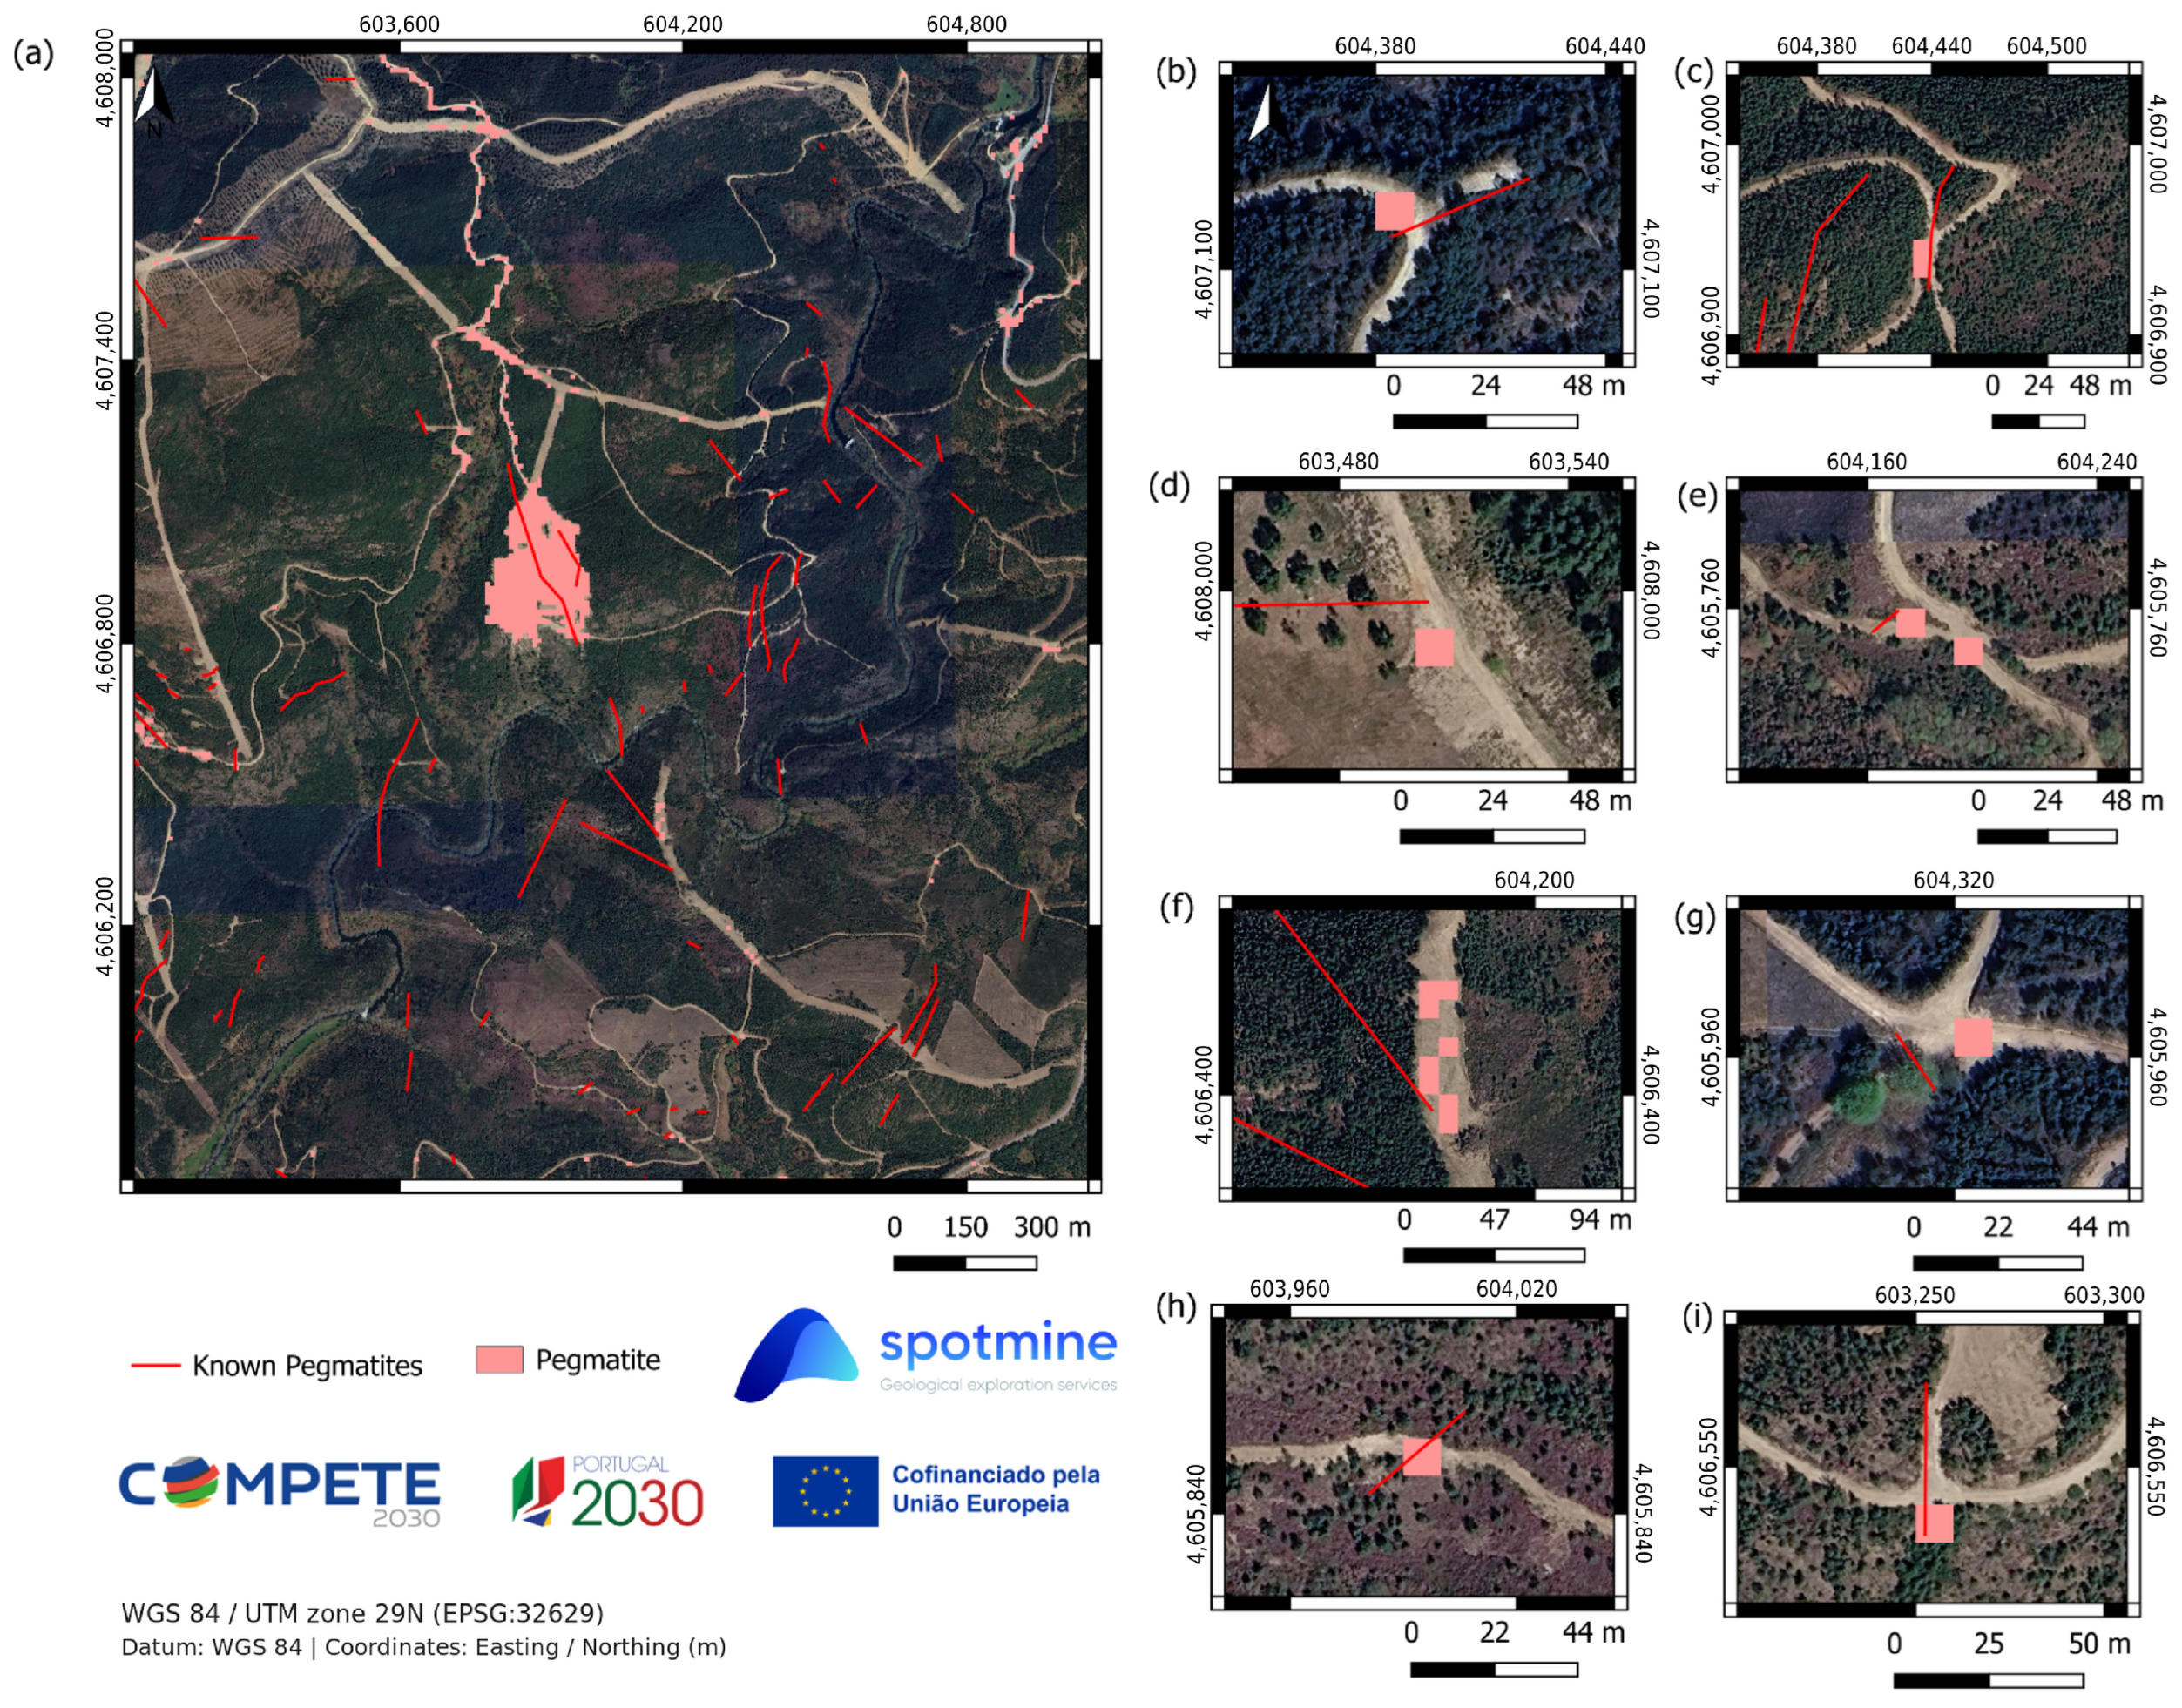
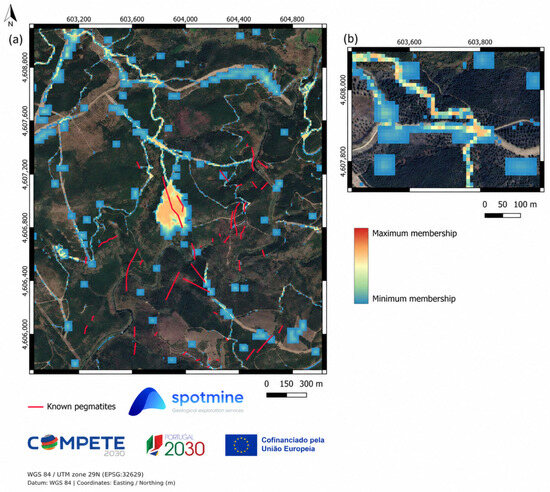
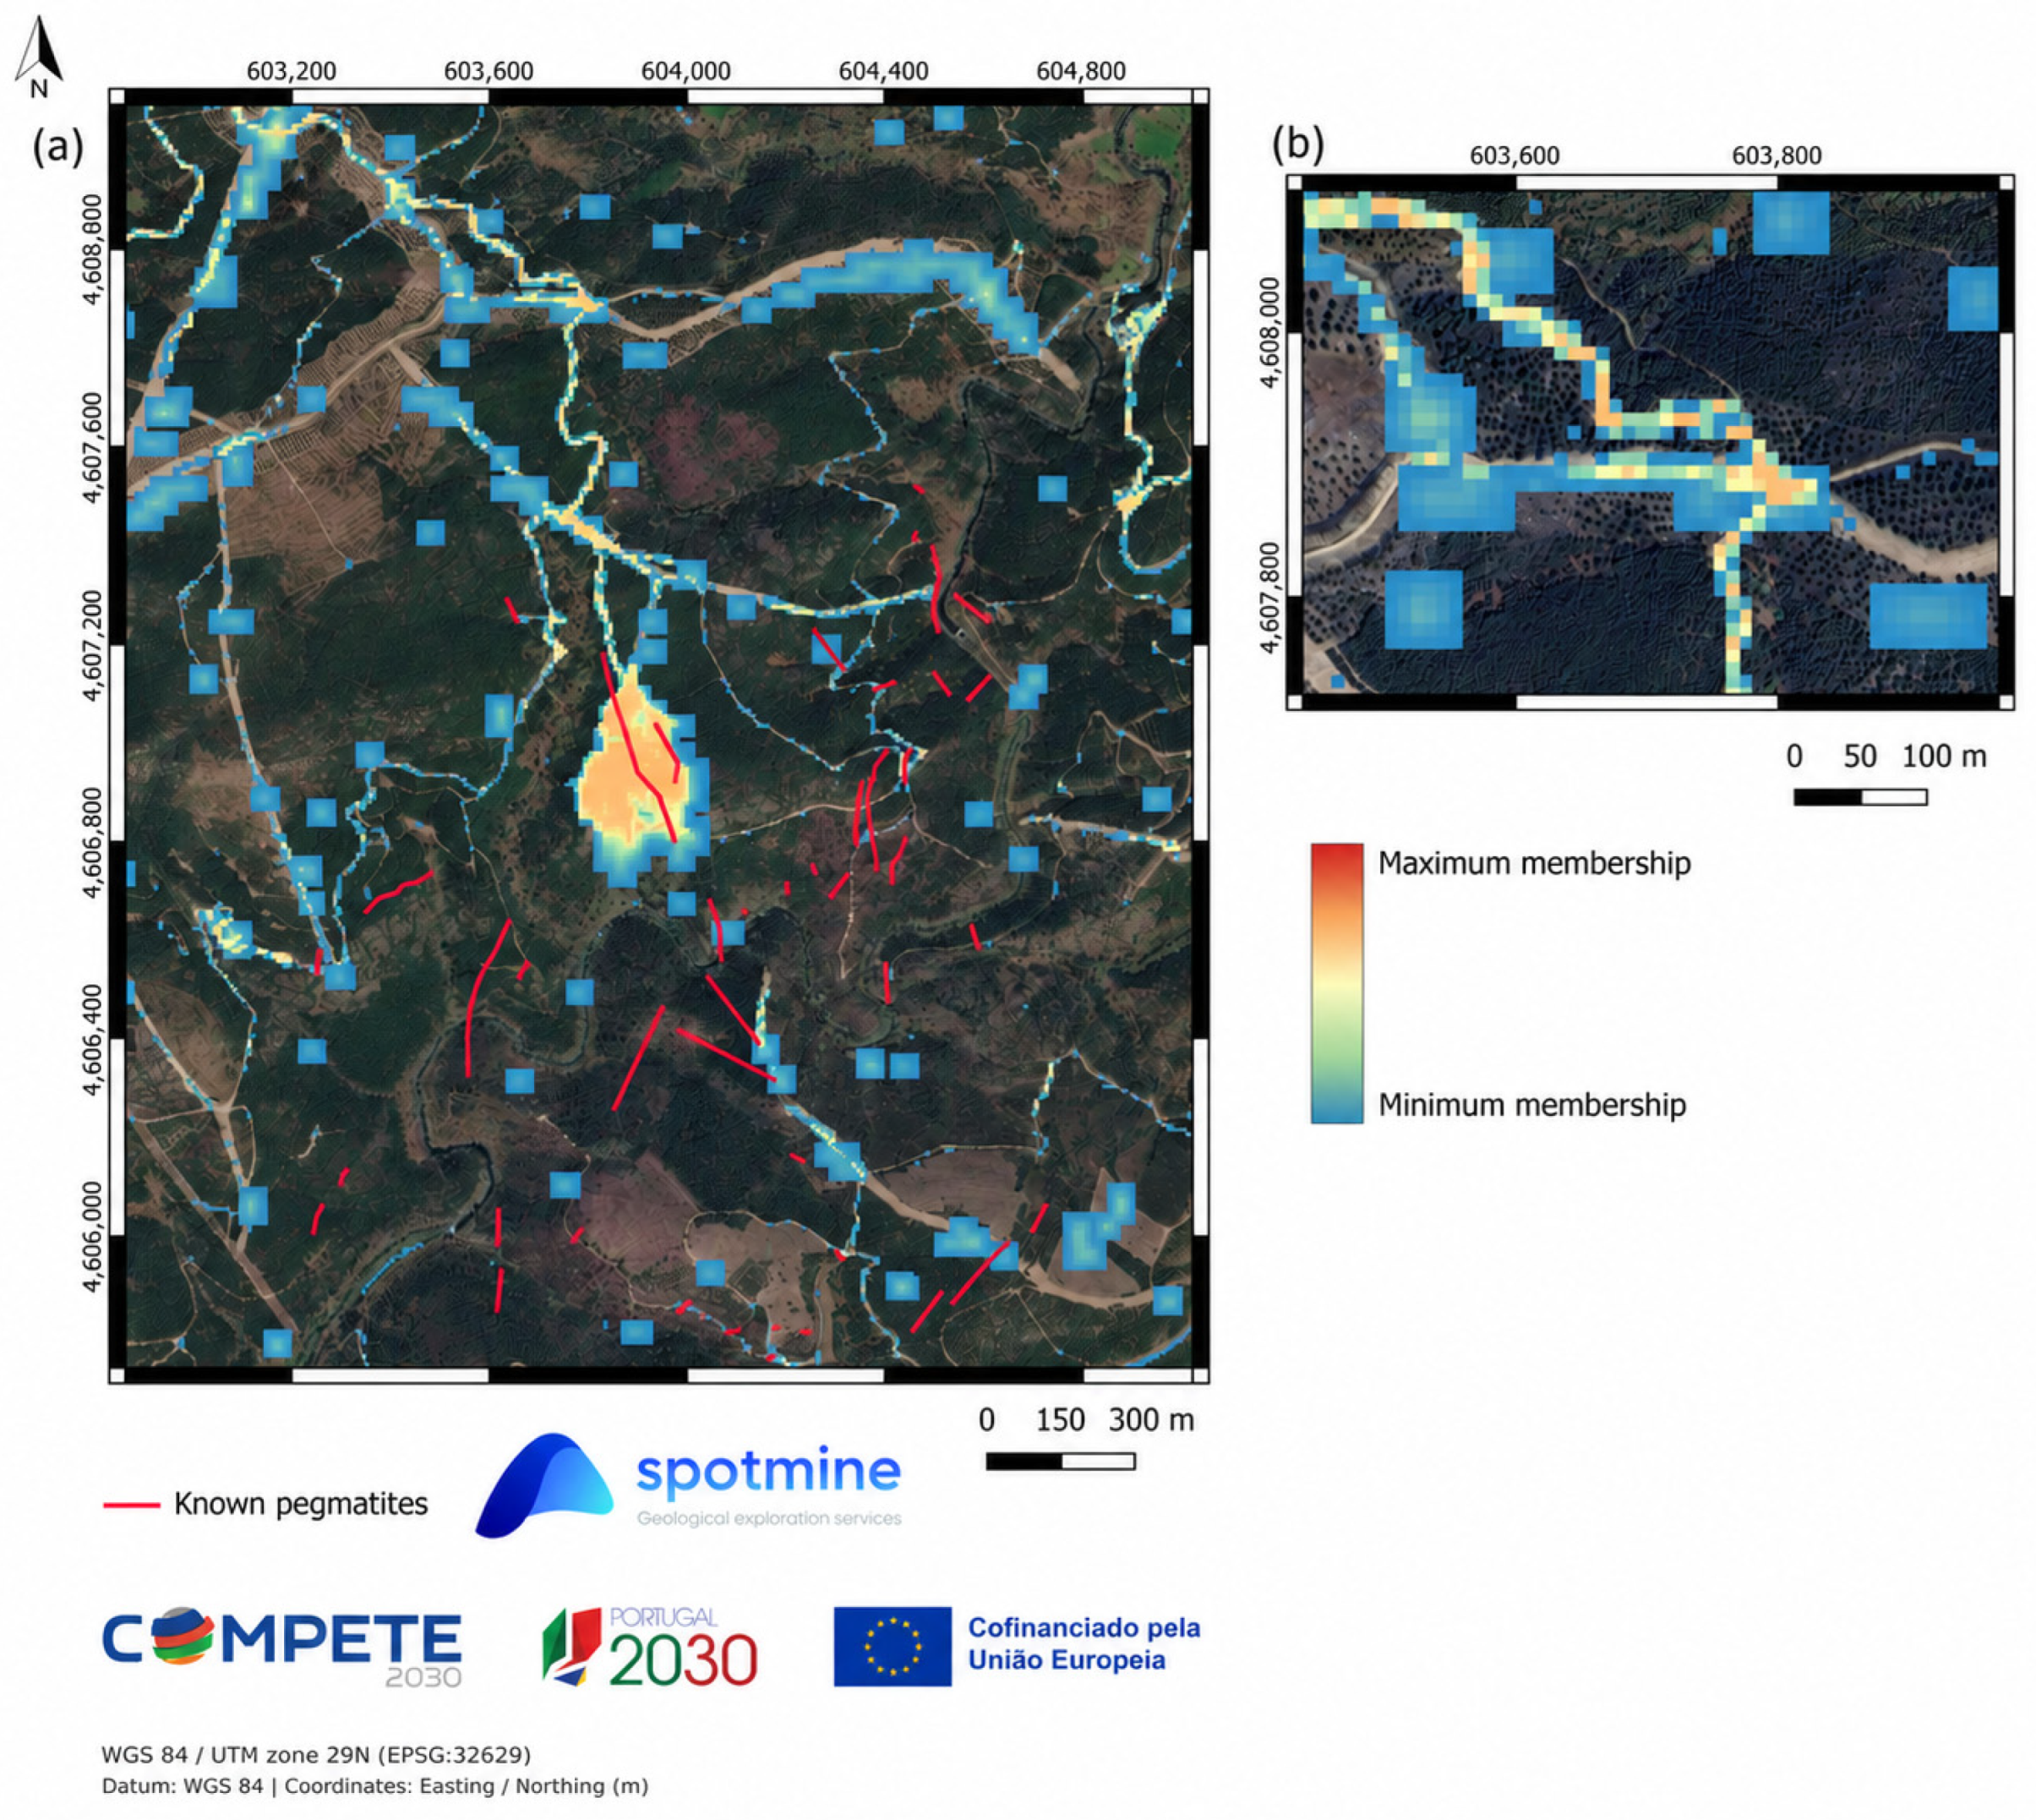
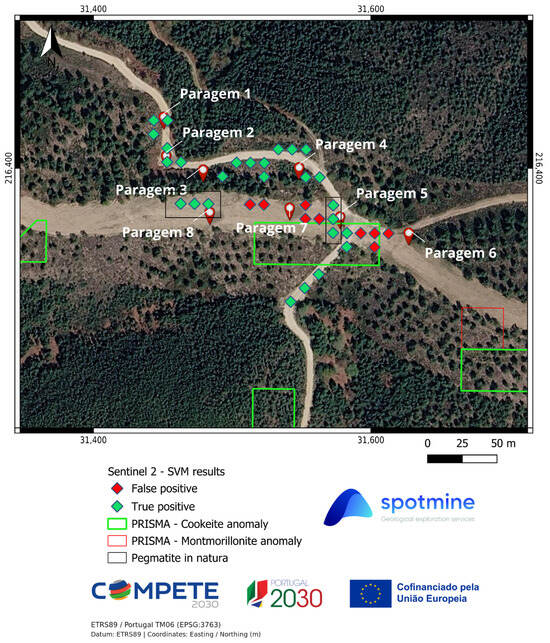
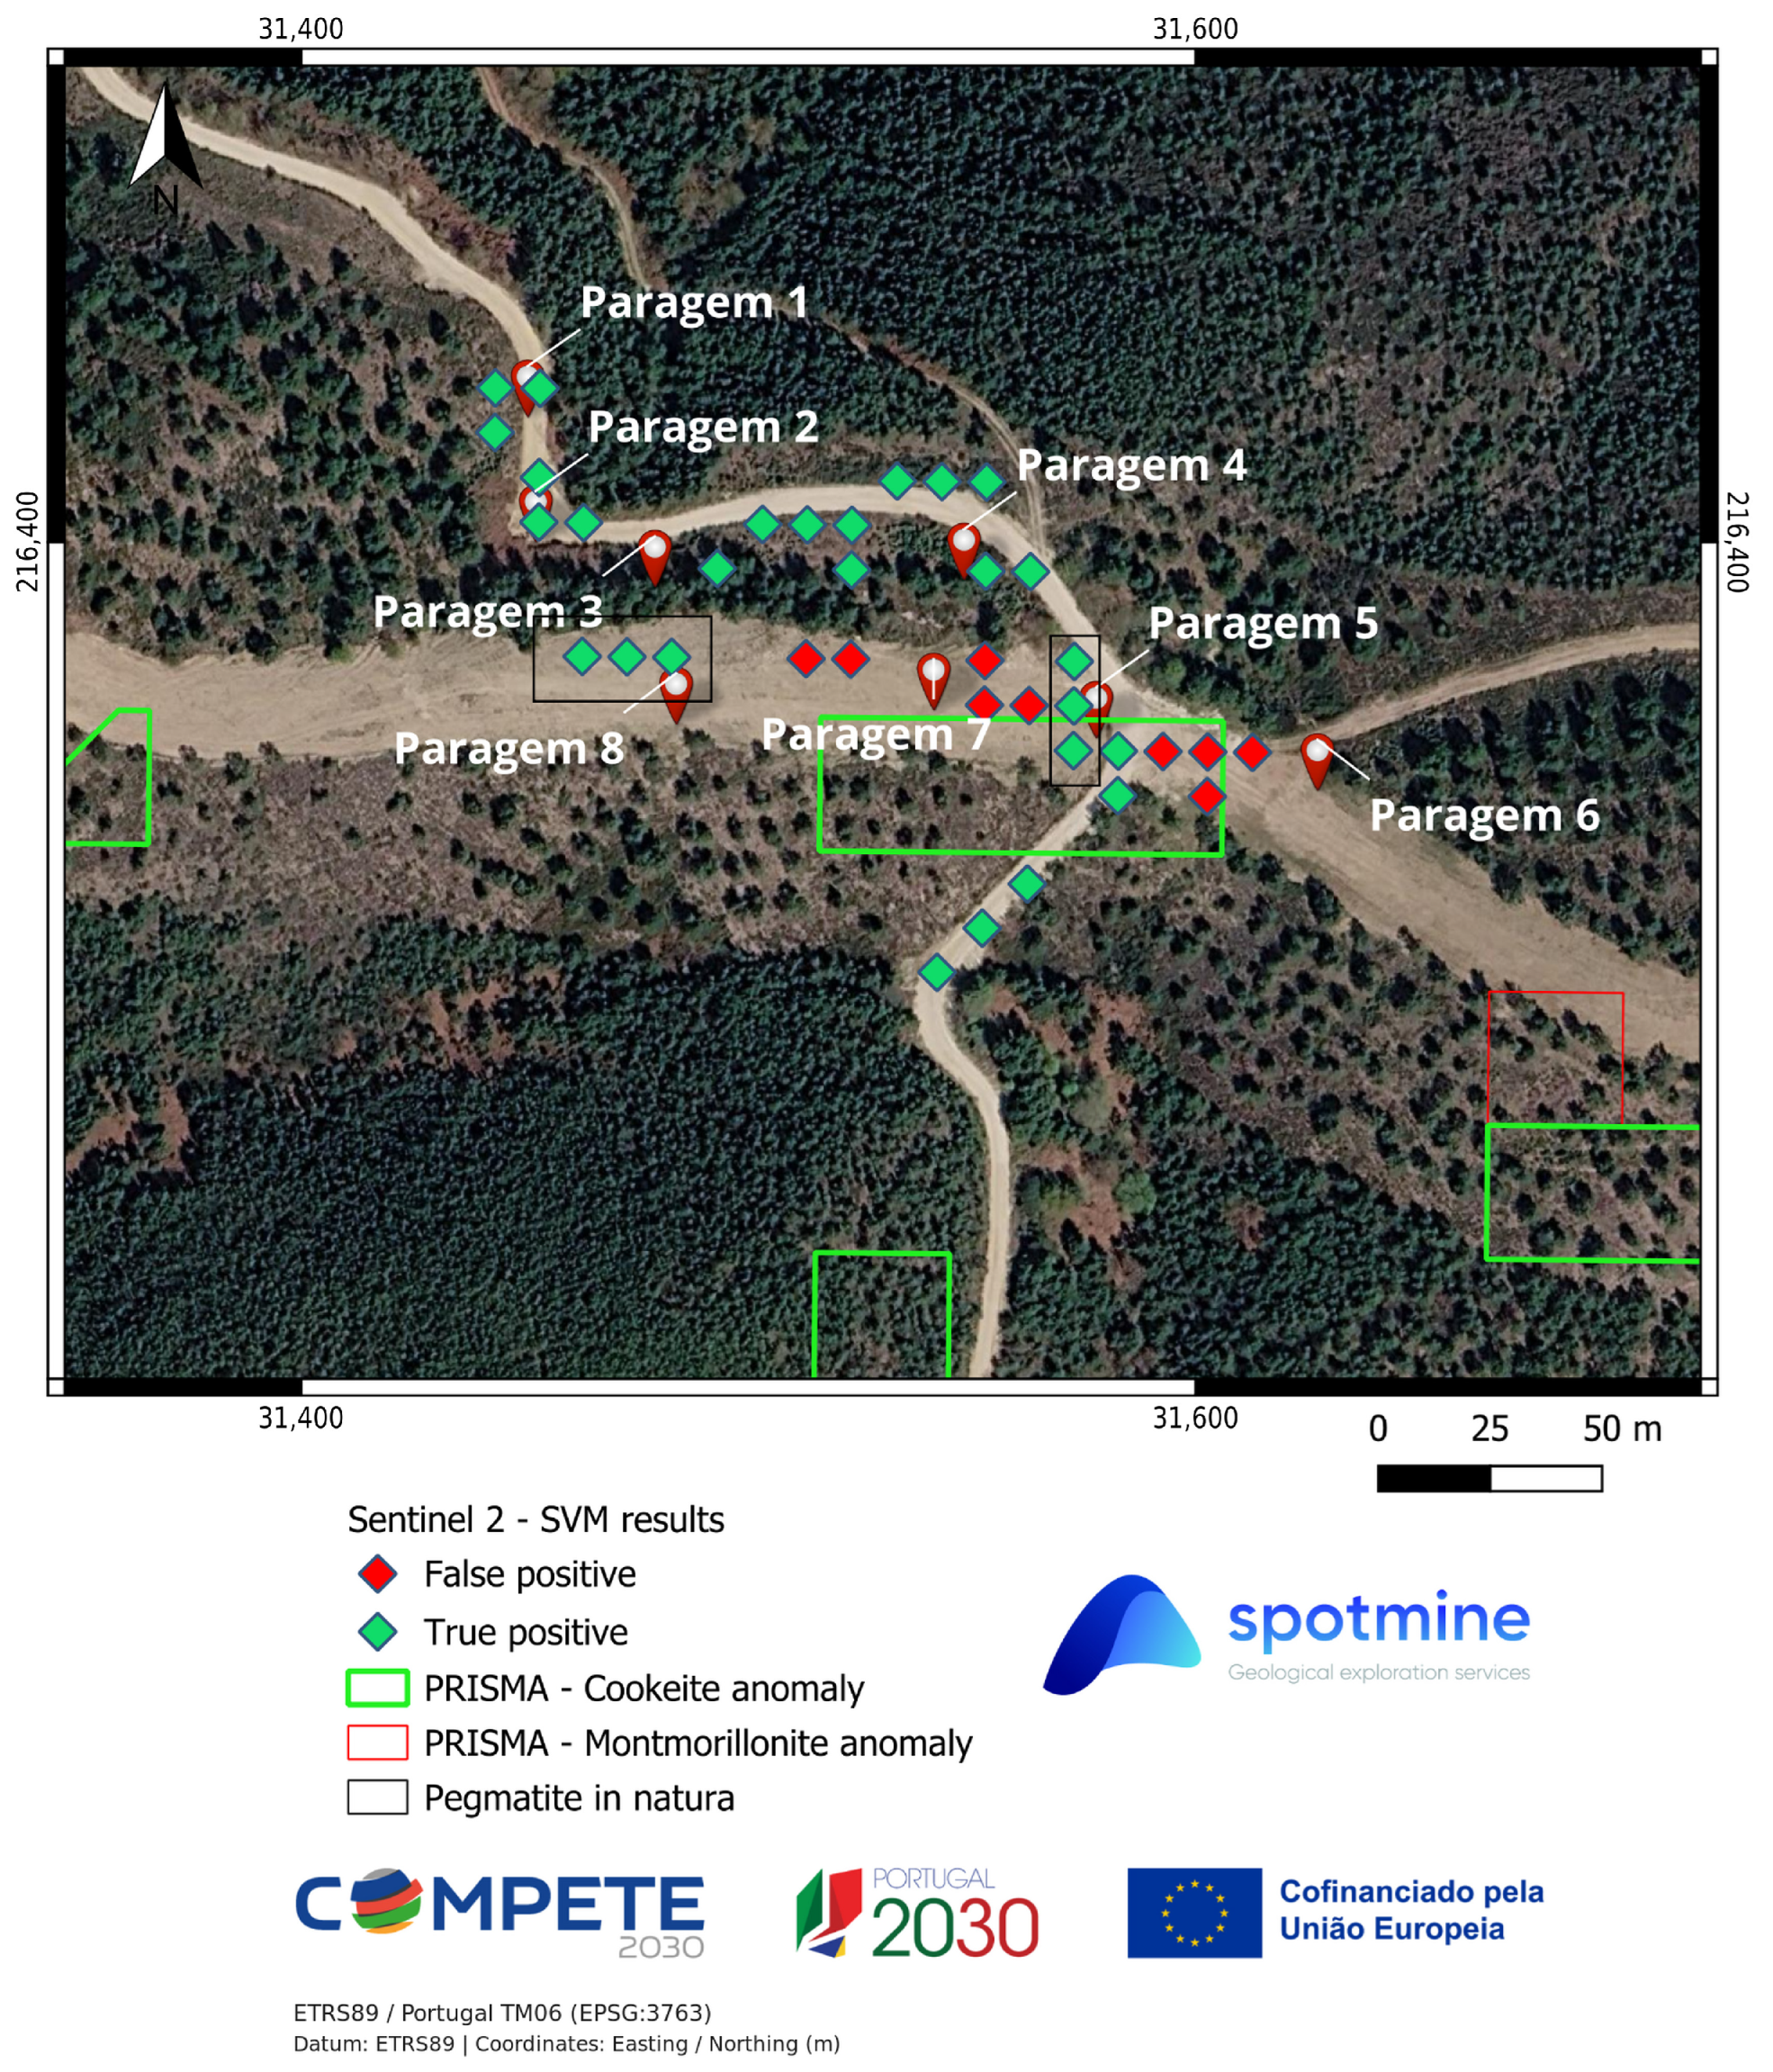

Disclaimer/Publisher’s Note: The statements, opinions and data contained in all publications are solely those of the individual author(s) and contributor(s) and not of MDPI and/or the editor(s). MDPI and/or the editor(s) disclaim responsibility for any injury to people or property resulting from any ideas, methods, instructions or products referred to in the content. |
© 2026 by the authors. Licensee MDPI, Basel, Switzerland. This article is an open access article distributed under the terms and conditions of the Creative Commons Attribution (CC BY) license.