


Abstract
Remote sensing is widely recognized as a key technology across a wide range of technical and scientific domains, especially in agriculture. Although satellite data have long supported crop monitoring, their limitations in spatial resolution, revisit frequency and cloud coverage have often constrained their applications. High-resolution satellites, available from the beginning of the 2000s, have improved performance, particularly in the field of precision agriculture, but they remain expensive and inflexible. Unmanned Aerial Vehicles perform better in precision agriculture, offering flexibility and high levels of detail; however, their limited operational areas and short endurance flight times constrain their effectiveness. In this evolving landscape, High Altitude Pseudo Satellites (HAPSs), particularly high-altitude balloons, are emerging as a promising new technology that could fill the gaps between satellite and drone remote sensing. These platforms provide large area coverage with high-resolution imagery and long endurance flights at low operational expenses and ease of deployment. This study investigates the operational characteristics, strengths, and geometric limitations of data acquired by the CubeHAPS® platform, a high-altitude pseudo-satellite system, as a prerequisite for its application in precision agriculture. Focusing on experimental campaigns conducted in northern Italy in summer 2024 and 2025, the research characterizes platform stability, image block consistency, and photogrammetric quality through internal metrics. The results demonstrate measurable improvements between the two campaigns, attributed to the introduction of a stabilization system in 2025 and establishing the conditions under which the platform can support reliable photogrammetric reconstruction.
1. Introduction
Remote sensing offers valuable tools in several technical–scientific fields. Among these, precision agriculture (PA), which leverages advanced tools in order to improve crop performance and environmental sustainability, has been increasingly relying on this technology, providing farmers and researchers with powerful instruments to monitor and manage crops at various spatial and temporal scales. Remote sensing has been frequently applied for soil and terrain mapping [1], soil properties estimation [2], crop irrigation management [3], evapotranspiration estimation and drought stress [4], pest outbreaks [5] and other applications [6] due to its ability to acquire spatially and temporally distributed data over large areas. Among these applications, thermal infrared (TIR) data play a specific role, as canopy temperature is closely related to stomatal conductance and water availability, making TIR imagery a valuable proxy for crop water stress detection and irrigation monitoring [4].
Traditionally, satellite data have played a dominant role in agricultural monitoring. The use of this data for agricultural purposes started with the launch of Landsat 1 [7] (formerly known as the Earth Resources Technology Satellite-ERTS) in 1972. Since the 1970s, images from Landsat (1–9) [8] and SPOT missions and the Indian Remote Sensing (IRS) program, whose first satellite IR-1A was launched in 1988 [9,10], have been employed to classify crops, forecast yields, and detect large-scale pest or disease patterns. However, their spatial and temporal resolution has historically limited their applicability [11]. In this respect, TIR capability has historically been available only on a subset of these missions: Landsat has carried thermal sensors since the TM/ETM+ instruments, with the current Thermal Infrared Sensor (TIRS) onboard Landsat 8–9 providing data at 100 m resolution (resampled to 30 m) [12].
With the beginning of the 2000s, high-resolution (commercial) satellite missions started providing multispectral imagery with metric/sub-metric resolution. Some limitations remained, especially concerning their capability of providing continued acquisitions with a proper temporal resolution.
A relevant step forward in this context was represented by the European Space Agency (ESA) Copernicus program, and in particular by the Sentinel-2 mission, which provides free and open multispectral imagery at 10 to 20 m spatial resolution (depending on the spectral band), with a revisit time of 5 days, representing a significant improvement for agricultural monitoring applications [13]. Within the same Copernicus program, thermal infrared observations are provided by the Sentinel-3 mission [14] through its SLSTR instrument, primarily designed for sea and land surface temperature retrieval. Although its coarser spatial resolution (in the order of 500 m to 1 km) makes it less suited to field-scale agricultural applications.
In recent years, constellations of microsatellites have finally overcome this last weakness offering daily global coverage wherever around the world with a geometric resolution close to the meter. Despite these improvements, multispectral acquisitions from optical sensors still suffer from limiting factors like cloud cover, orbital scheduling and delay in data processing and release to users [15].
Airborne platforms, mainly with pilots, have also proved to be effective for mapping purposes in the PA context [16,17]. They offer great flexibility in terms of flight height, payload capacity, and operational scheduling. They can host sensors with almost no limits in terms of size and weight, making them ideal for collecting multispectral and hyperspectral data over large agricultural areas. On the other hand, acquisitions from aircraft are often expensive and, therefore, not convenient, especially when repeated monitoring flights are required [18].
Unmanned Aircraft Vehicles (UAVs), have recently emerged as privileged platforms for remote sensing in PA. Their success is mainly due to their ability to provide very high-resolution imagery (i.e., few centimeters) [18]. These small and agile aircraft can be remotely controlled thanks to the integrated navigation systems and can fly close to crops, thus capturing images of such detail to be consistent with individual plant scale or leaves. Several studies have shown that UAV-derived information can advantageously support agriculture at affordable prices [19,20], particularly for small areas (<5 ha) [21]. In this context, thermal sensors have also been increasingly integrated onboard UAV platforms, enabling high-resolution (sub-metric to few-meter) thermal mapping [22,23], although the payload and endurance constraints [24,25,26] of small multirotor systems often limit the achievable coverage per flight when carrying thermal cameras [27].
Although balloon-based remote sensing dates back to the 1800s [28], High-Altitude Pseudo Satellites (HAPS), like the high-altitude balloons explored in this study, can bring further benefit to this ecosystem. HAPS can operate in the stratosphere, typically between 18 and 25 km above the Earth’s surface thanks to a balloon filled with lighter-than-air gases. These platforms operate at intermediate altitudes between UAV, aircraft and satellites. From this position, they can survey large areas with wide image footprints and, at the same time, with a higher geometric resolution than satellites, typically on the order of a few meters (e.g., 1–10 m), depending on sensor type and flight altitude. This feature offers a capability of persistence of survey above the same large area that aircraft and drones cannot easily provide.
Given these premises, they appear appealing for regional-scale agricultural monitoring thanks to a low operational cost, fast deployment [29] and long endurance. Despite their potential, HAPS are still in an emerging phase where several criticalities and technological challenges seem to continuously enter the stage.
This study builds on the framework described in [30], to investigate HAPS performance through experimental trials addressing concerns related to the geometric quality of derived orthoimages and Digital Surface Models (DSMs) required for agricultural applications. In particular, the analysis evaluated the improvements experienced since the first test campaign (summer 2024) to the last one operated in summer 2025. More precisely, this study examines the geometric characterization of the CubeHAPS platform as a necessary feasibility phase preceding any operational agricultural application. This evaluation is based on two-campaign comparison between the original 2024 configuration and the improved 2025 system and aims at documenting the progress achieved and identifying the remaining limitations to be addressed. Results report the exploitability of Stratospheric Platforms (SPs) for PA and can be included within the wider framework of Earth Observation (EO).
All concerns reported in this work are part of a wider research project intended for evaluating if thermal acquisitions from SP systems can be proficiently used to describe water flowing over crop fields during the programmed releases from channels for irrigation purposes. This information is relevant for considerations about the efficacy of irrigation by flooding in the context of water optimization that the ongoing climate change-related drought problems require.
2. Material and Methods
2.1. Study Area
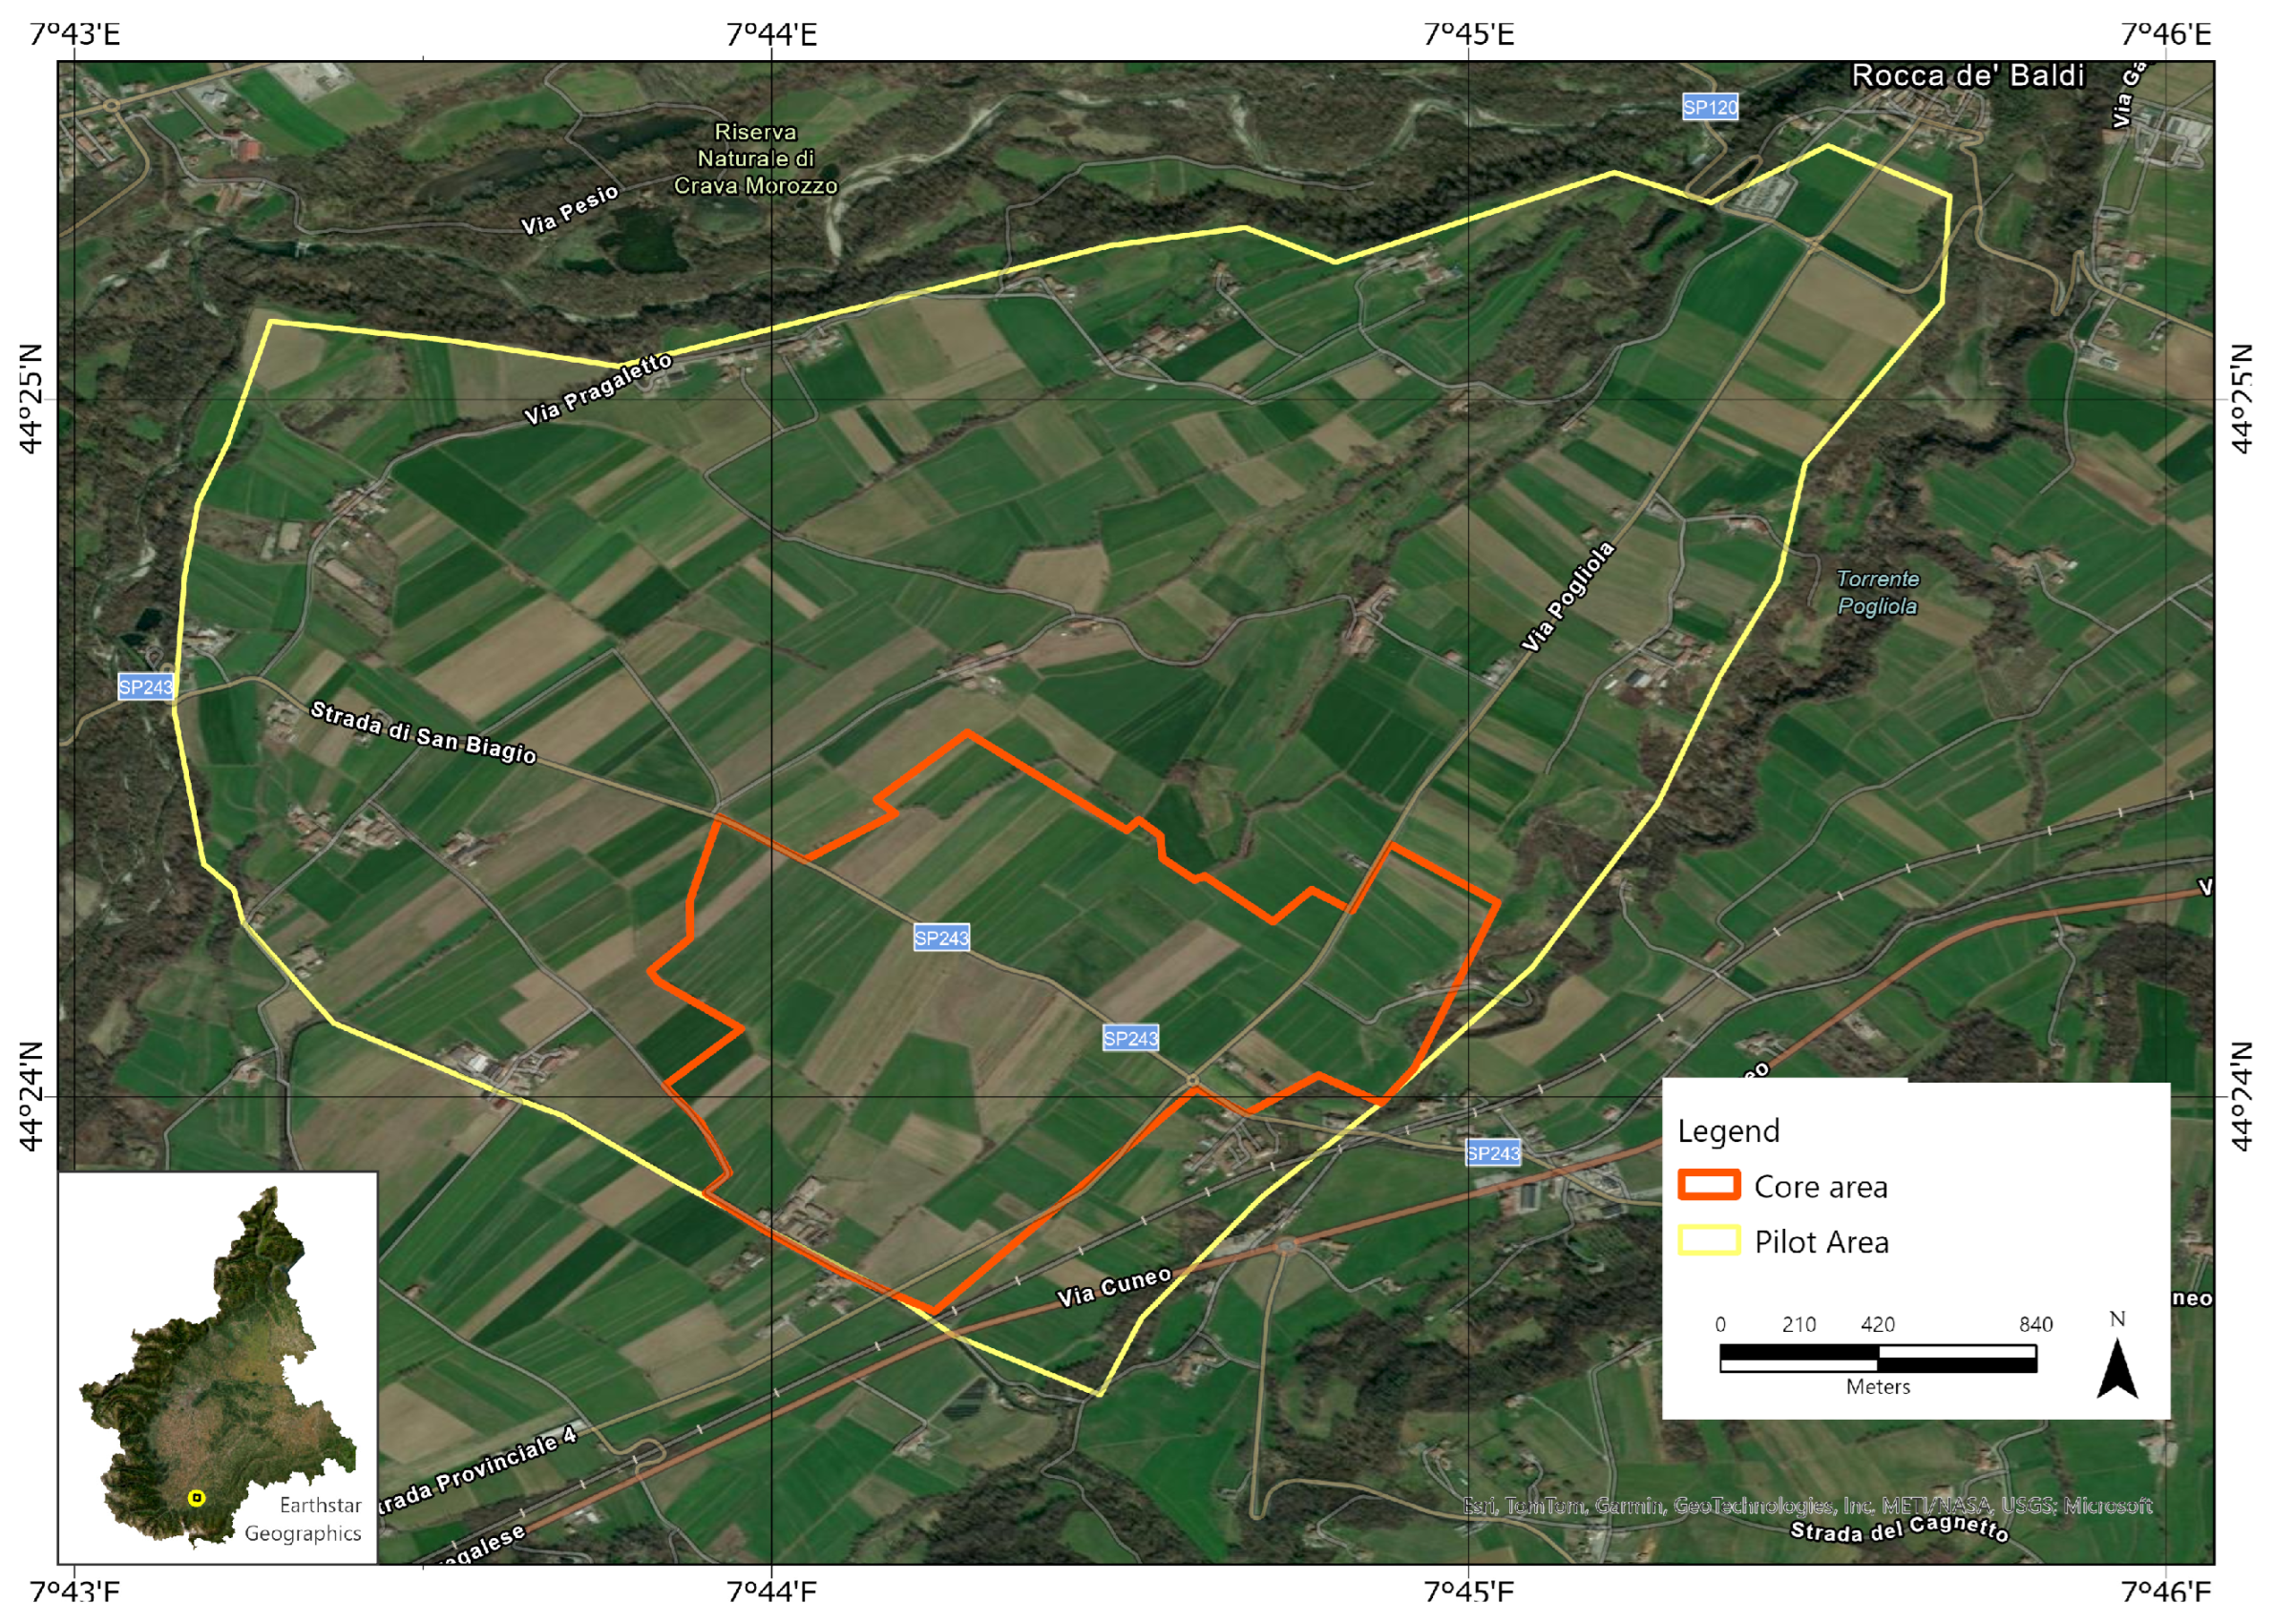
This study refers to acquisitions carried out from an experimental SP system over an agricultural area (namely Pogliola) located close to the town of Mondovì in NW Italy at an elevation of approximately 350–450 m a.s.l, within a gently undulating plain at the foot of the Ligurian Alps. The climate is temperate sub-continental, with rainfall typically concentrated in spring and autumn and drier summers.
The study goal was the evaluation of the applicability of these emerging technologies in the PA context, with a particular focus on the characterization of local irrigation systems, currently managed by the “Consorzio Irriguo Brobbio Pesio”. This area was selected because of its unified management in terms of water releases by the Consortium. These are scheduled and provided weekly every Sunday throughout the entire summer season. This enables proper planning of flight campaigns during water releases. The whole study area (in yellow in Figure 1) covers approximately 6.8 km2. Within this, a core area (in red), covering approximately 2.5 km2, was selected to assess the system’s performance.
Figure 1.
The study area is located in the municipality of Mondovì (Northern Italy). Reference system is geographic WGS84 (EPSG: 4326).
2.2. CubeHAPS® Technology: Platform and Sensor
Among the different SPs, one of the most promising experimental solutions is represented by HAPS platforms, designed to emulate some satellite functions, such as the acquisition of EO data. They can reach very high altitudes, making possible acquisitions that do not conflict with commercial air traffic [31].
In general, HAPS can refer to balloon-based, airship, or hybrid platforms, according to their design. HAPS can be intended for providing various services, such as telecommunications [32], EO [33,34], navigation support, and weather monitoring [35].
This specific study refers to the so called CubeHAPS (hereinafter called CH) [36], a proprietary system designed, developed and implemented by Stratobotic s.r.l., Torino, Italy, an Italian start-up company also supported by the European Space Agency (ESA). The term “Cube” was inspired by CubeSats, small cube-shaped satellites known for their modularity, low cost, and ease of deployment. Similarly to CubeSats [37], CH aims to be compact, low cost and reusable, and able to operate with easy deployment and launch capabilities. These platforms rely on aerostatic balloons and autonomous systems for stable positioning. The total mass of the system is approximately 4 kg in accordance with the ‘light unmanned free balloons’ regulations [38]; its payload can move up to approximately 1 kg.
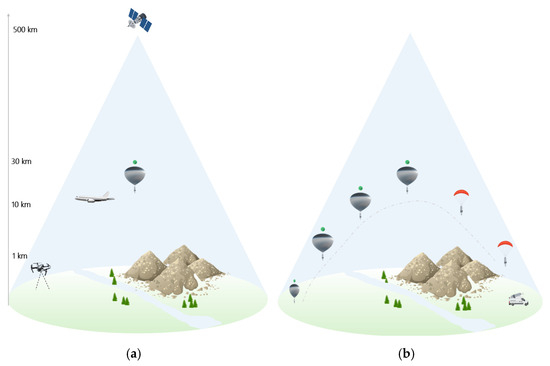
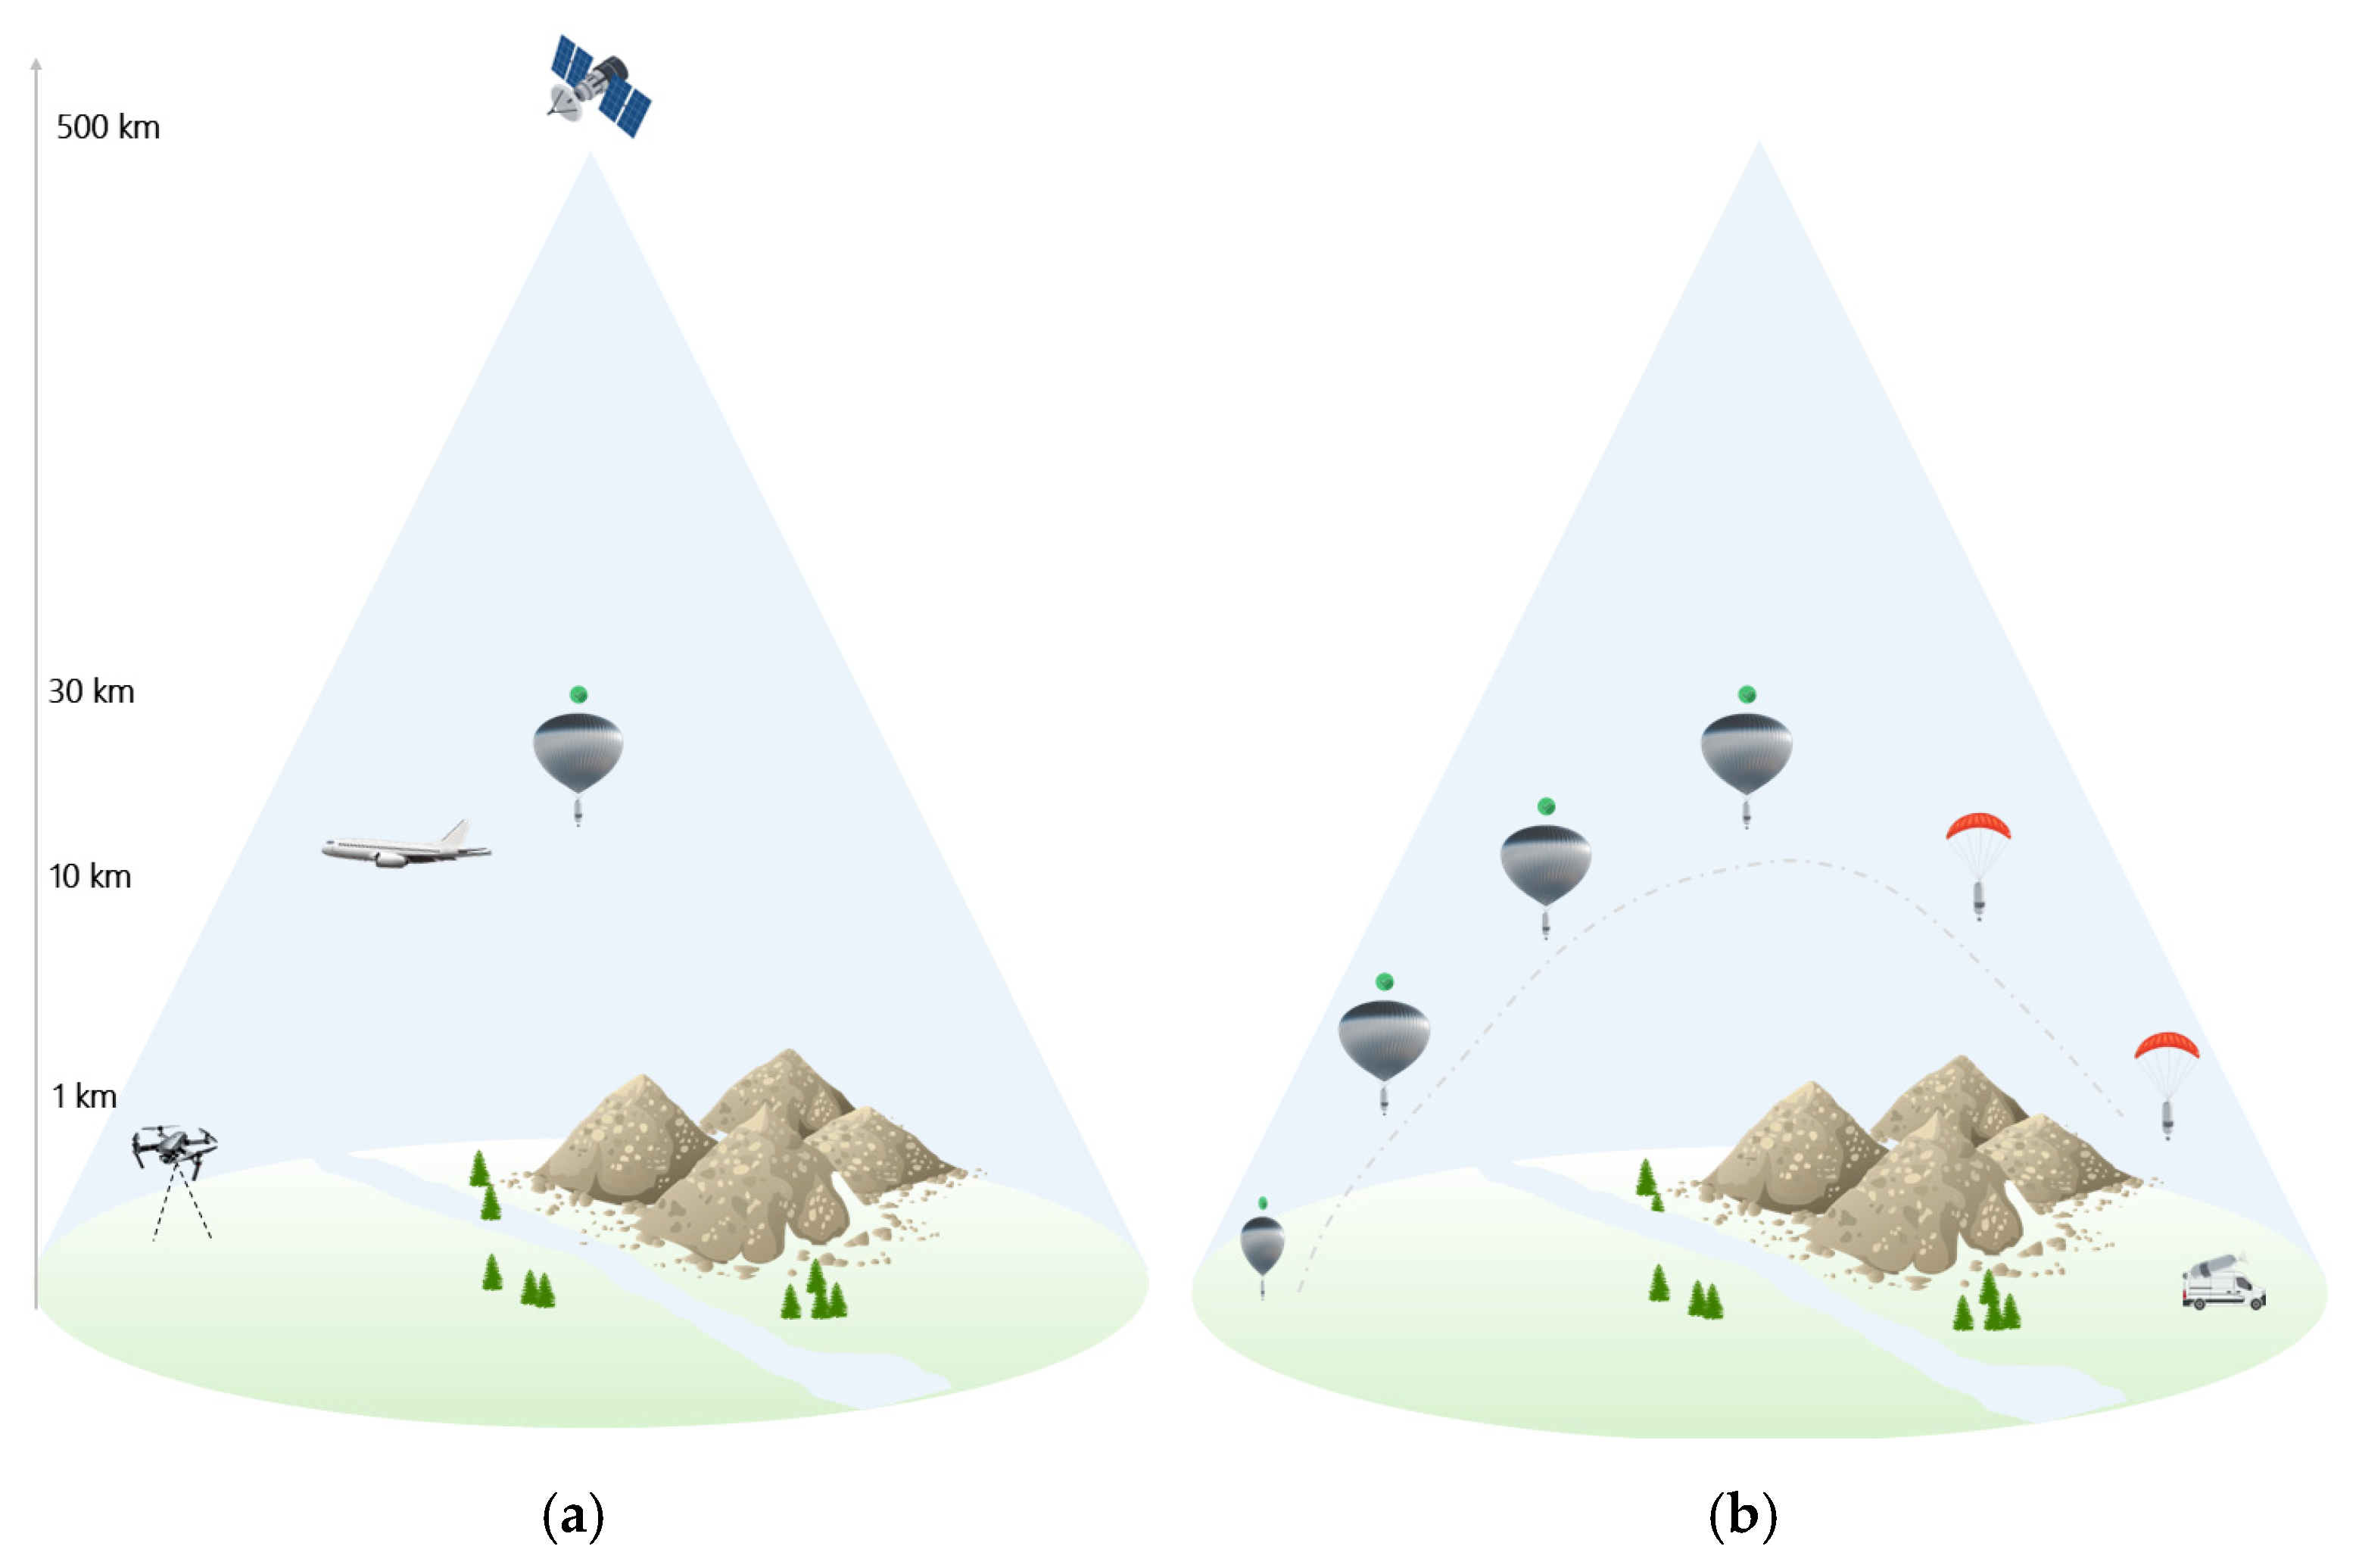
CH can acquire images continuously, once a proper time interval is fixed (e.g., 5 s). Differently from other flying acquisition platforms (like satellites, airplanes or drones), the sequence of acquired images is continuously varying in terms of image scale and overlapping since flight altitude is progressively changing from the launch point up to its maximum (some kilometers above the ground) and then from the maximum to the landing point (Figure 2b). This condition makes CH acquisitions different from the conventional aerial ones, potentially requiring a dedicated processing workflow.
Figure 2.
(a) Comparison between different acquisition methods by drones, aircrafts, and HAPS; (b) typical flight path of HAPS.
The CH payload can refer to different sensors (including the imaging ones) that can be mounted and dismounted, time by time, depending on the required data type. The imaging sensor hangs under a helium balloon. During the flight, after release, the balloon expands, providing the boost to progressively reach the target altitude. At that point, a remote-control system triggers the detachment of the sensor from the balloon. It starts its descending path supported by a parachute, landing at a pre-planned location (depending on the forecasted wind field).
In the initial experimental configurations of the CH system, atmospheric variability introduced significant trajectory instabilities. Wind-induced lateral and longitudinal displacements led to non-uniform and only partially predictable flight paths, directly affecting acquisition geometry, including image scale, overlap, and orientation. Consequently, the trajectory was subject to drift and uncontrolled deviations driven by natural wind patterns, with limited possibilities of compensation during flight.
These early limitations made CH acquisitions significantly different from conventional aerial photogrammetry, which typically relies on regularly spaced, nadir-oriented images acquired along predefined flight lines. In traditional aerial surveys, the platform follows a strictly planned trajectory, both geometrically and temporally, ensuring homogeneous coverage and a nearly constant forward overlap (typically 60–80%), which is essential for robust image block orientation and accurate 3D reconstruction. Although increasing acquisition frequency can help maintain forward overlap, the single-trajectory nature of CH flights does not allow side overlap between adjacent strips, further constraining geometric redundancy. This results in datasets characterized by irregular distributions of frames in terms of scale, overlap, and orientation.
Despite these limitations, CH platforms are characterized by an operational profile that allows continuous data acquisition over wide areas within a single flight, without the need for battery replacement or mission interruption. It is acknowledged that certain UAV categories, such as fixed-wing platforms, can achieve longer endurance; however, their adoption in agricultural contexts remains limited by higher costs and operational complexity [27]. This characteristic makes CH platforms particularly suitable for applications requiring sustained observation of a target area over extended periods, such as monitoring dynamic phenomena like water flow during irrigation releases. Based on the experience gained from these initial experimental campaigns, an advanced configuration of the CH system has been developed and tested in this study. This evolved version integrates additional control and guidance capabilities designed specifically to address the observed limitations. While the platform remains inherently influenced by atmospheric wind fields, the updated design incorporates active stabilization mechanisms aimed at improving flight predictability and reducing drift effects, thereby enhancing the overall consistency of data acquisition geometry.
2.3. Data Acquisition
2.3.1. Experimental Campaign in Summer 2024
During summer 2024, several flights were operated over the study area as part of a monitoring effort aimed at describing the dynamics of water flow during releases by the Consortium. These first launches were intended to evaluate the exploitability of CH acquisitions, with the expectation that their capability of remaining over a specific target for an extended period could be used to document fast-changing ground phenomena, as the water flowing during a release. In the meantime, they were assumed as a testing phase of the system, specifically addressed at recognizing eventual criticalities and providing operational solutions to improve the system.
All the tests concerned the performance of the FLIR A70 thermal camera, manufactured by FLIR Systems (Teledyne FLIR), Wilsonville, Oregon, USA, with special concerns about geometrical problems possibly affecting the image block bundle adjustment phase of the analytical process. It is worth noting that the latter is intended for mapping thermal anomalies related to the detection of flooded and non-flooded areas during water releases from the local channel network.
The FLIR A70 thermal sensor was selected as deemed to be, at the time of this research, the most suitable for optimal integration into the system. Key technical specifications of FLIR A70 are the following: focal length = 14.3 mm, physical pixel size = 12 μm, sensor size = 7.68 × 5.76 mm, thermal accuracy = ±2 °C or ±2% of the reading, in the range 15–35 °C.
FLIR A70 images are delivered with metadata, provided by the onboard Position and Orientation System (POS), that include the coordinates of the camera focal point (WGS 84 geographic system for horizontal positioning and WGS84 ellipsoidal height for vertical) and the 3 orientation angles (roll, pitch, and yaw).
Acquisitions (Table 1) were scheduled to be carried out twice during the water release day (Sunday), with the aim of detecting thermal anomalies related to flooded areas at different positions throughout the day depending on the water field of movement. This was expected to support detection of patterns of heterogenous irrigation, which are useful to evaluate the effectiveness of the local irrigation strategy.
Table 1.
Main technical features of CH acquisitions operated in summer 2024.
As initially planned, acquisitions were scheduled to specifically enable mapping of flowing water releases along the fields. On some dates (28/7/2024, 11/08/2024 and 01/09/2024) two launches per day were possible, one in the morning and one in the afternoon.
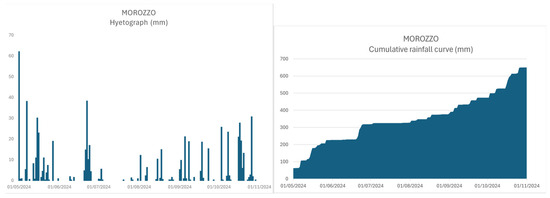
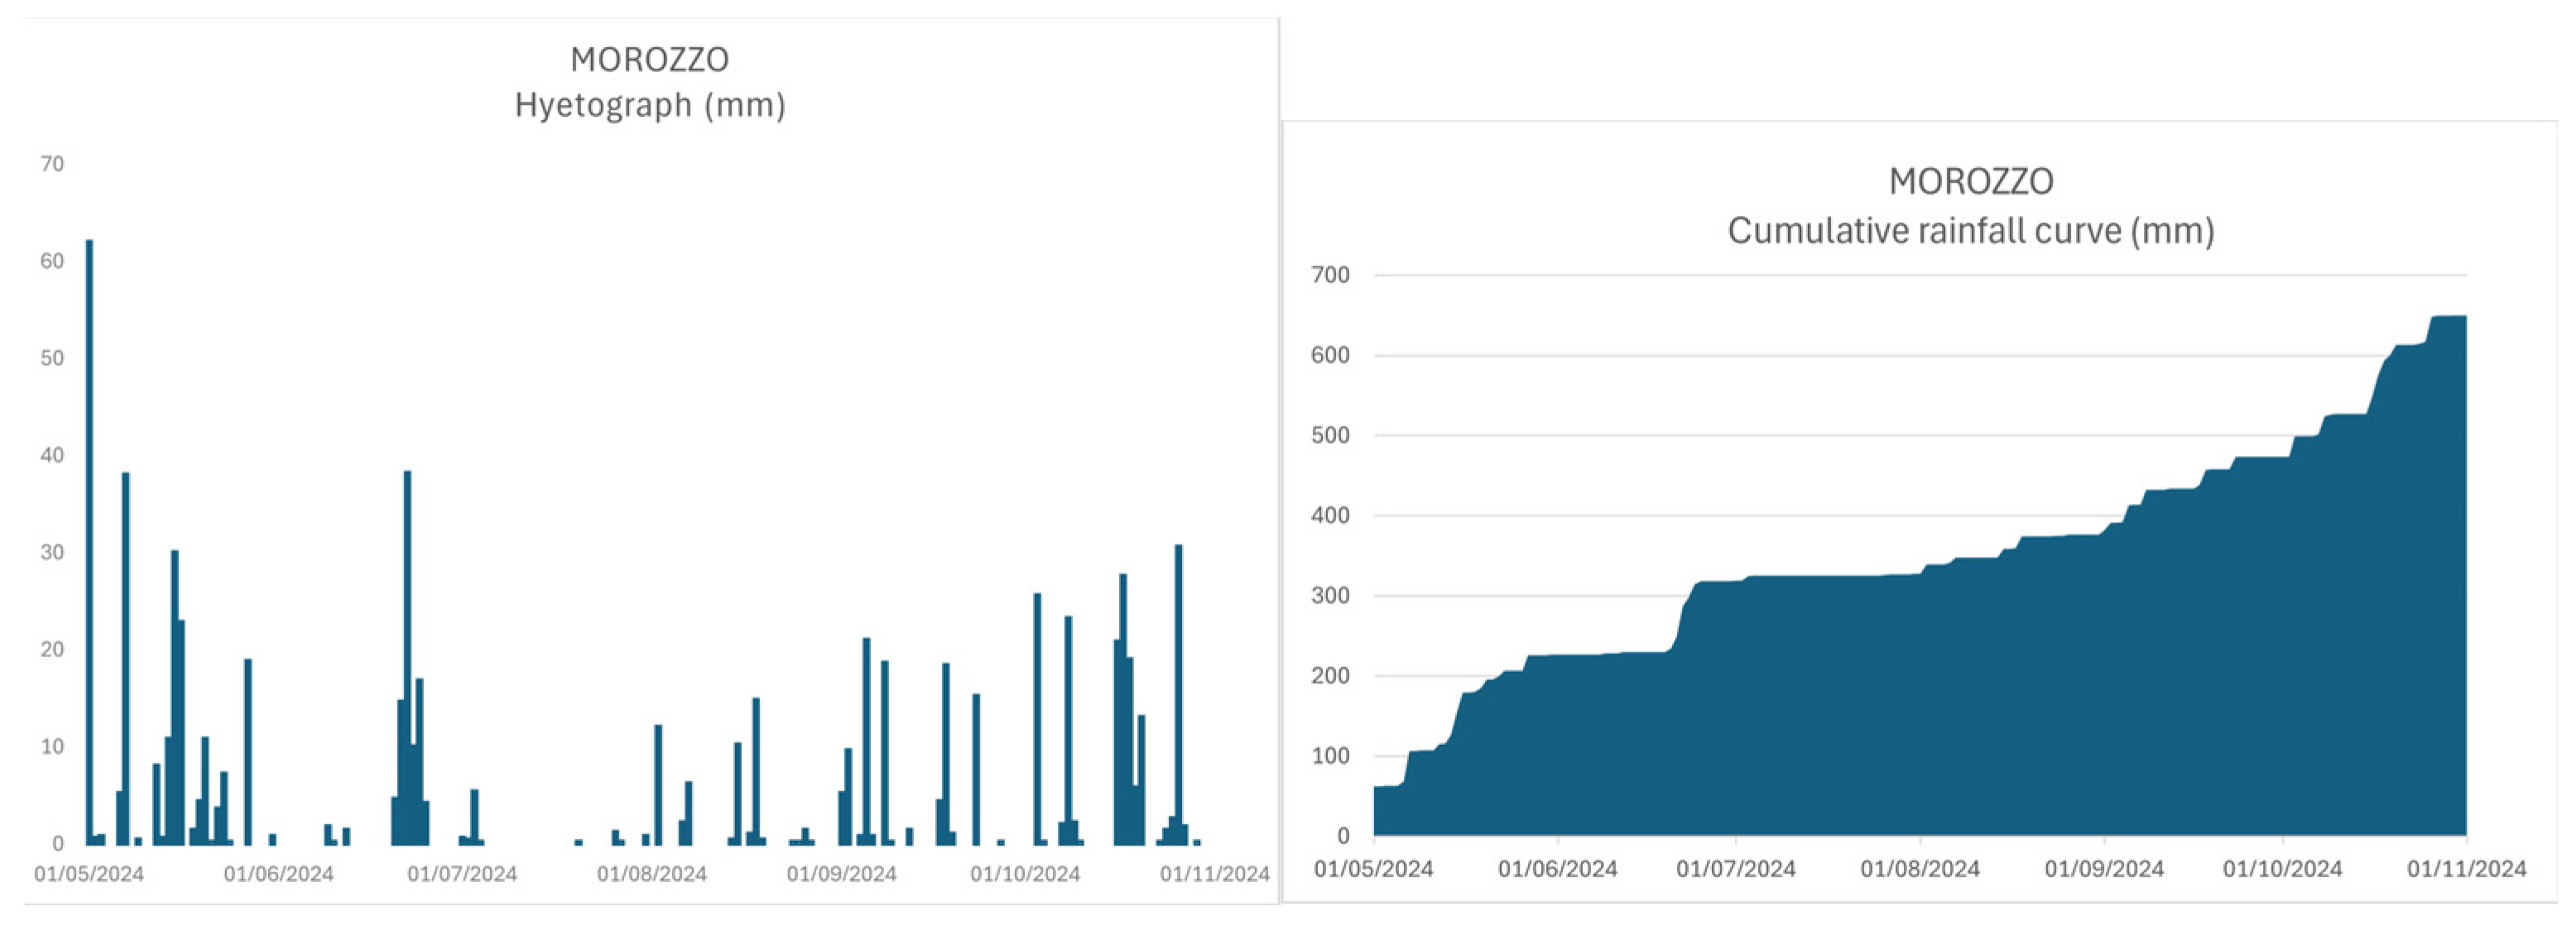
Due to the unfavorable weather conditions of summer 2024 (exceptionally rainy, Figure 3), some acquisitions were operated out of the dates of releases (not on Sunday), thus reducing the possibilities of a proper evaluation of the actual potential of this technology for mapping water flow during irrigation releases.
Figure 3.
Rainfall data recorded at the Morozzo station (approximately 6 km from the study area) during the period 1 May 2024–1 November 2024. On the left, the hyetograph showing daily rainfall depth (mm/day); on the right, the cumulative rainfall curve (mm).
Some of these “emergency” acquisitions were anyhow useful to suggest improvements, primarily in terms of a major stability of the system needed to provide acceptable thermal orthoimages, as the basis for the analysis.
At the end, based on the results of the 2024 campaign, the following improving actions were taken to make the system more compliant with the assigned task: (i) the image time laps was reduced (higher frequency of acquisition); (ii) the on-board gimbal-based pointing modes were modified and (iii) the location of the take-off was set farther away from the area of interest in order to guarantee its acquisition from higher altitudes. This last adjustment was intended to better fit geometric requirements of the photogrammetric processing (mainly, persistency of the target for a longer time in consequent frames).
2.3.2. Improved Campaign of Summer 2025
Based on the outcomes of the 2024 campaign, the CH platform was also technologically upgraded by introducing a motor-assisted stabilization and a higher capture frequency was set. Three new acquisitions were therefore carried out in August 2025 (Table 2) by the improved platform.
Table 2.
Main technical features of CH acquisitions operated in summer 2025.
2.4. Methodological Framework
Starting from 2024, the methodological framework adopted in this study was intended for evaluating the photogrammetric suitability of the data acquired by the CH system. It was structured into three main phases:
- Identification and quantification of geometric and operational criticalities;
- Implementation of improving actions at both the platform and data-processing level;
- Verification of improvements through quantitative performance metrics.
All evaluations were achieved admitting an operational scenario based on direct georeferencing of images (exterior orientation based on direct measures of position and attitude from POS) with no physical ground control point (GCP). It is worth highlighting that, given the expected average geometric resolution of FLIR70 images (few meters), whereas GCPs were decided to be adopted, they could come from existing aerial orthoimages (horizontal coordinates) and Digital Elevation Models (vertical coordinates). At this step, given the above-mentioned premises, the performance analysis of the system was focused exclusively on internal photogrammetric metrics.
2.4.1. Identification and Quantification of System Criticalities
Detection, characterization, and quantification of the main geometric and operational limitations affecting CH-based data acquisition is a crucial step when testing technology transfer of a new system for operational purposes.
According to a preliminary evaluation, three main key aspects were analyzed in detail, in particular (i) the vertical stability of the platform, possibly leading to sudden variations in image scale and footprint/overlap; (ii) the attitude stability (mainly of yaw) of the platform, possibly impacting the relative orientation between consecutive frames; (iii) the regularity of the platform speed, possibly leading to inconsistent data coverage (baseline variability).
The quantitative characterization of these key elements constitutes the foundation for the subsequent frame selection procedure: only by measuring the magnitude and temporal distribution of altitude fluctuations, yaw deviations, and inter-frame displacement can a principled filtering strategy be defined that isolates geometrically coherent image subsets suitable for photogrammetric processing. This step is particularly critical in the absence of GCPs, where any uncompensated platform instability propagates directly into georeferencing errors, mosaic discontinuities, and degraded spatial resolution of the final orthoimages with no possibility of a posteriori correction through block adjustment.
To describe these issues, positioning and attitude metadata, provided by the onboard POS, were analyzed to derive objective and reproducible indicators of system geometric performance. For each acquisition, a complete set of image parameters, including the coordinates of the camera focal point (WGS84 latitude, longitude, and ellipsoidal height), the three attitude angles (roll, pitch, and yaw), and the acquisition timestamps were used to model flight geometric features, looking for those conditions that could compromise the geometric quality of the image strip.
- Vertical stability
For all the investigated image blocks corresponding to the operated flights (Table 1 and Table 2), the vertical stability was assessed by looking for the minimum, maximum, mean, and standard deviation of recorded ellipsoidal altitude values from which the instantaneous height above ground level was derived. Such variations are interpreted as a primary source of image scale heterogeneity and irregular footprint size.
From a mapping perspective, this scale inconsistency directly produces spatially variable GSD across the final product and compromises the reliability of area and distance measurements derived from it. Furthermore, the ability to maintain stable and comparable flight altitudes across successive acquisitions translates into greater radiometric comparability between datasets, an essential prerequisite for multi-temporal thermal analysis in agricultural monitoring.
For each frame of the block, the corresponding theoretical GSD was calculated as a function (Equation (1)) of the instantaneous height above ground level (H), focal length (f), and physical pixel size (p) of the FLIR A70 thermal camera:
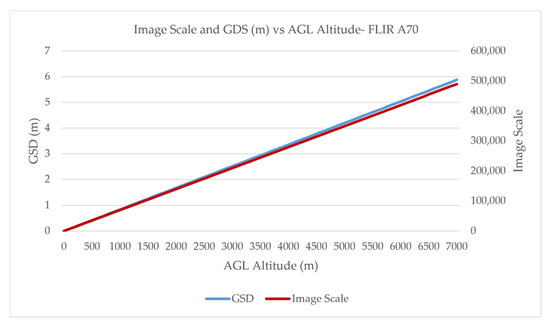
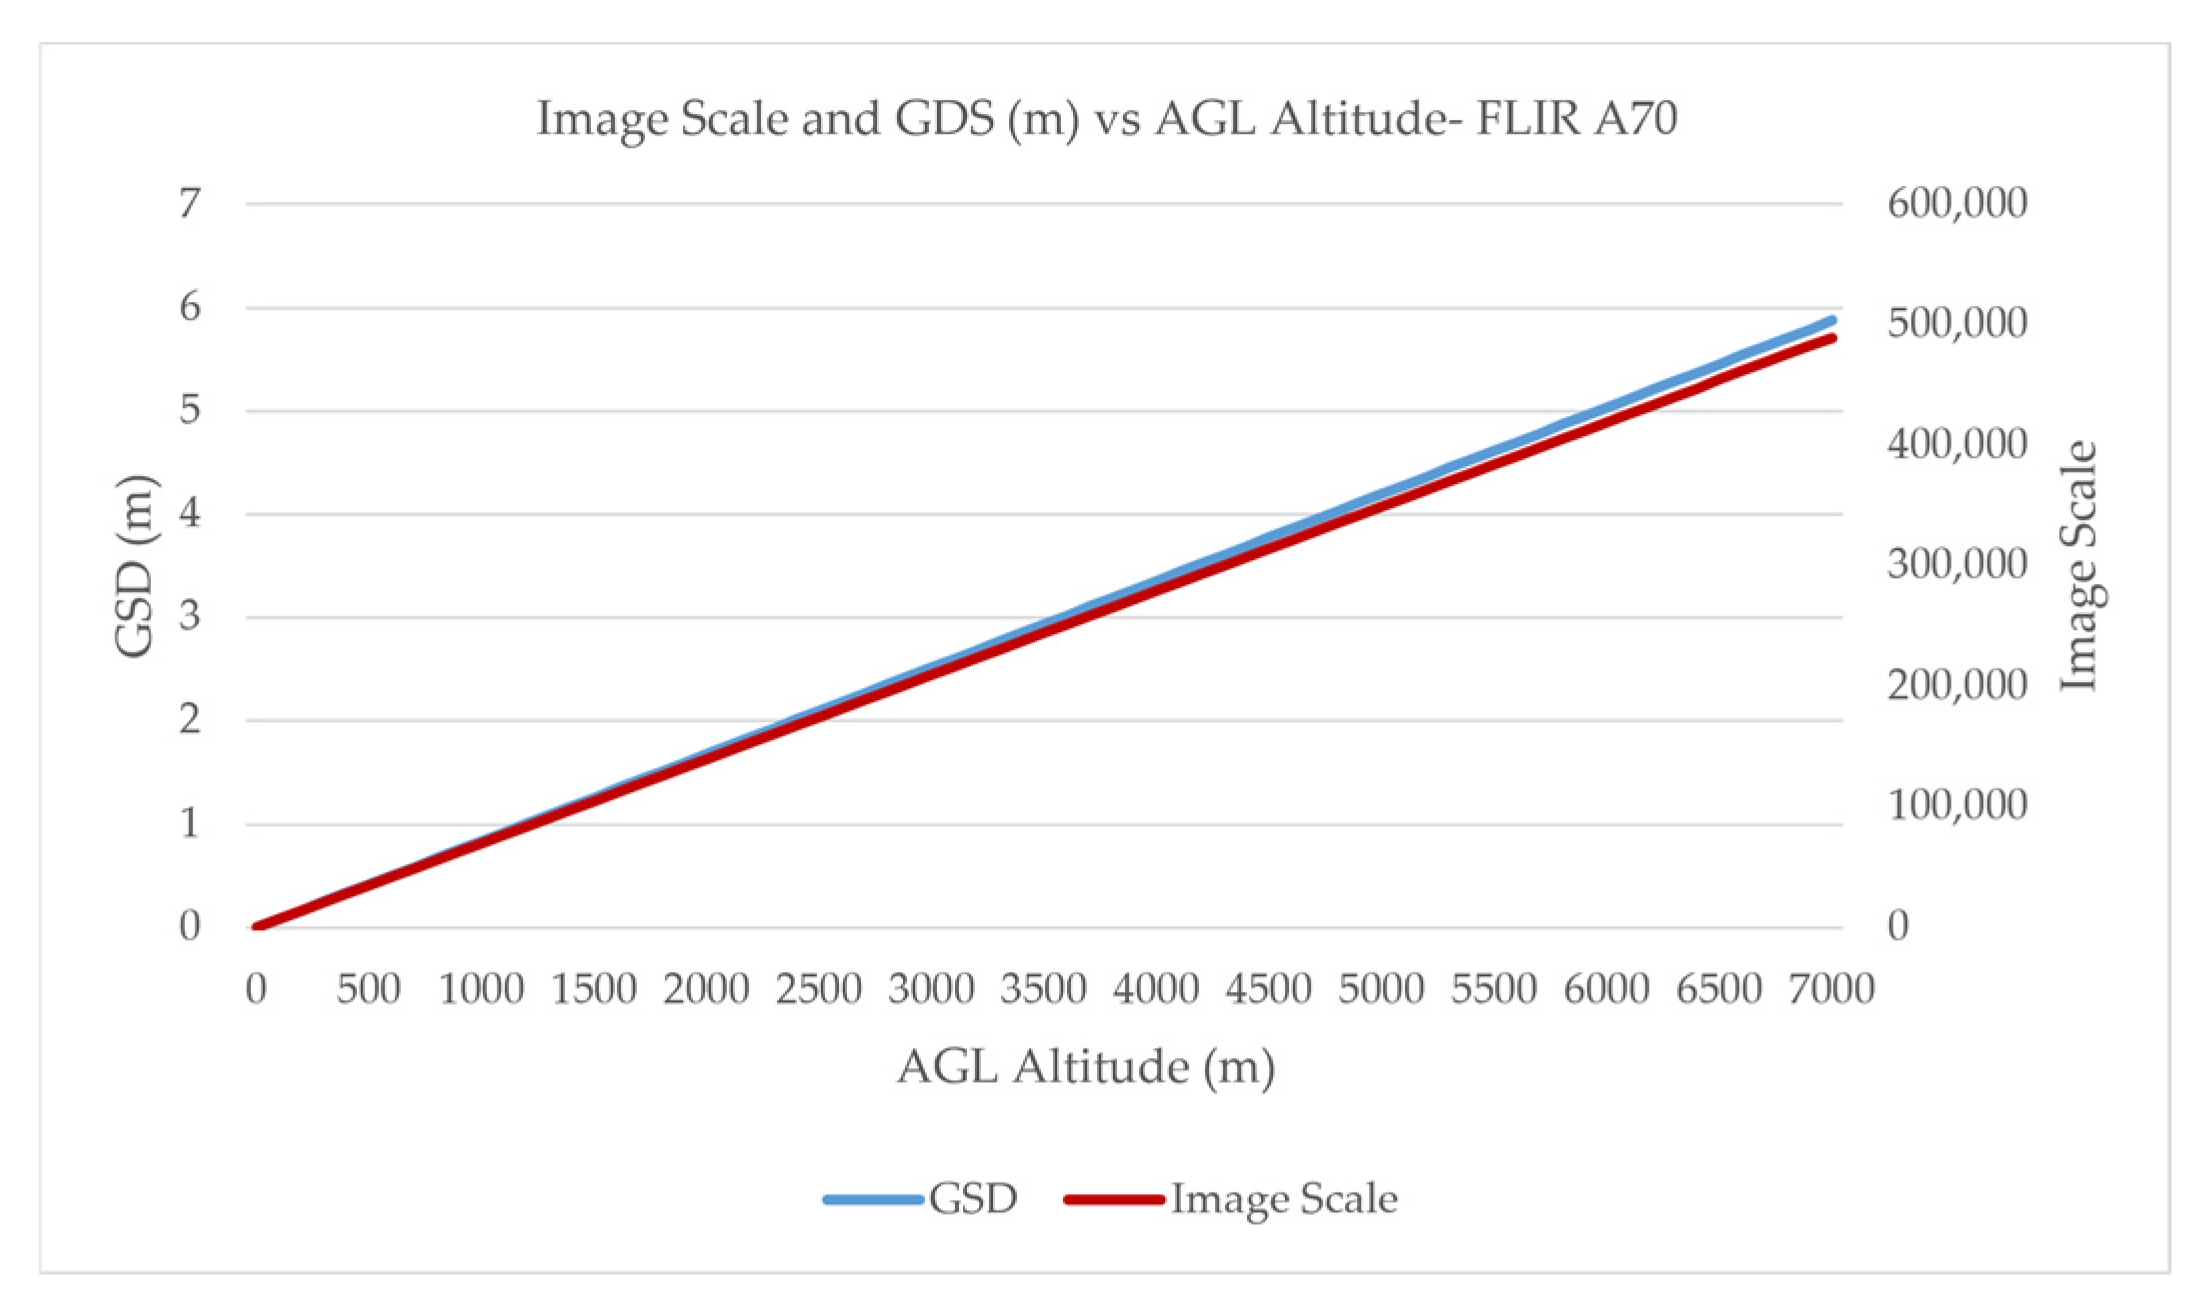
The relationship between GSD and altitude/image scale given for the FLIR A70 is reported in Figure 4.
Figure 4.
GSD versus image scale (red) and CH altitude (dark blue) for the FLIR A70 thermal camera.
The resulting GSD values from the images of the same block, a set of overlapping frames sharing consistent geometric acquisition conditions, were considered as a statistical variable, from which the corresponding distribution function and the following metrics were derived:
- The GSD mean value, used as a reference scale for block characterization;
- The GSD standard deviation value, intended as a measure of image scale variability;
- The ratio between the maximum and minimum GSD values (GSDmax/GSDmin), used as a normalized indicator of relative scale variability.
- Attitude stability
The attitude stability was evaluated by analyzing the variability of yaw, pitch, and roll angles along the flight, which are, respectively, rotations about the Z, Y, and X axes. Since roll and pitch proved to be quite stable, thanks to the gimbal (with low angular rate fluctuations mean ≈ 0.3°/s for pitch and ≈0.2°/s for roll) and, therefore, there was less conditioning on the effectiveness of the image block bundle adjustment, the focus was only on the yaw. Yaw angle was considered as the most critical one since it has a major effect on the relative orientation between consecutive frames, thus leading to the loss of image overlapping which is at the basis of image orientation. From an image-quality perspective, this translates directly into reduced tie-point density between consecutive frames, potential gaps in the orthomosaic footprint, and spatial inconsistencies in the final thermal map that cannot be recovered in post-processing.
The velocity of yaw changes (degrees/s, Equation (2)) was also considered to quantify the intensity of rotation over time. For each consecutive image (stereoscopic pair), the difference in the correspondent yaw angles () was referred to as the time span between two consequent acquisitions (Δt).
This metric was considered as crucial to detect sudden rotations that may compromise the geometric consistency and relative orientation of images that could lead to the failure of the image bundle adjustment process.
- Image baseline stability
The trajectory regularity was assessed by looking at the spatial continuity of image capturing along the flight in terms of horizontal positioning. The WGS84 latitude and longitude values, providing the instantaneous position of the image focal point, were considered. From a mapping perspective, irregular inter-frame distances directly translate into non-uniform ground coverage: where the platform accelerates, frame spacing exceeds the minimum overlap threshold, generating gaps in the final orthomosaic.
The focal point position of each frame was considered to model system trajectory with the aim of detecting eventual lateral displacements, and baseline variations, possibly related to wind-driven drifts and accelerations/decelerations.
The linear displacement (d) between consecutive frames can be estimated from the geographic coordinates of the correspondent focal points using the equirectangular approximation of Equations (3)–(5).
where R is the local Earth radius (for short distance, this is set to the mean Earth radius, 6371 km) and the lat and lon values are expressed in radians. This is a simplified method that applies the Pythagorean theorem on an equirectangular projection for estimating the distance between two geographical points over relatively small distances.
The combined analysis of vertical and horizontal positioning and attitude variations is expected to highlight stable and unstable flight phases along the flight, enabling a proper selection of images consistent with photogrammetric requirements. This step is intended as mandatory and preliminary for a proper interpretation of eventual criticalities affecting the photogrammetric process.
2.4.2. Operational Exploitation of Flight Metrics
At the procedural level, the high variability of frame acquisition conditions along the flight trajectory requires the development of a systematic methodology for the identification and selection of images suitable for photogrammetric processing, meeting the minimally acceptable geometric requirements: proper overlap, limited variation in image scale, and stable orientation. A schematic example of image subset selection is reported in Figure 5.
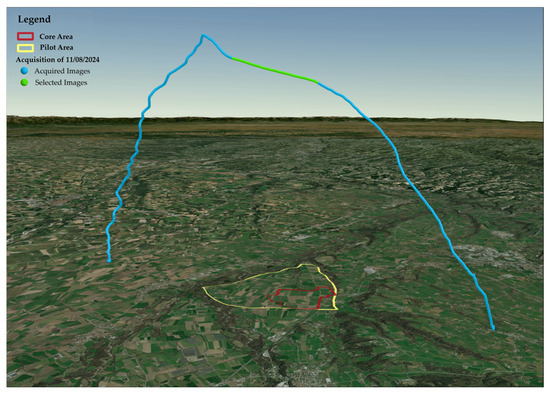
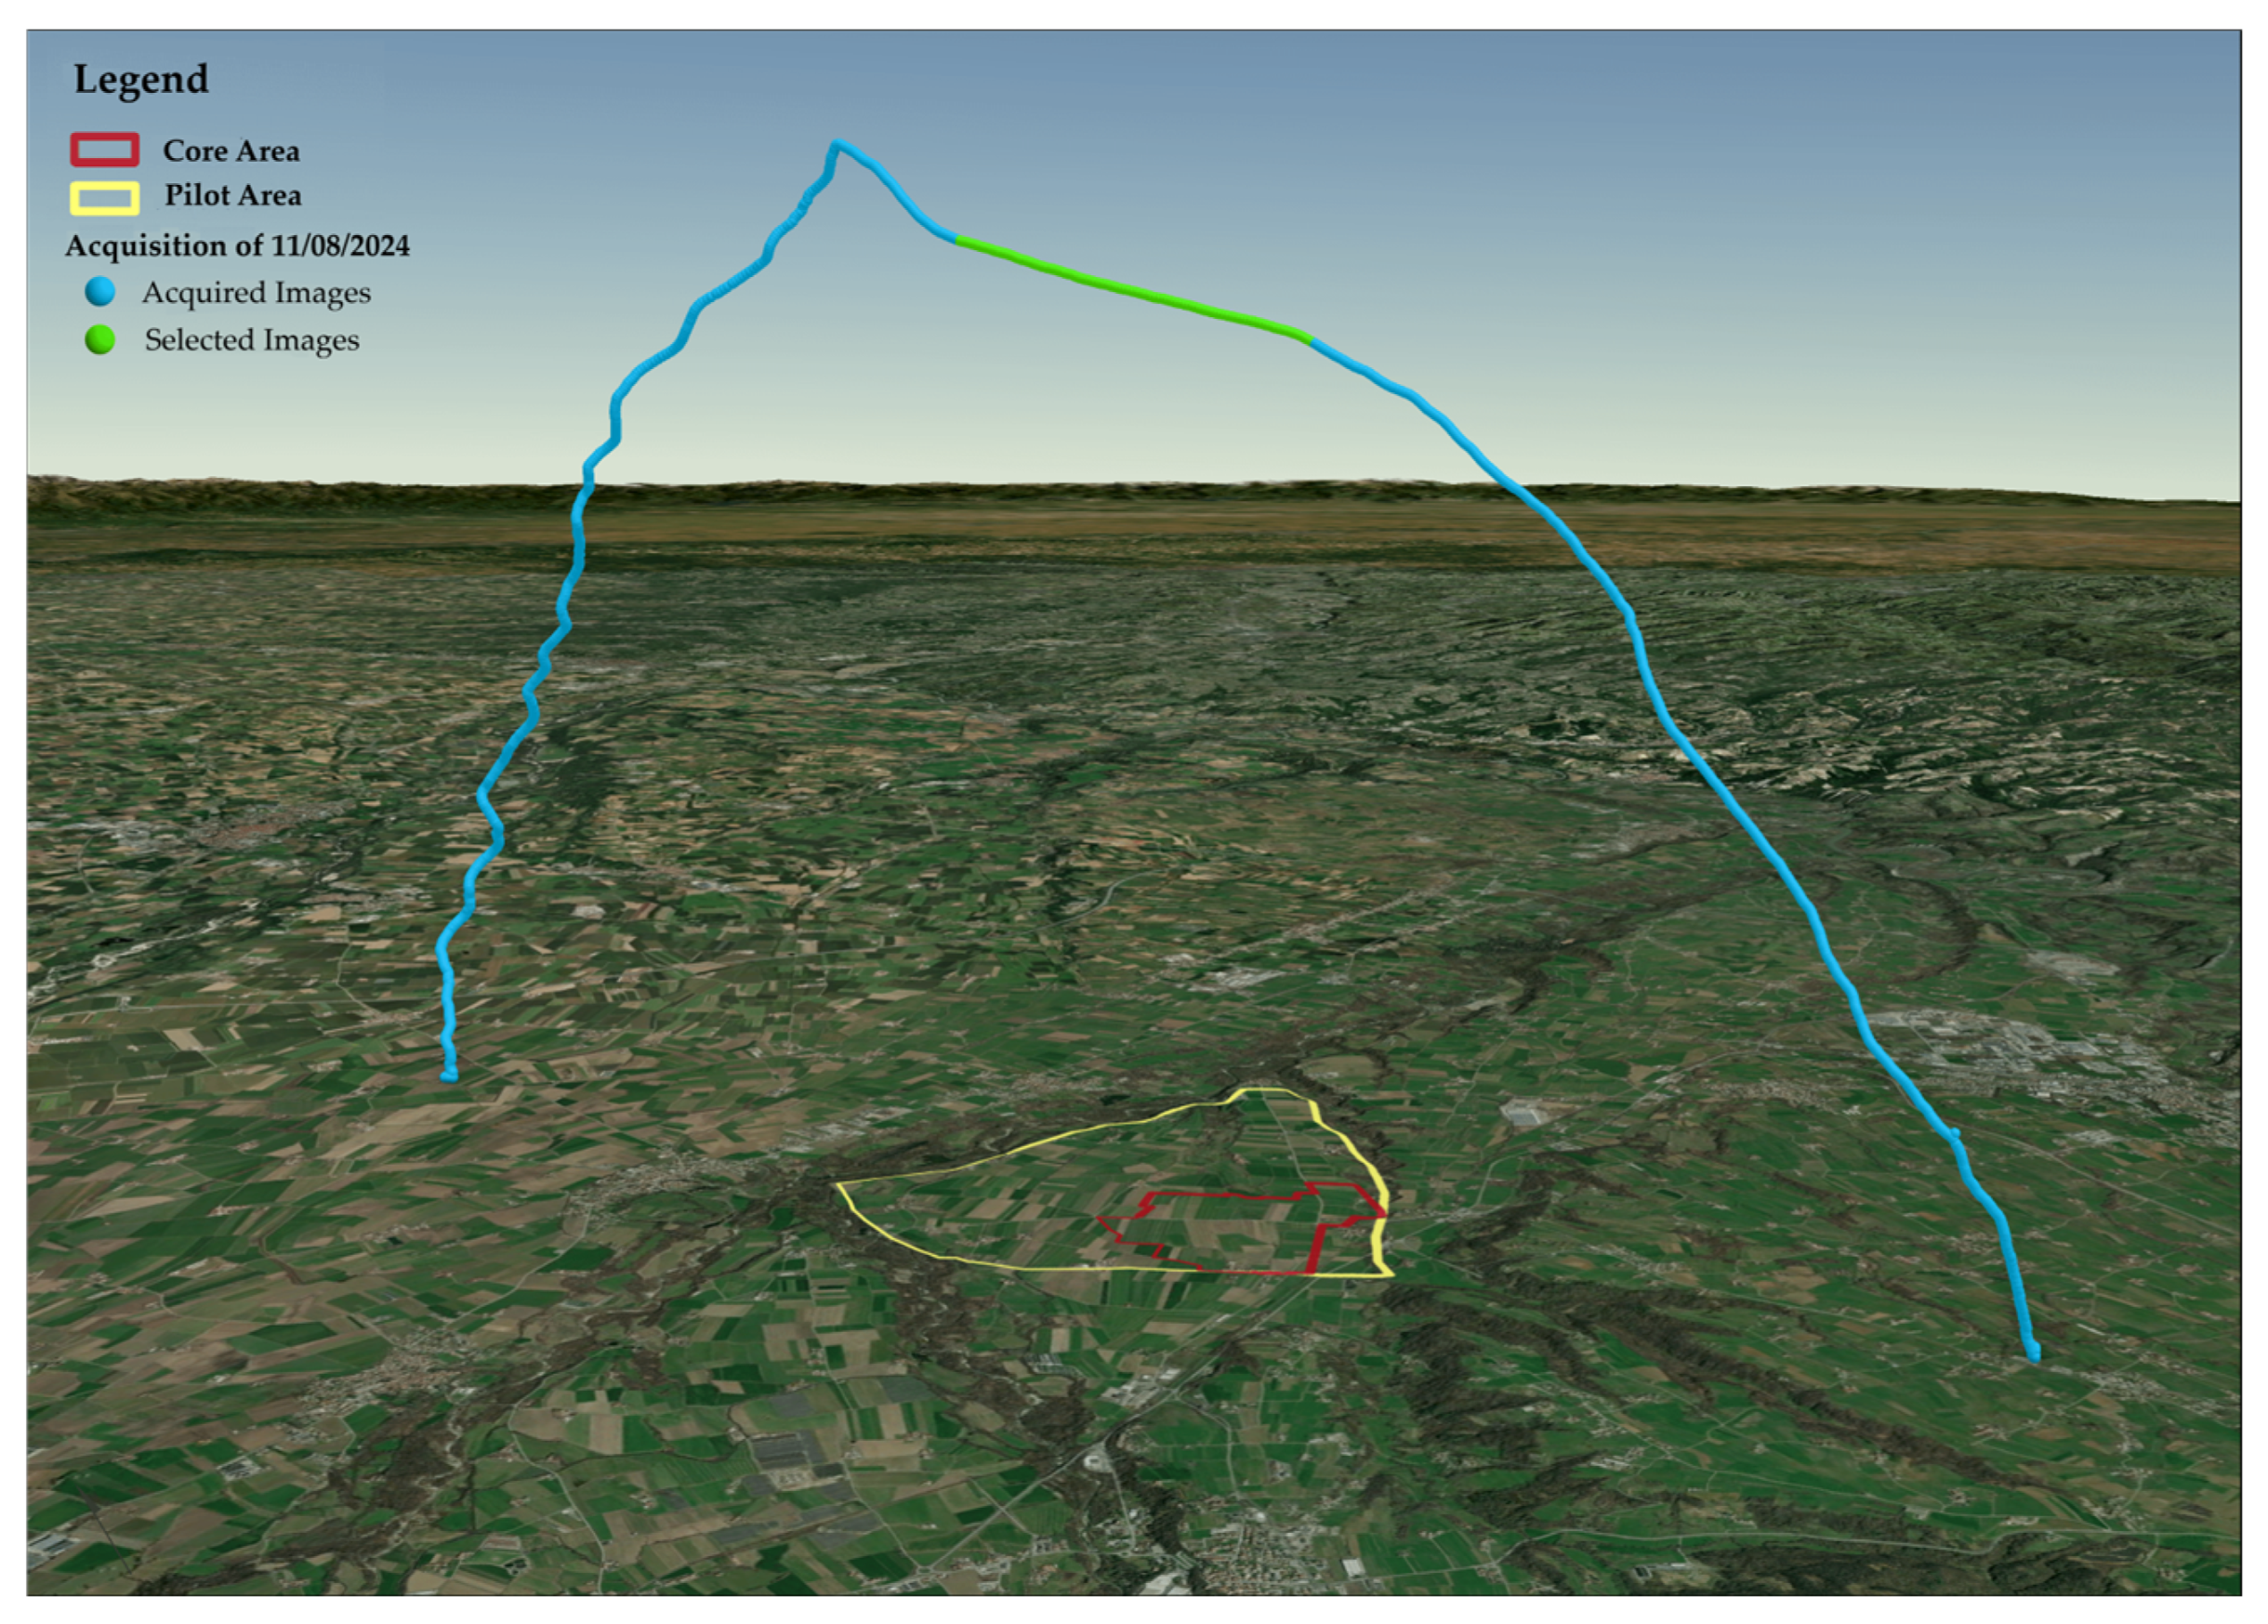
Figure 5.
CH flight trajectory during the acquisition operated on 11 August 2024 at 10:30. The green part of the line indicates the subset of selected frames characterized by reduced variation within the flight path.
The following proposed frame selection strategy is based on a multi-step filtering workflow that exploits the metadata information of frames provided by POS: position (vertical and horizontal), attitude angles, and acquisition timestamps.
The first selection criterion looks for the stability of the image scale, i.e., of the GSD values. These can be computed as a function of the image scale (Equation (1)). Images are considered suitable only if the GSD falls within ±10% of the block GSD mean value and if the ratio between the maximum and minimum GSD values (GSDmax/GSDmin) remains below a predefined threshold of 1.15. The mean GSD is adopted as a statistical reference to characterize the representative scale conditions within the block. Although there are no standardized numerical thresholds in the literature for acceptable GSD variation within an image block, maintaining a relatively uniform scale is widely known as pivotal for reliable feature matching during the Structure-from-Motion (SfM) processing stage.
A second criterion concerns spatial continuity along the flight direction. The maximum admissible distance between successive frames is defined as a function of the desired forward overlap, according to the relationship (Equation (6)):
where Of is the forward overlap fraction (set to 80%) and Npix is the number of pixels along the sensor flight direction (set to 640). This constraint ensures that overlap between images is sufficient to support robust tie-point matching and reliable block geometry.
Finally, an additional filtering criterion is related to the angular stability of the platform, with particular emphasis on the variability of the yaw angle. Only frame sequences characterized by limited angular variations can be accepted, in order to minimize abrupt changes in viewing geometry.
According to the photogrammetric literature and aerial imaging specifications, yaw (crab) angles should not exceed ±2°, with larger deviations (till ±5°) allowed only for a small percentage of images [39]. However, light and small UAV or platforms such as those considered in this study are not as reliable as traditional aerial photogrammetric systems and are more susceptible to the effects of wind and other weather factors. In such cases, the rotation angle may increase up to 10° or even more [40].
As a consequence, due to the strong dependence of the flights on local wind patterns, for these experimental acquisitions, the mean yaw of the selected frames was constrained according to (7):
where ψi is the yaw of the individual frame i and ψmean is the mean yaw of the selected block.
∣ψi − ψmean∣ < 10°
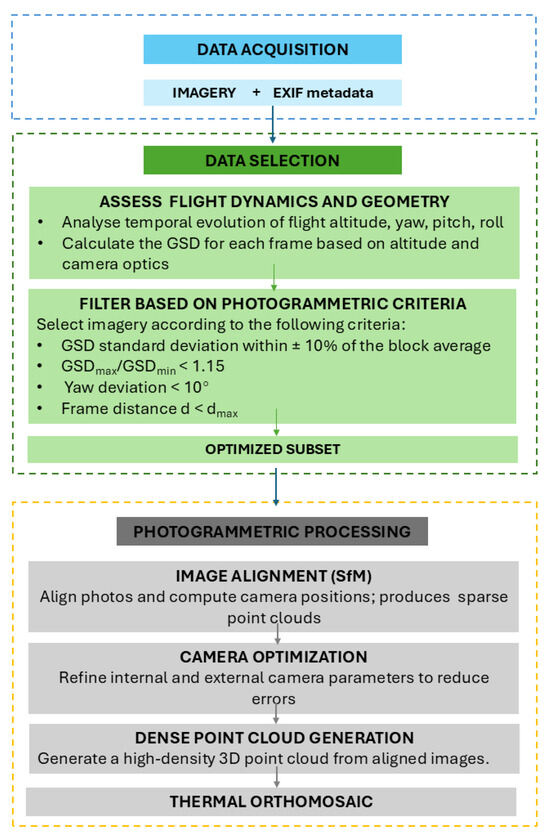
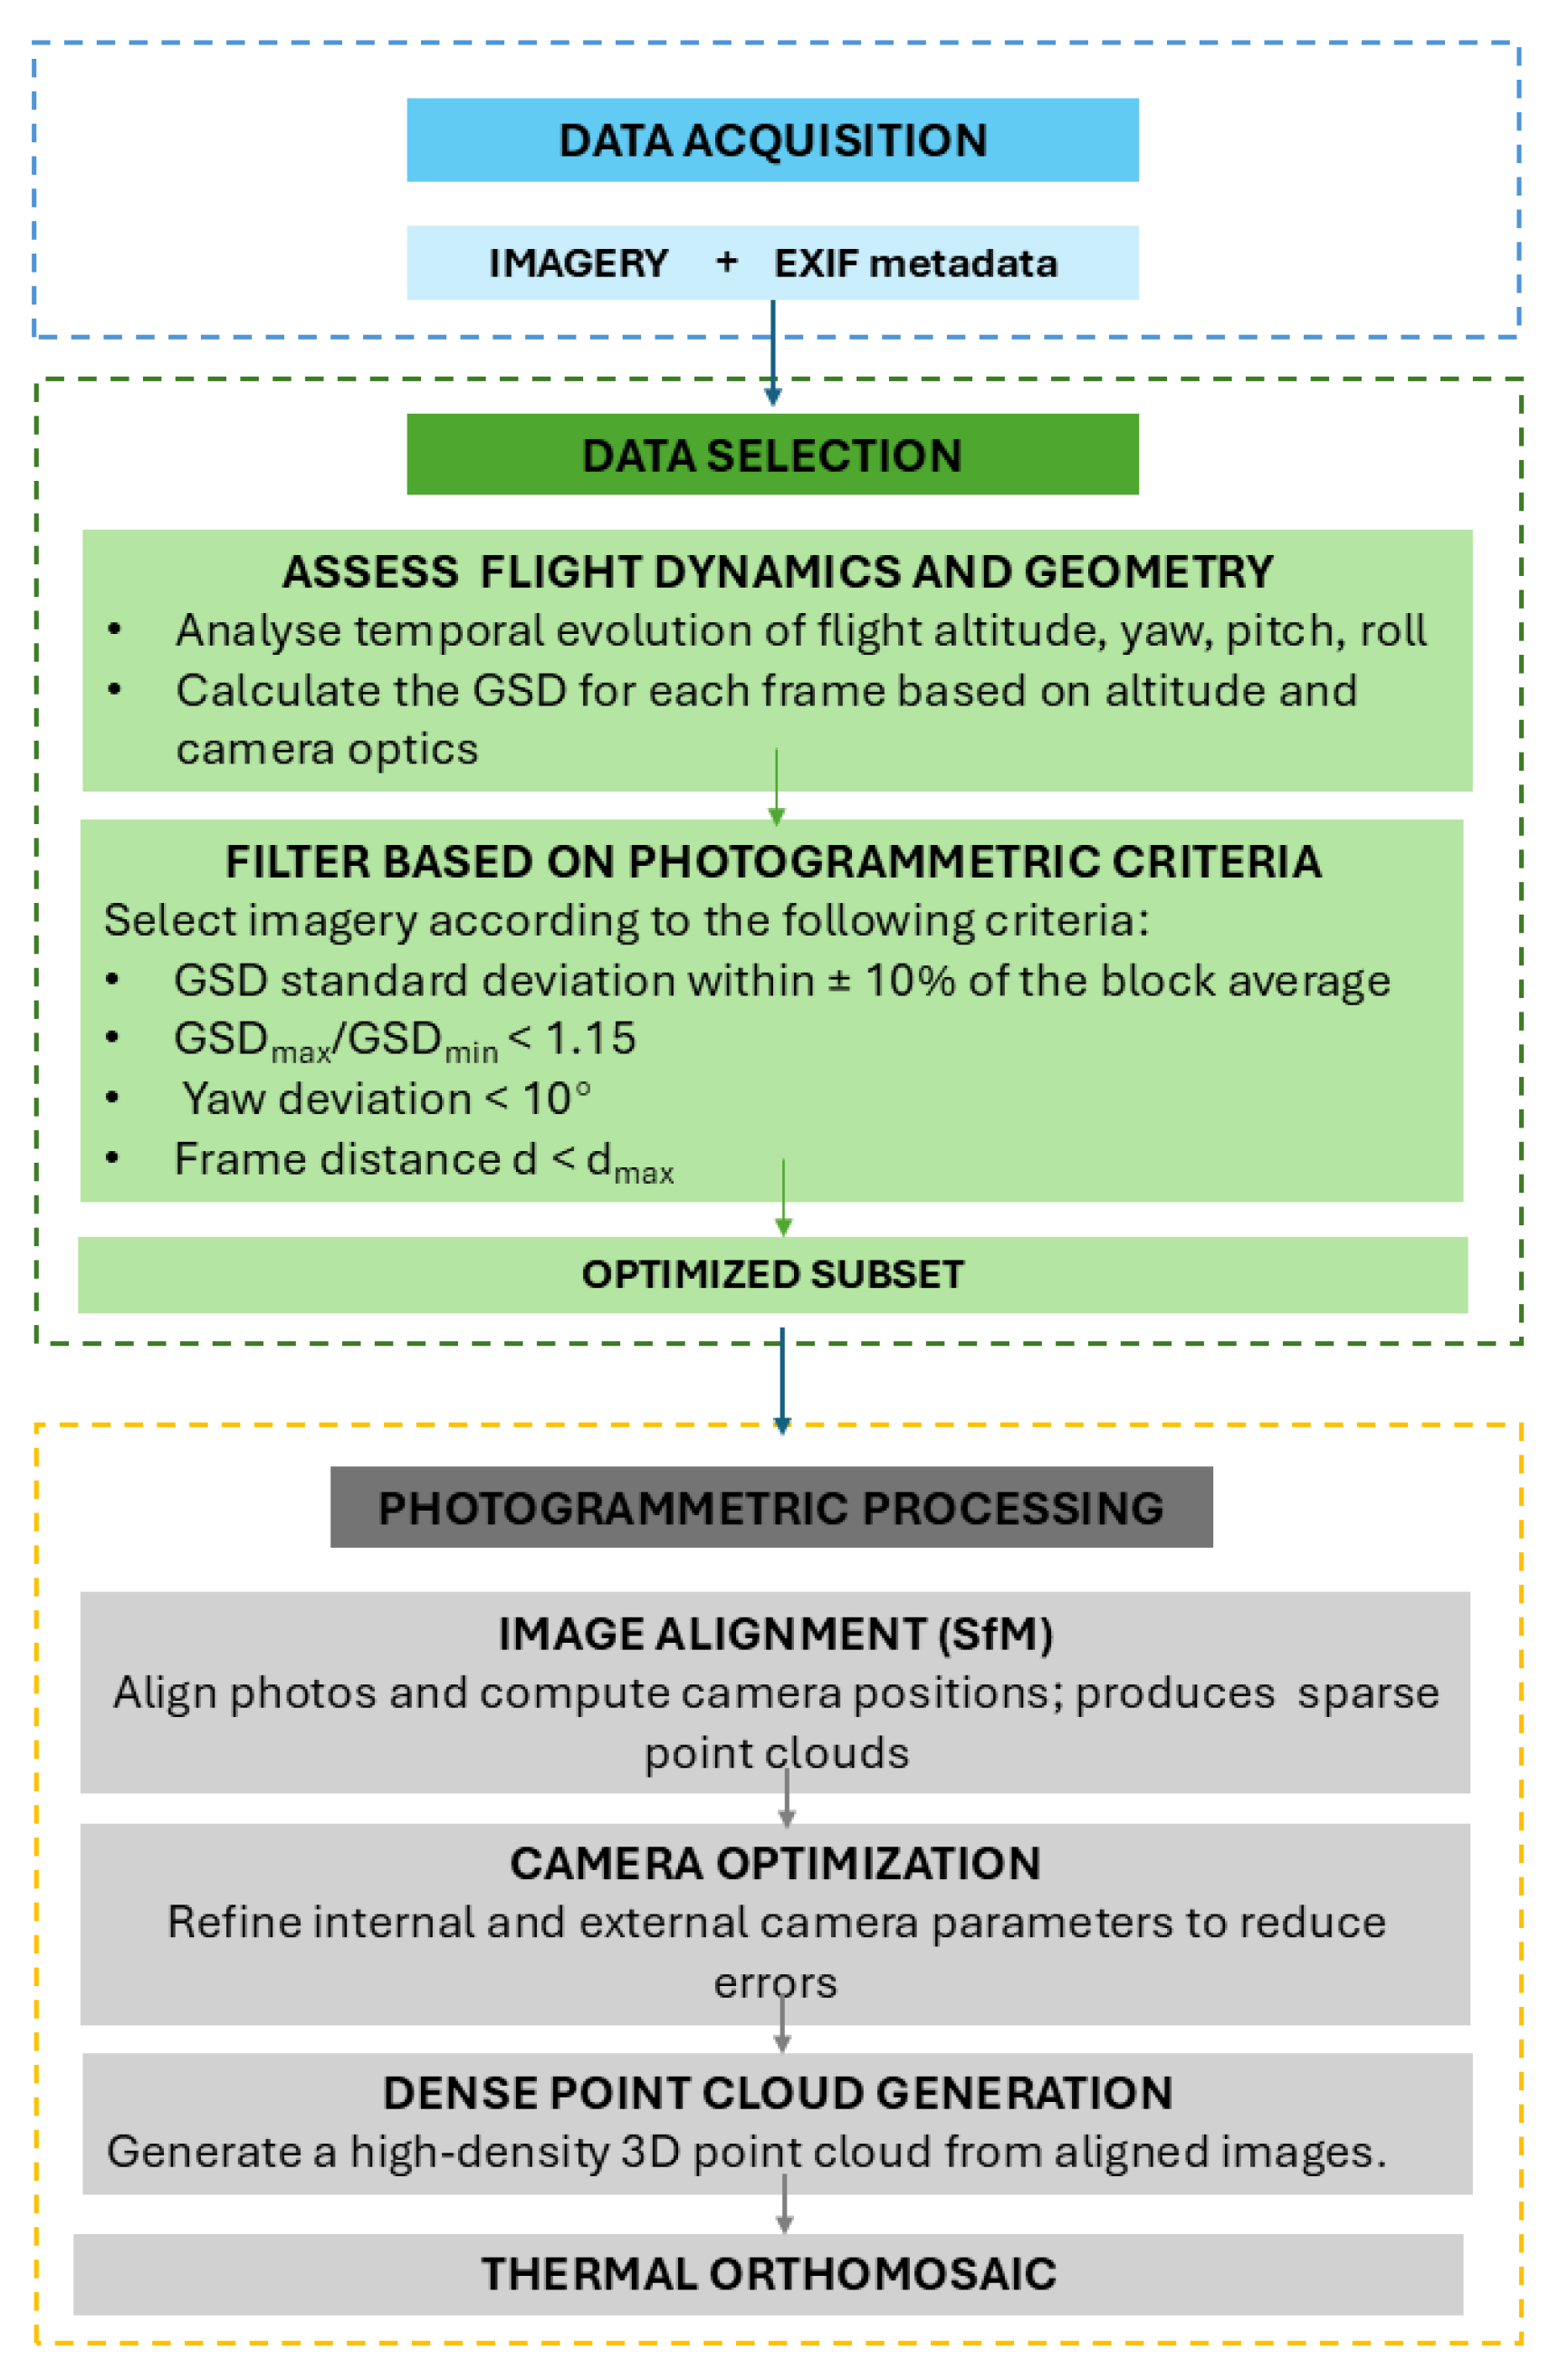
Figure 6 shows the multi-step filtering workflow aimed at identifying those frame sequences that best fulfil photogrammetric requirements.
Figure 6.
The graph shows the conceptual workflow used in this study. In green is the filtering strategy, starting from the imagery and ending with the definition of refined acquisition blocks suitable for reliable orthomosaic and DSM generation. In gray is the traditional subsequent photogrammetric processing workflow.
Frame geometric features were preventively explored and the whole image series of the same flight was split into frame blocks, each meeting the above-mentioned photogrammetric requirements (GSD stability, yaw deviation and overlapping). Since not all frames satisfied these conditions, blocks could contain not-contiguous images. Given the geometry of the trajectory, blocks corresponding to the higher altitudes were preferred. Each block was then provided with a “photogrammetric suitability” score based on its mean altitude , number of frames , and GSD standard deviation . To avoid scale-dependent bias, these variables were normalized in the range [0, 1] using min–max normalization. The score is then calculated according to (8):
where , , and represent the normalized values of mean altitude, number of frames, and GSD standard deviation, respectively.
The block with the highest score is then selected as the representative sequence for further analysis. The operational implementation of this procedure, carried out through a Python 3.13.14 script, currently represents the most effective operational compromise for mitigating the intrinsic limitations of CH-based acquisitions, pending future technological developments capable of providing levels of stability and controllability comparable to those of UAV platforms.
2.4.3. Corrective Actions of the System
The corrective actions implemented as a consequence of this study consist of a set of procedural and system-level measures designed to address the geometric and operational limitations identified during the first experimental acquisition phase.
At the platform level, system upgrades based on a motor-assisted stabilization and control system were implemented in 2025 in order to enable regulation of platform stability during image acquisition. Altitude control constrains the vertical range during image capture, minimizing large variations in platform heights that directly affect image scale. Rotational control is applied primarily to yaw, and secondarily to pitch and roll, to reduce abrupt changes in camera orientation that could compromise geometric continuity between frames.
2.4.4. Quantitative Performance Metrics
The impact of flight dynamics and geometric consistency on the effective usability of the data is quantified through a set of photogrammetric performance indicators derived from SfM and dense matching stages. The number of tie points extracted during feature detection and matching is used as an indicator of the ability of the image block to support robust relative orientation and bundle adjustment. Low tie point counts are interpreted as evidence of insufficient overlap, excessive scale differences, or abrupt changes in viewing geometry. The number of dense points is used to quantify the level of geometric detail that can be achieved from the selected frame subset. This metric is particularly sensitive to the internal coherence of the block and to the uniformity of image scale and orientation. The point density per square meter (point/m2) allows comparison between blocks characterized by different image counts and spatial extents. Higher values indicate greater geometric reliability of the resulting point cloud and orthomosaic products.
In addition, geometric quality was further assessed considering the difference between the expected and estimated image coordinates of points belonging to the clouds (reprojection error). In particular, the RMSE (Root Mean Squared Error) reprojection error of tie points was considered to quantify the internal stability of the reconstructed block [41]. Lower values of this indicator are associated with better-conditioned solutions and improved feature matching reliability. In contrast, higher dispersion in RMSE values highlights reduced geometric coherence and increased sensitivity to flight dynamics and variations in acquisition geometry.
3. Results and Discussion
The following section presents the results structured around three progressive analytical steps: (i) the geometric and operational characteristics of the raw flight data from both campaigns are quantified to establish the extent of platform instability; (ii) the performance of the automatic frame selection workflow is evaluated in terms of its ability to extract geometrically coherent image subsets; (iii) the photogrammetric quality of the selected blocks is assessed through bundle adjustment metrics, demonstrating the effectiveness of the proposed approach in producing geometrically consistent photogrammetric blocks suitable as a basis for future mapping workflows.
3.1. Observed Geometric and Operational Characteristics in CH Acquisitions
The acquisitions carried out with the CH system during the 2024 and 2025 campaigns exhibit distinct geometric and operational characteristics, strongly influenced by both environmental conditions and system configuration.
In the 2024 campaign, flight trajectories were characterized by pronounced variability in maximum acquisition altitude, ranging from approximately 2789 to 7443 m above ground level (Table 1 and Table 2). This variability results in a wide dispersion of ground sampling distance (GSD), spanning from 2 m to 5 m, and consequently leading to significant heterogeneity in image scale across individual frames. No enduring stable flight plateau was observed during these acquisitions, as altitude continuously changed throughout the whole flight profiles.
The 2025 campaign, however, showed a different behavior. Although altitude variability was still significant during ascent and descent phases, distinct intervals of quasi-stable flight conditions were recognizable (typically between 3730 m and 3840 m). In these periods GSD values remain stable enough, varying between 3.2 m and 3.22 m, thus ensuring a major consistency of image scale.
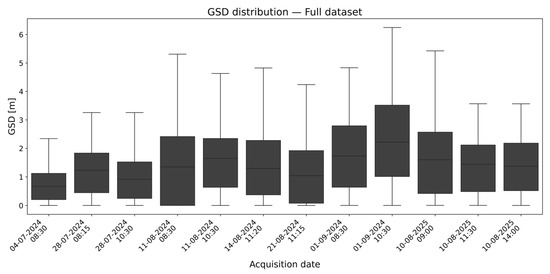
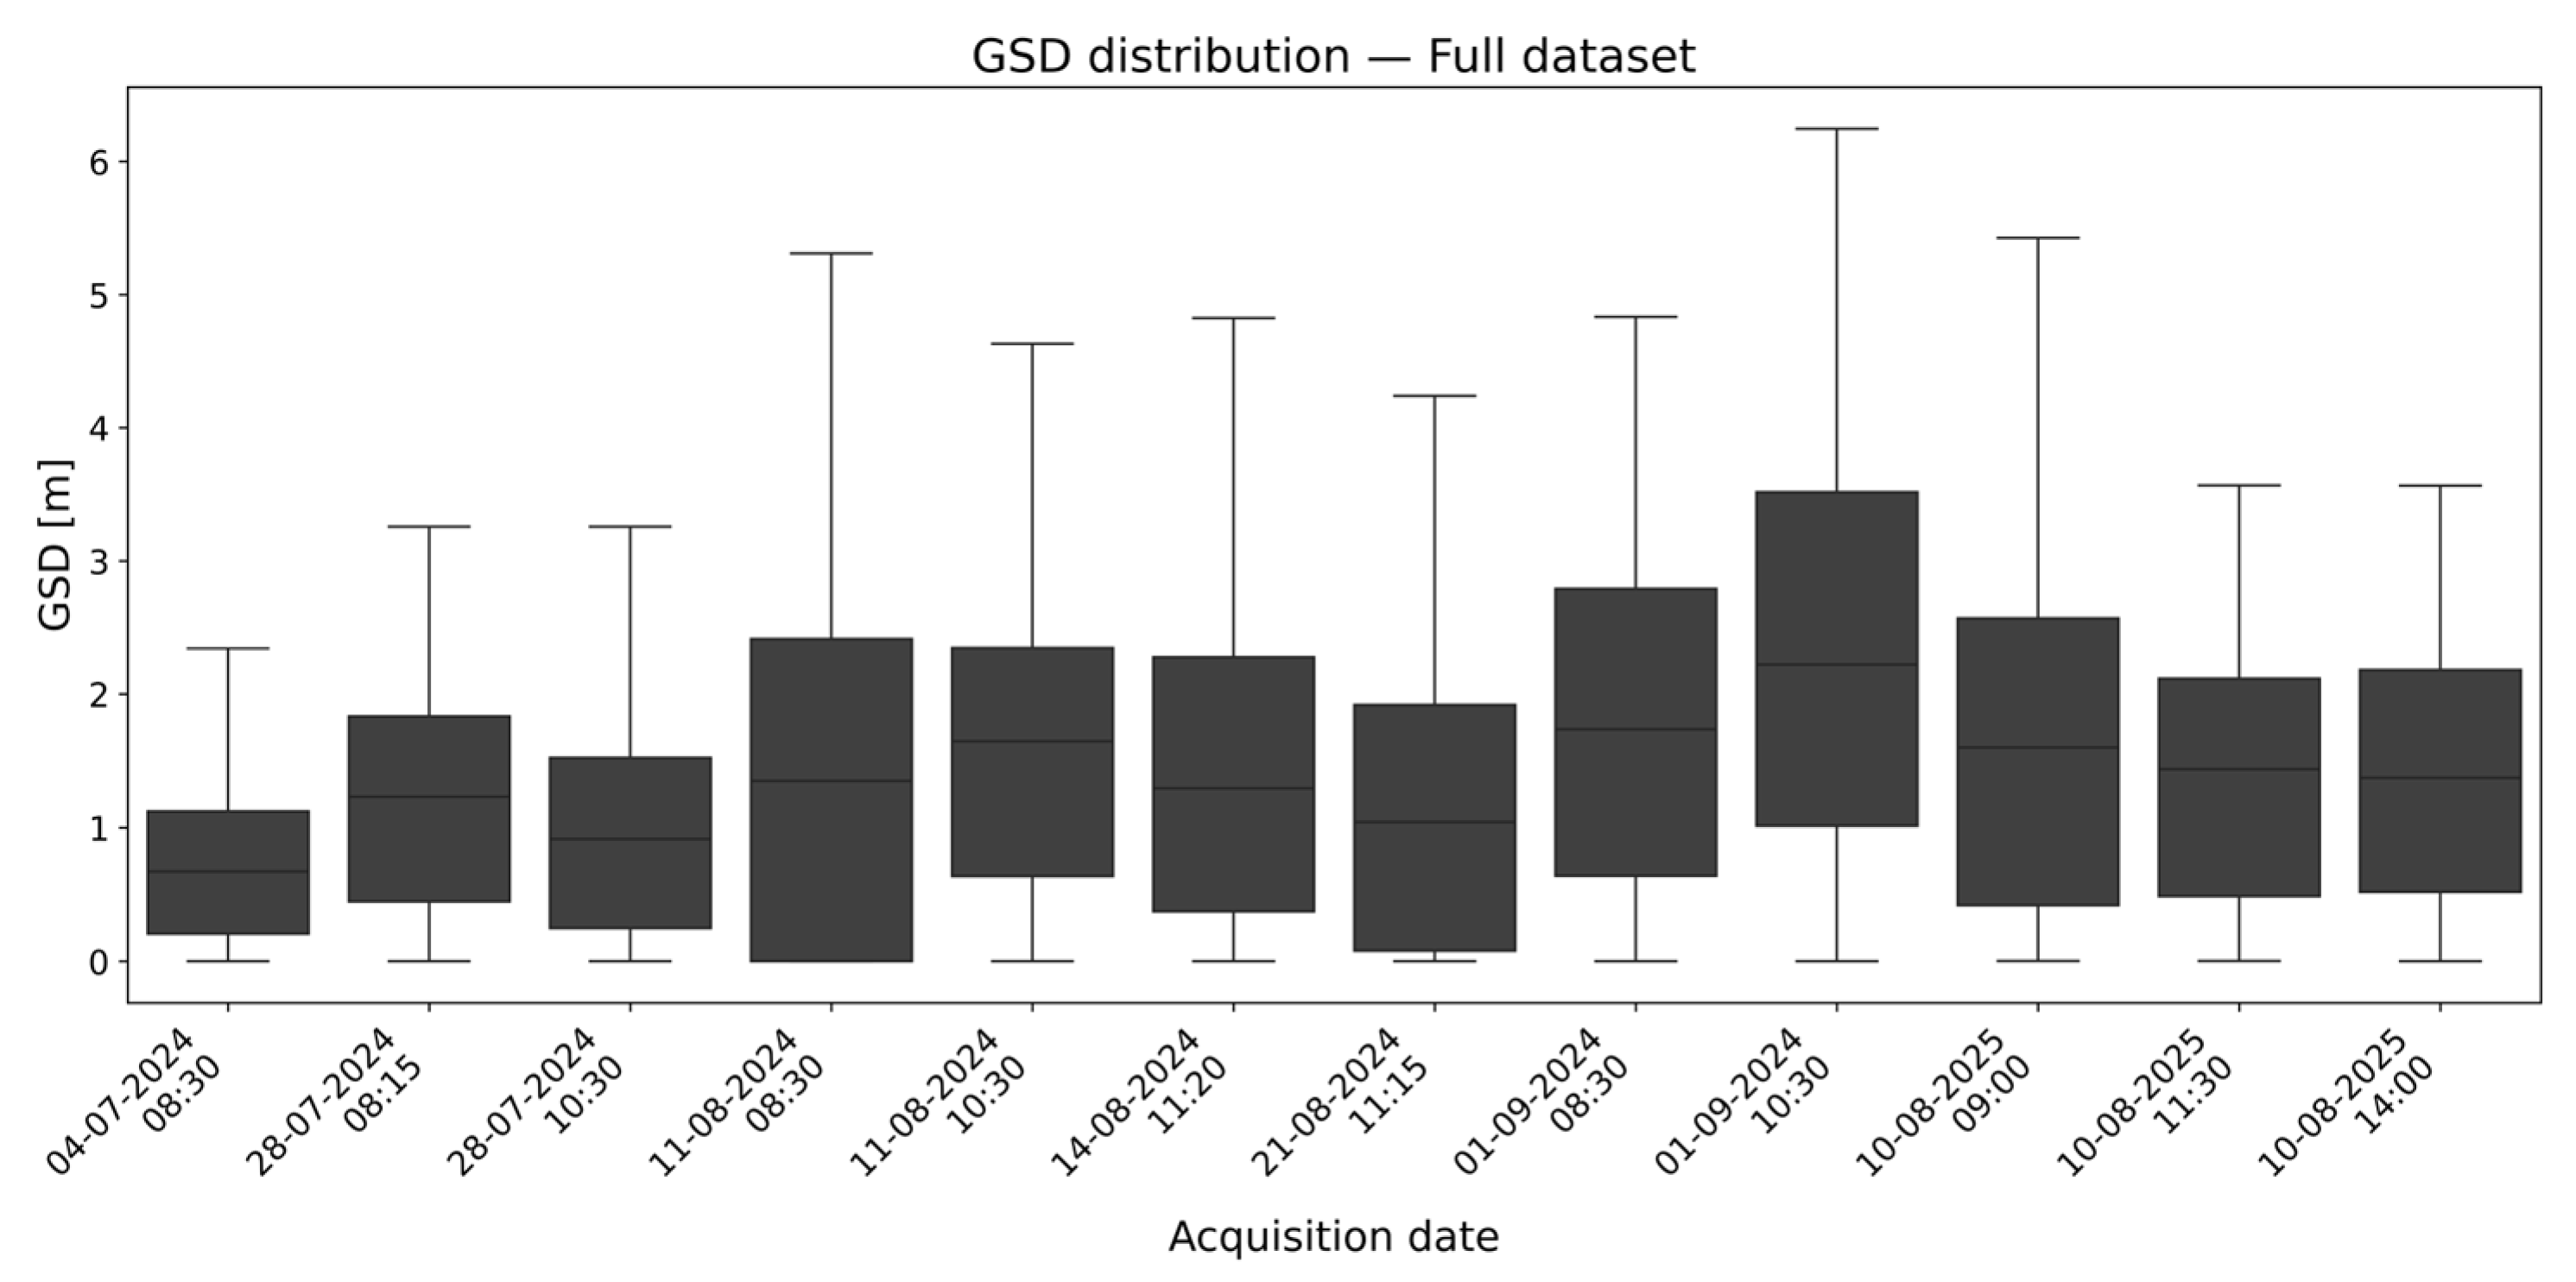
The statistical distribution of mean GSD values (Figure 7) further highlights these differences. The 2024 acquisitions exhibit a broader spread, reflecting strong variability in platform altitude and consequently in spatial resolution. Conversely, the 2025 datasets were characterized by a more compact distribution of mean GSD values, consistent with the presence of stabilized acquisition intervals.
Figure 7.
Boxplots show the distribution of GSD values for each acquisition session, simulated from the mean and standard deviation.
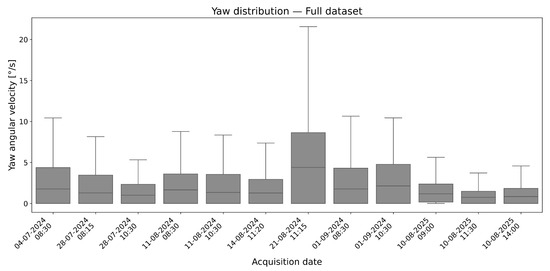
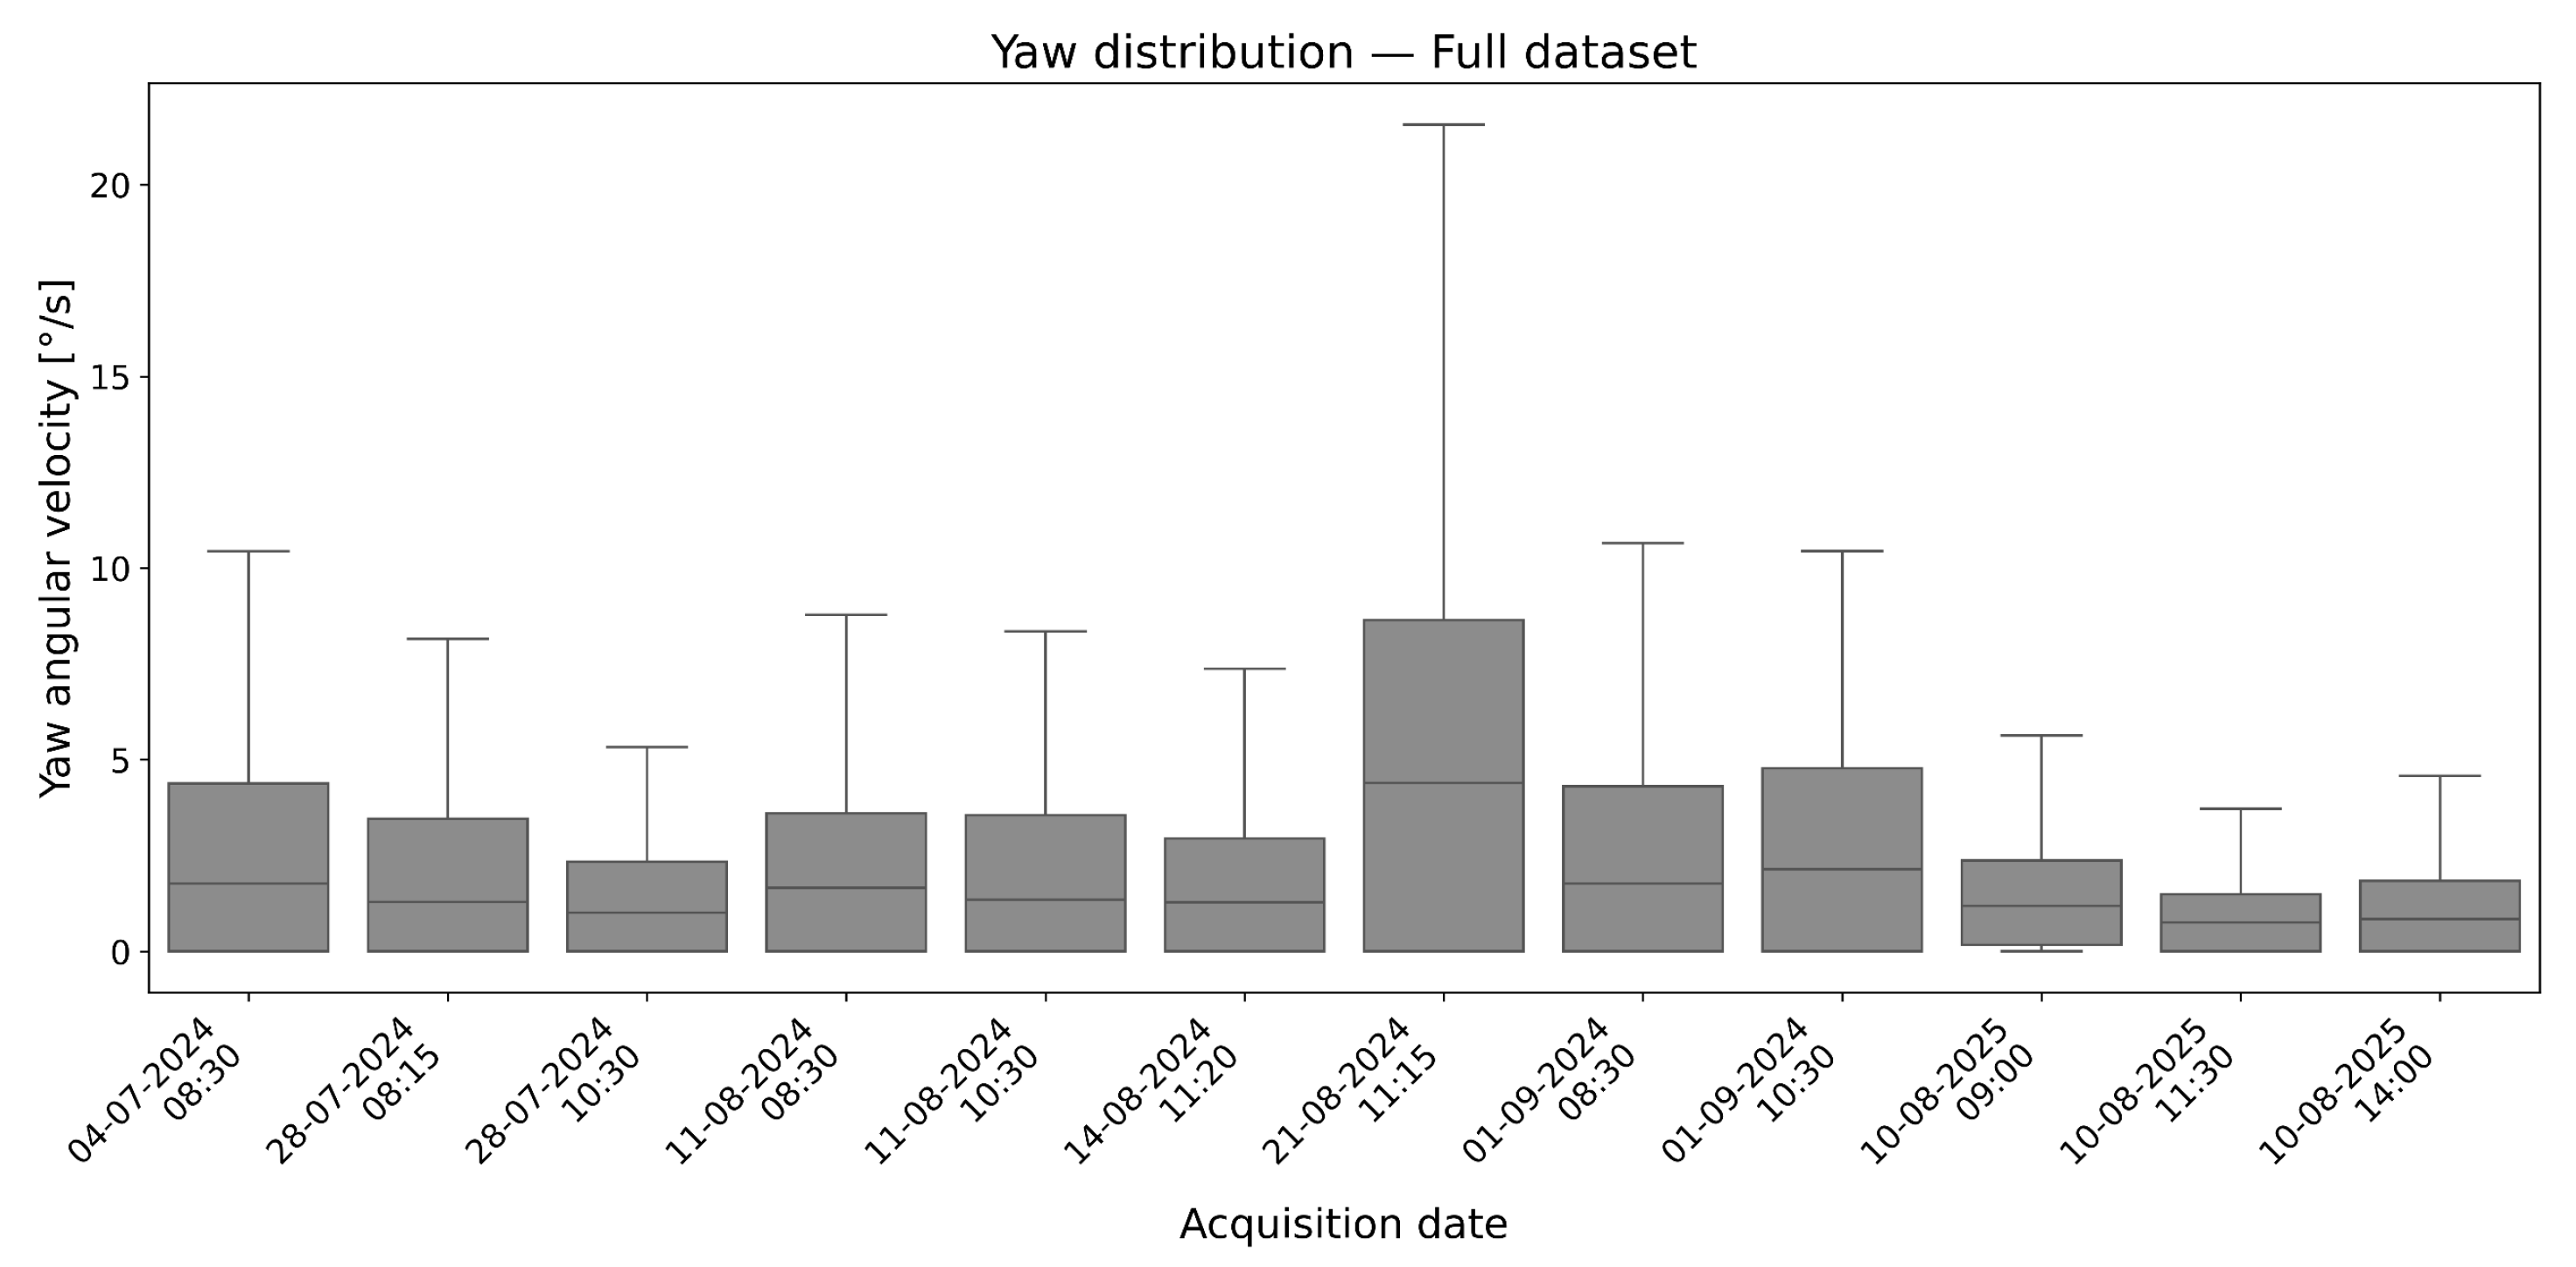
Wind conditions also played a relevant role in shaping flight geometry. As shown in the analysis of yaw angular velocity (Figure 8), both campaigns were affected by wind-induced rotational dynamics. However, the 2025 acquisitions exhibited a reduction in extreme yaw velocity values if compared with 2024, suggesting an improvement in rotational stability, although significant variability is still present. Nevertheless, the yaw angle still shows high variability, remaining one of the main limiting factors for the photogrammetric quality of these acquisitions.
Figure 8.
Boxplots display the distribution of yaw angular velocity [°/s] for each acquisition session, simulated from the mean and standard deviation.
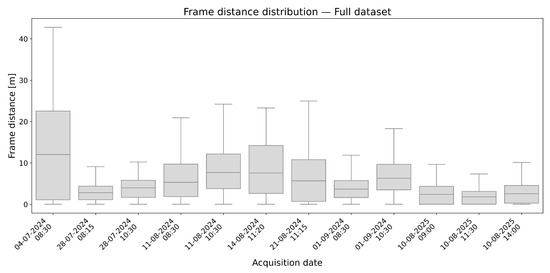
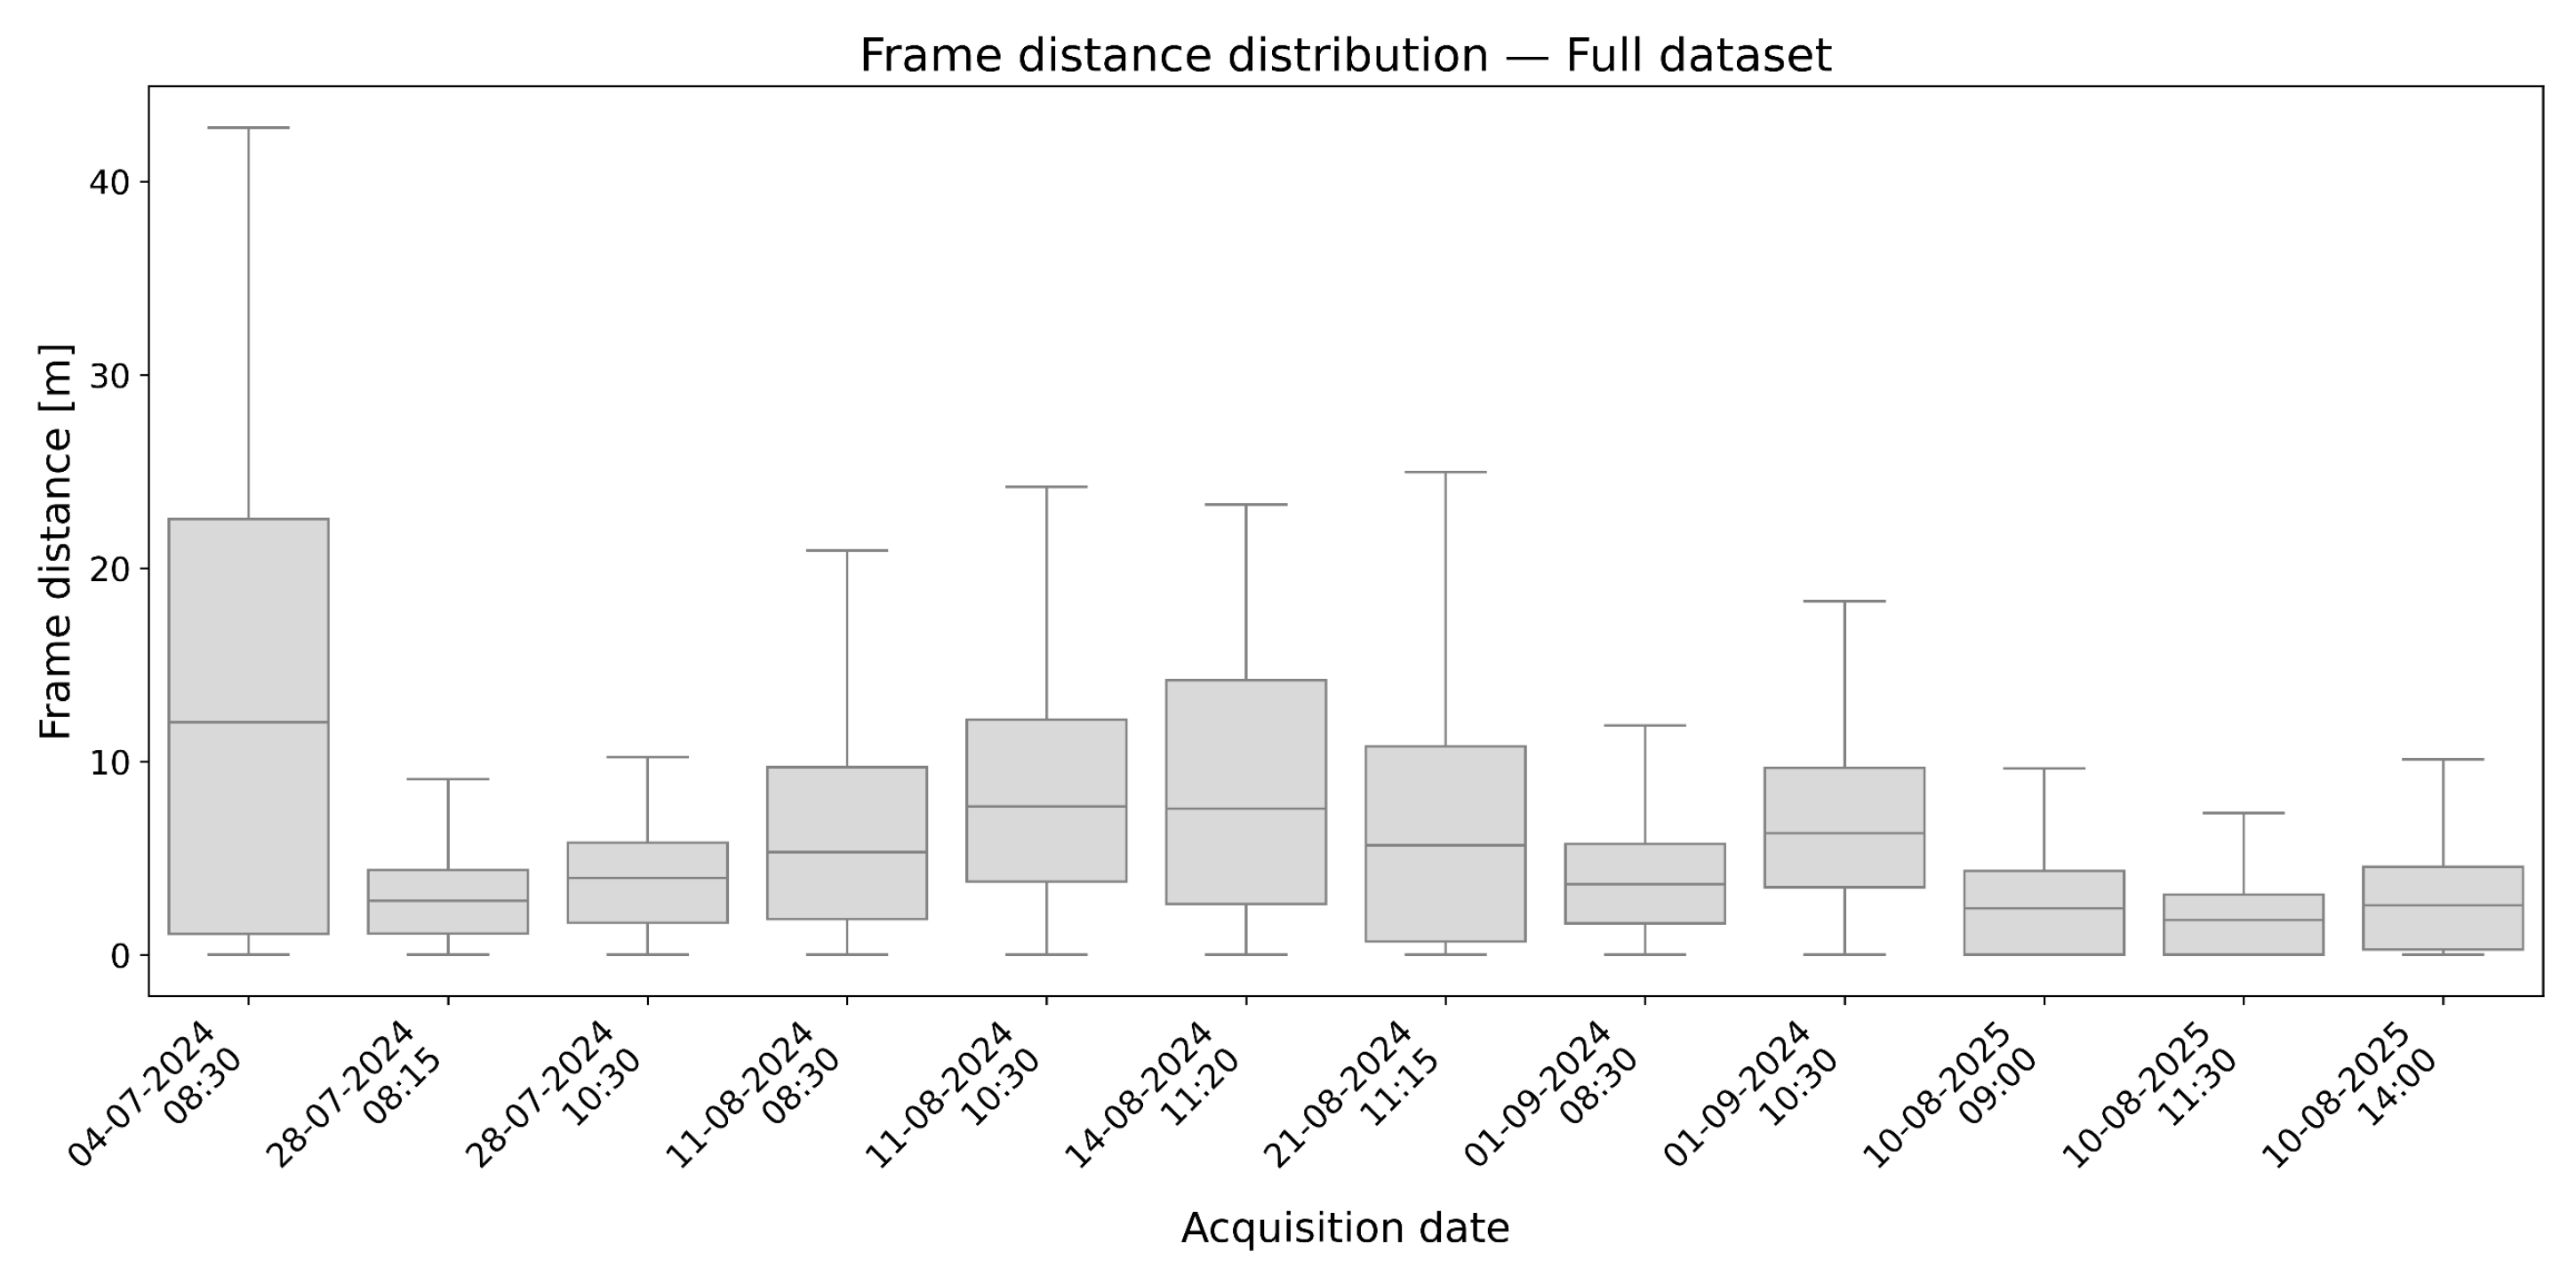
Similarly, analysis of trajectory regularity, based on frame distance, showed a variability consistent with the joint effect of wind and platform low controllability. As visible in Figure 9, the 2024 acquisitions showed a broad range of frame distances, reflecting irregular intervals between consecutive frames due to fluctuating flight direction trajectory. In contrast, the 2025 acquisitions demonstrated a more uniform frame spacing, resulting from improved platform stabilization and a higher data acquisition rate of one frame per second, although some residual variability remains.
Figure 9.
Boxplots illustrate the distribution of frame-to-frame distances, simulated from the mean and standard deviation for each session.
3.2. Analyzing Selected Subset in CH Acquisitions
The implementation of an automatic workflow to select suitable frames for photogrammetric processing is a crucial step to derive geometrically consistent and operationally reliable image blocks. The filtering strategy described in Section 2.4.2 was applied to all datasets from both the 2024 and 2025 campaigns, with the aim of selecting frame sequences that simultaneously and sufficiently satisfy scale uniformity, overlap, and limited angular variability.
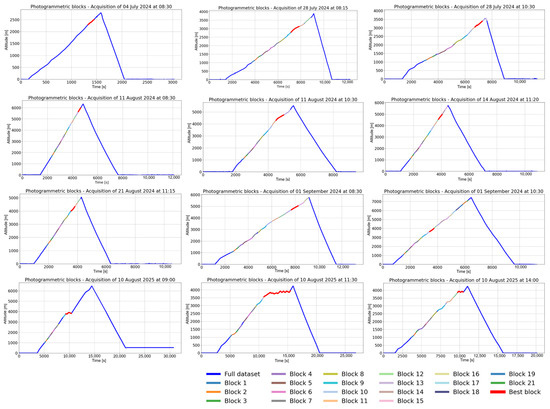
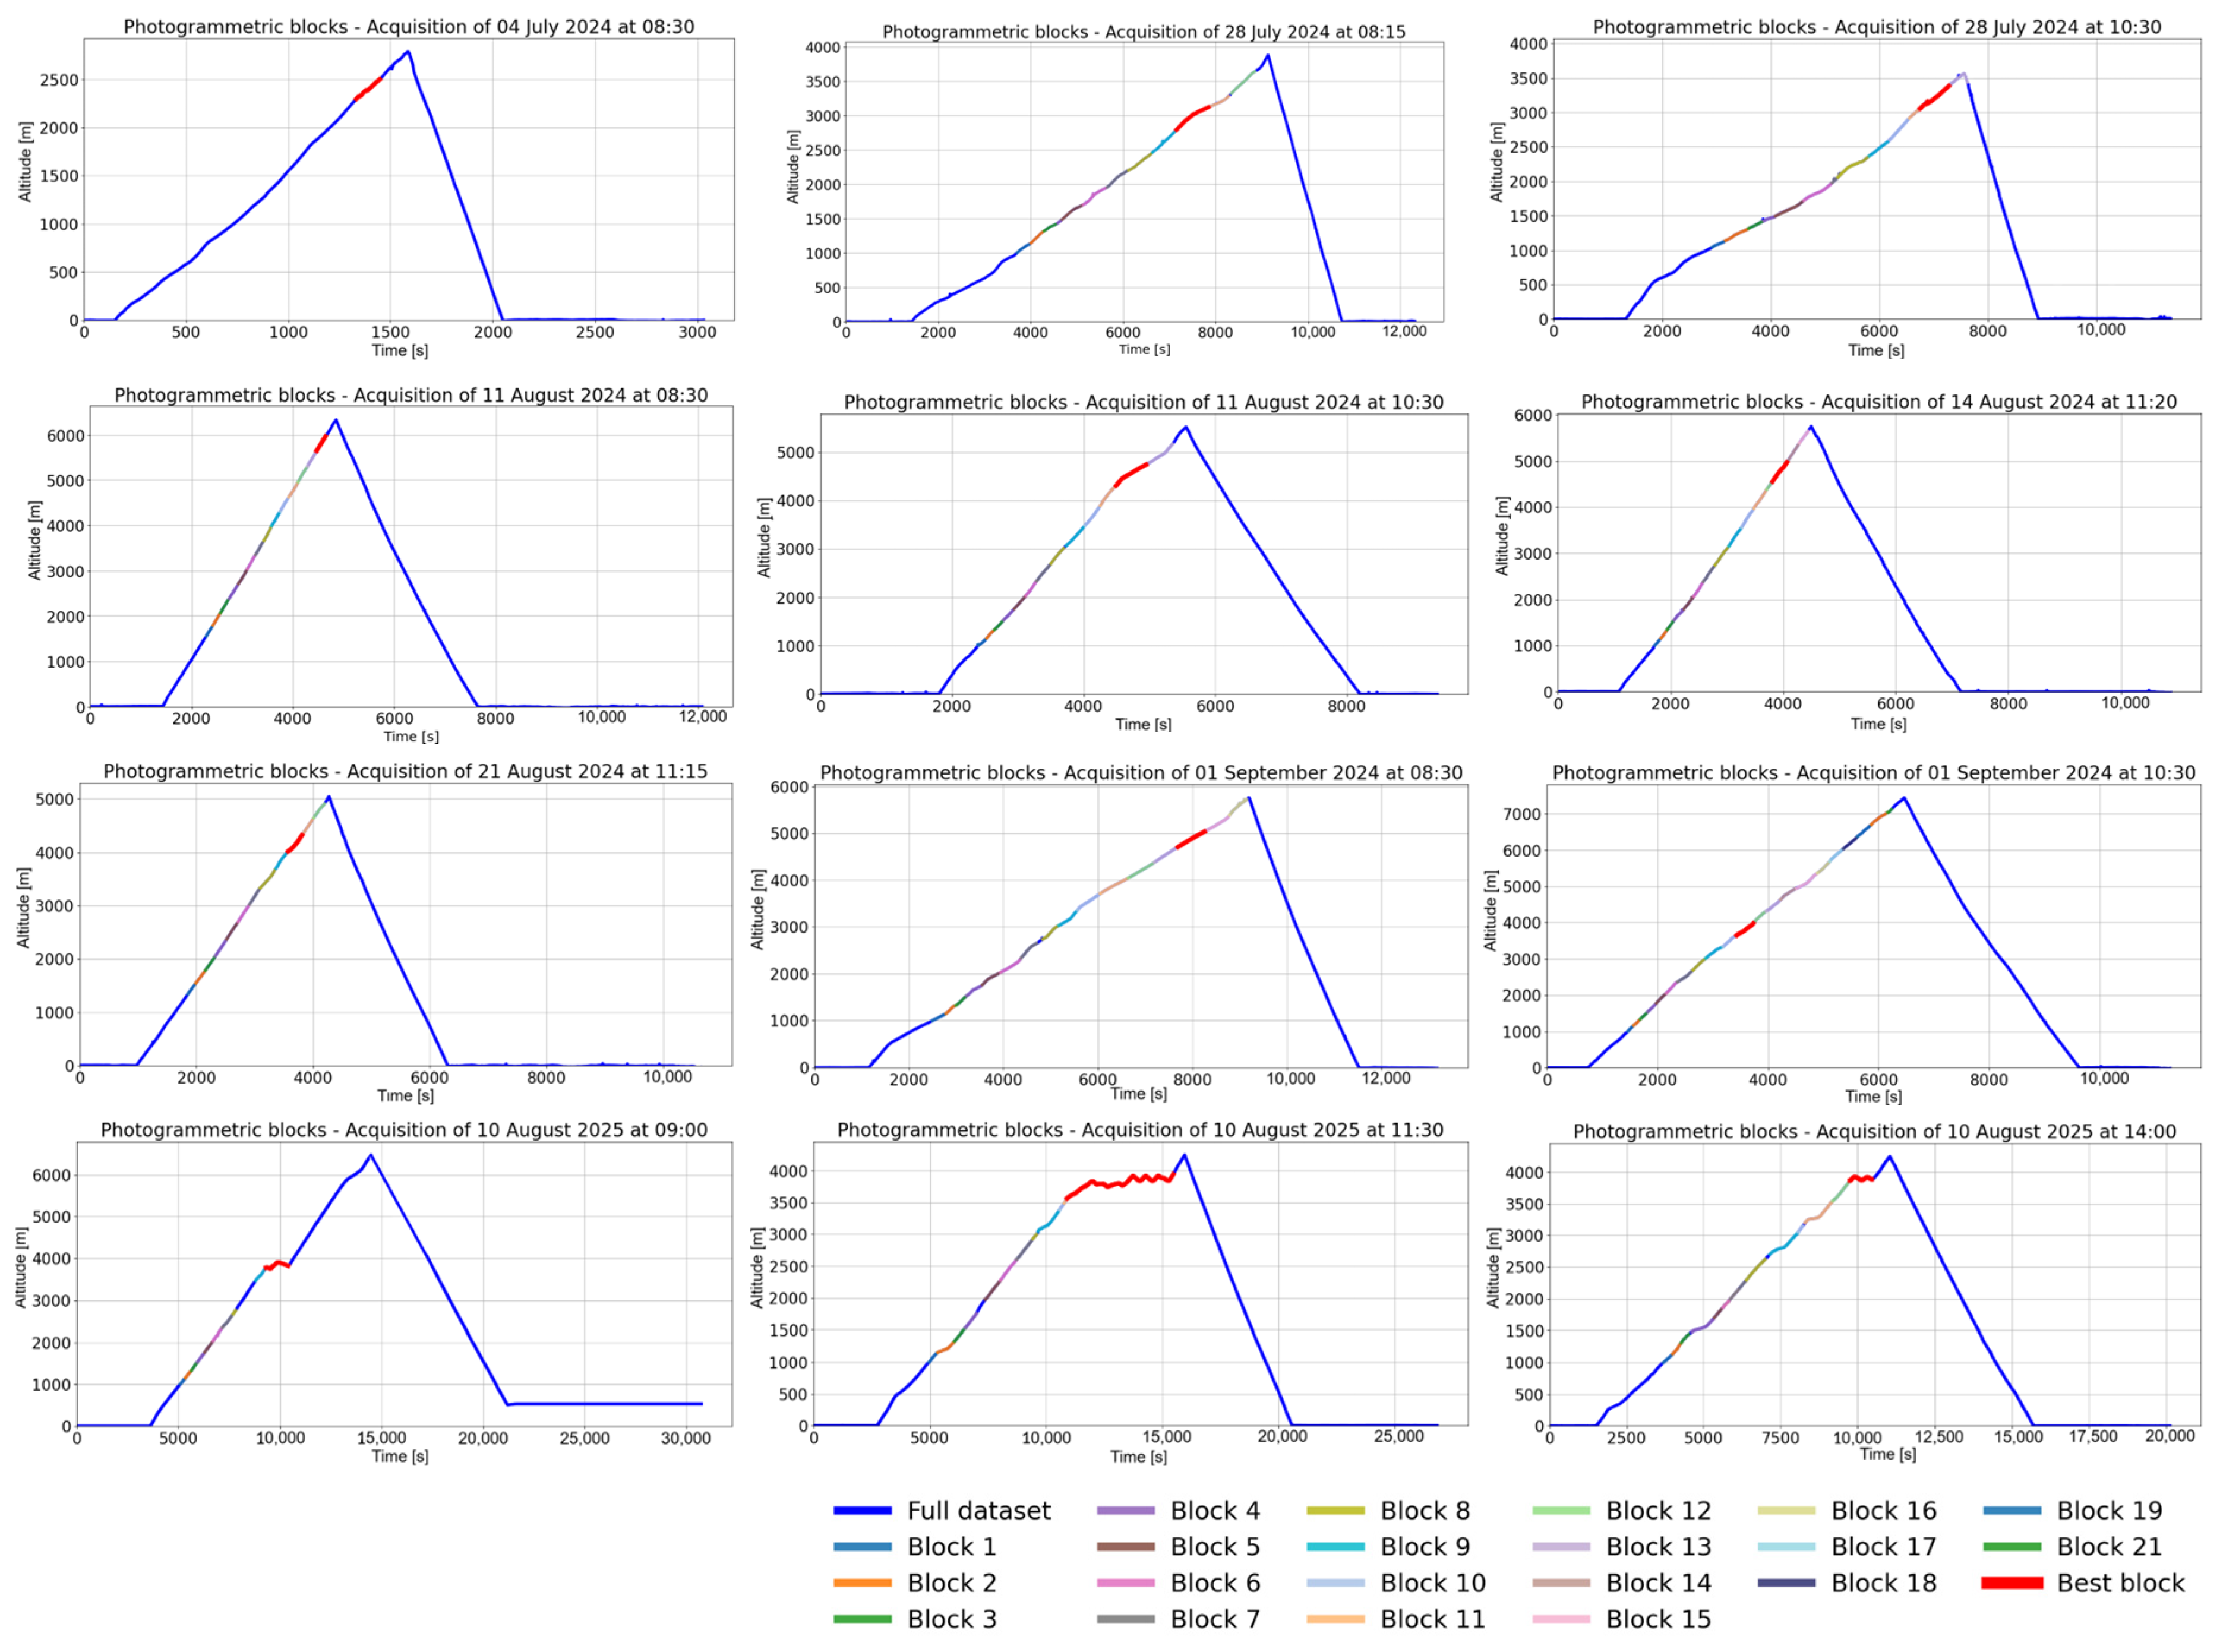
The identification of these coherent segments is illustrated in Figure 10, which shows the altitude profile of each acquisition together with the photogrammetric blocks automatically detected by the selection algorithm. Detailed statistics of selected frame subsets, including elevation ranges, GSD variability metrics, and frame spacing, are provided in Supplementary Tables S1 and S2. The full trajectory is represented by a continuous curve, while colored segments highlight all candidate blocks satisfying the geometric constraints imposed by the workflow. The detected blocks correspond to portions of the trajectory characterized by limited altitude variability and reduced short-term oscillations, typically occurring during plateau phases of the flight profile.
Figure 10.
The figure illustrates the altitude profile of each acquisition together with the photogrammetric blocks automatically identified by the selection algorithm. The blue curve represents the full dataset, while the colored segments highlight all candidate blocks that satisfy the geometric constraints defined in the workflow (GSD uniformity, overlap condition, and yaw stability). Among these, the best block, selected according to the scoring function combining altitude, number of frames, and GSD variability, is emphasized with a thicker red line.
Frames acquired along the flight profile that do not satisfy the geometric constraints defined by the workflow are excluded from the block, while the algorithm continues the analysis by evaluating the subsequent frame.
When altitude variations increase or the overlap and angular stability conditions are not satisfied, the algorithm terminates the current block and initiates a new candidate segment.
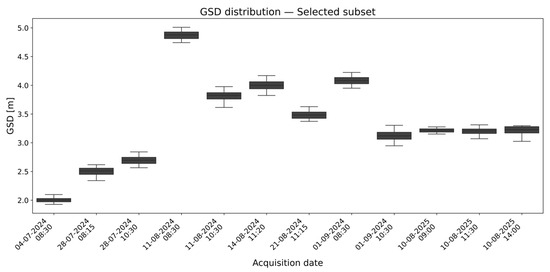
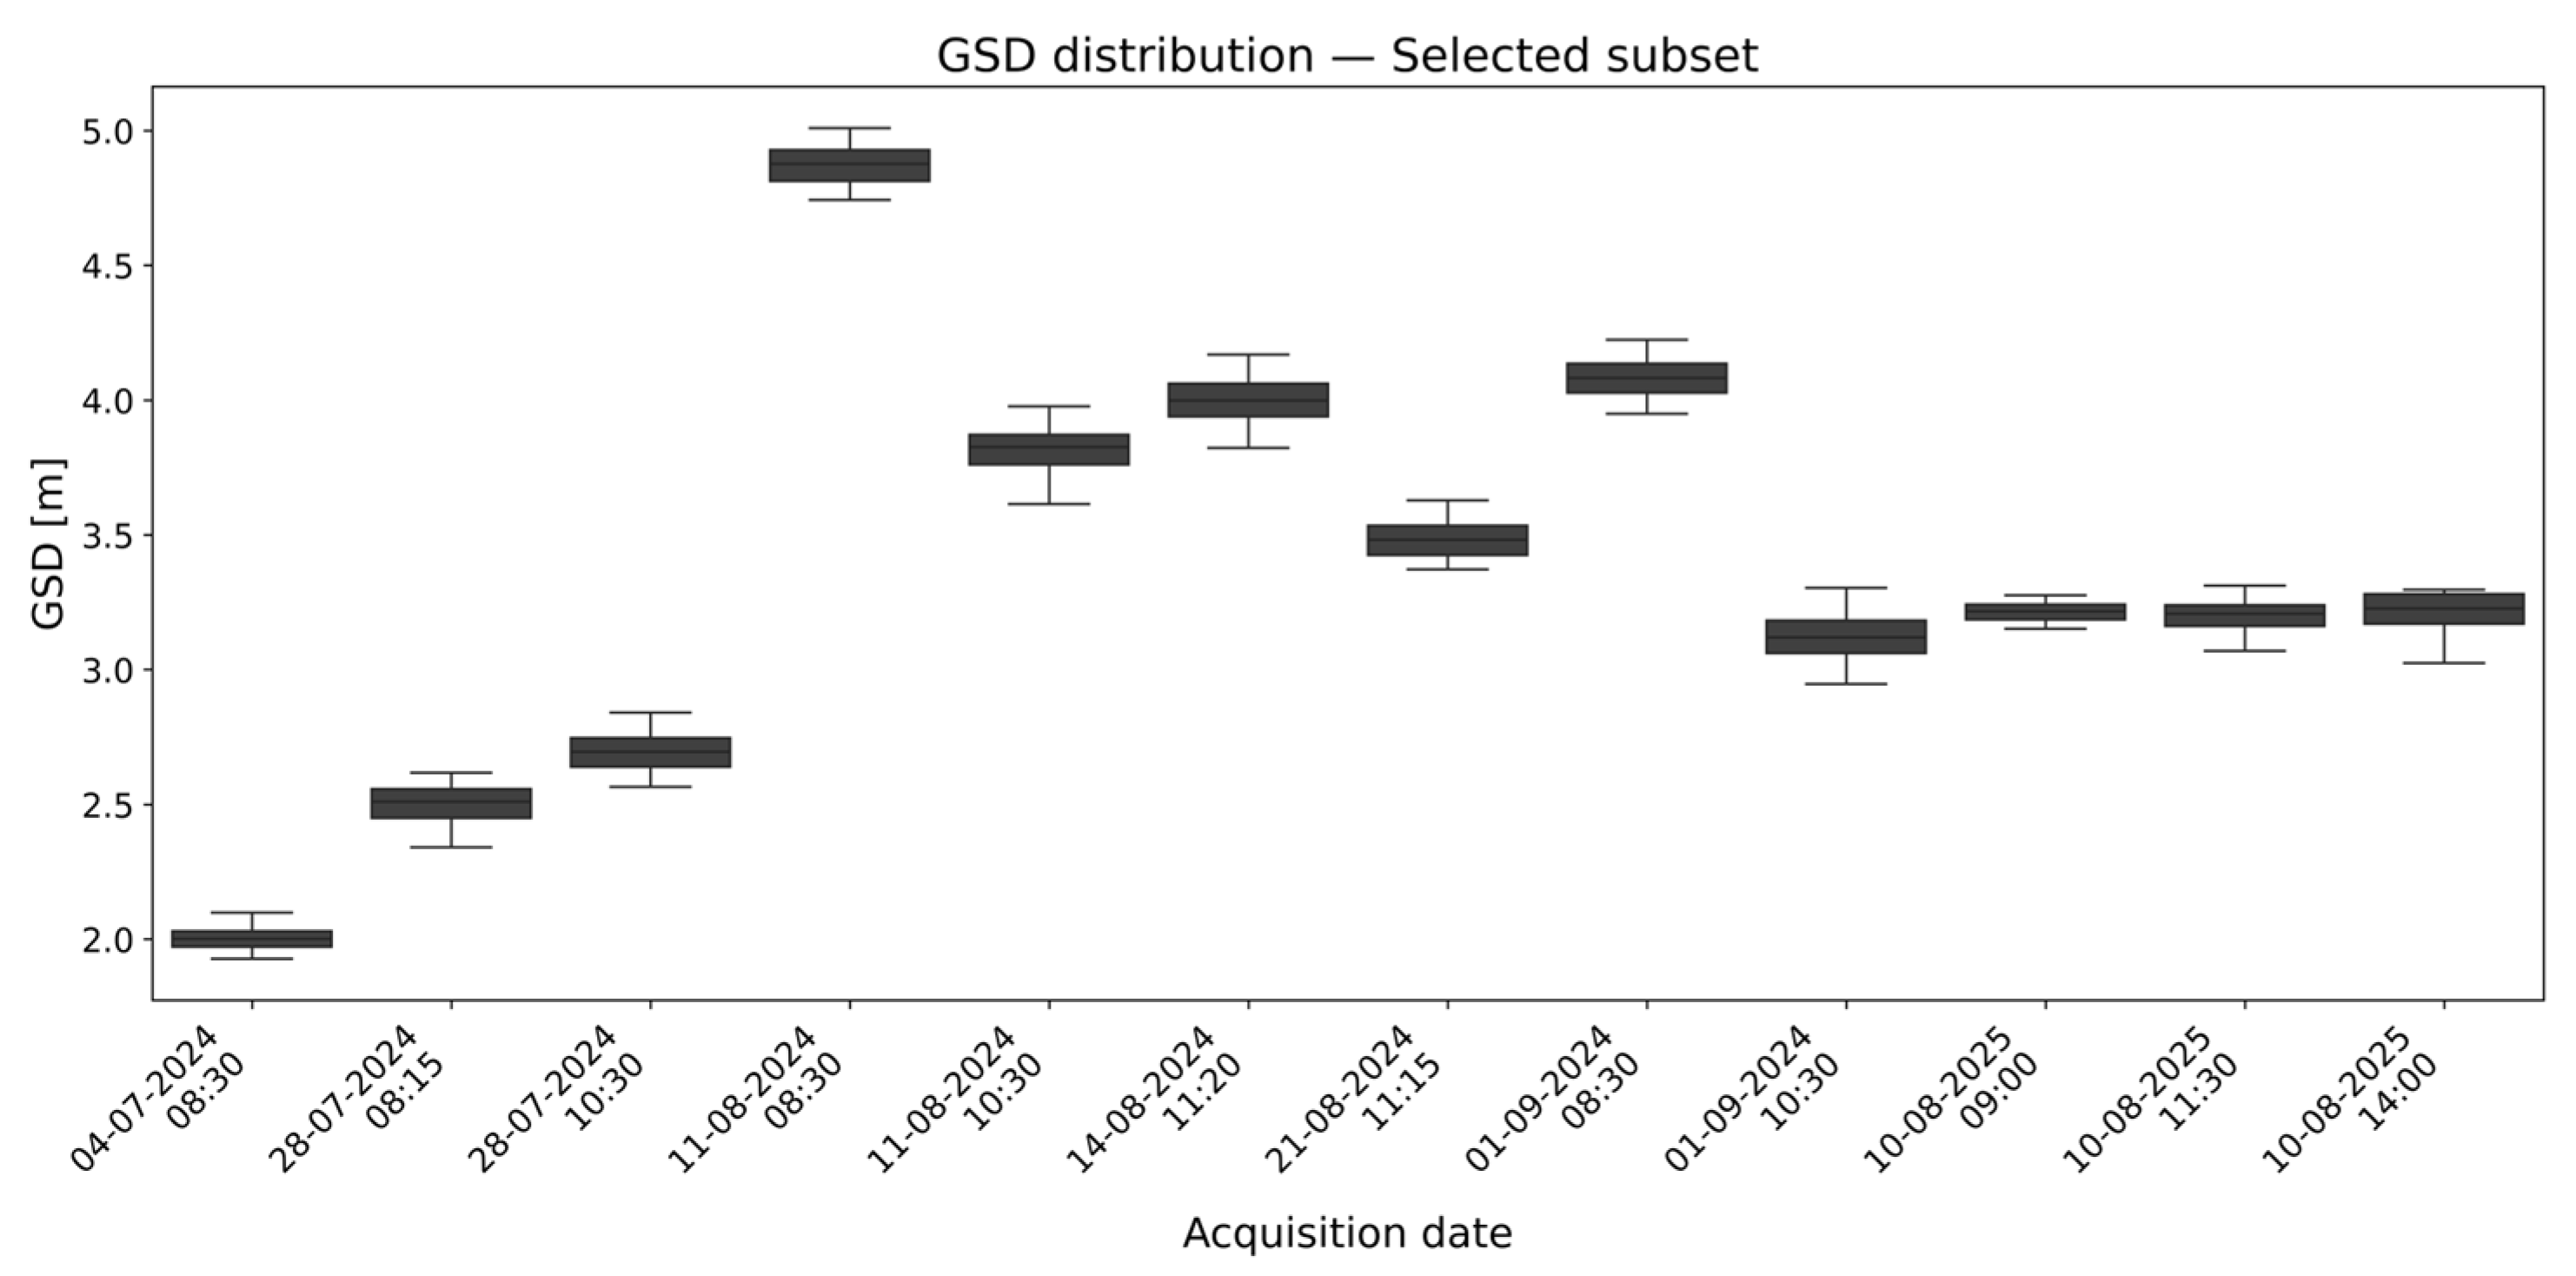
As shown in Figure 10, the acquisitions carried out during the 2024 campaign were characterized by altitude profiles with rapid climbs followed by descents, leading to the presence of multiple short candidate blocks separated by transitional phases. Consequently, as shown in Figure 11, the selected subsets were often located at different altitude levels, complicating the generation of mosaics at a constant flight height and reducing radiometric uniformity between different dates. This issue is particularly evident in the repeated acquisitions (28/07/2024, 11/08/2024, 01/09/2024), where the blocks that best satisfy the optimal photogrammetric conditions occur at varying altitudes, preventing the production of radiometrically homogeneous outputs.
Figure 11.
Boxplots show the distribution of GSD values for the selected best acquisition block, simulated from the mean and standard deviation.
By contrast, the 2025 campaign showed that suitable blocks of frames satisfying selection requirements occur at similar altitude values. This condition is highly desirable since it enables the generation of radiometrically uniform orthomosaics, a fundamental prerequisite for the reliable detection and analysis of thermal anomalies.
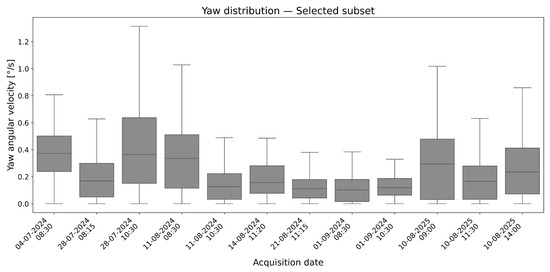
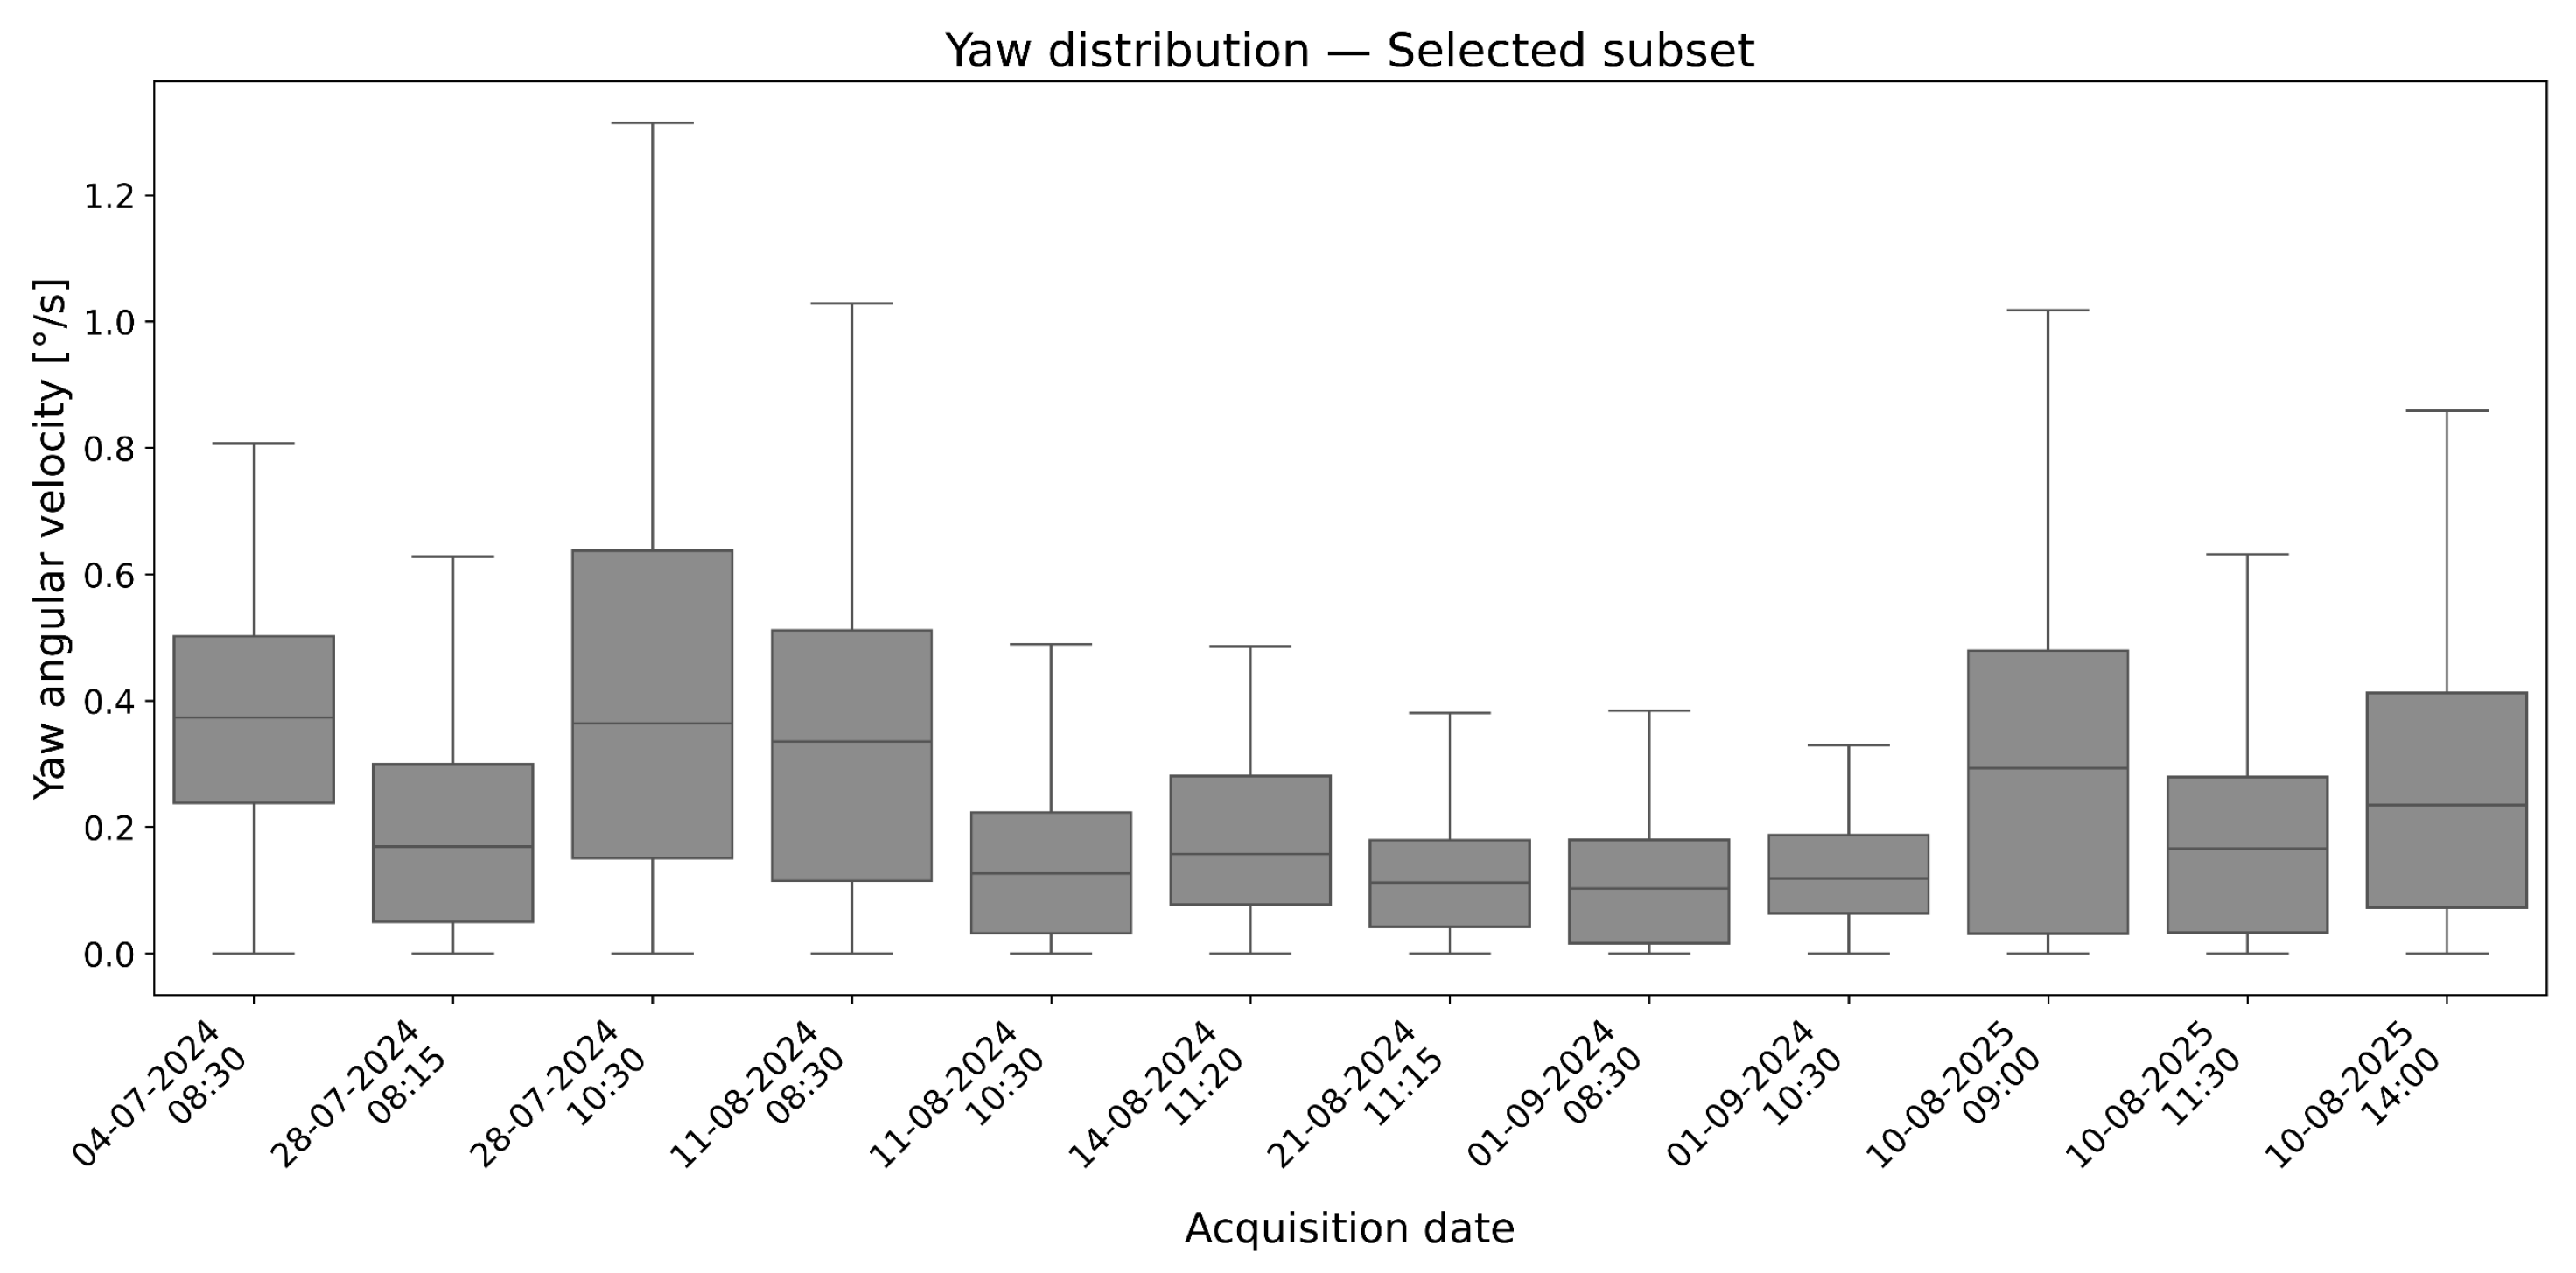
As shown in Figure 12, the yaw distributions revealed that angular velocity varied significantly between sessions, and even within the selected subset. Some frames exhibited a relatively high yaw variability, also in 2025 acquisitions, indicating, once more, that camera rotation remains a limiting factor for data quality.
Figure 12.
Boxplots showing the distribution of yaw angular velocity values in degrees per second for the selected best acquisition block, simulated from the mean and standard deviation.
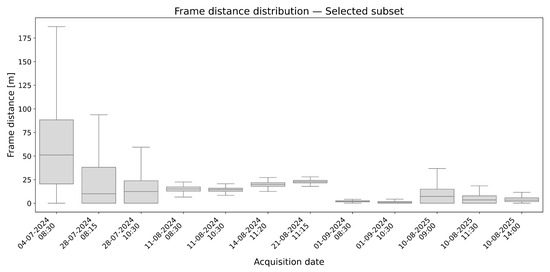
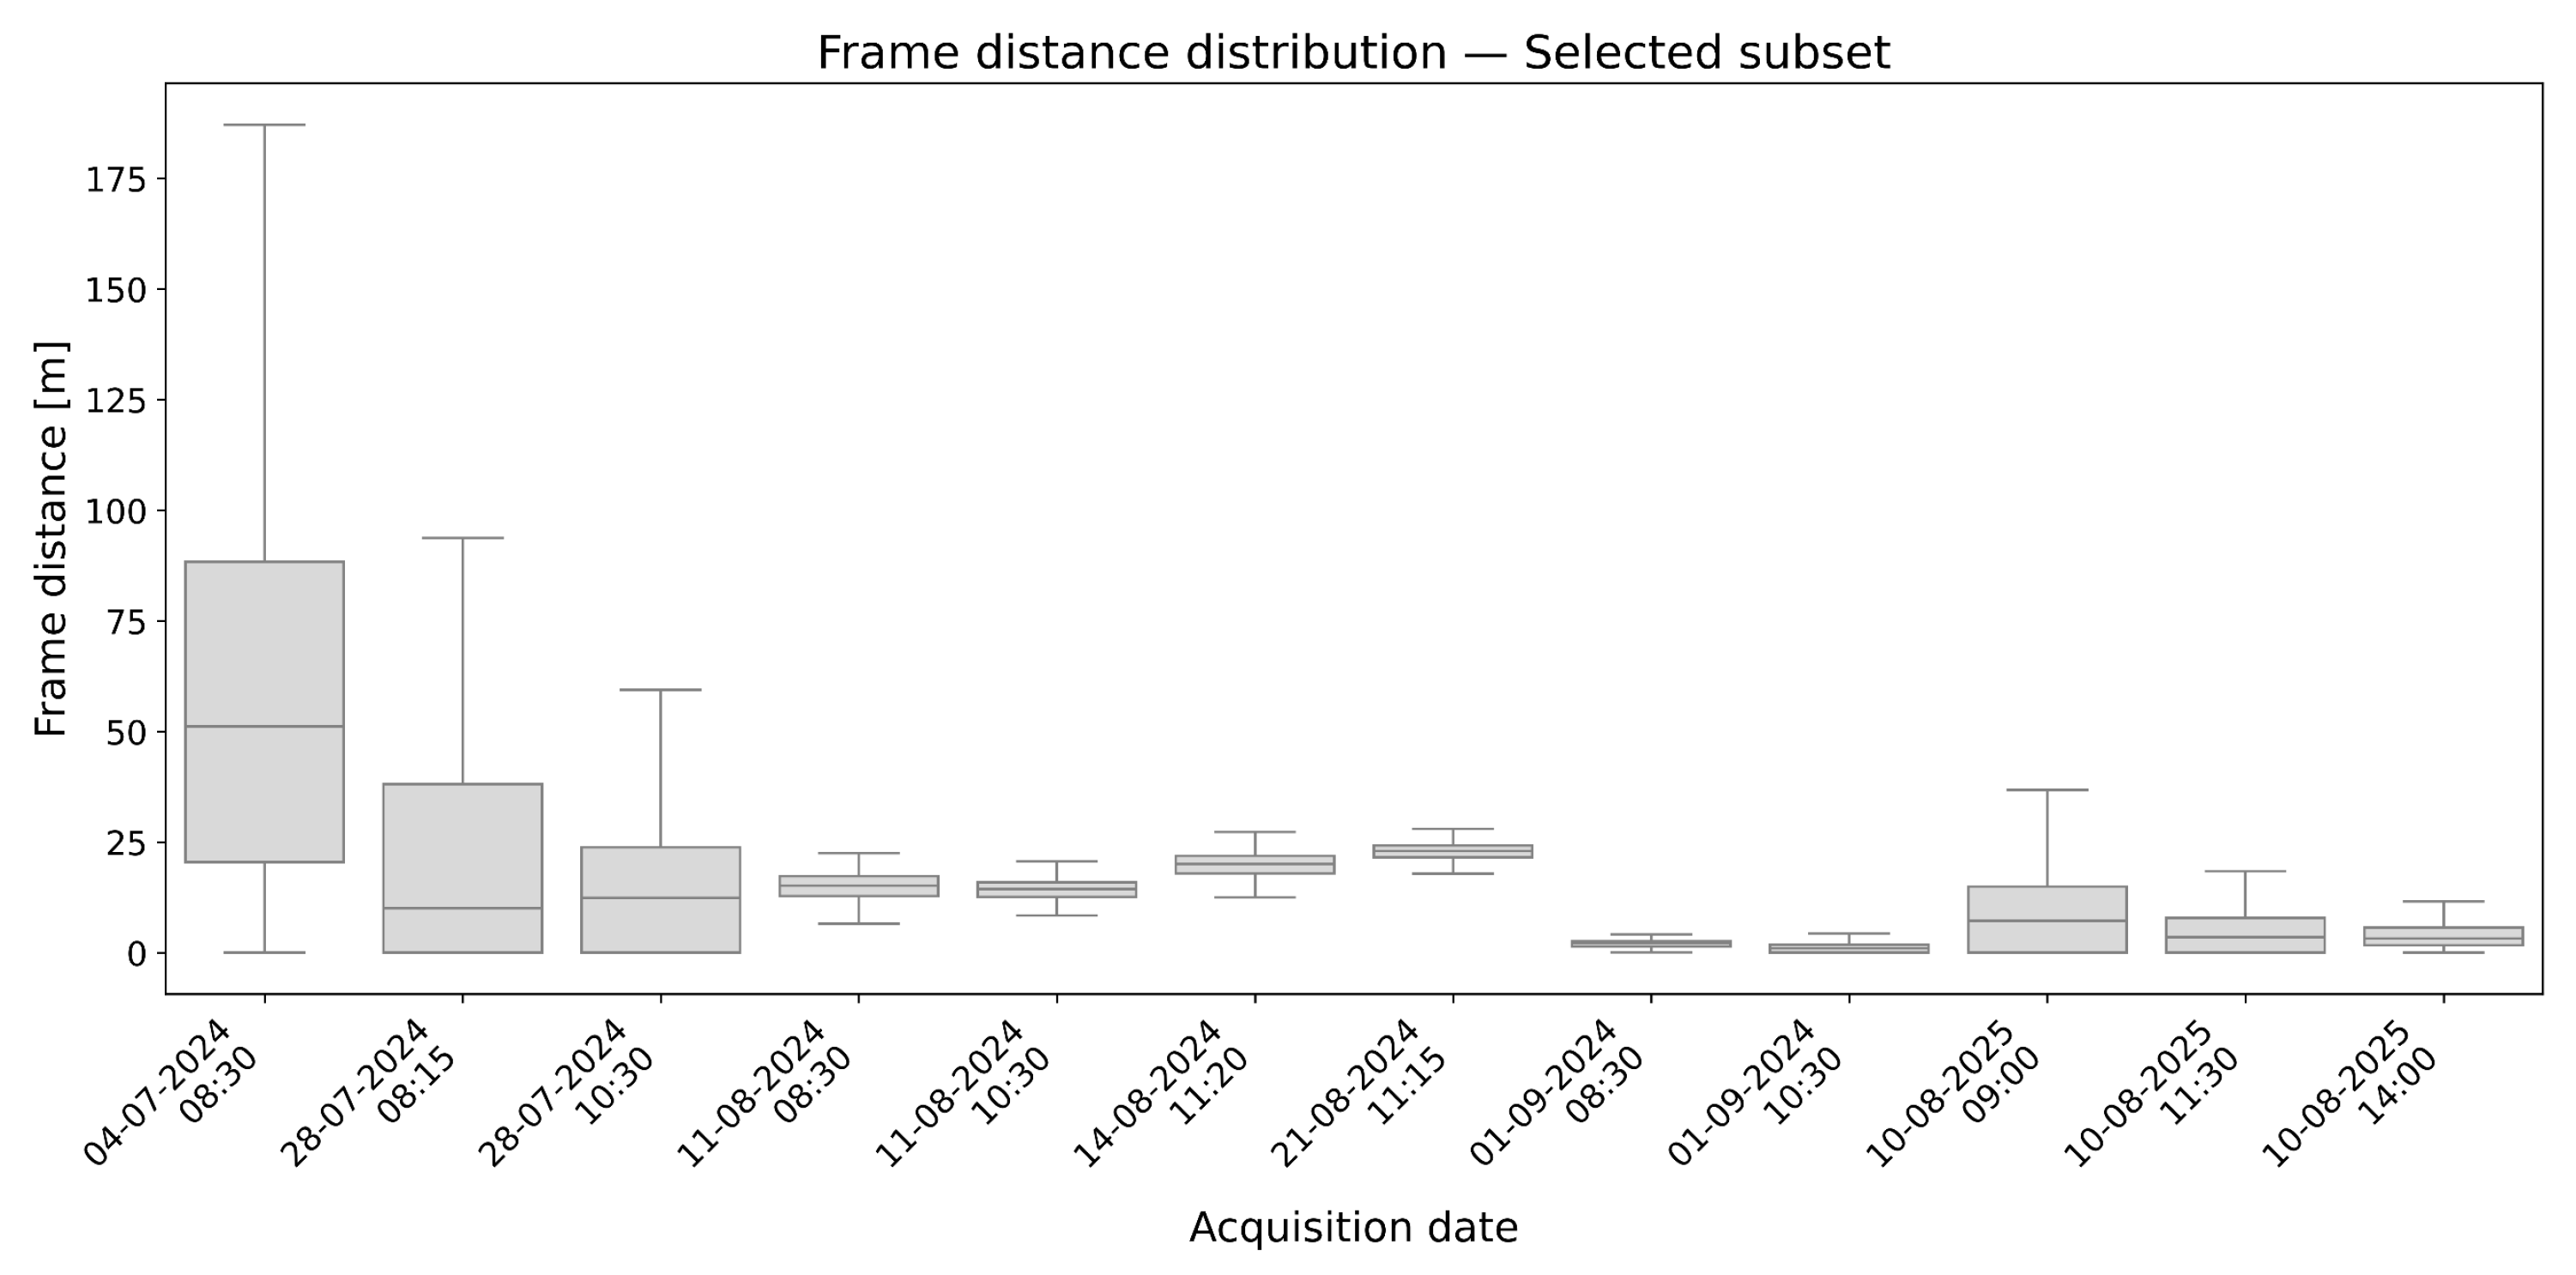
The frame-distance distributions, visible in Figure 13, reflect the effects of the selection criteria implemented in the proposed workflow. It shows that following the rejection of frames not satisfying the above-mentioned criteria, the appropriate remaining frames are clearly more distant. The maximum frame distance before frame filtering is about 40 m (see Figure 9), while after filtering the maximum frame distance is greater than 175 m. As a result, the selected subsets may exhibit increased spacing between frames, with higher mean distances compared to the original acquisition sequence, although they still comply with the predefined overlap requirements of the workflow.
Figure 13.
Boxplots showing the distribution of frame distances for the selected best acquisition block, simulated from the mean and standard deviation.
3.3. Performance of Block Bundle Adjustment
It should be noted that the present analysis is intentionally limited to internal photogrammetric metrics. In the photogrammetric pipeline, internal image orientation and bundle adjustment quality represent necessary prerequisites for any meaningful external accuracy assessment: a geometrically inconsistent block cannot be reliably corrected through ground control, and absolute accuracy figures derived from such blocks would not be representative of the system’s actual potential. External validation through thermally detectable ground control points and independent reference datasets will be addressed in future work, once the platform achieves the level of geometric stability required to make such assessment informative.
Some metrics summarizing the quality of the block bundle adjustment achieved with reference to the selected frames are reported in Table 3. Results highlight clear differences between the 2024 and 2025 campaigns in terms of tie point generation, dense point cloud density, and overall block adjustment quality.
Table 3.
Photogrammetric performance in terms of tie points, dense points and point density (point/m2).
The 2024 dataset showed a higher variability of image resection outputs. The number of tie points, in fact, ranges between 1322 and 6633, leading to dense clouds having a number of points varying between approximately 20,000 and 125,000. Worse-performing configurations (e.g., 01/09/2024 08:30) appear to be related to the lower number of both tie and dense points if compared with the ones from better performing acquisitions (e.g., 28/07/2024 10:30). Reprojection error values remain generally low despite exhibiting a wide dispersion (0.07–0.22 px), indicating variable block consistency across flights. Point density values (points/m2) further confirm this variability, ranging from a minimum of 0.003 (11/08/2024 08:30) to a maximum of 0.03 (04/07/2024 08:30 and 28/07/2024 10:30), reflecting the inconsistent quality of the reconstructed point clouds across the 2024 campaign.
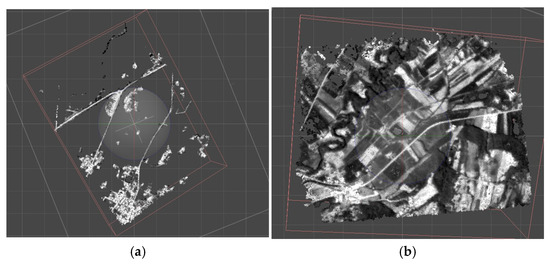
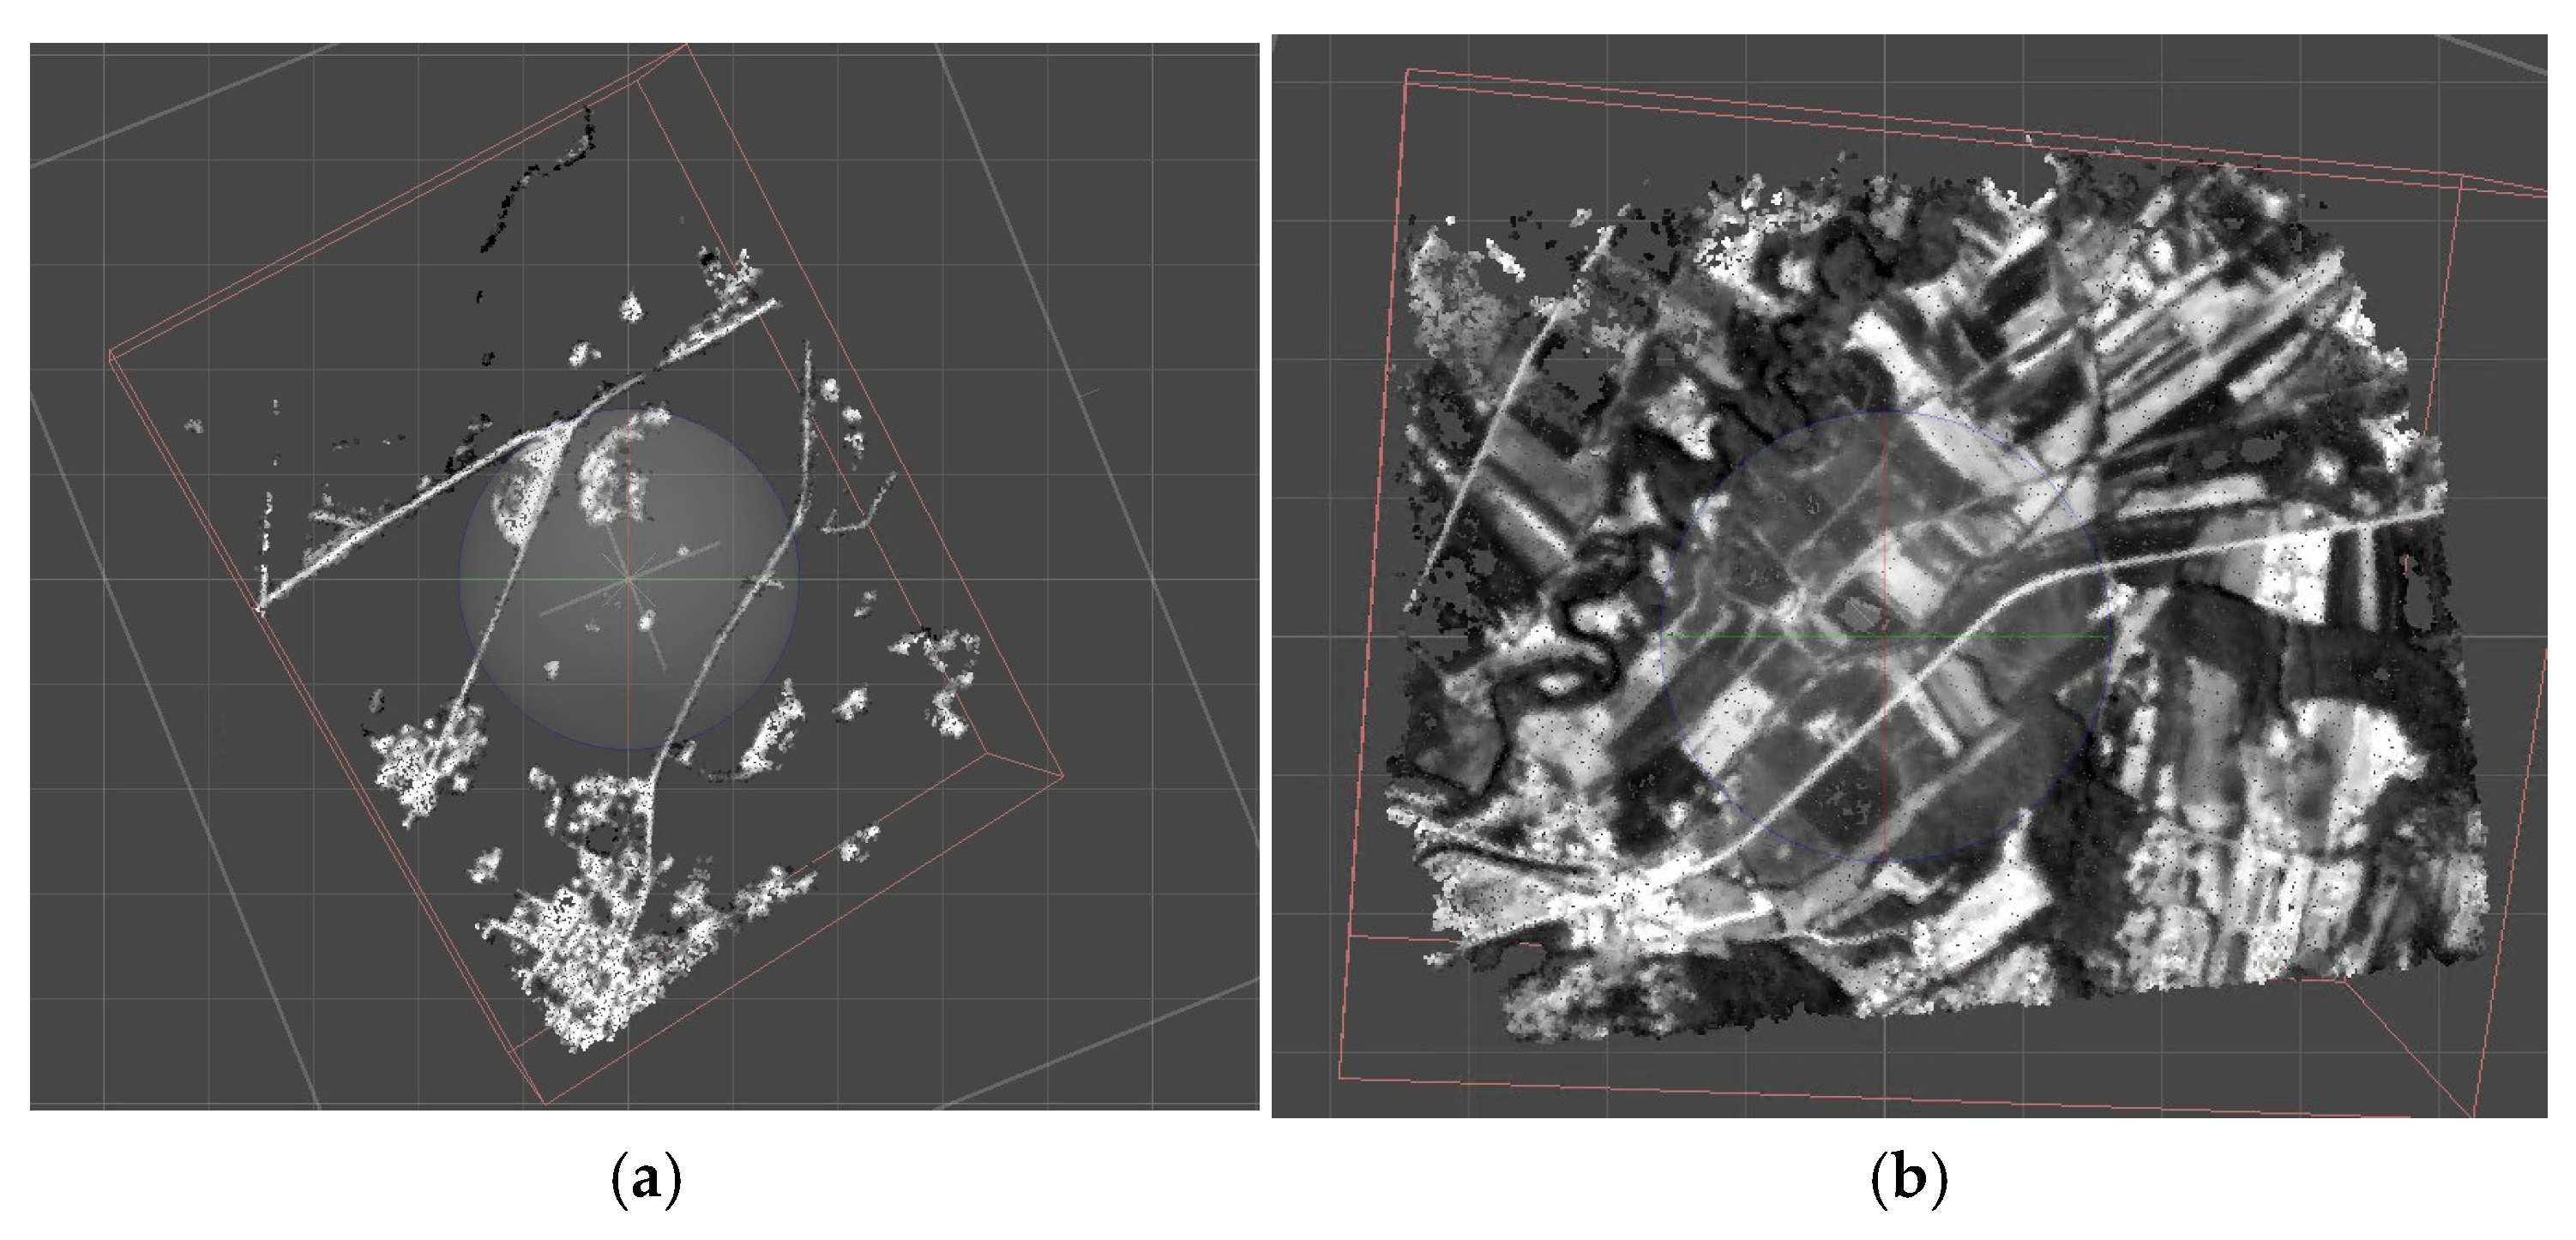
In contrast, the 2025 campaign exhibited a more stable and consistently high image resection performance. The number of tie points ranged between 4278 and 7568, with dense point clouds systematically exceeding 110,000 points and reaching up to 294,562 points, indicating a stronger and more complete 3D reconstruction capability of the selected frame blocks. Reprojection errors are more homogeneous across datasets, with RMSE values ranging between 0.07 and 0.09 pix for most acquisitions, suggesting improved internal consistency of the photogrammetric adjustment. Consistently, point density values for the 2025 campaign remain stable and comparatively higher, ranging between 0.03 and 0.04 points/m2, further confirming the improved and more homogeneous quality of the photogrammetric reconstruction achieved after the introduction of the stabilization system. Additionally, the selected frames are generally more numerous if compared with the 2024 acquisitions. Overall, results indicate a clear improvement in image resection for images from the 2025 campaign. Although the 2024 campaign includes cases of high-quality reconstruction, it is characterized by higher variability in both tie point extraction and dense point cloud generation. Conversely, the 2025 dataset achieves more consistent performance, with higher and more stable dense point outputs (visible in Figure 14) and a more uniform reprojection error distribution, indicating a better-conditioned photogrammetric block and improved feature matching stability.
Figure 14.
In (a), the point cloud generated from the acquisition on 01/09/2024 at 10:30, and in (b), the point cloud generated from the acquisition on 10/08/2025 at 14:00. A significant increase in the number of points in the cloud can be observed between the two acquisitions.
The temporal evolution of these photogrammetric metrics is visualized in Supplementary Figure S1, which provides a comprehensive comparison of reconstruction quality across all acquisition campaigns, clearly illustrating the systematic improvements achieved between 2024 and 2025. The 2025 improvements now position the platform for meaningful GCP-based validation in follow-up studies.
4. Conclusions
This study systematically analyzed the applicability of stratospheric HAPS platforms, and in particular the CubeHAPS® system, for EO data acquisitions in the context of precision agriculture, with a specific focus on the geometric and photogrammetric aspects of the acquired thermal imagery. The results demonstrate that these platforms represent a promising intermediate solution between UAVs and satellites, capable of combining wide spatial coverage and flexibility in data acquisition with relatively high spatial resolution over an area of interest. This capability is particularly relevant for precision agriculture at regional scale, where reliable and geometrically consistent thermal mosaics are required to accurately map spatial variability in crop water status and canopy temperature over large agricultural areas.
The 2024 campaigns highlighted the main operational limitations of the non-stabilized system, in particular the high variability in flight altitude, rapid wind-induced angular rotations, and trajectory irregularity. These factors led to strong heterogeneity in acquisition scale and reduced geometric continuity between frames, with a direct and negative impact on the ability of SfM processes to generate a sufficient number of tie points and to produce dense and reliable point clouds.
The introduction in 2025 of the improved stabilization system represented a decisive step in improving the overall system performance. The increased uniformity of flight altitude made it possible to obtain image blocks characterized by more consistent GSD, more regular overlap, and greater internal coherence. These improvements are clearly reflected in the quantitative indicators, with a significant increase in the number of tie points, point cloud density, and the point density, confirming the higher efficiency and reliability of the photogrammetric reconstruction. A critical remaining limitation of the system concerns the residual angular instability, and in particular yaw dynamics, which persist even under stabilized flight conditions.
A relevant contribution of this work is the definition of an operational workflow for the automatic selection of frames based on position and orientation metadata, which makes it possible to mitigate, at the processing level, the geometric limitations that are still present in CH-based acquisitions. This approach proved essential for extracting geometrically coherent subsets of images suitable for the generation of reliable orthomosaics, especially under the less controlled conditions of the 2024 campaigns.
Overall, the results indicate that, although still in an emerging technological phase, stabilized CubeHAPS platforms show promising internal geometric performance as a prerequisite for precision agriculture applications at regional scale and, more broadly, for EO. The combination of acquisition system improvements and dedicated processing strategies demonstrates measurable progress toward bridging the geometric gap with UAV platforms. Validation of absolute spatial accuracy through external reference data remains a necessary step before operational deployment can be claimed.
Supplementary Materials
The following supporting information can be downloaded at https://www.mdpi.com/article/10.3390/geomatics6040089/s1, Table S1: Summary statistics of Elevation and Ground Sampling Distance (GSD) statistics for selected image frames; Table S2: Summary statistics of trajectory regularity and angular stability metrics for selected frames; Figure S1: Temporal evolution of photogrammetric performance metrics.
Author Contributions
Conceptualization, L.B. and E.B.-M.; Formal analysis, L.B. and E.B.-M.; Methodology, L.B. and E.B.-M.; Writing—original draft, L.B., E.B.-M. and P.B.; investigation, V.M. and J.F.; data curation, V.M. and J.F.; supervision, E.B.-M. All authors have read and agreed to the published version of the manuscript.
Funding
This research was funded by Spoke 6 (“Primary Agroindustry”) of the National Innovation Ecosystem “NODES—Nord Ovest Digitale e Sostenibile” (Grant Agreement No. ECS00000036), funded by the European Union—NextGenerationEU under the Italian National Recovery and Resilience Plan (PNRR), Mission 4 “Education and Research,” Component 2 “From Research to Business,” Investment 1.5 “Innovation Ecosystems,” as part of the “STRATAG—Stratospheric Technologies for Agriculture” project.
Data Availability Statement
The original contributions presented in this study are included in the article/Supplementary Material. Further inquiries can be directed to the corresponding author.
Conflicts of Interest
Victor Miherea is the CEO of Stratobotic s.r.l., and Jannis Fath is affiliated with Stratobotic s.r.l., the company that developed the CubeHAPS system used in this study. Stratobotic s.r.l. provided the platform and support for data acquisition activities.
Abbreviations
The following abbreviations are used in this manuscript:
| CH | CubeHAPS® |
| UAV | Unmanned Aircraft Vehicle |
| HAPS | High-Altitude Pseudo Satellite |
| PA | Precision Agriculture |
| SP | Stratospheric Platform |
| GSD | Ground Sample Distance |
References
- Mulder, V.; de Bruin, S.; Schaepman, M.; Mayr, T. The use of remote sensing in soil and terrain mapping—A review. Geoderma 2011, 162, 1–19. [Google Scholar] [CrossRef] [Scilit]
- Ge, Y.; Thomasson, J.A.; Sui, R. Remote sensing of soil properties in precision agriculture: A review. Front. Earth Sci. 2011, 5, 229–238. [Google Scholar] [CrossRef] [Scilit]
- Ozdogan, M.; Yang, Y.; Allez, G.; Cervantes, C. Remote sensing of irrigated agriculture: Opportunities and challenges. Remote Sens. 2010, 2, 2274–2304. [Google Scholar] [CrossRef] [Scilit]
- Maes, W.H.; Steppe, K. Estimating evapotranspiration and drought stress with ground-based thermal remote sensing in agriculture: A review. J. Exp. Bot. 2012, 63, 4671–4712. [Google Scholar] [CrossRef] [Scilit] [PubMed]
- Abd El-Ghany, N.M.; Abd El-Aziz, S.E.; Marei, S.S. A review: Application of remote sensing as a promising strategy for insect pests and diseases management. Environ. Sci. Pollut. Res. 2020, 27, 33503–33515. [Google Scholar] [CrossRef] [Scilit] [PubMed]
- Weiss, M.; Jacob, F.; Duveiller, G. Remote sensing for agricultural applications: A meta-review. Remote Sens. Environ. 2020, 236, 111402. [Google Scholar] [CrossRef] [Scilit]
- Odenyo, V.; Pettry, D. Land-use mapping by machine processing of Landsat-1 data. PERS 1977, 43, 515–523. [Google Scholar]
- Leslie, C.R.; Serbina, L.O.; Miller, H.M. Landsat and Agriculture—Case Studies on the Uses and Benefits of Landsat Imagery in Agricultural Monitoring and Production; Open-File Report-1034; U.S. Geological Survey: Reston, VA, USA, 2017; p. 27. [Google Scholar]
- Joseph, G. Retrospective and Prospective of Remote Sensing in India. J. Indian Soc. Remote Sens. 1996, 24, 133–143. [Google Scholar] [CrossRef] [Scilit]
- Navalgund, R. Indian Earth Observation System: An Overview. Asian J. Geoinformatics 2006, 6, 17–25. [Google Scholar]
- Yang, C. High resolution satellite imaging sensors for precision agriculture. Front. Agric. Sci. Eng. 2018, 5, 393–405. [Google Scholar] [CrossRef] [Scilit]
- Irons, J.R.; Dwyer, J.L.; Barsi, J.A. The next Landsat satellite: The Landsat Data Continuity Mission. Remote Sens. Environ. 2012, 122, 11–21. [Google Scholar] [CrossRef] [Scilit]
- Drusch, M.; Del Bello, U.; Carlier, S.; Colin, O.; Fernandez, V.; Gascon, F.; Hoersch, B.; Isola, C.; Laberinti, P.; Martimort, P.; et al. Sentinel-2: ESA’s Optical High-Resolution Mission for GMES Operational Services. Remote Sens. Environ. 2012, 120, 25–36. [Google Scholar] [CrossRef] [Scilit]
- Donlon, C.; Berruti, B.; Buongiorno, A.; Ferreira, M.-H.; Féménias, P.; Frerick, J.; Goryl, P.; Klein, U.; Laur, H.; Mavrocordatos, C.; et al. The Global Monitoring for Environment and Security (GMES) Sentinel-3 mission. Remote Sens. Environ. 2012, 120, 37–57. [Google Scholar] [CrossRef] [Scilit]
- Zhang, C.; Kovacs, J.M. The application of small unmanned aerial systems for precision agriculture: A review. Precis. Agric. 2012, 13, 693–712. [Google Scholar] [CrossRef] [Scilit]
- Dos Santos, L.M.; Ferraz, G.A.e.S.; Barbosa, B.D.S.; Andrade, A.D. Use of remotely piloted aircraft in precision agriculture: A review. DYNA 2019, 86, 284–291. [Google Scholar] [CrossRef] [Scilit]
- Yang, C. Airborne remote sensing systems for precision agriculture applications. Smart Agric. 2020, 2, 1–22. [Google Scholar]
- Tsouros, D.C.; Bibi, S.; Sarigiannidis, P.G. A Review on UAV-Based Applications for Precision Agriculture. Inf.-Int. Interdiscip. J. 2019, 10, 349. [Google Scholar] [CrossRef] [Scilit]
- Singh, N.; Gupta, D.; Joshi, M.; Yadav, K.; Nayak, S.; Kumar, M.; Nayak, K.; Gulaiya, S.; Rajpoot, A.S. Application of Drones Technology in Agriculture: A Modern Approach. Sci. Res. Rep. 2024, 30, 142–152. [Google Scholar] [CrossRef] [Scilit]
- Phang, S.K.; Chiang, T.H.A.; Happonen, A.; Chang, M.M.L. From Satellite to UAV-Based Remote Sensing: A Review on Precision Agriculture. IEEE Access 2023, 11, 127057–127076. [Google Scholar] [CrossRef] [Scilit]
- Matese, A.; Toscano, P.; Di Gennaro, S.F.; Genesio, L.; Vaccari, F.P.; Primicerio, J.; Belli, C.; Zaldei, A.; Bianconi, R.; Gioli, B. Intercomparison of UAV, Aircraft and Satellite Remote Sensing Platforms for Precision Viticulture. Remote Sens. 2015, 7, 2971–2990. [Google Scholar] [CrossRef] [Scilit]
- Messina, G.; Modica, G. Applications of UAV thermal imagery in precision agriculture: State of the art and future research outlook. Remote Sens. 2020, 12, 1491. [Google Scholar] [CrossRef] [Scilit]
- Santesteban, L.G.; Di Gennaro, S.F.; Herrero-Langreo, A.; Miranda, C.; Royo, J.B.; Matese, A. High-resolution UAV-based thermal imaging to estimate the instantaneous and seasonal variability of plant water status within a vineyard. Agric. Water Manag. 2017, 183, 49–59. [Google Scholar] [CrossRef] [Scilit]
- Toscano, F.; Fiorentino, C.; Capece, N.; Erra, U.; Travascia, D.; Scopa, A.; Drosos, M.; D’aNtonio, P. Unmanned Aerial Vehicle for Precision: Agriculture: A Review. IEEE Access 2024, 12, 69188–69205. [Google Scholar] [CrossRef] [Scilit]
- Mohsan, S.A.H.; Othman, N.Q.H.; Li, Y.; Alsharif, M.H.; Khan, M.A. Unmanned aerial vehicles (UAVs): Practical aspects, applications, open challenges, security issues, and future trends. Intell. Serv. Robot. 2023, 16, 109–137. [Google Scholar] [CrossRef] [Scilit] [PubMed]
- Mondino, E.B.; Gajetti, M. Preliminary considerations about costs and potential market of remote sensing from UAV in the Italian viticulture context. Eur. J. Remote Sens. 2017, 50, 310–319. [Google Scholar] [CrossRef] [Scilit]
- Mashori, A.S.; Li, F.; Aman, M.; Zhang, W.; Jia, S.; Ali, A.; Jabeen, N.; Hao, W.; Yan, Y. Remote Sensing through UAVs for precision agriculture: Applications, technical foundations, current barriers, and future opportunities. Smart Agric. Technol. 2026, 14, 102074. [Google Scholar] [CrossRef] [Scilit]
- Boucetta, R. An Ecological Unmanned Hot-Air Balloon for the Agricultural Lands’ Inspection. In Computer Information Systems and Industrial Management; Saeed, K., Dvorský, J., Nishiuchi, N., Fukumoto, M., Eds.; CISIM 2023; Lecture Notes in Computer Science; Springer: Cham, Switzerland, 2023; Volume 14164, pp. 139–150. [Google Scholar]
- Gratzel, U.; Konigorski, D.; Obersteiner, M.; Schneidereit, M. Stratospheric Platforms for Monitoring Purposes. In Proceedings of the Symposium on International Safeguards: Preparing for Future Verification Challenges, Vienna, Austria, 1–5 November 2010. [Google Scholar]
- Bovio, L.; Lessio, A.; La Rocca, A.; Miherea, V.; Sartor, G.; Perotti, L.; Borgogno-Mondino, B.P. Testing the Potentialities of Stratospheric Platforms in Agriculture: Preliminary Results for Modeling Field Irrigation Flow. In Geomatics for Green and Digital Transition; ASITA 2024; Communications in Computer and Information Science; Springer: Cham, Switzerland, 2025; Volume 2464, pp. 161–178. [Google Scholar]
- Gonzalo, J.; López, D.; Domínguez, D.; García, A.; Escapa, A. On the capabilities and limitations of high altitude pseudo-satellites. Prog. Aerosp. Sci. 2018, 98, 37–56. [Google Scholar] [CrossRef] [Scilit]
- Baurreau, F.; Staraj, R.; Ferrero, F.; Lizzi, L.; Ribero, J.M.; Chessel, J.P. Stratospheric platform for telecommunication missions. In Proceedings of the IEEE International Symposium on Antennas and Propagation & USNC/URSI National Radio Science Meeting, Vancouver, BC, Canada, 19–24 July 2015; IEEE: New York, NY, USA, 2015. [Google Scholar]
- Mirinoa, M.; Nayarb, R.; Gustavo, G.; Naranjoc, F. Alternative Approaches for Remote Sensing: A Stratospheric Balloon Educational Experiment to Analyse Photosynthetic Activity of Plants. In Proceedings of the 67th International Astronautical Congress (IAC), Guadalajara, Messico, 26–30 September 2016. [Google Scholar]
- Dovis, F.; Presti, L.L.; Magli, E.; Mulassano, P.; Olmo, G. Stratospheric Platforms: A Novel Technological Support for Earth Observation and Remote Sensing Applications. In Proceedings of the International Symposium on Remote Sensing, Toulouse, France, 17–21 September 2001. [Google Scholar]
- Ilcev, D.S.; Sibiya, S.S. Weather observation via stratospheric platform stations. In Proceedings of the IST-Africa Conference, CLilongwe, Malaw, 6–8 May 2015. [Google Scholar]
- CUBEHAPS. ESA Business. Available online: https://business.esa.int/projects/cubehaps (accessed on 20 July 2026).
- Poghosyan, A.; Golkar, A. CubeSat evolution: Analyzing CubeSat capabilities for conducting science missions. Prog. Aerosp. Sci. 2017, 88, 59–83. [Google Scholar] [CrossRef] [Scilit]
- European Commission. Commission Implementing Regulation (EU) No 923/2012 of 26 September 2012. Available online: https://www.enac.gov.it/app/uploads/2024/04/Reg_923-2012.pdf? (accessed on 11 August 2026).
- Ruzgienė, B. Analysis of camera orientation variation in airborne photogrammetry: Images under tilt (roll-pitch-yaw) angles. J. Meas. Eng. 2014, 2, 95–102. [Google Scholar] [CrossRef] [Scilit]
- Yang, Y.; Lin, Z.; Liu, F. Stable imaging and accuracy issues of low-altitude unmanned aerial vehicle photogrammetry systems. Remote Sens. 2016, 8, 316. [Google Scholar] [CrossRef] [Scilit]
- Zisserman, R.H. Multiple View Geometry in Computer Vision, 2nd ed.; Cambridge University Press: Cambridge, UK, 2004. [Google Scholar]

Disclaimer/Publisher’s Note: The statements, opinions and data contained in all publications are solely those of the individual author(s) and contributor(s) and not of MDPI and/or the editor(s). MDPI and/or the editor(s) disclaim responsibility for any injury to people or property resulting from any ideas, methods, instructions or products referred to in the content. |
© 2026 by the authors. Licensee MDPI, Basel, Switzerland. This article is an open access article distributed under the terms and conditions of the Creative Commons Attribution (CC BY) license.