


Abstract
Global Navigation Satellite Systems (GNSS) have emerged as a reliable and cost-effective tool for estimating atmospheric precipitable water vapor (PWV), particularly in regions with limited meteorological instrumentation. In this study, the performance of three tropospheric mapping functions—the Global Mapping Function (GMF), Niell Mapping Function (NMF), and Vienna Mapping Function 1 (VMF1)—was evaluated for PWV estimation using GPS observations collected during the 2009–2011 period in southwestern Mexico, a region characterized by high atmospheric variability and frequent extreme weather events. GPS data from three stations (TECO, COL2, and PENA) were processed using the GAMIT/GLOBK 10.71 software, and the resulting PWV estimates were validated against independent radiosonde observations and the European Centre for Medium-Range Weather Forecasts (ECMWF) Fifth-Generation Reanalysis (ERA5) data. The results show that GPS-derived PWV successfully captures the seasonal variability of atmospheric water vapor, with maximum values during the summer rainy season. High correlations were obtained with both radiosonde and ERA5 data, particularly at the TECO station (R = 0.95–0.99), where RMSE values ranged from 3.27 to 5.46 mm and BIAS values from to mm. In contrast, larger discrepancies were observed at COL2 and PENA, mainly due to horizontal separation and altitude differences relative to the radiosonde site, highlighting the importance of spatial representativeness during validation. Among the evaluated mapping functions, no single model consistently outperformed the others across all stations, years, and reference datasets. Nevertheless, GMF and NMF generally exhibited more stable and consistent performance, whereas VMF1 showed greater variability under the adopted processing strategy. Additionally, a clear relationship was identified between PWV and precipitation records, indicating that increases in PWV coincided with periods of intense rainfall and suggesting its potential as an indicator of atmospheric conditions favorable for precipitation events. Overall, this study shows that GPS-derived PWV can reproduce the seasonal variability of atmospheric water vapor under the adopted processing strategy and demonstrates the importance of mapping function selection and spatial representativeness for accurate PWV estimation.
1. Introduction
Global Navigation Satellite Systems (GNSS) have undergone significant development beyond their traditional applications in positioning and navigation, particularly in meteorological applications for estimating precipitable water vapor (PWV). This development is supported by the studies of [1,2,3], who established the physical relationship between the zenith tropospheric delay (ZTD) and atmospheric water vapor content. These studies demonstrated that the ZTD can be decomposed into a hydrostatic component (ZHD) and a wet component (ZWD), with the latter being proportional to atmospheric water vapor. Subsequently, Rocken et al. [4] validated PWV estimates derived from GPS observations using radiometers, confirming their reliability for meteorological applications.
The retrieval of PWV from GPS observations (GPS-derived PWV) represents an important advancement in atmospheric sciences, as it enables the acquisition of continuous observations even in remote regions such as mountainous or polar areas [5]. GPS-derived PWV has been widely applied to atmospheric monitoring, weather forecasting, and the analysis of extreme meteorological events, including hurricanes, tropical storms, droughts, and severe convective systems [6,7,8,9].
In recent years, GPS has emerged as a continuous, reliable, and cost-effective tool for estimating PWV [8] and supporting atmospheric forecasting applications [3]. Recent studies have demonstrated that incorporating GPS-derived PWV into numerical weather prediction models improves precipitation forecasting accuracy [9]. Its implementation represents an important contribution to existing atmospheric monitoring techniques and has considerable potential for supporting early warning systems and the mitigation of extreme meteorological events.
Permanent GPS networks also provide a cost-effective alternative to conventional atmospheric monitoring systems, regardless of prevailing weather conditions [10,11]. This advantage is particularly relevant for developing countries, where atmospheric monitoring infrastructure is often limited, as is the case in many regions of Latin America [12]. The application of GPS-derived PWV is especially valuable in tropical regions characterized by frequent extreme meteorological events, where the availability of radiosonde and meteorological stations is often insufficient for continuous atmospheric monitoring. Numerous studies have demonstrated the applicability of GPS-derived PWV under different atmospheric and climatic conditions [10,11].
Tropospheric mapping functions play a fundamental role in GNSS-derived PWV retrieval because they relate the slant tropospheric delay observed along the satellite-receiver path to the corresponding zenith delay. Empirical mapping functions, such as the Niell Mapping Function (NMF) and the Global Mapping Function (GMF), provide global applicability without requiring numerical weather model data, whereas discrete mapping functions, such as the Vienna Mapping Function 1 (VMF1), exploit numerical weather model information to improve the representation of atmospheric delays. More recently, Landskron and Böhm [13] introduced the VMF3 and GPT3 models, demonstrating refinements in both discrete and empirical mapping functions. Furthermore, recent investigations have shown that tropospheric delay modeling remains an active research topic, particularly regarding the representation of atmospheric anisotropy and the limitations of conventional mapping functions under complex atmospheric conditions [14]. These studies highlight the importance of evaluating mapping functions under different climatic and topographic environments.
Although GPS-derived PWV has been extensively investigated in Asia, Europe, and North America, relatively few studies have been conducted in Mexico. Early investigations performed during the North American Monsoon Experiment (NAME) demonstrated that GPS-derived PWV successfully characterized the temporal evolution of atmospheric moisture over northwestern Mexico and documented rapid increases in atmospheric water vapor preceding convective precipitation events [15]. Subsequently, the North American Monsoon GPS Transect Experiment expanded the regional GNSS meteorological network, providing a more comprehensive characterization of atmospheric moisture variability across northwestern Mexico and supporting long-term hydrometeorological observations [16,17]. More recently, GNSS-derived PWV observations from this regional network have been assimilated into high-resolution Weather Research and Forecasting (WRF) simulations, demonstrating improvements in short-term precipitation forecasts through a better representation of atmospheric moisture fields [18]. Despite these important contributions, published studies comparing different tropospheric mapping functions (GMF, NMF, and VMF1) using independent radiosonde observations and ERA5 reanalysis remain very limited in Mexico, particularly under tropical atmospheric conditions. Southwestern Mexico provides a unique environment for such analyses because of its strong influence from Pacific moisture transport, frequent tropical cyclone activity, and pronounced topographic variability. Consequently, evaluating GPS-derived PWV products in this region contributes to reducing an important geographical gap in the current literature.
The study period (2009–2011) was selected because continuous observations from the three selected GPS stations (TECO, COL2, and PENA), radiosonde measurements from Manzanillo, precipitation records from nearby meteorological stations, and ERA5 reanalysis data were simultaneously available with sufficient temporal continuity to ensure a consistent multi-dataset comparison. The selected three-year period also encompasses complete dry and rainy seasons, including periods influenced by Pacific tropical cyclone activity, thereby providing representative atmospheric conditions for evaluating the performance of the investigated tropospheric mapping functions. The objective was not to investigate a climatologically exceptional period but rather to evaluate the relative performance of the mapping functions under representative tropical atmospheric conditions.
This study has four main objectives: (i) to evaluate and compare the performance of the Global Mapping Function (GMF), Niell Mapping Function (NMF), and Vienna Mapping Function 1 (VMF1) for estimating GPS-derived PWV in southwestern Mexico; (ii) to validate the resulting PWV estimates using independent radiosonde observations and the European Centre for Medium-Range Weather Forecasts (ECMWF) fifth-generation atmospheric reanalysis (ERA5), assessing the influence of spatial representativeness and altitude differences on PWV accuracy; (iii) to evaluate the performance of the mapping functions under atmospheric conditions associated with extreme meteorological events; and (iv) to investigate the relationship between GPS-derived PWV and precipitation records in order to assess the potential of PWV as an indicator of atmospheric conditions favorable for precipitation. This study contributes to understanding how spatial representativeness, altitude differences, and the selected tropospheric mapping function influence GPS-derived PWV retrieval in tropical regions characterized by complex topography and strong atmospheric variability.
The remainder of this paper is organized as follows. Section 2 describes the study area, GPS observations, processing strategy, and reference datasets used for validation. Section 3 presents the results of the comparison among the evaluated tropospheric mapping functions and their validation against radiosonde observations and ERA5 data. Section 4 discusses the implications of the findings and the influence of spatial representativeness, altitude differences, and processing strategy on PWV estimation. Finally, Section 5 summarizes the main conclusions and recommendations for future work.
2. Materials and Methods
2.1. Study Area
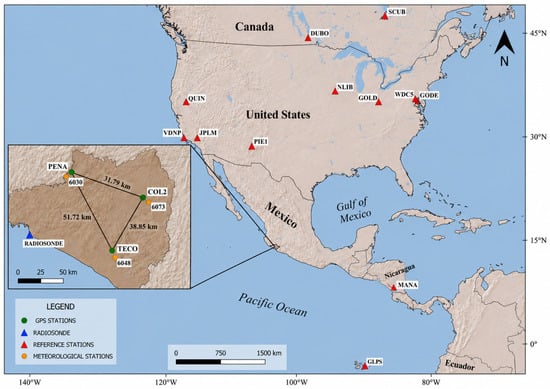
Mexico exhibits high climatic variability due to its complex topography and geographical location, which favors the occurrence of diverse temperature and humidity regimes throughout the country. In particular, the southwestern region is characterized by a warm subhumid climate, strongly influenced by its proximity to the Pacific Ocean and the dynamics of regional atmospheric circulation. The study area (Figure 1) is located in southwestern Mexico and exhibits marked precipitation seasonality, with substantial increases in temperature and atmospheric moisture during the rainy season. This variability is closely associated with tropical cyclone activity over the eastern Pacific Ocean, particularly between May and October, when the Mexican Pacific hurricane season contributes to a considerable increase in atmospheric PWV [19].
Figure 1.
Location of the study area in the state of Colima, Mexico.
The interaction between moisture transport from the Pacific Ocean and the regional orography promotes the advection of large amounts of atmospheric water vapor toward the continent [20], increasing the frequency and intensity of precipitation events in southwestern Mexico. Both urban and rural areas in the states of Colima and Jalisco are particularly vulnerable to these meteorological conditions.
These characteristics make southwestern Mexico an ideal natural laboratory for investigating atmospheric water vapor dynamics and their relationship with precipitation, particularly under conditions of high climatic variability and frequent extreme meteorological events.
2.2. GPS Observations
Data from three continuously operating GPS stations (TECO, PENA, and COL2) were used for the 2009–2011 period, as shown in Table 1. This period was intentionally selected because continuous GPS observations from the three stations, radiosonde measurements from Manzanillo, precipitation records from nearby meteorological stations, and ERA5 reanalysis data were simultaneously available with sufficient temporal continuity to ensure a consistent multi-dataset comparison. Rather than investigating recent atmospheric conditions or long-term climatic trends, the objective of this study is to evaluate the relative performance of different tropospheric mapping functions under a common observational framework. The selected three-year period encompasses complete dry and rainy seasons, thereby providing representative atmospheric conditions over a wide range of moisture regimes for evaluating the investigated tropospheric mapping functions. Because the evaluated mapping functions are based on physical and empirical formulations that are not specific to a particular epoch, their relative performance can be reliably assessed using historical datasets, provided that all observations are complete, consistent, and processed using the same methodology.
Table 1.
Continuously operating GPS stations used in the experiment. The reported number of observation days corresponds to the available GPS data included in the analysis. Differences among stations and years are due to the availability of valid RINEX files and the quality-control procedure applied prior to processing.
The selected stations belong to geodetic networks managed by CORS (Continuous Operating Reference System; https://geodesy.noaa.gov/CORS/ accessed on 20 Juanuary 2025) and EarthScope (https://www.earthscope.org/ accessed on 20 Juanuary 2025), and are located in a region characterized by high atmospheric variability and frequent extreme meteorological events. All datasets were homogenized to a daily temporal resolution over the 2009–2011 period to ensure consistency throughout the comparative analysis.
As summarized in Table 1 and Table 2, the number of available observation days varies among stations and years because only valid RINEX files that passed the quality-control procedure were included in the processing.
Table 2.
GNSS receiver and antenna installed at each GPS station during the study period (2009–2011).
Due to the limited availability of radiosonde stations in southwestern Mexico, the Manzanillo radiosonde station (76654) was selected as the independent atmospheric reference for GPS-derived PWV validation. The three GPS stations (TECO, COL2, and PENA) were selected because of their relative proximity to the radiosonde station while representing different topographic settings within the study area, thereby enabling an independent assessment of GPS-derived PWV estimates. Furthermore, the study area is strongly influenced by Pacific moisture transport and seasonal atmospheric variability, making it particularly suitable for investigating atmospheric water vapor variability and evaluating the performance of different tropospheric mapping functions under highly dynamic tropical conditions. Although the spatial separation between the radiosonde and GPS stations may introduce discrepancies in the comparison, this configuration represents the best available framework for independent PWV validation within the study region. Therefore, the results obtained in this study should be considered representative of the analyzed stations and of regions with similar climatic and topographic characteristics, rather than universally applicable to the entirety of southwestern Mexico.
The GPS stations operate with sampling intervals of either 15 s or 30 s. To ensure consistency during processing, all observations were homogenized to a 30 s sampling interval using the RINGO software version 0.9.6 [21]. A preliminary quality-control procedure was then applied to all RINEX files to verify the correct identification of antenna and receiver types, as well as the consistency of the associated metadata, before GPS processing.
2.3. GPS Processing and Precipitable Water Vapor Estimation (GPS-Derived PWV)
GPS observations were processed using the GAMIT/GLOBK 10.71 software package through the GAMIT module [22]. The objective of this study was to evaluate the influence of different tropospheric mapping functions on GPS-derived precipitable water vapor (PWV). Therefore, all analyses were performed consistently using GPS observations throughout the study, thereby allowing a direct comparison of the evaluated mapping functions under a common processing strategy. The processing parameters adopted in this study are summarized in Table 3.
Table 3.
GPS processing parameters used in this study.
A static relative baseline processing strategy was adopted using the final orbit products and Earth orientation parameters provided by the International GNSS Service (IGS) [23]. The first-order ionospheric delay was eliminated through the ionosphere-free linear combination of the dual-frequency (/) GPS observations. In addition, global ionospheric maps (IONEX) were incorporated to account for higher-order ionospheric effects within the adopted processing strategy.
An elevation mask of 15° was adopted as a compromise between reducing multipath effects associated with low-elevation observations and maintaining sufficient satellite geometry for robust parameter estimation [24]. Tropospheric delays were modeled using the Saastamoinen model [25], with meteorological parameters derived from the empirical Global Pressure and Temperature (GPT) model [26]. In the absence of in situ meteorological observations, the GAMIT/GLOBK metutil utility was used to generate the required meteorological parameters. A default relative humidity of 50%, implemented within the GAMIT/GLOBK processing framework, was adopted for the computation of the ZHD. The same meteorological model was consistently applied to all processing solutions to ensure that differences in the resulting PWV estimates were attributable solely to the evaluated tropospheric mapping functions. The resulting GPS-derived PWV estimates were independently validated using radiosonde observations and ERA5 reanalysis data.
The ZTD was estimated every 2 h as a time-dependent parameter, while GPS observations were processed using a 30 s sampling interval. This configuration captures tropospheric variability while avoiding excessive noise in the parameter estimation.
The GPS-derived PWV estimates obtained from the 2 h ZTD solutions were subsequently averaged to daily values prior to the validation analysis. Similarly, ERA5 hourly data were averaged to daily values, and the available radiosonde observations were represented at the same temporal resolution. This temporal homogenization ensured a consistent comparison among the three independent datasets and allowed the analysis to focus on seasonal and interannual PWV variability rather than on sub-daily atmospheric fluctuations.
To model geophysical effects, the FES2004 ocean tide loading model [27] was applied to correct the vertical and horizontal displacements induced by ocean tides [28]. In addition, IGS reference stations (DUBO, GLPS, GODE, GOLD, JPLM, SCUB, VNDP, WDC5, MANA, MD01, NLIB, PIE1, and QUIN) were incorporated to constrain the solutions to the ITRF08 reference frame. The ITRF08 realization was adopted to maintain consistency with the processing strategy and the IGS products corresponding to the 2009–2011 observation period. These stations were selected through the AUSPOS service [29] following standard high-precision GNSS processing practices. Several of the selected IGS stations are located more than 500 km from the study area, providing sufficient network extent to strengthen the network geometry and reduce correlations between station coordinates and tropospheric parameters. Consequently, the ZTD was estimated within a regional-to-global network framework rather than from an isolated local network, thereby improving the robustness of the GPS-derived PWV retrieval.
The baseline lengths between the analyzed GPS stations range from approximately 33 to 52 km (Table 4). Although the local network geometry is relatively compact, the GPS processing was not performed as an isolated local network. Instead, the selected stations were integrated into a broader regional-to-global network through the incorporation of IGS reference stations. This strategy improves the network geometry and reduces correlations between coordinate and tropospheric parameters during parameter estimation.
Table 4.
Baseline lengths between the GPS stations used in this study.
The tropospheric mapping functions evaluated in this study were VMF1, GMF, and NMF, which were implemented within the GAMIT/GLOBK (version 10.7) processing framework to analyze their influence on ZTD estimation and, consequently, on GPS-derived PWV retrieval. For the VMF1 solution, the standard annual gridded VMF1 products (vmf1grd.2009, vmf1grd.2010, and vmf1grd.2011) distributed through the GAMIT/GLOBK GRIDS repository were employed. These products provide the hydrostatic and wet mapping function coefficients that are applied internally by GAMIT/GLOBK during tropospheric delay modeling. All mapping functions were evaluated using identical processing parameters and estimation settings, ensuring that the selected mapping function was the only variable modified among the different processing solutions. PWV was estimated from the ZTD obtained during GPS processing. First, the zenith hydrostatic delay (ZHD) was calculated using the Saastamoinen model, as expressed in Equation (1).
where is the surface pressure (hPa), is the geodetic latitude (rad), and H is the geodetic height (km). An error of 1 hPa in surface pressure introduces an uncertainty of approximately 2.3 mm in the ZHD and 0.37 mm in the corresponding PWV estimate [30].
The zenith wet delay (ZWD) was then obtained as the difference between the zenith tropospheric delay and the zenith hydrostatic delay, as expressed in Equation (2).
The PWV was then calculated from the ZWD using Equation (3).
where is the density of liquid water, is the specific gas constant for water vapor (), and and are atmospheric refractivity constants. The parameter represents the weighted mean atmospheric temperature and is calculated using Equation (4).
where is the partial pressure of water vapor and is the atmospheric temperature. Equation (4) represents the theoretical definition of the weighted mean atmospheric temperature. In this study, however, was obtained from the empirical GPT model through the GAMIT/GLOBK metutil utility rather than being computed directly from atmospheric profiles. The resulting values were subsequently used in the conversion of ZWD to PWV.
2.4. Tropospheric Mapping Functions
Tropospheric mapping functions are mathematical functions that project the zenith tropospheric delay (ZTD) into the slant direction of the GNSS signal as a function of satellite elevation angle. Because the estimated ZTD directly affects PWV retrieval, the choice of mapping function may influence the resulting GPS-derived PWV estimates, particularly under highly variable atmospheric conditions.
In this study, three tropospheric mapping functions implemented within GAMIT/GLOBK were evaluated: GMF [31], VMF1 [32], and NMF [33]. GMF is an empirical model derived from long-term atmospheric information obtained from numerical weather models. VMF1 is based on atmospheric fields generated by ECMWF products and incorporates site-specific atmospheric information through ray-tracing techniques. In contrast, NMF is an empirical mapping function derived from global radiosonde observations and depends primarily on latitude, station height, and day of year.
These three mapping functions were selected because they are among the most widely used models in GPS meteorology and are implemented within the GAMIT/GLOBK processing framework. Their performance was evaluated by comparing the resulting GPS-derived PWV estimates with independent radiosonde observations and ERA5 reanalysis data.
2.5. Radiosonde Data
Radiosonde observations from the University of Wyoming Atmospheric Soundings archive (https://weather.uwyo.edu/upperair/sounding_legacy.html accessed on 7 September 2025), corresponding to station 76654 located in Manzanillo, Colima, were used for the 2009–2011 period. The radiosonde observations provide vertical atmospheric profiles, including temperature, pressure, and relative humidity at different altitude levels. Due to the limited availability of radiosonde stations in southwestern Mexico, the nearest available station was selected as the independent atmospheric reference for validating GPS-derived PWV. The comparison was performed using daily PWV averages in order to reduce discrepancies associated with short-term temporal differences between the two datasets.
The radiosonde station is located at an altitude of 3.0 m above sea level, whereas the GPS stations TECO, COL2, and PENA are located at altitudes of 211.6 m, 528.8 m, and 1491.0 m above sea level, respectively. These altitude differences, particularly for PENA, may introduce discrepancies associated with the vertical variability of atmospheric water vapor. Nevertheless, the radiosonde observations represent the closest available independent atmospheric reference within the study area.
The radiosonde-derived PWV values were obtained directly from the University of Wyoming Atmospheric Soundings database using the parameter “Precipitable Water [mm] for entire sounding”. This variable represents the total atmospheric water vapor integrated throughout the atmospheric column sampled by the radiosonde and was used as the reference dataset in this study. Similar radiosonde-derived PWV products have previously been used to validate GPS-derived PWV estimates [34]. The main characteristics of the radiosonde station are summarized in Table 5.
Table 5.
Characteristics of the radiosonde station used in this study.
2.6. Precipitation Data
Precipitation data were obtained from the climatological information portal of the National Meteorological Service (SMN), operated by the National Water Commission (CONAGUA) (https://smn.conagua.gob.mx/es/climatologia/informacion-climatologica/informacion-estadistica-climatologica accessed on 19 September 2025). Meteorological stations located near the GPS sites were selected to investigate the relationship between GPS-derived PWV variations and precipitation events within the study area.
Daily rainfall records from the Venustiano Carranza (6048), Peña Colorada (6030), and Trapiche (6073) meteorological stations were analyzed for the rainy seasons (July–October) of 2009, 2010, and 2011. Their geographical characteristics are summarized in Table 6. These stations were selected because of their proximity to the GPS sites, ensuring that the precipitation records were representative of the local meteorological conditions.
Table 6.
Meteorological stations used in this study.
The precipitation data correspond to daily accumulated rainfall (mm day−1) and were analyzed primarily during the rainy season (July–October), when tropical cyclone activity is most frequent in the region. These data were compared with the GPS-derived PWV time series to investigate the relationship between atmospheric water vapor content and precipitation occurrence. This analysis also explores the potential of GPS-derived PWV as an indicator of atmospheric conditions favorable for precipitation, particularly during extreme meteorological events [35].
2.7. ERA5 Data
ERA5 is the fifth-generation atmospheric reanalysis produced by the European Centre for Medium-Range Weather Forecasts (ECMWF) [36]. It combines observations from meteorological stations, radiosondes, and satellite sensors through data assimilation within numerical weather prediction models, providing a continuous and physically consistent representation of the atmospheric state.
In this study, Total Column Water Vapour (TCWV) data from ERA5 were used as an independent reference for validating GPS-derived PWV during the 2009–2011 period. This variable represents the vertically integrated atmospheric water vapor content and is directly comparable to PWV expressed in millimeters.
ERA5 data were obtained at an hourly temporal resolution and a spatial resolution of approximately 0.25° × 0.25°. For each GPS station, the nearest ERA5 grid cell was selected according to its geographical coordinates. This approach was consistently applied to all stations throughout the entire study period to ensure a homogeneous comparison among the evaluated mapping functions. Although bilinear interpolation using the four surrounding ERA5 grid cells could potentially provide a more representative estimate at the station location, the nearest-grid-cell approach was considered appropriate for the objectives of this study, which focus on comparing the relative performance of the evaluated mapping functions rather than on optimizing the ERA5 extraction procedure. The hourly values were subsequently averaged to daily values to ensure temporal consistency with the GPS-derived PWV and radiosonde PWV time series.
ERA5 provides a temporally continuous and spatially consistent reference dataset for evaluating the temporal evolution of atmospheric water vapor and complements the validation performed with radiosonde observations.
2.8. Statistical Comparison and Validation
The performance of the evaluated tropospheric mapping functions was assessed by comparing the GPS-derived PWV estimates with the independent reference datasets (radiosonde and ERA5). The Pearson correlation coefficient [37] was used to quantify the degree of linear association between the datasets, as expressed in Equation (5).
where X represents the GPS-derived PWV values and Y corresponds to the reference PWV values obtained from radiosonde observations or ERA5. and denote the mean values of each dataset, respectively. Correlation coefficients approaching 1 indicate a strong positive linear relationship between the compared datasets.
Model performance was further evaluated using the bias (BIAS), expressed in Equation (6), and the root mean square error (RMSE), calculated using Equation (7):
where n is the total number of observations, X represents the GPS-derived PWV estimate, and Y corresponds to the reference value.
To quantify the uncertainty associated with the performance metrics, 95% confidence intervals were estimated for RMSE and BIAS using moving-block bootstrap resampling with a block length of seven days and 5000 bootstrap replicates. The moving-block approach was adopted to partially preserve the temporal dependence of the daily PWV series during the resampling procedure.
In addition, pairwise comparisons among the evaluated mapping functions were performed using the Wilcoxon signed-rank test applied to the paired daily absolute PWV errors. The comparisons included GMF–NMF, GMF–VMF1, and NMF–VMF1 for each station, year, and reference dataset. To account for multiple pairwise comparisons, the Holm correction was applied, and statistical significance was evaluated at the 0.05 level.
The ERA5 PWV values were extracted from the nearest ERA5 grid cells to each GPS station. The coordinates of the selected ERA5 grid cells are presented in Table 7.
Table 7.
ERA5 grid cells used for PWV extraction.
3. Results
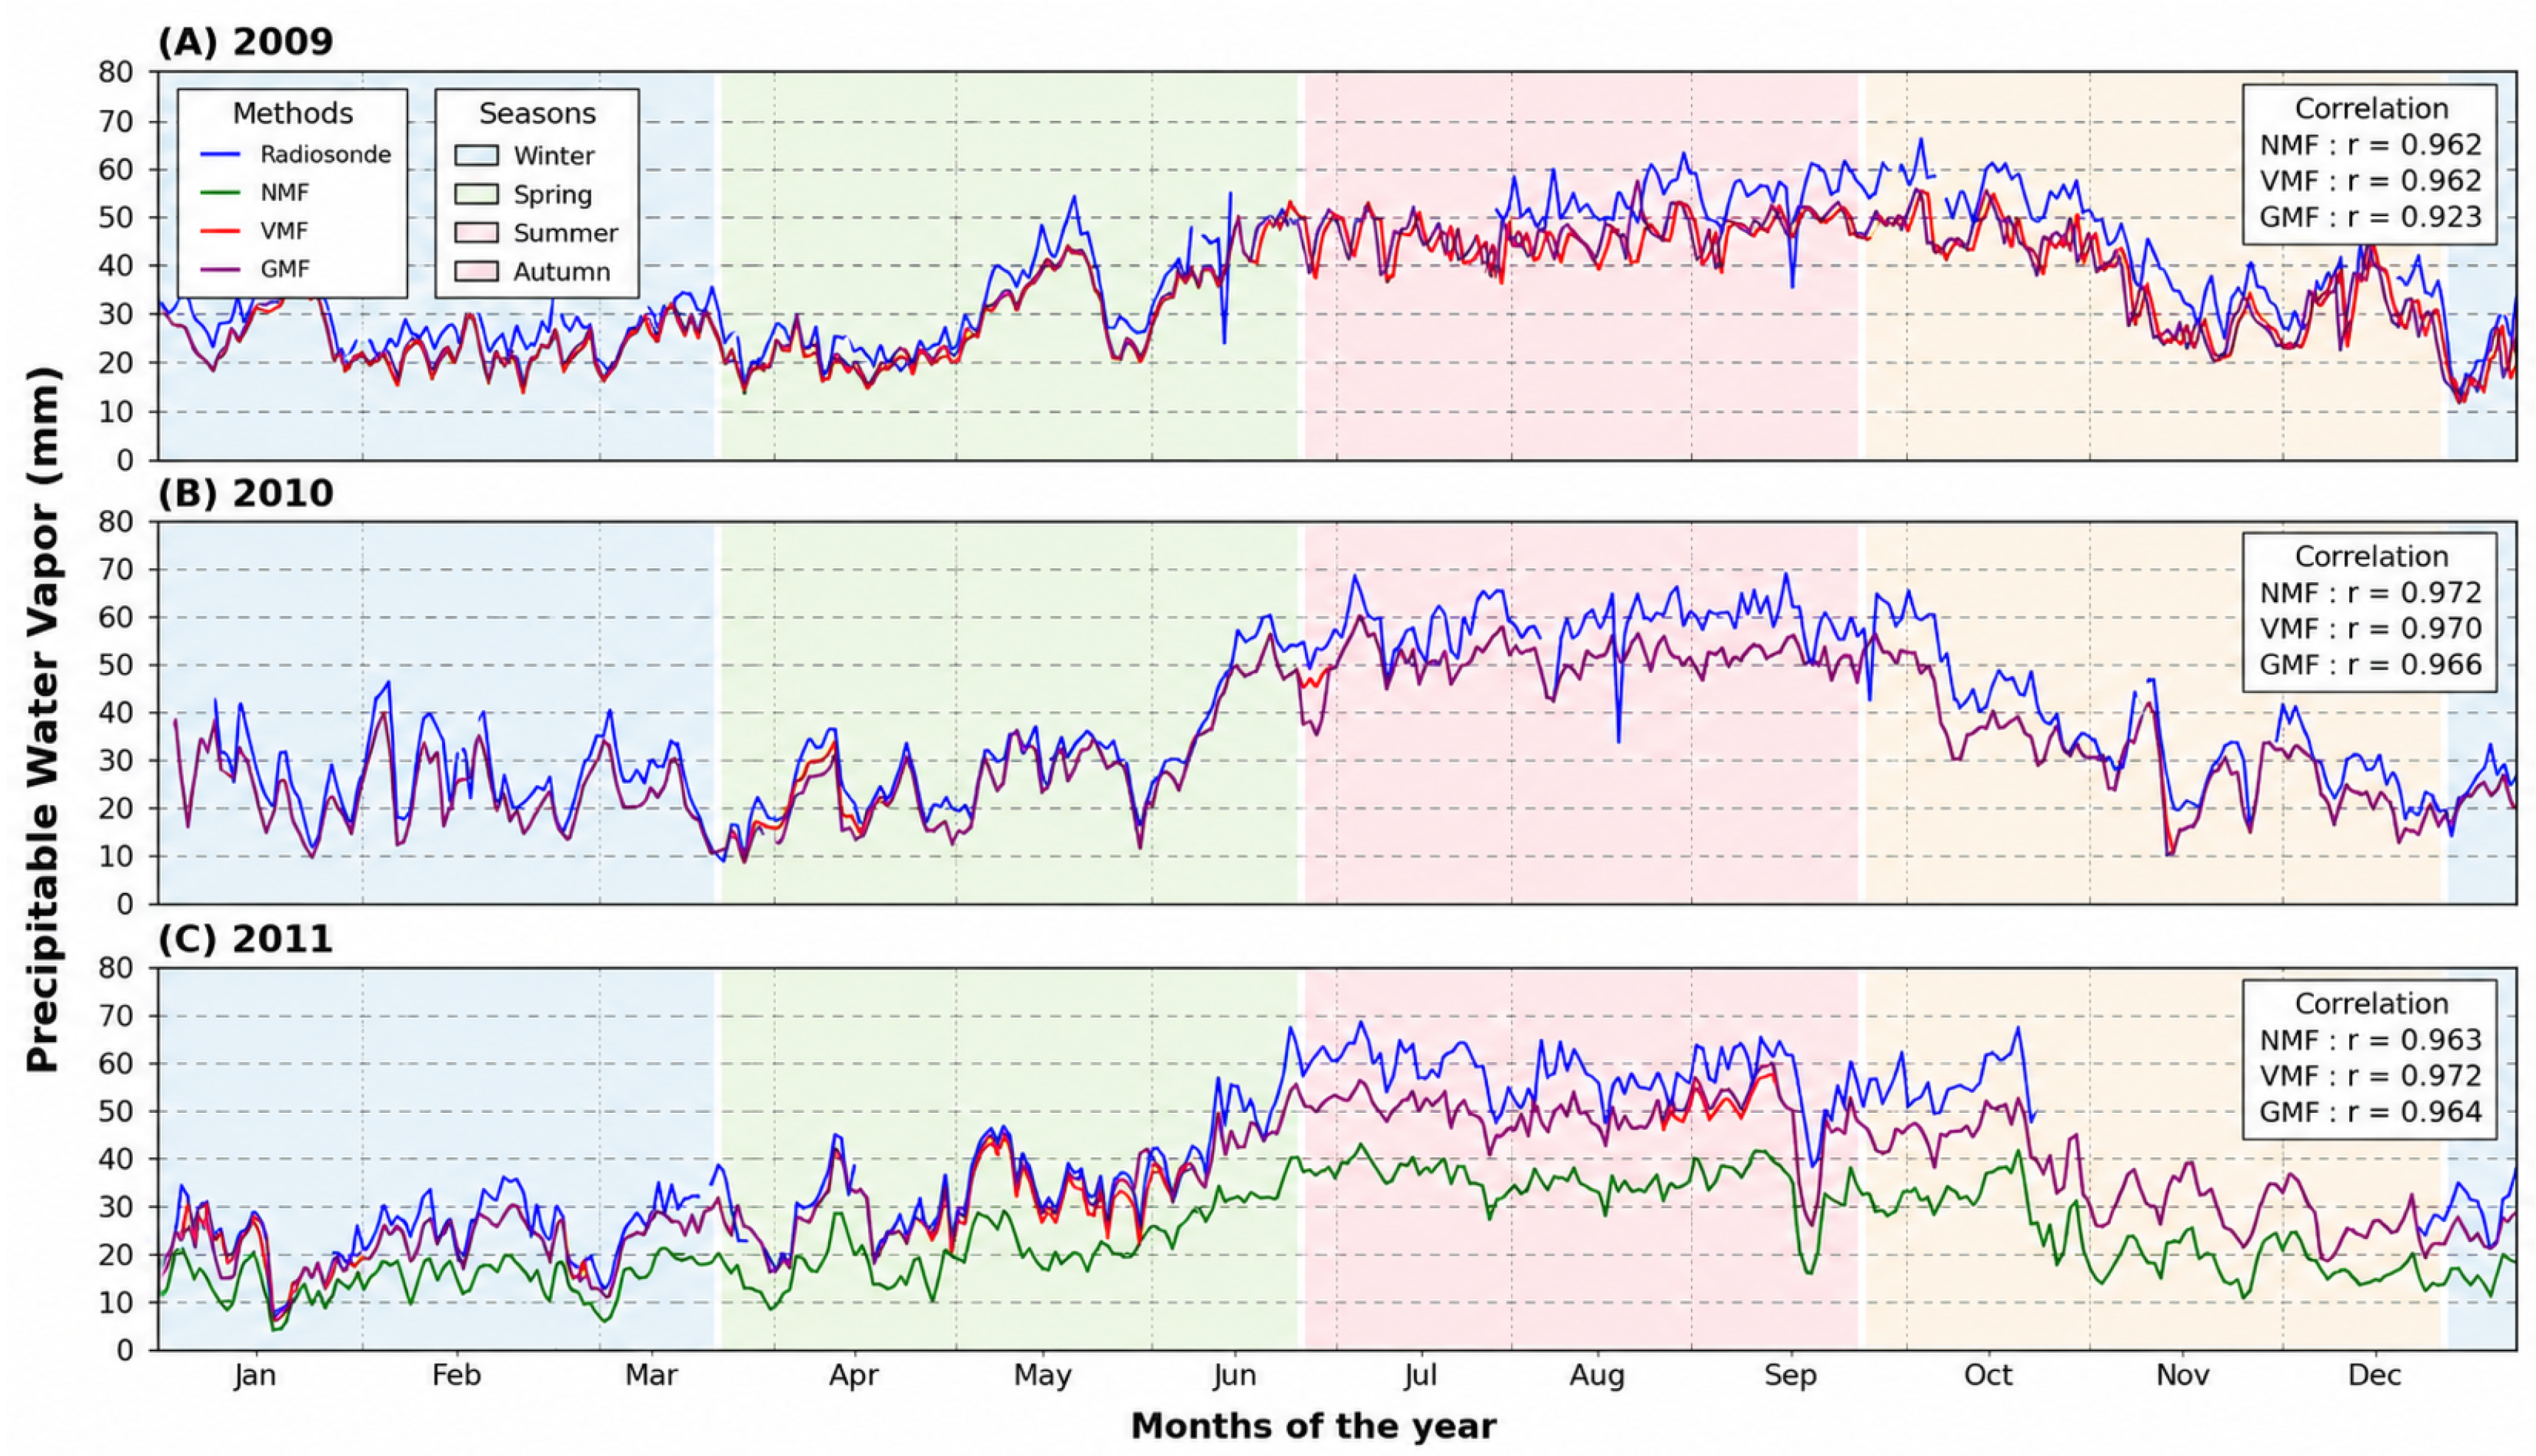
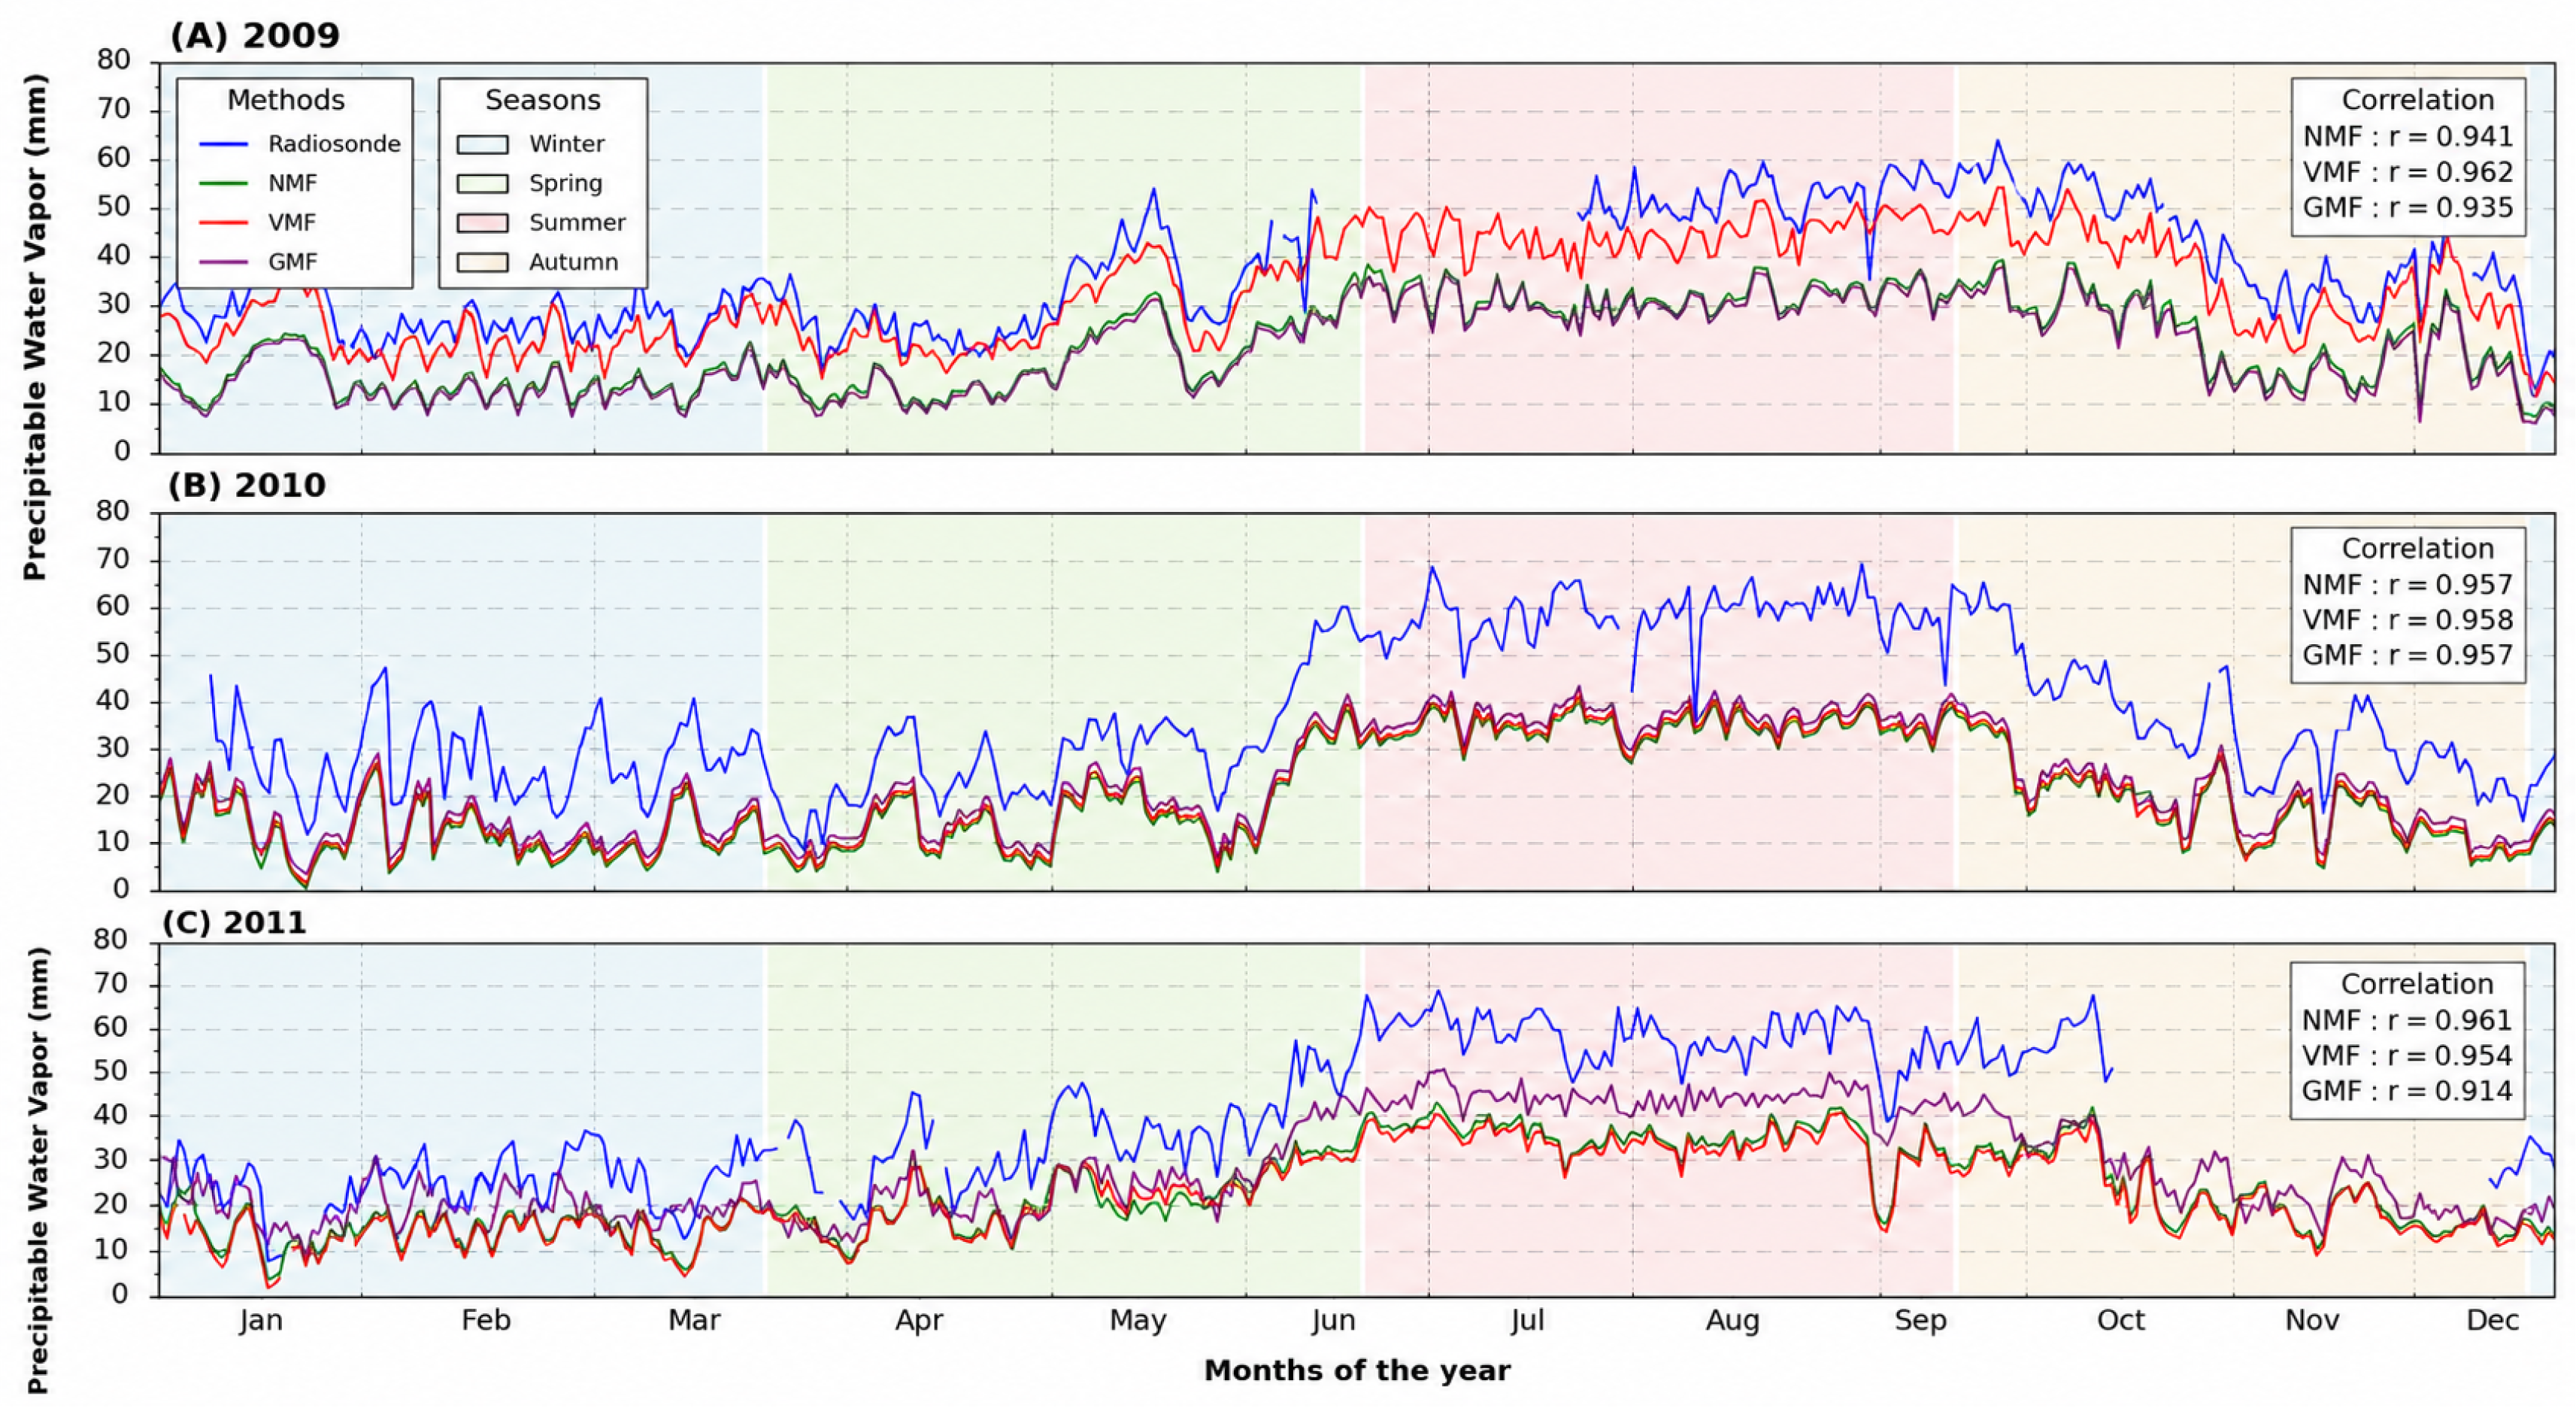
The annual GPS-derived PWV time series obtained using the GMF, VMF1, and NMF mapping functions were compared with radiosonde observations to evaluate their seasonal behavior and temporal variability.
For station COL2 (Figure 2), the GPS-derived PWV time series exhibited a well-defined seasonal cycle throughout the 2009–2011 period, with lower values during winter and higher values during the summer rainy season. All three mapping functions reproduced the temporal evolution observed in the radiosonde data; however, noticeable differences were observed in both PWV magnitude and the agreement with the reference observations.
Figure 2.
Comparison of GPS-derived PWV time series obtained using GMF, NMF, and VMF1 against radiosonde observations at station COL2.
Among the evaluated mapping functions, GMF and NMF generally showed the highest agreement with the radiosonde observations. During 2009, both mapping functions achieved correlation coefficients ranging from approximately 0.92 to 0.97, whereas VMF1 exhibited lower correlations during 2010 and 2011, with values below 0.79. These results indicate that, under the adopted processing strategy, GMF and NMF generally provided more consistent agreement with the reference observations than VMF1 at station COL2.
The GPS-derived PWV time series for station PENA (Figure 3) exhibited a seasonal pattern similar to that observed at COL2, with all three mapping functions reproducing the temporal evolution of the radiosonde observations. However, larger differences among the mapping functions were evident, particularly in the estimated PWV magnitude and the agreement with the reference dataset.
Figure 3.
GPS-derived PWV time series obtained using GMF, NMF, and VMF1 compared with radiosonde observations at station PENA.
The correlation coefficients between GPS-derived PWV and radiosonde observations ranged from 0.91 to 0.96 for GMF and NMF. During 2009, all three mapping functions achieved high correlations (0.93–0.96), whereas in 2010 and 2011, GMF and NMF maintained values above 0.91 while VMF1 decreased to values below 0.82. Although high correlations were obtained, the RMSE and BIAS values remained larger than those observed at COL2, indicating greater differences between the GPS-derived PWV and the radiosonde observations. Overall, GMF and NMF generally provided lower RMSE and BIAS values than VMF1 at station PENA.
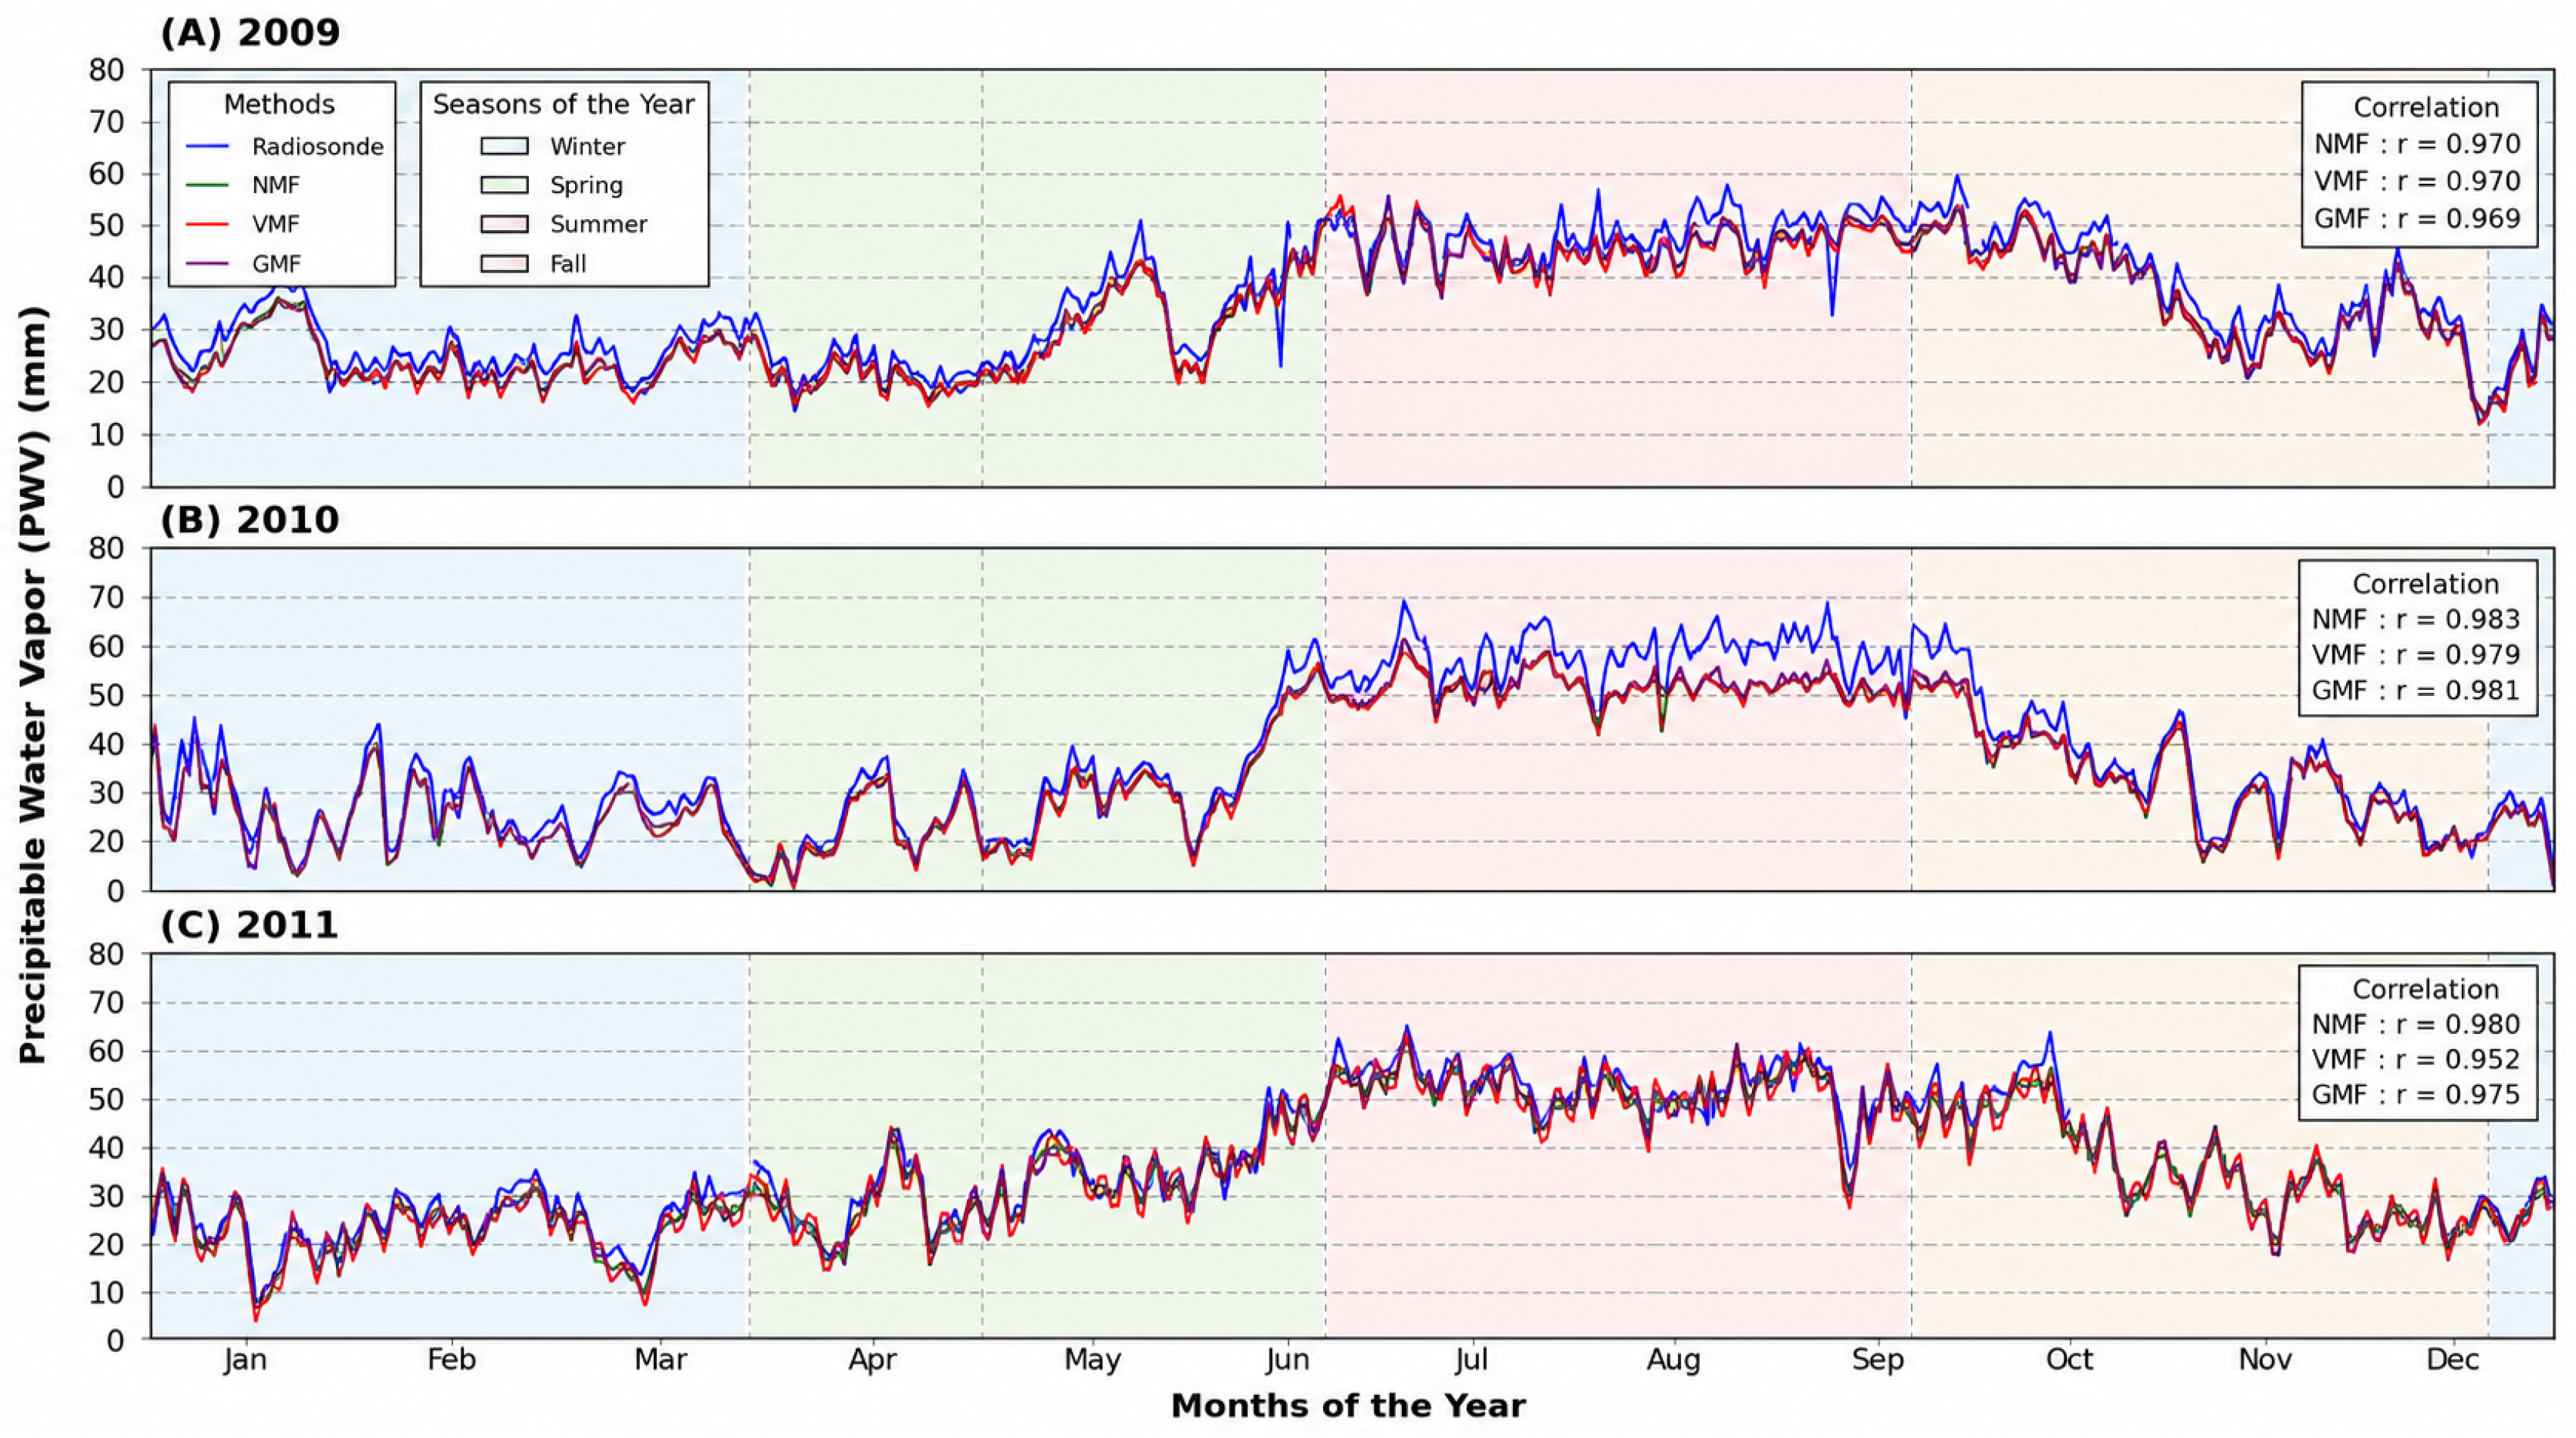
Station TECO (Figure 4) exhibited a seasonal pattern similar to those observed at COL2 and PENA. All three mapping functions successfully reproduced the temporal evolution of the radiosonde observations, with smaller differences among the estimated PWV time series than those observed at the other two stations.
Figure 4.
GPS-derived PWV time series obtained using GMF, NMF, and VMF1 compared with radiosonde observations at station TECO.
The GPS-derived PWV estimates at TECO consistently exhibited the strongest agreement with the radiosonde observations throughout the study period. Correlation coefficients reached values close to 0.97 in 2009, ranged between 0.97 and 0.98 in 2010, and between 0.95 and 0.98 in 2011. Furthermore, RMSE values remained between approximately 3.2 and 5.5 mm, whereas BIAS values ranged from to mm. Overall, the three mapping functions produced very similar results at TECO, with only small differences in RMSE and BIAS among the evaluated solutions.
Table 8 summarizes the RMSE and BIAS values obtained for the three mapping functions at stations TECO, PENA, and COL2 during the 2009–2011 period. Overall, TECO exhibited the lowest RMSE and BIAS values, indicating the closest agreement with the radiosonde observations, whereas PENA showed the largest errors and COL2 presented intermediate performance. Across the three stations, the relative performance of the evaluated mapping functions varied according to the station, study year, and reference dataset. Although GMF and NMF frequently yielded lower RMSE and BIAS values under the adopted processing strategy, the lowest errors were not consistently associated with a single mapping function across all analyzed conditions.
Table 8.
RMSE and BIAS values of GPS-derived PWV obtained using GMF, NMF, and VMF1 compared with radiosonde observations and ERA5 at stations TECO, PENA, and COL2 during the 2009–2011 period.
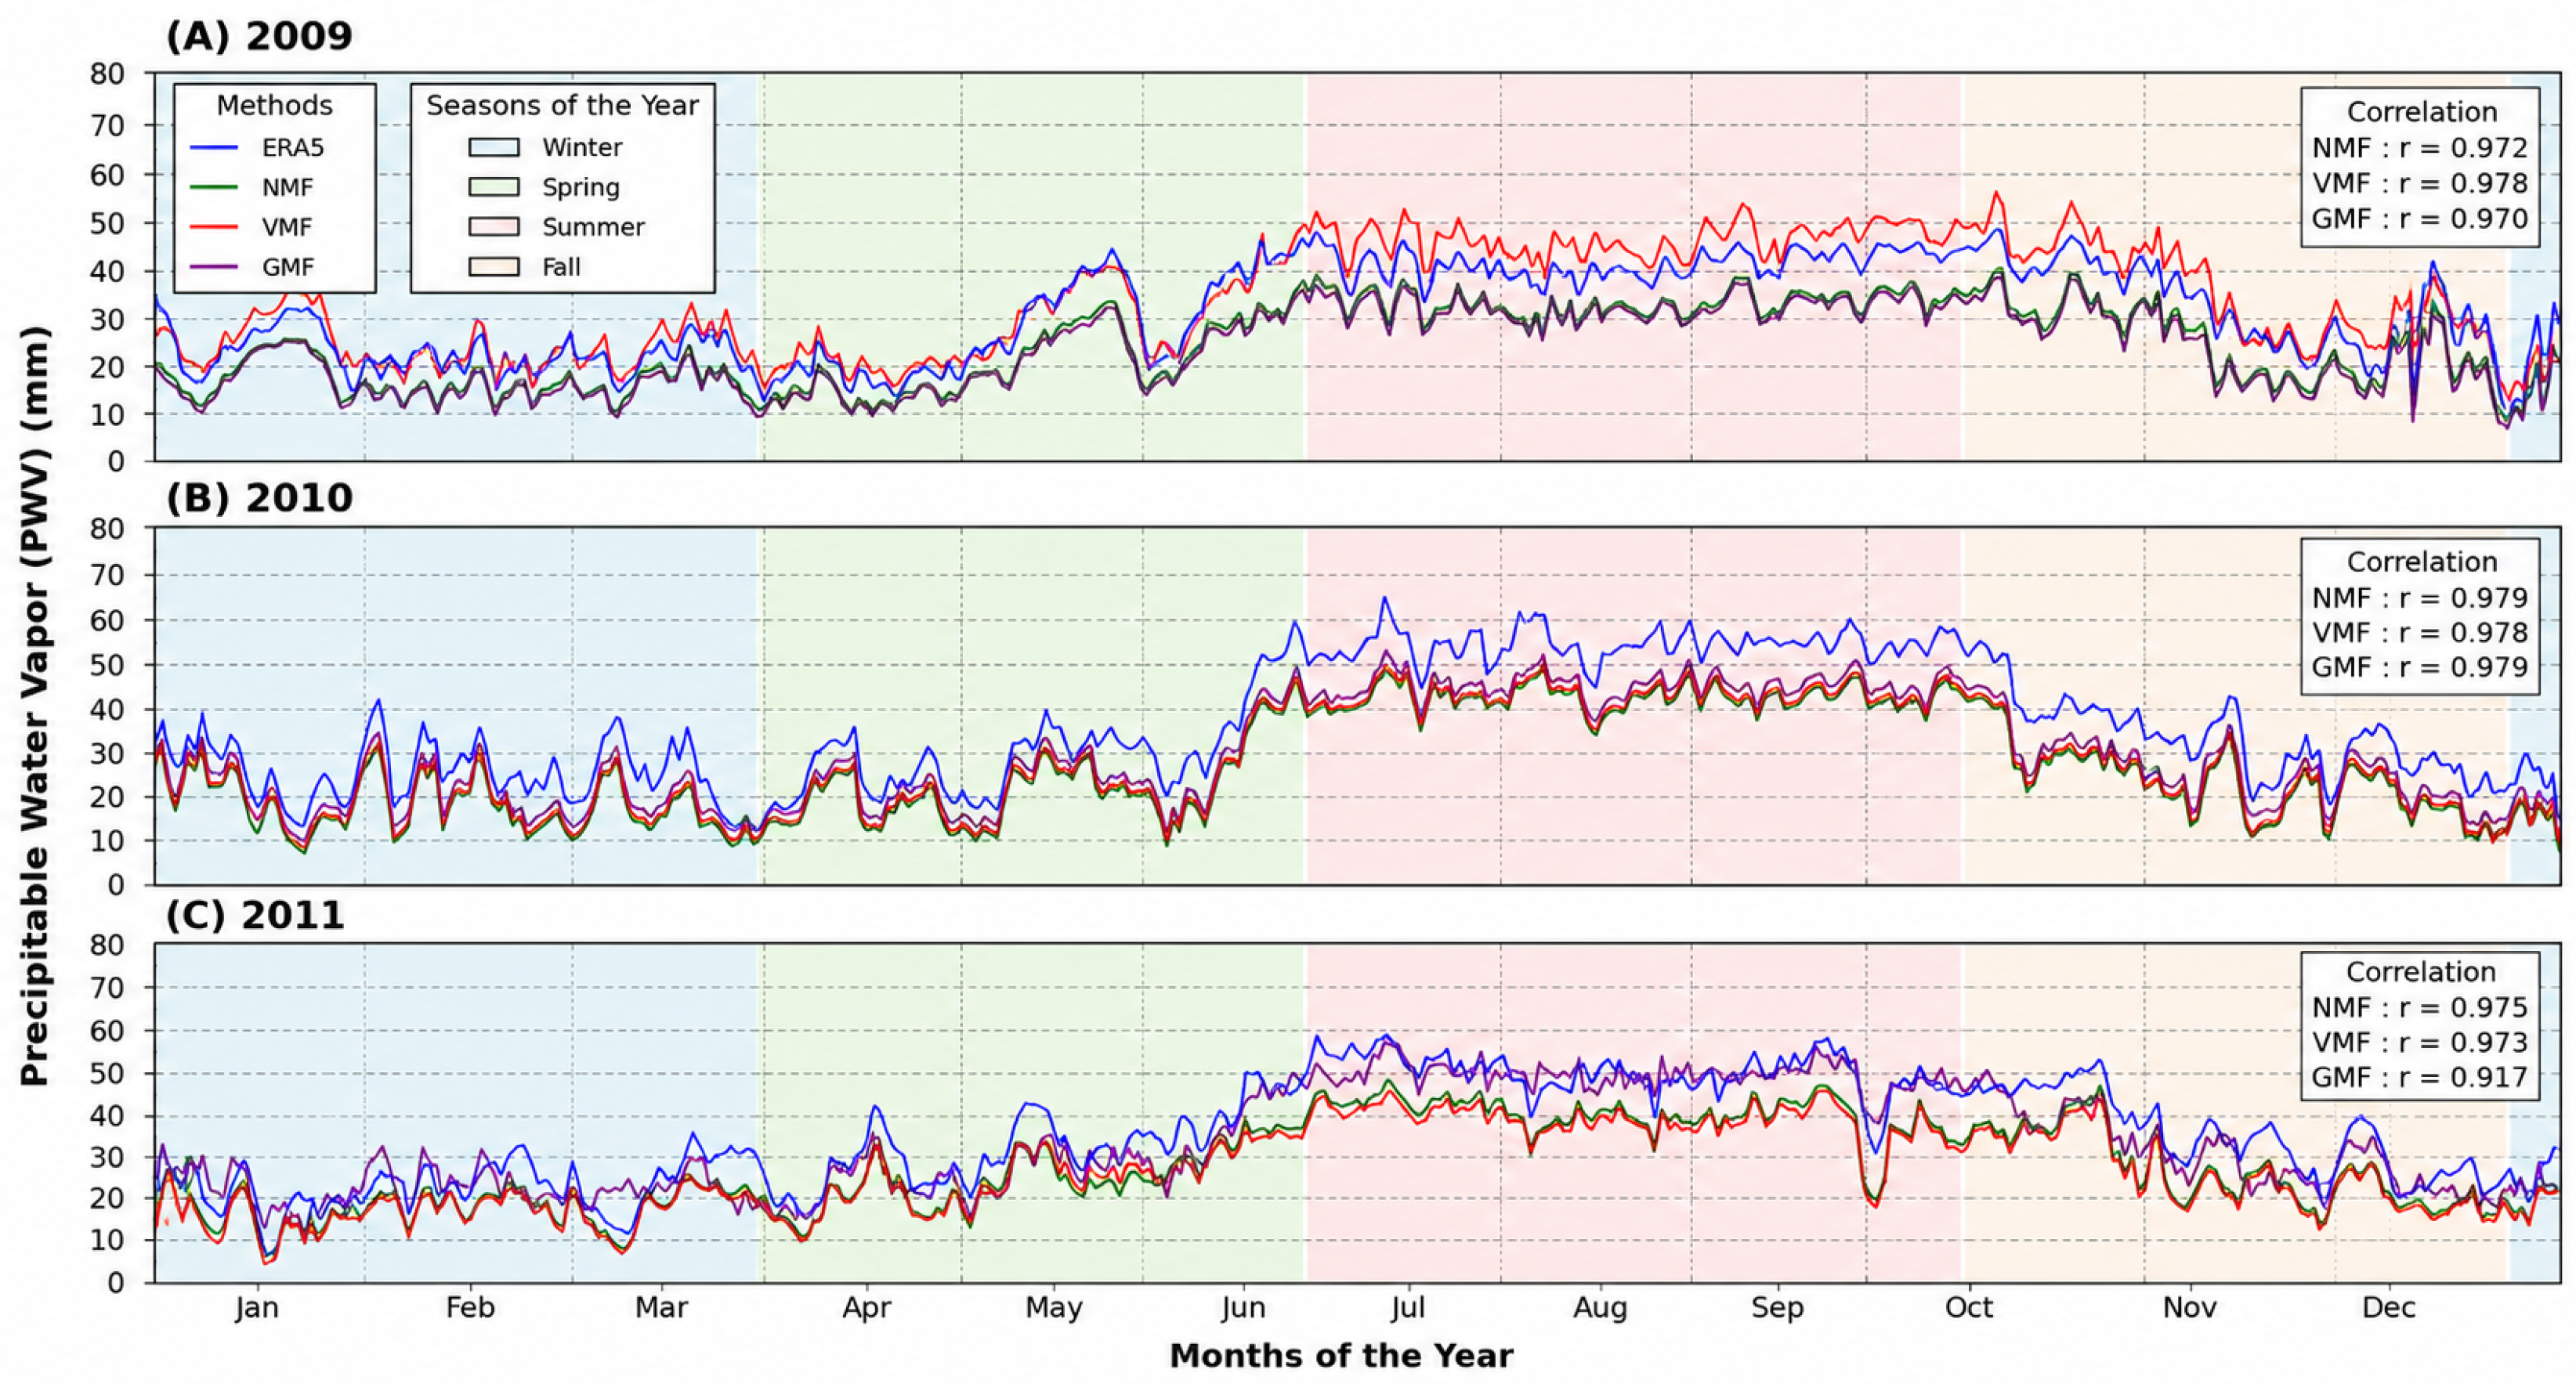
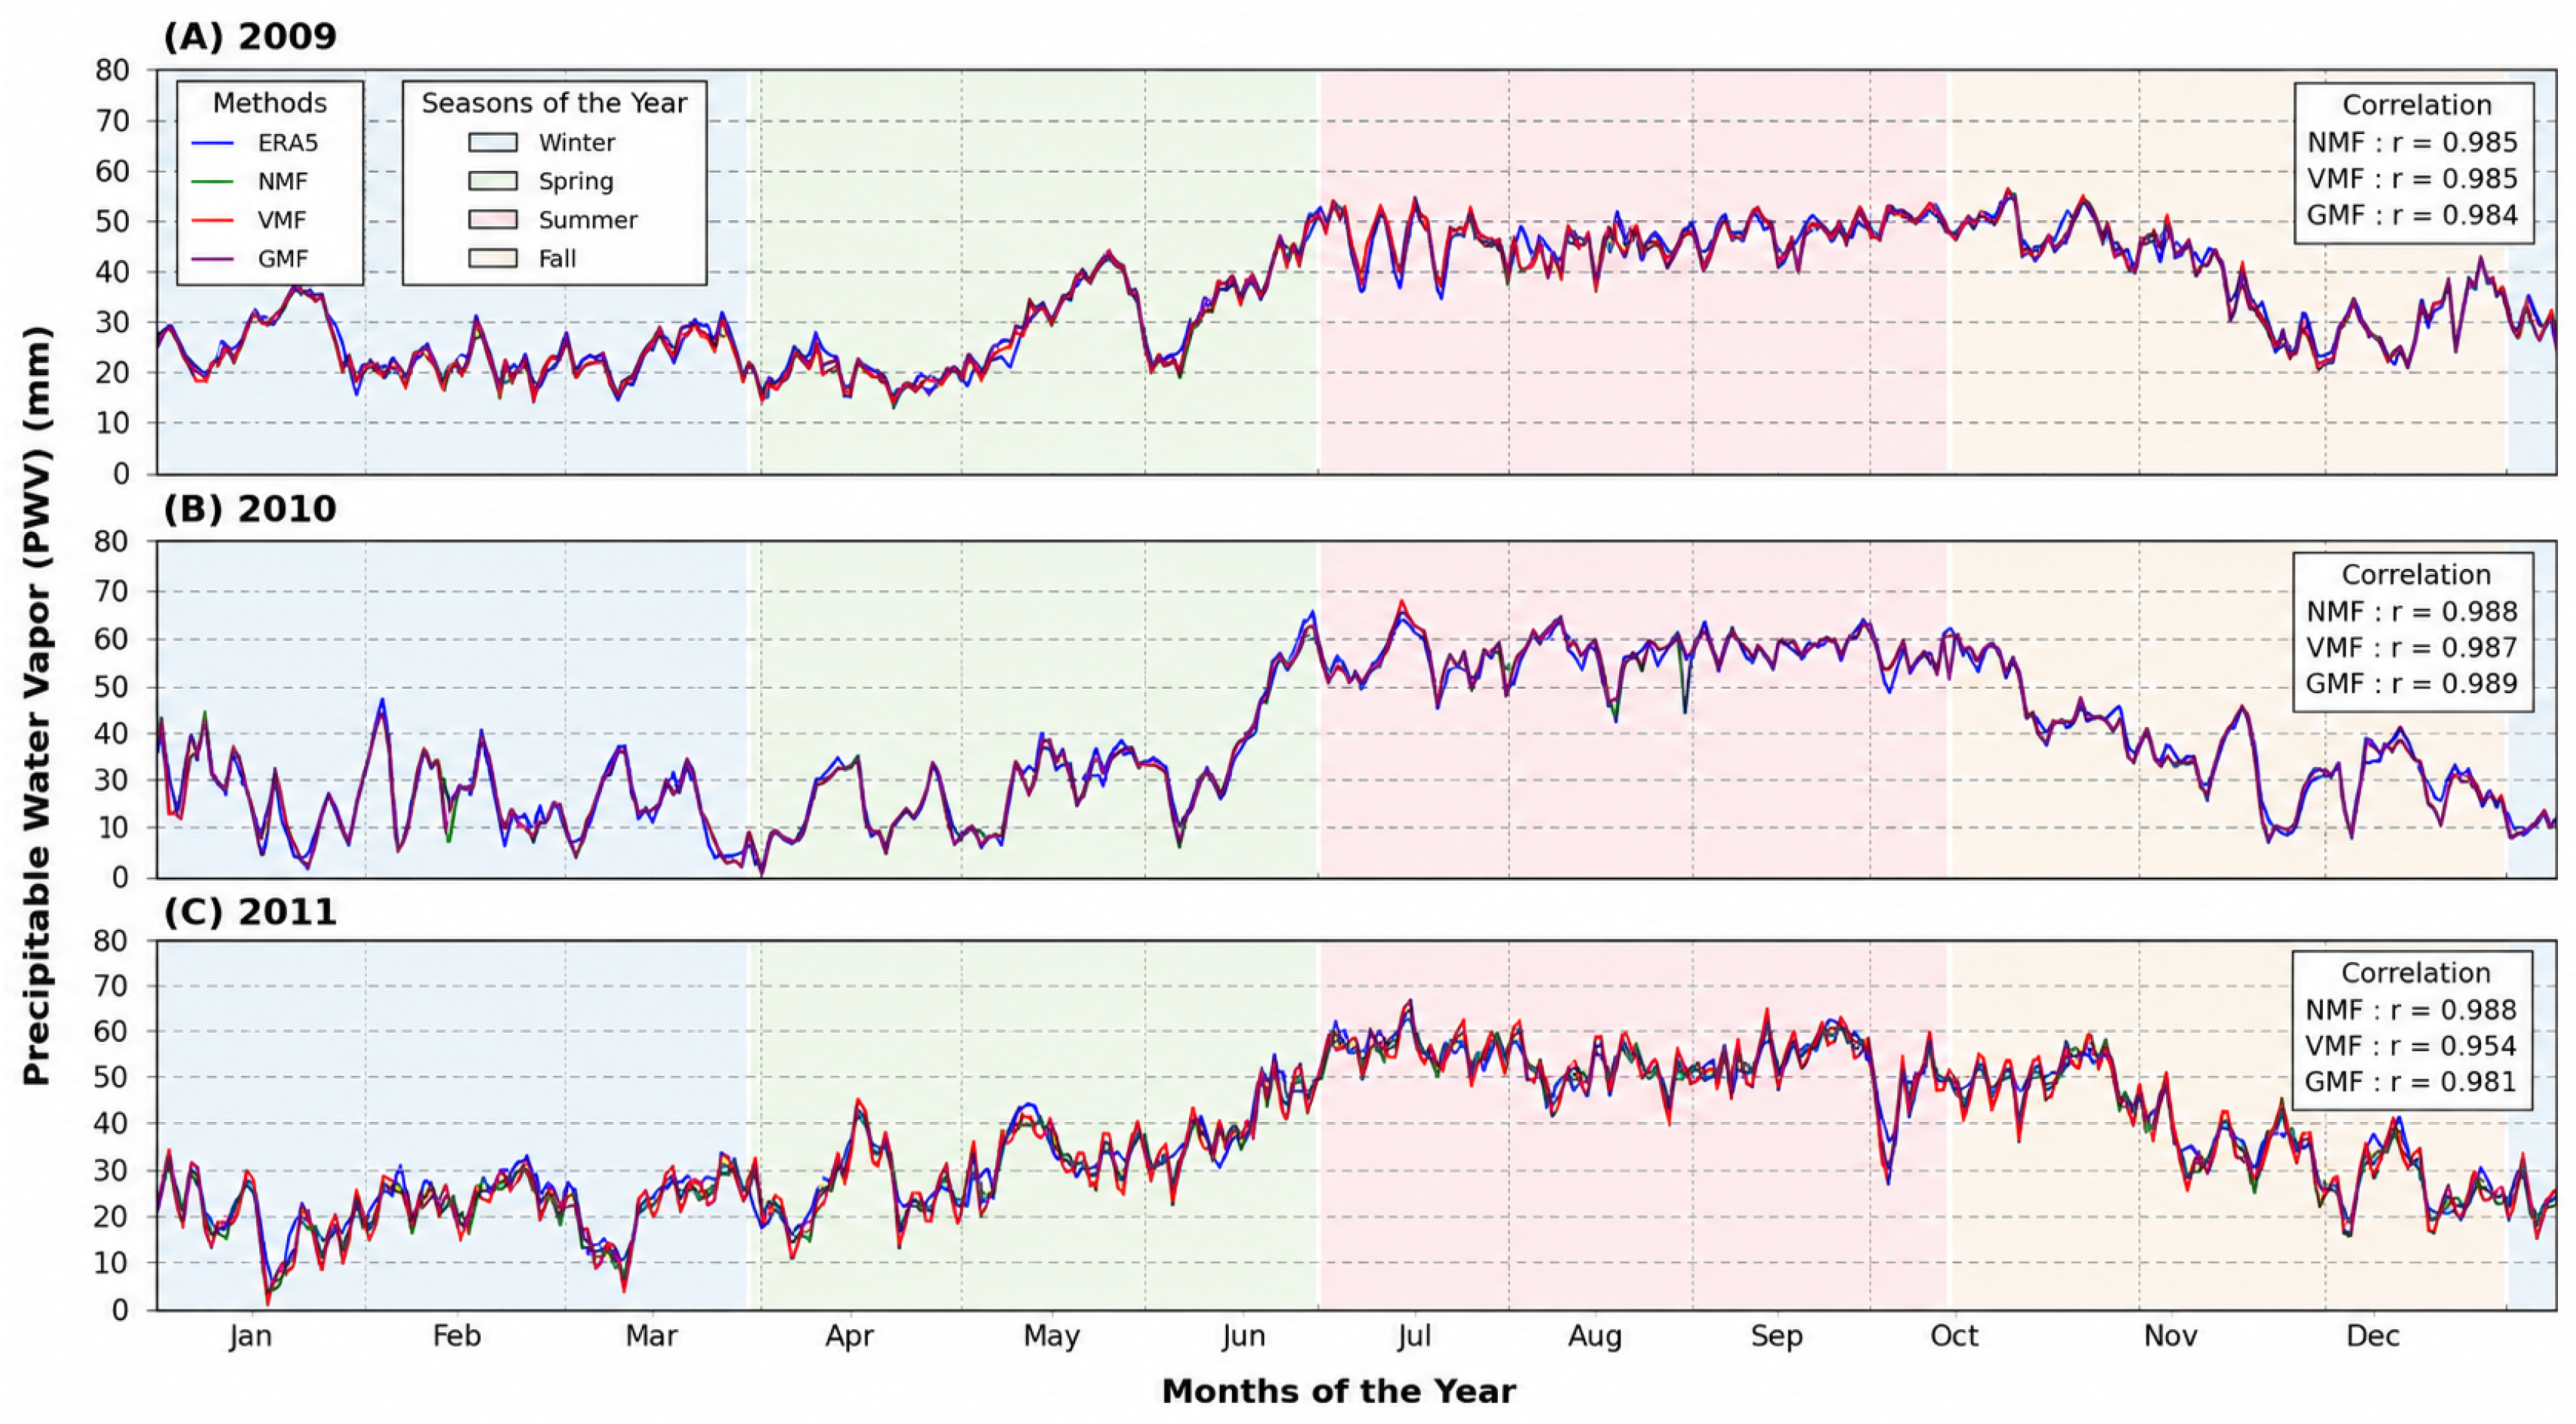
The comparison between GPS-derived PWV and ERA5 values for station COL2 is presented in Figure 5 for the years 2009, 2010, and 2011. Similar to the comparison with radiosonde observations, the GPS-derived PWV time series reproduced the seasonal variability represented by the ERA5 product, with lower values during winter and higher values during the summer rainy season. Differences among the evaluated mapping functions were also evident in the estimated PWV magnitude and their agreement with the ERA5 reanalysis.
Figure 5.
GPS-derived PWV time series obtained using GMF, NMF, and VMF1 compared with ERA5 reanalysis data at station COL2.
The comparison between GPS-derived PWV and ERA5 for station COL2 (Figure 5) shows good agreement throughout the 2009–2011 period. Both datasets reproduced the expected seasonal variability, characterized by higher PWV values during the summer rainy season and lower values during winter. All three mapping functions captured the temporal evolution represented by the ERA5 reanalysis, although differences were observed in the estimated PWV magnitude and the agreement with the reference dataset.
Correlation coefficients remained high throughout the study period, particularly for GMF and NMF, with values ranging from approximately 0.94 to 0.98. In contrast, VMF1 exhibited lower correlations, especially during 2010 and 2011.
Figure 6 presents the comparison between GPS-derived PWV and ERA5 for station PENA during the 2009–2011 period. Similar to COL2, the GPS-derived PWV time series reproduced the seasonal variability represented by the ERA5 reanalysis. However, larger differences among the mapping functions were observed, particularly in the estimated PWV magnitude and their agreement with the reference dataset.
Figure 6.
Comparison of GPS-derived PWV time series obtained using GMF, NMF, and VMF1 against ERA5 data for station PENA.
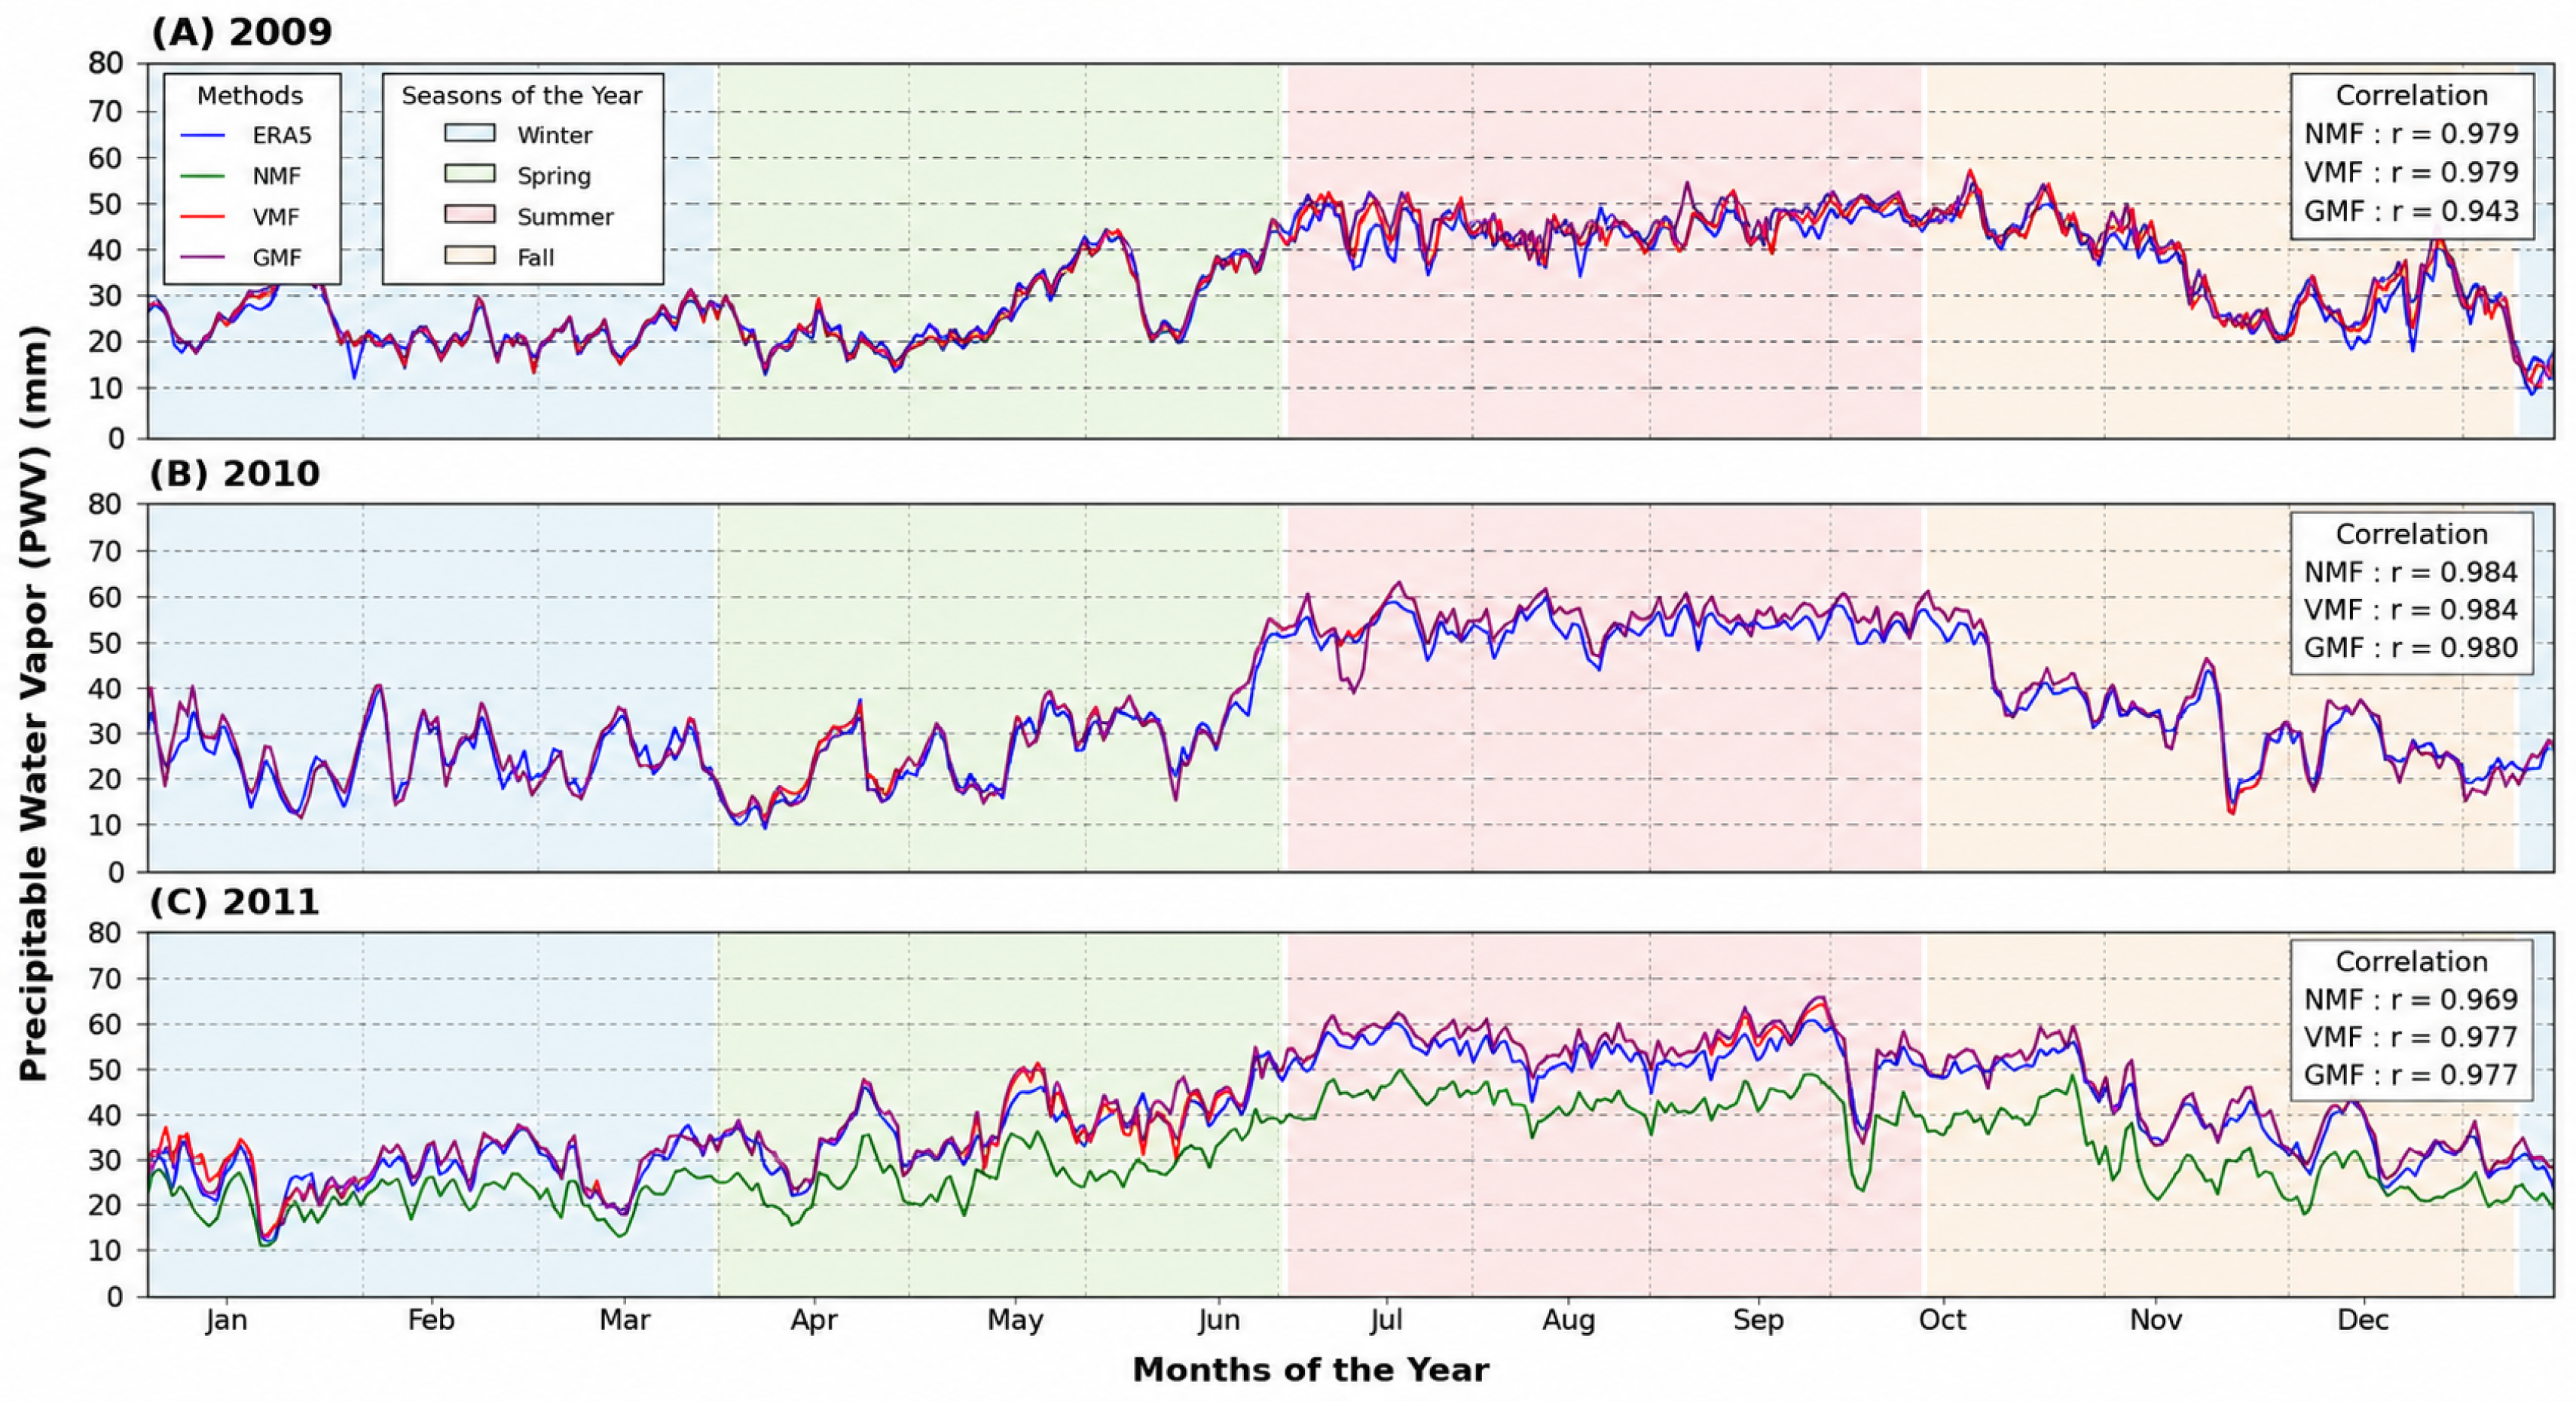
For station PENA, the comparison with ERA5 showed better agreement than that obtained with the radiosonde observations. Correlation coefficients remained above 0.778 throughout the study period, with NMF consistently achieving the highest correlations, exceeding 0.97. GMF also exhibited stable performance, whereas VMF1 showed greater variability, particularly during 2010, when the correlation decreased below 0.78 before partially recovering in 2011.
Figure 7 presents the comparison between GPS-derived PWV and ERA5 data for station TECO during the 2009–2011 period.
Figure 7.
Comparison of GPS-derived PWV time series obtained using GMF, NMF, and VMF1 against ERA5 data for station TECO.
Among the three analyzed stations, TECO exhibited the highest agreement with the ERA5 reanalysis. Correlation coefficients remained close to 0.99 for GMF and NMF throughout the study period, whereas VMF1 showed a similar temporal behavior with only a slight reduction in correlation during 2011. Overall, the three mapping functions reproduced the temporal evolution represented by the ERA5 reanalysis, with GMF and NMF exhibiting the highest correlations.
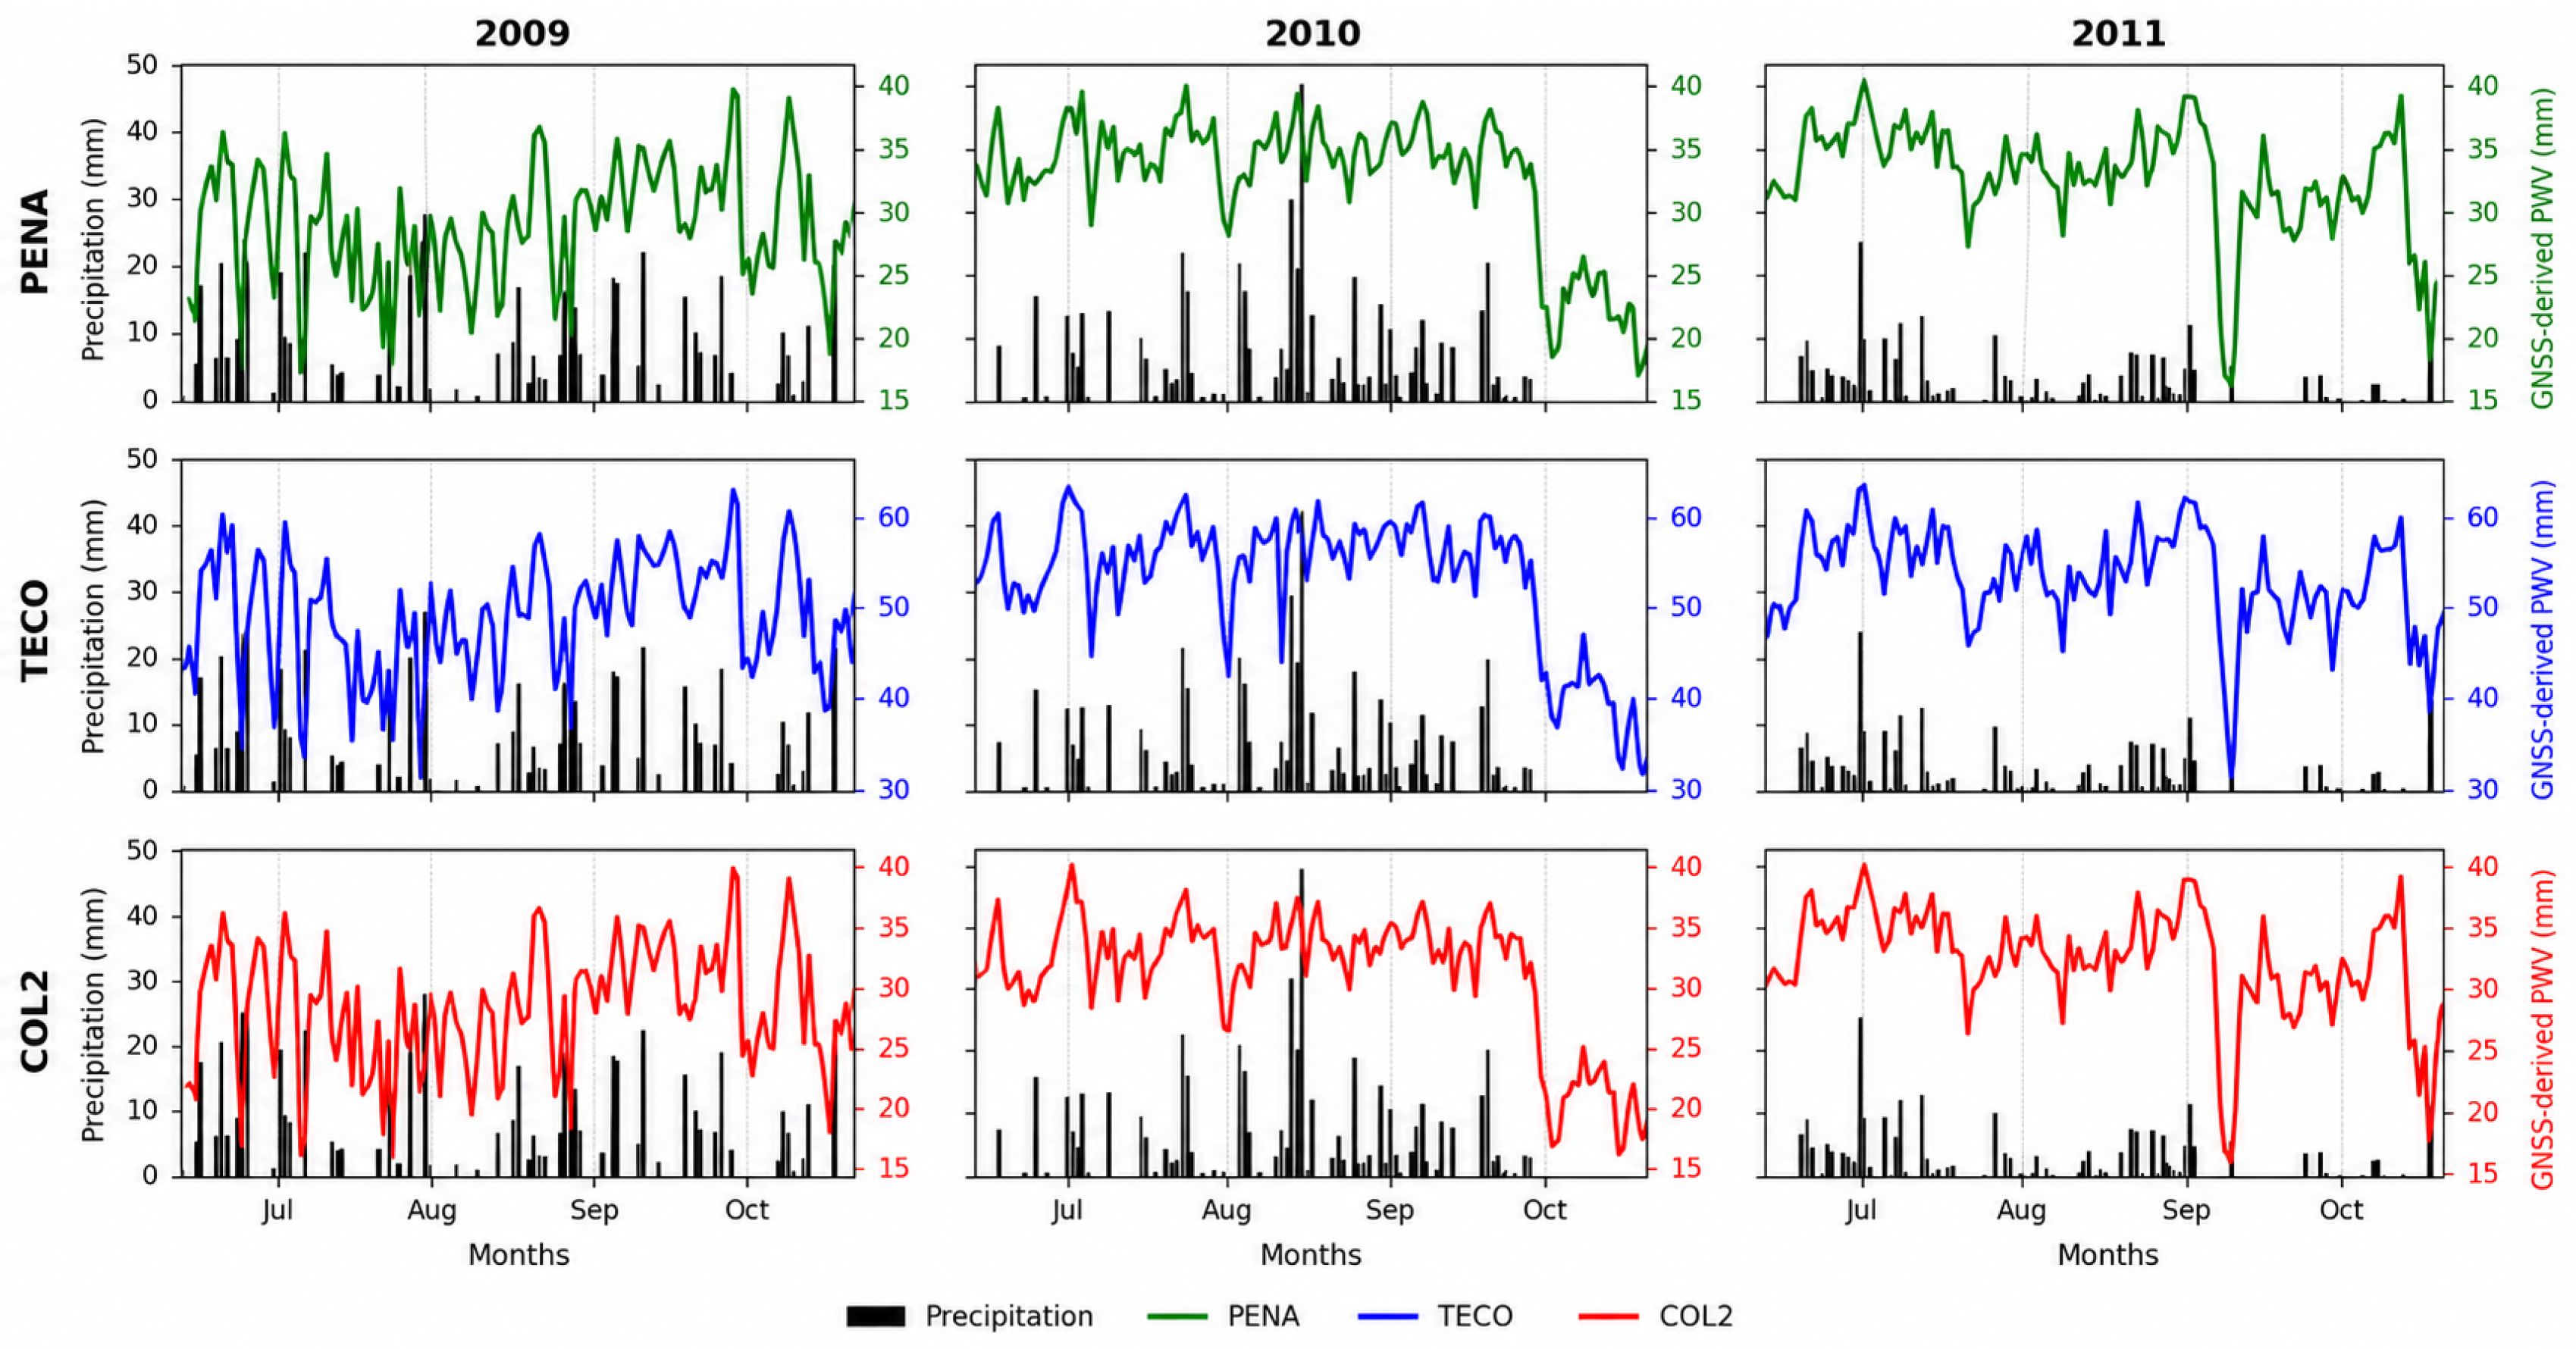
The relationship between GPS-derived PWV and precipitation records for stations PENA, TECO, and COL2, using NMF, is presented in Figure 8. All three stations exhibited a well-defined seasonal cycle, with relatively low PWV values during January–April followed by a progressive increase beginning in spring and reaching maximum values during summer and early autumn (June–October).
Figure 8.
Relationship between GPS-derived PWV obtained using NMF and precipitation records from the TECO, COL2, and PENA meteorological stations during the 2009–2011 period.
The increase in PWV coincides with the period of greatest precipitation frequency and intensity, indicating a close relationship between atmospheric water vapor availability and rainfall occurrence. In most cases, increases in PWV precede or accompany precipitation events, supporting the use of GPS-derived PWV as an indicator of atmospheric conditions favorable for precipitation development.
Some intense precipitation events, however, occur when PWV values are already decreasing. This behavior reflects the fact that PWV represents the total atmospheric water vapor content, whereas precipitation develops after part of this vapor has condensed into cloud water and rainfall. Consequently, maximum precipitation does not necessarily coincide with maximum PWV, particularly in tropical regions dominated by convective processes.
This seasonal behavior is consistently observed at the three analyzed stations, demonstrating the capability of GPS-derived PWV to characterize the regional hydrological cycle and highlighting its potential for atmospheric monitoring in regions frequently affected by extreme meteorological events.
Table 8 summarizes the RMSE and BIAS values obtained from the comparisons with both radiosonde observations and ERA5 for the three evaluated mapping functions. TECO consistently exhibited the lowest errors and the strongest agreement with the reference datasets, whereas COL2 and particularly PENA showed larger discrepancies, especially in the comparison with the radiosonde observations. These differences are consistent with the influence of spatial representativeness discussed throughout the manuscript.
Table 9 further summarizes the mapping function yielding the lowest RMSE for each station–year combination and reference dataset. Overall, the best-performing mapping function varied according to the validation dataset, station, and year. For the radiosonde comparison, GMF produced the lowest RMSE in four of the nine station–year combinations, followed by NMF in three cases and VMF1 in two cases. An identical distribution was obtained for the ERA5 comparison, with GMF, NMF, and VMF1 providing the lowest RMSE in four, three, and two cases, respectively. These results confirm that no single mapping function consistently outperformed the others across all analyzed conditions.
Table 9.
Overall summary of the mapping function yielding the lowest RMSE for each station and year using radiosonde observations and ERA5 as reference datasets.
Overall, the results demonstrate that GPS-derived PWV successfully reproduced the temporal evolution of atmospheric water vapor in southwestern Mexico. Comparisons with both radiosonde observations and ERA5 revealed good agreement in seasonal and interannual variability, with TECO exhibiting the closest agreement with the reference datasets. Although larger discrepancies were observed at COL2 and PENA, particularly in the comparison with radiosonde observations, the agreement with ERA5 was generally stronger, suggesting that the gridded nature of the reanalysis product partially reduces the influence of spatial representativeness.
Finally, the comparison with precipitation records indicates that increases in GPS-derived PWV were generally associated with periods of enhanced rainfall activity, supporting its potential use as an indicator of atmospheric conditions favorable for precipitation in tropical regions. As discussed previously, this comparison is intended as a qualitative assessment of seasonal variability rather than as evidence of predictive capability.
Overall, the mapping function yielding the lowest RMSE varied according to the validation dataset, station, and year. For the radiosonde validation, GMF produced the lowest RMSE in four of the nine station–year combinations, followed by NMF in three cases and VMF1 in two cases. The ERA5 comparison showed an identical distribution, with GMF, NMF, and VMF1 providing the lowest RMSE in four, three, and two cases, respectively. These results confirm that no single mapping function consistently outperformed the others across all analyzed conditions. Although GMF accounted for the largest number of best-performing cases, the relative performance of the evaluated mapping functions depended on the validation dataset, station characteristics, study year, and the spatial representativeness of the reference observations.
Statistical Comparison of Mapping-Function Performance
The descriptive comparison based on RMSE and BIAS was complemented by moving-block bootstrap confidence intervals and pairwise Wilcoxon signed-rank tests applied to the daily absolute PWV errors Table 10. The statistical analyses were performed independently for each station, year, and reference dataset.
Table 10.
Summary of the pairwise Wilcoxon signed-rank tests applied to the daily absolute PWV errors. Values indicate the number of statistically significant comparisons ( after Holm correction) out of the nine station–year combinations evaluated for each reference dataset.
For the radiosonde validation, statistically significant differences were identified in seven of the nine GMF–NMF comparisons and in eight of the nine comparisons involving VMF1. For ERA5, significant differences were identified in six of the nine GMF–NMF comparisons and in seven of the nine comparisons involving VMF1. However, the direction of the statistically significant differences varied according to the station, year, and reference dataset. Therefore, the Wilcoxon results indicate that differences among the mapping functions were statistically detectable under several analyzed conditions, but they do not support a consistent ranking of the three functions across all comparisons Table 11.
Table 11.
Summary of the overlap between the 95% moving-block bootstrap confidence intervals for RMSE. Values indicate the number of station–year combinations with overlapping confidence intervals out of the nine combinations evaluated for each reference dataset.
The moving-block bootstrap analysis showed that the degree of overlap between the 95% RMSE confidence intervals varied according to the mapping-function pair and reference dataset. For the radiosonde comparisons, overlapping intervals were observed in six of the nine station–year combinations for each pair of mapping functions. For ERA5, overlap occurred in four of the nine GMF–NMF and GMF–VMF1 comparisons and in six of the nine NMF–VMF1 comparisons. These results indicate that the separation among the RMSE estimates was not consistent across all stations, years, and reference datasets.
Taken together, the bootstrap confidence intervals and Wilcoxon tests indicate that the relative performance of GMF, NMF, and VMF1 varied among stations, years, and validation datasets. Although statistically significant differences were observed under several conditions, no single mapping function consistently produced the lowest errors across all analyzed conditions.
4. Discussion
The GPS-derived PWV estimates obtained from GAMIT processing at stations COL2, PENA, and TECO exhibit a well-defined seasonal cycle during the 2009–2011 period, characterized by minimum values during winter and maximum values during summer, consistent with the climatic conditions of the Mexican Pacific region. This seasonal behavior agrees with previous studies that relate PWV variability to seasonal changes in atmospheric temperature and moisture content [38,39].
The comparison with radiosonde observations and ERA5 reanalysis demonstrates that GPS-derived PWV successfully reproduces the temporal evolution of atmospheric water vapor. Although high correlations were obtained for all stations, systematic differences in PWV magnitude were observed, particularly for COL2 and PENA. These discrepancies are mainly attributed to differences in the spatial representativeness of the atmospheric column sampled by the GPS stations and the reference observations. Because PWV represents the vertically integrated atmospheric water vapor content, differences in horizontal distance and station elevation affect the comparability between GPS-derived and reference PWV estimates.
Although ERA5 provides a spatially and temporally consistent reference dataset, it represents atmospheric conditions averaged within grid cells of approximately 0.25° × 0.25° rather than point-scale observations. Consequently, differences between ERA5-derived and GPS-derived PWV may partly reflect the spatial averaging inherent to the reanalysis product, particularly in regions characterized by complex topography and strong atmospheric gradients such as southwestern Mexico. Furthermore, differences between the mean elevation represented by the ERA5 grid cell and the GPS station elevations may contribute to discrepancies in the integrated atmospheric water vapor. Therefore, the agreement between GPS-derived PWV and ERA5 should be interpreted considering both the representativeness of the reanalysis product and the local characteristics of the observation sites.
Among the analyzed stations, TECO consistently exhibited the closest agreement with both radiosonde observations and ERA5, with RMSE values of approximately 3–5 mm and the highest correlation coefficients. In contrast, PENA presented the largest discrepancies, primarily because of its substantial elevation difference relative to the Manzanillo radiosonde station (approximately 1488 m), while COL2 showed intermediate performance. These results further support the importance of spatial representativeness when validating GPS-derived PWV, particularly in regions characterized by complex terrain and strong atmospheric variability.
Although a height correction could potentially reduce part of the discrepancies associated with the elevation differences between the GPS stations and the radiosonde site, such a correction was not applied in this study. Consequently, part of the larger RMSE and BIAS values observed at PENA, and to a lesser extent at COL2, are likely associated with differences in the sampled atmospheric column arising from the substantial elevation differences and horizontal separation between the GPS stations and the radiosonde site, rather than exclusively with the evaluated mapping functions. The implementation of a height correction requires assumptions regarding the vertical distribution of atmospheric water vapor, temperature lapse rates, and the representativeness of meteorological parameters between observation sites. In tropical regions characterized by complex topography and strong atmospheric variability, these assumptions may introduce additional uncertainties. Therefore, the present study focused on the direct comparison between GPS-derived PWV and independent reference datasets in order to evaluate the relative performance of the mapping functions under operational conditions. Future studies should investigate the potential benefits of applying height-corrected PWV comparisons using local meteorological observations or higher-resolution atmospheric products.
The comparison of the evaluated mapping functions revealed differences in their performance under the processing strategy adopted in this study. Although GMF and NMF frequently exhibited lower RMSE values and high correlations with both radiosonde observations and ERA5, their relative performance varied according to the station, study year, and reference dataset. Table 9 further demonstrates that no single mapping function consistently outperformed the others across all analyzed conditions. This interpretation is reinforced by the statistical analyses presented in Section Statistical Comparison of Mapping-Function Performance. Pairwise Wilcoxon signed-rank tests identified statistically significant differences for several station–year combinations; however, the direction of these differences varied among stations, years, and reference datasets. Likewise, the moving-block bootstrap analysis showed overlapping 95% confidence intervals for RMSE in multiple comparisons, indicating that the observed differences were frequently too small to clearly distinguish the mapping functions when sampling uncertainty was taken into account. Taken together, these statistical results indicate that the relative performance of the evaluated mapping functions depends on the processing configuration, atmospheric conditions, and the spatial representativeness of the reference observations rather than supporting a universal ranking of mapping-function performance. Although VMF1 is based on atmospheric fields derived from ECMWF numerical weather models and ray-tracing techniques, its expected advantage was not consistently reflected in the present dataset under the analyzed conditions.
The reduced consistency observed for VMF1 requires further investigation. Following the reviewer’s recommendation, the complete processing strategy, including the GAMIT/GLOBK configuration, the VMF1 coefficient files, and the processing parameters adopted for all mapping-function solutions, was carefully re-examined. No inconsistencies were identified, and the same processing strategy was confirmed for GMF, NMF, and VMF1, with the tropospheric mapping function being the only parameter modified among the three solutions. Although regional atmospheric variability, complex topography, and the representation of atmospheric conditions may contribute to the observed differences, the present analysis does not allow these factors to be isolated. Therefore, the origin of the larger discrepancies observed for VMF1 remains uncertain and should be investigated in future studies. Consequently, the present results should be interpreted with caution and are representative only of the analyzed stations, the 2009–2011 study period, and the adopted processing strategy.
Additional uncertainties arise from the estimation of the surface pressure () and weighted mean atmospheric temperature (), which are required to convert ZTD into PWV. Because in situ meteorological observations were unavailable, these parameters were obtained using the empirical GPT model implemented through the GAMIT/GLOBK metutil utility. Although GPT has been widely adopted in geodetic and GNSS meteorology applications, its empirical formulation does not explicitly reproduce short-term atmospheric pressure variability, and its accuracy may decrease in regions characterized by strong topographic gradients and large elevation differences. Nevertheless, the same meteorological model, including the default relative humidity adopted by GAMIT/GLOBK, was consistently applied throughout all processing solutions, ensuring that any uncertainty associated with the meteorological inputs affected all evaluated mapping functions in the same manner. Therefore, the comparative assessment among GMF, NMF, and VMF1 was performed under an identical meteorological framework, allowing the influence of the mapping functions to be evaluated consistently. Furthermore, ERA5 was intentionally reserved as an independent dataset for validation; therefore, ERA5-derived surface pressure was not incorporated into the PWV retrieval in order to preserve the independence of the validation procedure. Consequently, part of the discrepancies observed, particularly at PENA, may be associated with uncertainties in the atmospheric parameters used during PWV retrieval. A comprehensive sensitivity analysis using meteorological parameters derived from ERA5 profiles or radiosonde observations would provide additional insight into this issue; however, such an analysis is beyond the scope of the present study and should be addressed in future investigations.
Another potential source of uncertainty is associated with the radiosonde observations from station 76654 operated by the Mexican National Meteorological Service (SMN-CONAGUA). Detailed metadata describing the radiosonde models and humidity sensor characteristics used during the study period were unavailable, preventing an assessment of possible instrumental dry or wet biases reported for some radiosonde systems. Consequently, part of the observed discrepancies between GPS-derived and radiosonde PWV may originate from instrumental effects rather than from the GPS estimates themselves. The inclusion of ERA5 as an independent validation dataset strengthens the reliability of the overall interpretation by providing an additional reference independent of the radiosonde measurements.
Finally, the relationship observed between GPS-derived PWV and precipitation highlights the capability of GNSS observations to characterize regional atmospheric moisture variability. Increases in PWV generally preceded or accompanied periods of enhanced precipitation, supporting previous studies that reported temporal lags between maximum atmospheric water vapor content and rainfall occurrence [40]. These findings further support the potential of GPS-derived PWV as a complementary tool for atmospheric monitoring and for improving the understanding of hydrometeorological processes in tropical regions frequently affected by severe weather events.
5. Conclusions
This study evaluated the performance of three tropospheric mapping functions (GMF, NMF, and VMF1) for estimating GPS-derived precipitable water vapor (PWV) in southwestern Mexico using continuous GPS observations collected during the 2009–2011 period. The results show that GPS-derived PWV successfully reproduced the seasonal evolution of atmospheric water vapor, with minimum values during the dry season and maximum values during the summer rainy season, consistent with the regional climatic regime.
Validation against independent radiosonde observations and ERA5 reanalysis demonstrated that GPS-derived PWV provides a reliable representation of atmospheric water vapor variability. However, the level of agreement depended on the spatial representativeness of the reference datasets. Stations with smaller horizontal and vertical differences relative to the reference observations, particularly TECO, exhibited the highest correlations together with the lowest RMSE and BIAS values, whereas larger discrepancies were observed at stations located at higher elevations or farther from the radiosonde site.
Among the evaluated mapping functions, GMF and NMF generally yielded lower RMSE and BIAS values and more consistent performance under the adopted processing strategy. However, the best-performing mapping function varied depending on the station, study year, and reference dataset, indicating that no single mapping function consistently outperformed the others. These findings are specific to the analyzed stations, the 2009–2011 study period, and the adopted processing strategy, and therefore should not be interpreted as a general ranking of mapping-function performance.
The comparison between GPS-derived PWV and precipitation records showed that increases in atmospheric water vapor generally preceded or accompanied periods of enhanced rainfall activity. Nevertheless, this comparison was intended only as a qualitative assessment of seasonal variability and should not be interpreted as establishing predictive relationships or precipitation thresholds.
Overall, this study highlights the importance of considering spatial representativeness, elevation differences, and processing strategy when validating GPS-derived PWV products in tropical regions characterized by complex topography. The results contribute to the limited body of knowledge available for southwestern Mexico and provide a useful reference for future GNSS meteorology studies in similar environments. At the same time, the observed differences among the evaluated mapping functions indicate that PWV retrievals should be interpreted considering the selected processing configuration together with the representativeness of the reference datasets. Future work should incorporate denser GNSS and meteorological observation networks, together with higher-resolution atmospheric products and additional sensitivity analyses of meteorological inputs, to further improve PWV estimation and atmospheric monitoring.
Author Contributions
Conceptualization, L.G.S.-S., R.R.-A., A.I.V.-V. and E.Á.-A.; methodology, L.G.S.-S.; software, R.R.-A.; validation, N.B.-P., E.Á.-A.; formal analysis, A.I.V.-V.; investigation, L.G.S.-S., R.R.-A., A.I.V.-V. and E.Á.-A.; resources, R.R.-A.; data curation, N.B.-P., R.R.-A.; writing—original draft preparation, R.R.-A.; writing—review and editing, L.G.S.-S.; visualization, L.G.S.-S.; supervision, A.I.V.-V. and E.Á.-A.; project administration, R.R.-A.; funding acquisition, R.R.-A. All authors have read and agreed to the published version of the manuscript.
Funding
This research was funded by SECIHTI through a master’s scholarship under CVU number 2044887.
Data Availability Statement
All data used in this study are publicly available through the institutions and repositories cited throughout this manuscript.
Acknowledgments
The authors also acknowledge the institutions that provide open-access data used in this study, which made this research possible.
Conflicts of Interest
The authors declare no conflicts of interest.
References
- Bevis, M.; Businger, S.; Herring, T.A.; Rocken, C.; Anthes, R.A.; Ware, R.H. GPS meteorology: Remote sensing of atmospheric water vapor using the global positioning system. J. Geophys. Res. 1992, 97, 15787–15801. [Google Scholar] [CrossRef] [Scilit]
- Bevis, M.; Businger, S.; Chiswell, S.; Herring, T.A.; Anthes, R.A.; Rocken, C.; Ware, R.H. GPS Meteorology: Mapping Zenith Wet Delays onto Precipitable Water. J. Appl. Meteorol. 1994, 33, 379–386. [Google Scholar] [CrossRef] [Scilit]
- Jadala, N.B.; Sridhar, M.; Ratnam, D.V.; Tummala, S.N.M. Ensemble based deep learning model for prediction of integrated water vapor (IWV) using GPS and meteorological observations. J. Appl. Geod. 2024, 18, 253–265. [Google Scholar] [CrossRef] [Scilit]
- Rocken, C.; Ware, R.; Van Hove, T.; Solheim, F.; Alber, C.; Johnson, J.; Bevis, M.; Businger, S. Sensing atmospheric water vapor with the global positioning system. Geophys. Res. Lett. 1993, 20, 2631–2634. [Google Scholar] [CrossRef] [Scilit]
- Vázquez, G.E.; Grejner-Brzezinska, D.A. GPS-PWV estimation and validation with radiosonde data and numerical weather prediction model in Antarctica. GPS Solut. 2013, 17, 29–39. [Google Scholar] [CrossRef] [Scilit]
- Mackern, M.V.; Rosell, P.A.; Mateo, M.L.; Camisay, M.F. Contribuciones desde la Geodesia al estudio de tormentas severas. Rev. Geod. 2024, 122, 118–122. [Google Scholar]
- Retegui Schiettekatte, L.; Selmira Garrido, M.; Clara de Lacy, M. Use of GPS and ERA5 precipitable water vapor based standardized precipitation conversion index for drought monitoring in the Mediterranean coast: A first case study in Southern Spain. Adv. Space Res. 2023, 72, 3946–3959. [Google Scholar] [CrossRef] [Scilit]
- Drissi El Bouzaidi, R.; El Talibi, H.; El Moussaoui, S.; Mourabit, T. Estimating atmospheric precipitable water vapor in northern Morocco: A ground-based GPS approach. Sci. Afr. 2025, 28, e02681. [Google Scholar] [CrossRef] [Scilit]
- Gong, Y.; Liu, Z.; Chan, P.W.; Hon, K.K. Assimilating GPS PWV and radiosonde meteorological profiles to improve the PWV and rainfall forecasting performance from the Weather Research and Forecasting (WRF) model over South China. Atmos. Res. 2023, 286, 106677. [Google Scholar] [CrossRef] [Scilit]
- Krietemeyer, A.; van der Marel, H.; van de Giesen, N.; Ten Veldhuis, M.C. A field calibration solution to achieve high-grade-level performance for low-cost dual-frequency GPS receiver and antennas. Sensors 2022, 22, 2267. [Google Scholar] [CrossRef] [Scilit] [PubMed]
- Pérez, V.C.; Valecillos, D.; Alvarado, J.; Wildermann, E.; Orozco, G.R. Estimando el retardo troposférico sobre estaciones GPS de operación continua en Venezuela mediante observaciones satelitales GLONASS. Rev. Mapp. 2017, 26, 36–46. [Google Scholar]
- Cioce, V.; Hoyer, M.; Wildermann, E.; Royero, G.; Díaz, A. Determinación del vapor de agua troposférico a través de observaciones GPS: Primeros ensayos en Venezuela. Interciencia 2011, 36, 721–730. [Google Scholar]
- Landskron, D.; Böhm, J. VMF3/GPT3: Refined discrete and empirical troposphere mapping functions. J. Geod. 2018, 92, 349–360. [Google Scholar] [CrossRef] [Scilit] [PubMed]
- Xu, Y.; Yang, Z.; Zhou, H.; Zhang, F. An initial investigation of the non-isotropic feature of GNSS tropospheric delay. Satell. Navig. 2024, 5, 2. [Google Scholar] [CrossRef] [Scilit]
- Kursinski, E.R.; Bennett, R.A.; Gochis, D.; Gutman, S.I.; Holub, K.L.; Mastaler, R.; Minjarez Sosa, C.; Minjarez Sosa, I.; van Hove, T. Water vapor and surface observations in northwestern Mexico during the 2004 NAME Enhanced Observing Period. Geophys. Res. Lett. 2008, 35, L03815. [Google Scholar] [CrossRef] [Scilit]
- Serra, Y.L.; Adams, D.K.; Minjarez-Sosa, C.; Moker, J.M., Jr.; Arellano, A.F.; Castro, C.L.; Quintanar, A.I.; Alatorre, L.; Granados, A.; Vázquez, G.E.; et al. The North American Monsoon GPS Transect Experiment 2013. Bull. Am. Meteorol. Soc. 2016, 97, 2103–2115. [Google Scholar] [CrossRef] [Scilit]
- Adams, D.K.; Vivoni, E.R.; Lintner, B.R.; Minjarez-Sosa, C.; Serra, Y.L.; Granados, A.; Arellano, A.F.; Castro, C.L.; Moker, J.M., Jr.; Salazar-Tlaczani, L. The North American Monsoon GPS Hydrometeorological Network 2017. In Proceedings of the 98th American Meteorological Society Annual Meeting, Austin, TX, USA, 7–11 January 2018. Abstract 892. [Google Scholar]
- Risanto, C.B.; Castro, C.L.; Arellano, A.F., Jr.; Moker, J.M., Jr.; Adams, D.K. The Impact of Assimilating GPS Precipitable Water Vapor in Convective-Permitting WRF-ARW on North American Monsoon Precipitation Forecasts over Northwest Mexico. Mon. Weather Rev. 2021, 149, 3013–3041. [Google Scholar] [CrossRef] [Scilit]
- Ochoa-Moya, C.A.; Cala-Pérez, Y.A.; Díaz-Esteban, Y.; Castro, C.L.; Ordoñez-Peréz, P.; Quintanar, A.I. Climatological large-scale circulation patterns over the Middle Americas Region. Atmosphere 2020, 11, 745. [Google Scholar] [CrossRef] [Scilit]
- Ritchie, E.A.; Holland, G.J. Large-scale patterns associated with tropical cyclogenesis in the Western Pacific. Mon. Weather Rev. 1999, 127, 2027–2043. [Google Scholar] [CrossRef]
- Kawamoto, S.; Takamatsu, N.; Abe, S. RINGO: A RINEX pre-processing software for multi-GPS data. Earth Planets Space 2023, 75, 54. [Google Scholar] [CrossRef] [Scilit]
- Herring, T.A.; King, R.W.; McClusky, S.C. Introduction to GAMIT/GLOBK; Massachusetts Institute of Technology: Cambridge, MA, USA, 2010. [Google Scholar]
- Kouba, J. A Guide to Using International GPS Service (IGS) Products; International GPS Service: Pasadena, CA, USA; Available online: https://kb.igs.org/hc/en-us/articles/201271873-A-Guide-to-Using-the-IGS-Products (accessed on 20 July 2025).
- Tang, W.; Liao, M.; Zhang, L.; Li, W.; Yu, W. High-spatial-resolution mapping of precipitable water vapour using SAR interferograms, GPS observations and ERA-Interim reanalysis. Atmos. Meas. Tech. 2016, 9, 4487–4501. [Google Scholar] [CrossRef] [Scilit]
- Saastamoinen, J. Atmospheric correction for the troposphere and stratosphere in radio ranging satellites. In The Use of Artificial Satellites for Geodesy; Henriksen, S.W., Mancini, A., Chovitz, B.H., Eds.; American Geophysical Union: Washington, DC, USA, 1972; pp. 247–251. [Google Scholar]
- Böhm, J.; Heinkelmann, R.; Schuh, H. Short note: A global model of pressure and temperature for geodetic applications. J. Geod. 2007, 81, 679–683. [Google Scholar] [CrossRef] [Scilit]
- Lyard, F.; Lefevre, F.; Letellier, T.; Francis, O. Modelling the global ocean tides: Insights from FES2004. Ocean Dyn. 2006, 56, 394–415. [Google Scholar] [CrossRef] [Scilit]
- Carrère, L.; Lyard, F.; Cancet, M.; Guillot, A.; Picot, N. Finite Element Solution FES2014, a new tidal model: Validation results and perspectives for improvements. In Proceedings of the ESA Living Planet Conference, Prague, Czech Republic, 9–13 May 2016. [Google Scholar]
- Dawson, J.; Govind, R.; Manning, J. Application of the AUSLIG online GPS processing system (AUSPOS) to Antarctica. In Proceedings of SatNav 2001; The Australian Surveyors Congress: Canberra, Australia, 2001. [Google Scholar]
- Jiang, P.; Ye, S.; Chen, D.; Liu, Y.; Xia, P. Retrieving precipitable water vapor data using GPS zenith delays and global reanalysis data in China. Remote Sens. 2016, 8, 389. [Google Scholar] [CrossRef] [Scilit]
- Boehm, J.; Niell, A.; Tregoning, P.; Schuh, H. Global Mapping Function (GMF): A new empirical mapping function based on numerical weather model data. Geophys. Res. Lett. 2006, 33, 3–6. [Google Scholar] [CrossRef] [Scilit]
- Boehm, J.; Schuh, H. Vienna mapping functions in VLBI analyses. Geophys. Res. Lett. 2004, 31, 2–5. [Google Scholar] [CrossRef] [Scilit]
- Niell, A.E. Global mapping functions for the atmosphere delay at radio wavelengths. J. Geophys. Res. Solid Earth 1996, 101, 3227–3246. [Google Scholar] [CrossRef] [Scilit]
- Campos-Arias, P.; Esquivel-Hernandez, G.; Moya-Zamora, J.; Sanchez-Murillo, R. GPS Precipitable Water Vapor Estimations over Sounding and Moderate Resolution Imaging. Climate 2019, 7, 63. [Google Scholar] [CrossRef] [Scilit]
- Wu, F.; Zhang, K.; Zhao, J.; Jin, Y.; Li, D. Linear and nonlinear GPS PWV features for heavy rainfall forecasting. Adv. Space Res. 2023, 72, 2170–2184. [Google Scholar] [CrossRef] [Scilit]
- Hersbach, H.; Bell, B.; Berrisford, P.; Hirahara, S.; Horányi, A.; Muñoz-Sabater, J.; Nicolas, J.; Peubey, C.; Radu, R.; Schepers, D.; et al. The ERA5 global reanalysis. Q. J. R. Meteorol. Soc. 2020, 146, 1999–2049. [Google Scholar] [CrossRef] [Scilit]
- Daniel, W.W. Biostatistics: A Foundation for Analysis in the Health Sciences; Limusa Wiley: Mexico City, Mexico, 2013. [Google Scholar]
- Chen, Y.; Wang, G.; Menenti, M. Short-term rainfall forecasting using GPS-derived PWV and ZTD variations: Case studies of four Hong Kong rainstorm events. Adv. Space Res. 2025, 77, 3003–3021. [Google Scholar] [CrossRef] [Scilit]
- Xian, T.; Su, K.; Zhang, J.; Hu, H.; Wang, H. Precipitable water vapor retrieval based on GPS data and its application in extreme rainfall. Remote Sens. 2025, 17, 2301. [Google Scholar] [CrossRef] [Scilit]
- Kawo, A.; Van Malderen, R.; Pottiaux, E.; Van Schaeybroeck, B. Understanding the present-day spatiotemporal variability of precipitable water vapor over Ethiopia: A comparative study between ERA5 and GPS. Remote Sens. 2022, 14, 686. [Google Scholar] [CrossRef] [Scilit]

Disclaimer/Publisher’s Note: The statements, opinions and data contained in all publications are solely those of the individual author(s) and contributor(s) and not of MDPI and/or the editor(s). MDPI and/or the editor(s) disclaim responsibility for any injury to people or property resulting from any ideas, methods, instructions or products referred to in the content. |
© 2026 by the authors. Licensee MDPI, Basel, Switzerland. This article is an open access article distributed under the terms and conditions of the Creative Commons Attribution (CC BY) license.