


Abstract
Terrestrial vegetation cover is a critical component of the global carbon cycle, annually assimilating a substantial fraction of anthropogenic CO2 emissions. However, regional estimates of gross primary production (GPP) and net primary production (NPP) remain insufficiently studied, especially for ecologically sensitive areas such as the sub-Mediterranean landscapes of southeastern Crimea. The aim of this study is to calculate and map the spatio-temporal distribution of GPP and NPP across southeastern Crimea over the period 2001–2025 using Earth remote sensing data and geoinformation modeling. This study employed MODIS products (MOD17A2H collection 061) processed in the Google Earth Engine cloud platform, together with temperature and precipitation data (ClimateEU, CHIRPS). Statistical analysis included calculation of the carbon use efficiency (CUE) coefficient and correlation analysis. The results show that the mean GPP for southeastern Crimea is 1.13 kg C/m2 and the mean NPP is 0.61 kg C/m2, which exceed global average values. Maximum productivity is characteristic of natural forest communities (sessile oak, beech and juniper forests), whereas anthropogenically transformed landscapes (agricultural land, urban coenoses) exhibit the lowest values. The mean CUE is 0.54, with the highest values (0.63–0.66) recorded for agrocoenoses and steppes, and the lowest (0.49–0.57) for forests. A positive correlation between productivity and precipitation and a negative correlation with air temperature were identified, especially for forest ecosystems. This study fills a gap in regional primary productivity assessments and can serve as a basis for ecosystem monitoring under climate change and anthropogenic pressure.
1. Introduction
Terrestrial vegetation cover plays a key role in the global carbon cycle, annually sequestering a substantial proportion of anthropogenic carbon dioxide emissions. Until recently, the ocean was considered the main carbon sink, while the role of terrestrial ecosystems remained unclear and was often referred to as the “missing sink” [1] and studied very little. Interannual variability in vegetation dynamics plays a critical role in describing annual fluctuations in photosynthesis and plant productivity, governing carbon uptake by the soil and ecosystem productivity. In recent years, it has been estimated that terrestrial vegetation cover assimilates approximately 20–30% of anthropogenic CO2 emissions each year [2]. At the same time, in most regions of the world anthropogenic pressure is exerting an increasingly negative impact on ecosystems and landscapes [3,4,5], leading to a reduction in carbon uptake [3]. The authors of [4] highlight the unprecedented nature of human impact on biodiversity worldwide. For instance, as noted in [1], tropical forests in Southeast Asia and a large part of South America have turned from CO2 sinks into sources of this gas because of deforestation and climate change. Over the period from 1850 to 2023, the cumulative amount of carbon taken up by terrestrial ecosystems was 220 ± 60 Gt C, which accounts for about 31% of total anthropogenic emissions over that period [2]. Since the 1970s, anthropogenic pressure has increased sharply, leading to a widespread deterioration in the state of nature; as noted in [5], more than 20% of the original biodiversity has been lost in terrestrial communities worldwide, and rates of degradation are accelerating.
One of the principal carbon fluxes characterizing terrestrial ecosystems and biodiversity is gross primary production (GPP), i.e., the amount of carbon absorbed by vegetation for photosynthesis, since it provides the main inflow of carbon and energy into ecosystems for the production of food, timber and fiber [6]. However, roughly half of gross primary production is expended by plants on respiration to provide energy for their growth and maintenance. Net primary production (NPP) represents the net gain of carbon by vegetation and equals the difference between GPP and autotrophic plant respiration [6,7,8]. Gross primary production reflects the total amount of carbon assimilated during photosynthesis, whereas net primary production is the difference between GPP and autotrophic respiration expenditure and characterizes the increment of organic matter available to heterotrophs and for storage in the ecosystem. These indices are fundamental characteristics of ecosystem functioning; they determine the contribution of ecosystems to biogeochemical cycles, the level of biological diversity and resilience to climate change [7,8]. NPP is recognized as the most significant variable for characterizing the state of ecosystems, because it represents the fundamental source of energy for all organisms in an ecosystem and is the driving force behind the most important ecosystem services [7,8,9].
Traditional methods for estimating primary productivity, based on direct measurements of biomass [10,11], eddy covariance [12,13,14], gas exchange or litterfall accounting [15,16,17], are highly accurate at the local level but are extremely labor-intensive, have limited spatial coverage and are practically inapplicable for regular monitoring of large areas, especially in complex terrain.
Over the past two decades, Earth remote sensing methods combined with geoinformation technologies have become the principal tool for obtaining spatio-temporal datasets on study areas [18,19]. As emphasized in [20], remote sensing data have a higher spatio-temporal coverage compared with traditional field and laboratory research methods and can cover the study area completely in a single acquisition mode. One of the most widely used remote sensing products for regional and global GPP and NPP assessments is data from MODIS satellite imagery. In [21,22], a new vegetation index based on the radial basis function (RBF)—kNDVI—is used to estimate NPP, which reduces the saturation effect and improves estimation accuracy compared with the traditional NDVI. In [23], forecasting of gross primary productivity (GPP) on the Tibetan Plateau under climate change was performed using convolutional neural networks (CNNs). At the same time, numerous studies have addressed GPP and NPP at the global scale, yet such research remains insufficient at the regional level. Martínez et al. [9] note that a full description of the carbon cycle requires detailed information on the spatio-temporal patterns of carbon fluxes between the Earth’s surface and the atmosphere. Zhang et al. [23] point out that, as a key component of the terrestrial carbon cycle, net primary productivity not only determines the carbon sequestration potential of ecosystems but also significantly influences critical ecosystem services such as climate regulation, soil and water conservation, and the maintenance of biodiversity through energy flow and nutrient cycling [23].
Southeastern Crimea, as low mountain sub-Mediterranean forest landscapes located at the edge of their distribution range, remain insufficiently studied, and systematic calculations of gross and net primary production of the vegetation cover of southeastern Crimea using modern satellite data and regionally adapted models have so far been fragmentary.
The aim of this study is to calculate and map the spatio-temporal distribution of gross and net primary production of vegetation cover across southeastern Crimea over the period 2001–2025 using Earth remote sensing methods and geoinformation modeling.
2. Materials and Methods
2.1. Study Area
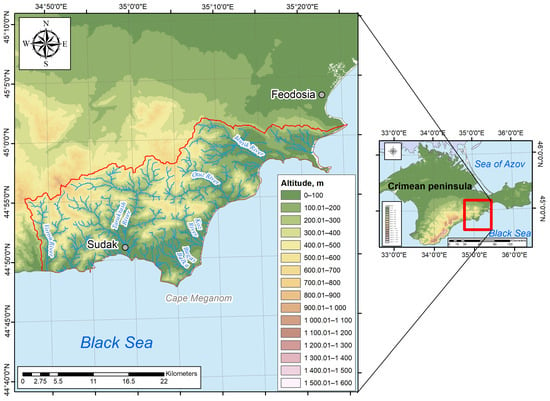
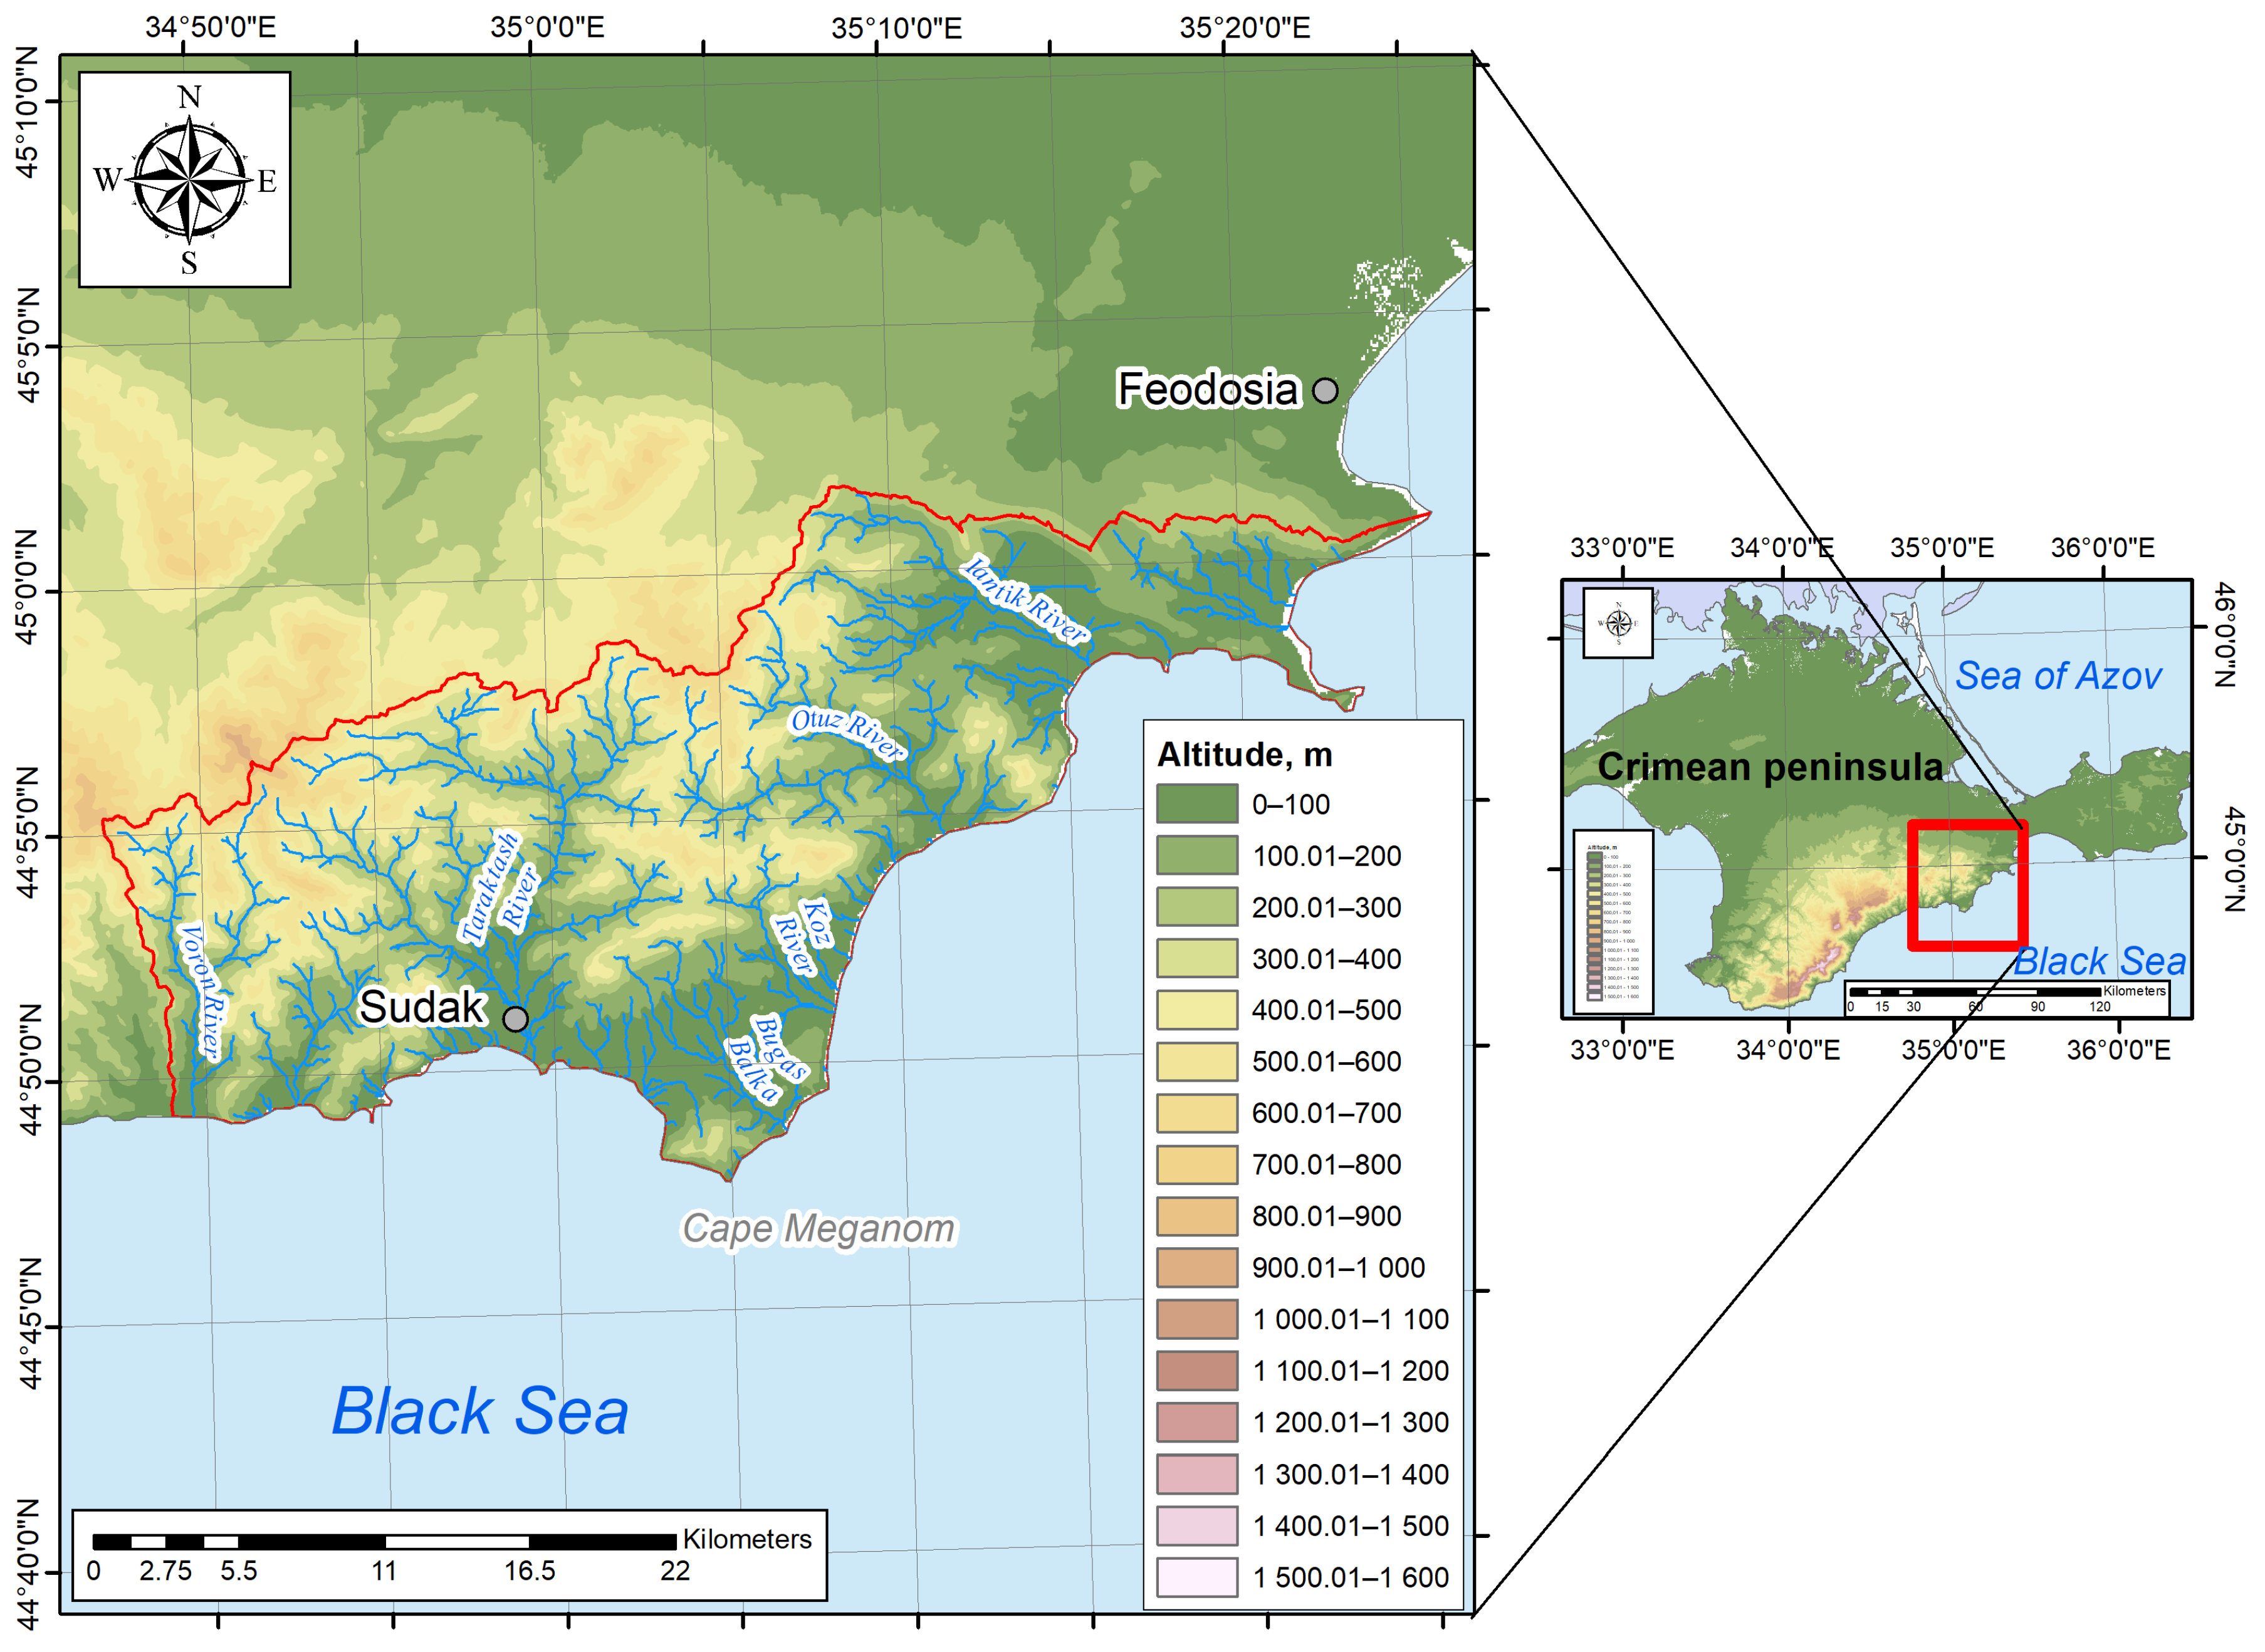
The study area is located in the southeastern part of the Crimean Peninsula (Figure 1). The boundaries of the area are given according to [24]. The area covers 567.8 km2, and the perimeter length is 164.2 km. To the north of Southeastern Crimea lie the spurs of the Crimean Mountains, which gradually transition into the Syvash Lowland; to the east are the Crimean Mountains; to the east lie the Feodosia Gulf and the adjacent plains. A substantial influence is also exerted by the Black Sea to the south, where the length of the coastline reaches 79.8 km.
Figure 1.
Geographical location of the study area.
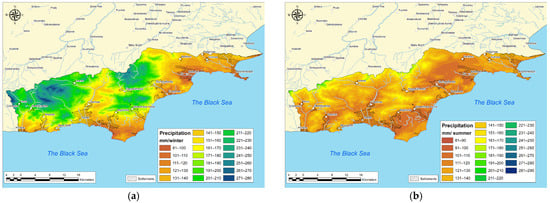
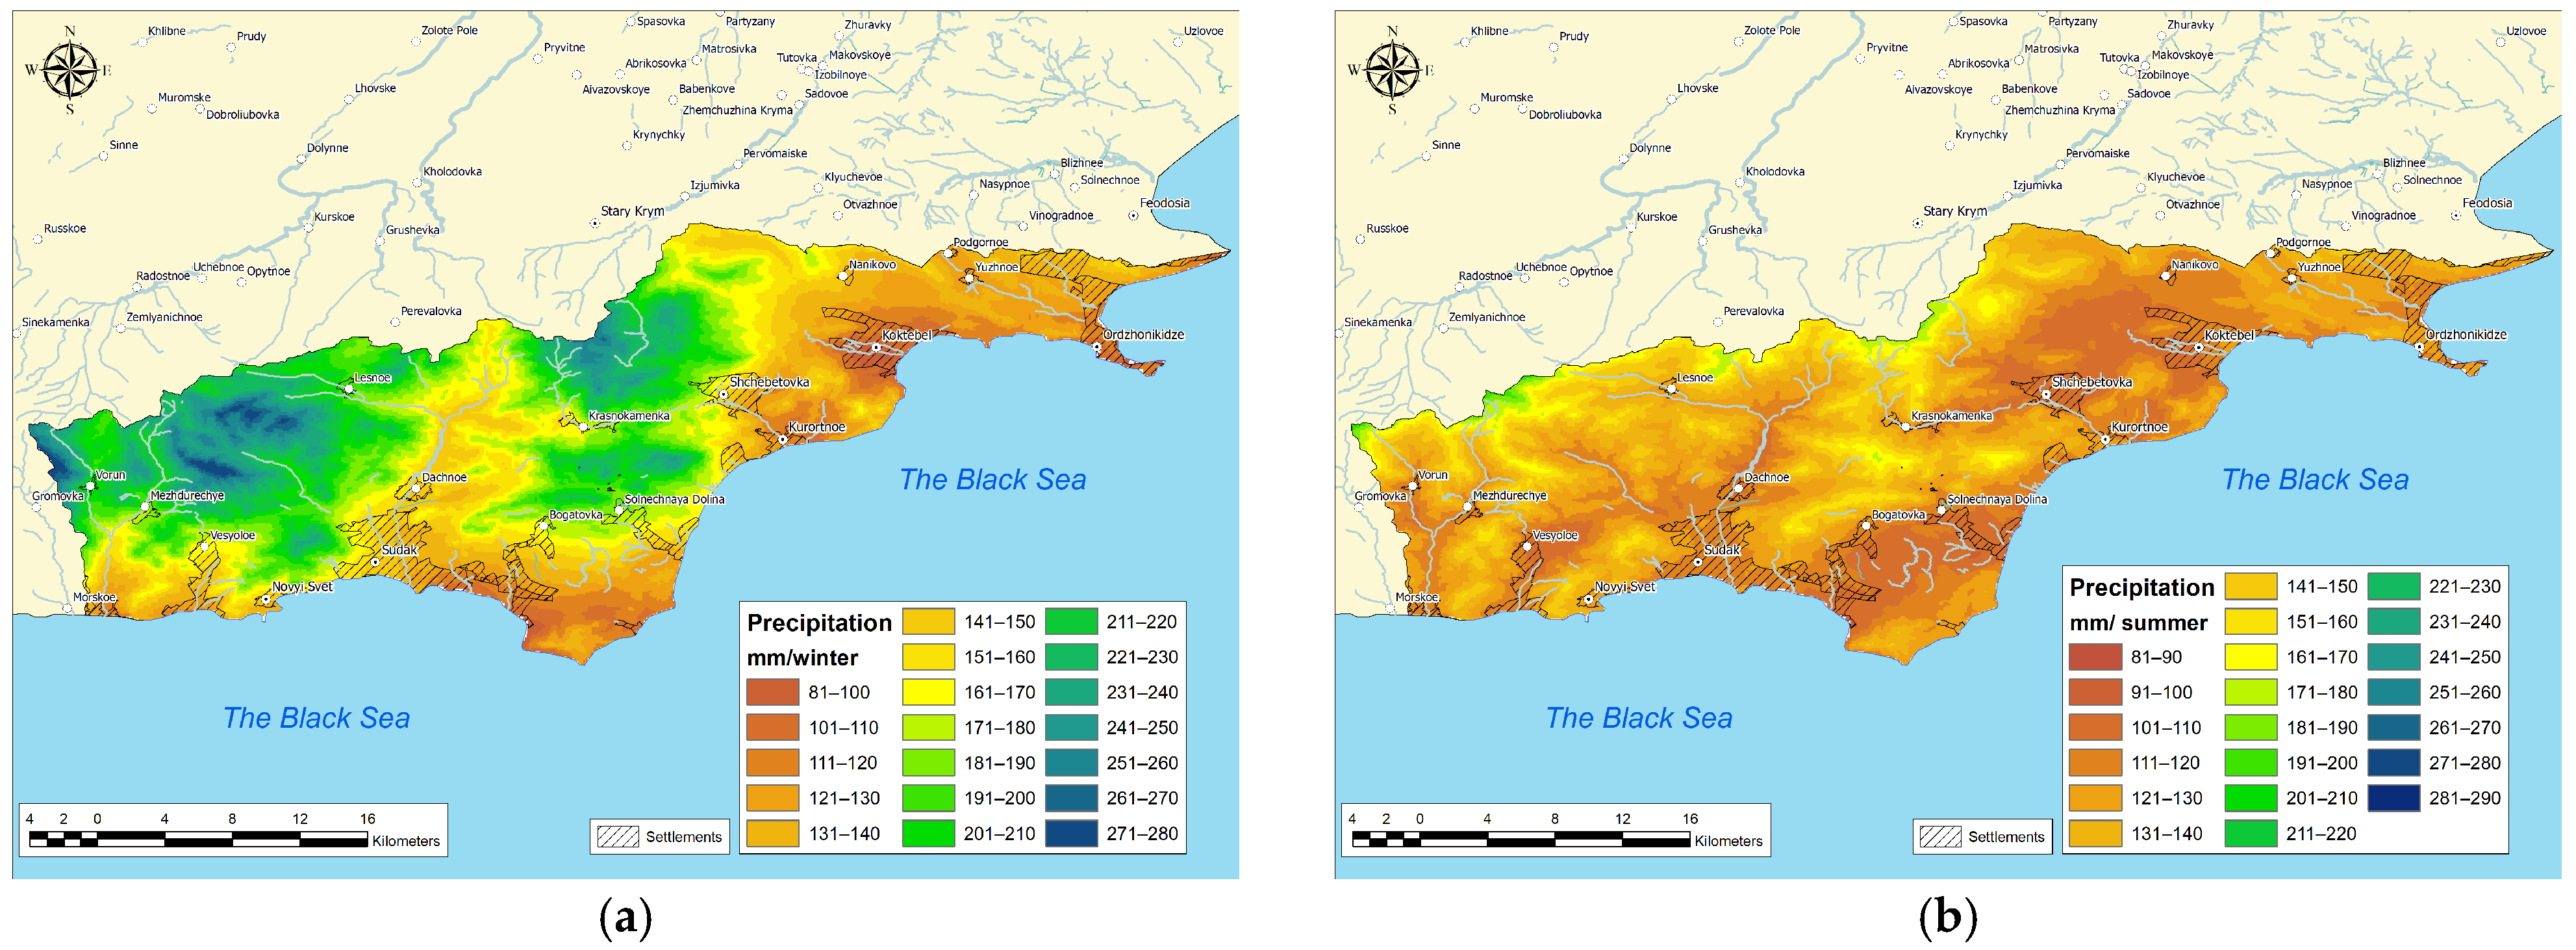
According to [25], winter precipitation in southeastern Crimea ranges from 150 to 400 mm, with the highest amounts occurring in the northwestern part of the study area, and the precipitation field decreasing from west to east. In summer, precipitation over the territory of southeastern Crimea ranges from 300 to 150 mm, with the precipitation field decreasing from northwest to southeast. In both winter and summer, the driest areas are the coastal parts of the territory of southeastern Crimea (Figure 2). The annual precipitation distribution varies from 700 to 350 mm in the west-to-east and northwest-to-northeast directions.
Figure 2.
Average annual precipitation in the southeastern Crimea for the winter (a) and summer (b) periods, mm.
The distribution of climatic factor fields influences the formation of vegetation cover. In the most elevated parts of southeastern Crimea, where the highest precipitation amounts and lower temperatures prevail, and hornbeam and beech forests are predominantly developed. As precipitation decreases, woody vegetation is gradually replaced by shrub and steppe communities. Oak «shibliak» (shrub oak) thickets and fescue steppes are characteristic of areas receiving the lowest precipitation amounts.
2.2. Data and Research Methodology
The parameters selected for analysis were gross primary production (GPP), which characterizes the total flux of carbon dioxide assimilated by vegetation during photosynthesis, and net primary production (NPP), which represents the difference between GPP and autotrophic respiration. This study used the MODIS collection 061 product MOD17A3HGF.061 [26,27] with 8-day composite images of gross primary production (GPP) for the period 2001–2025. The spatial resolution of the data used is 500 m. The product has undergone atmospheric correction and cloud filtering. The raw pixel values are provided in integer format; to convert to physical units, the scaling factor for MOD17A3HGF.061, 0.0001 (kg C·m−2·(8 d)−1), was applied.
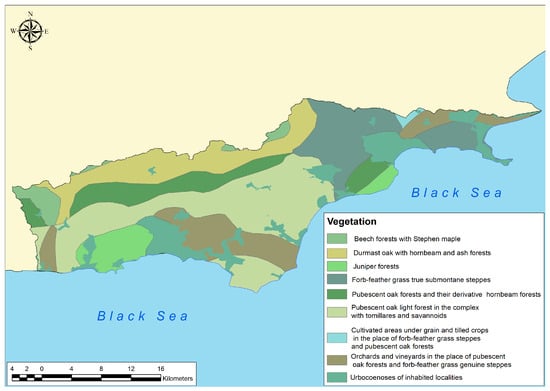
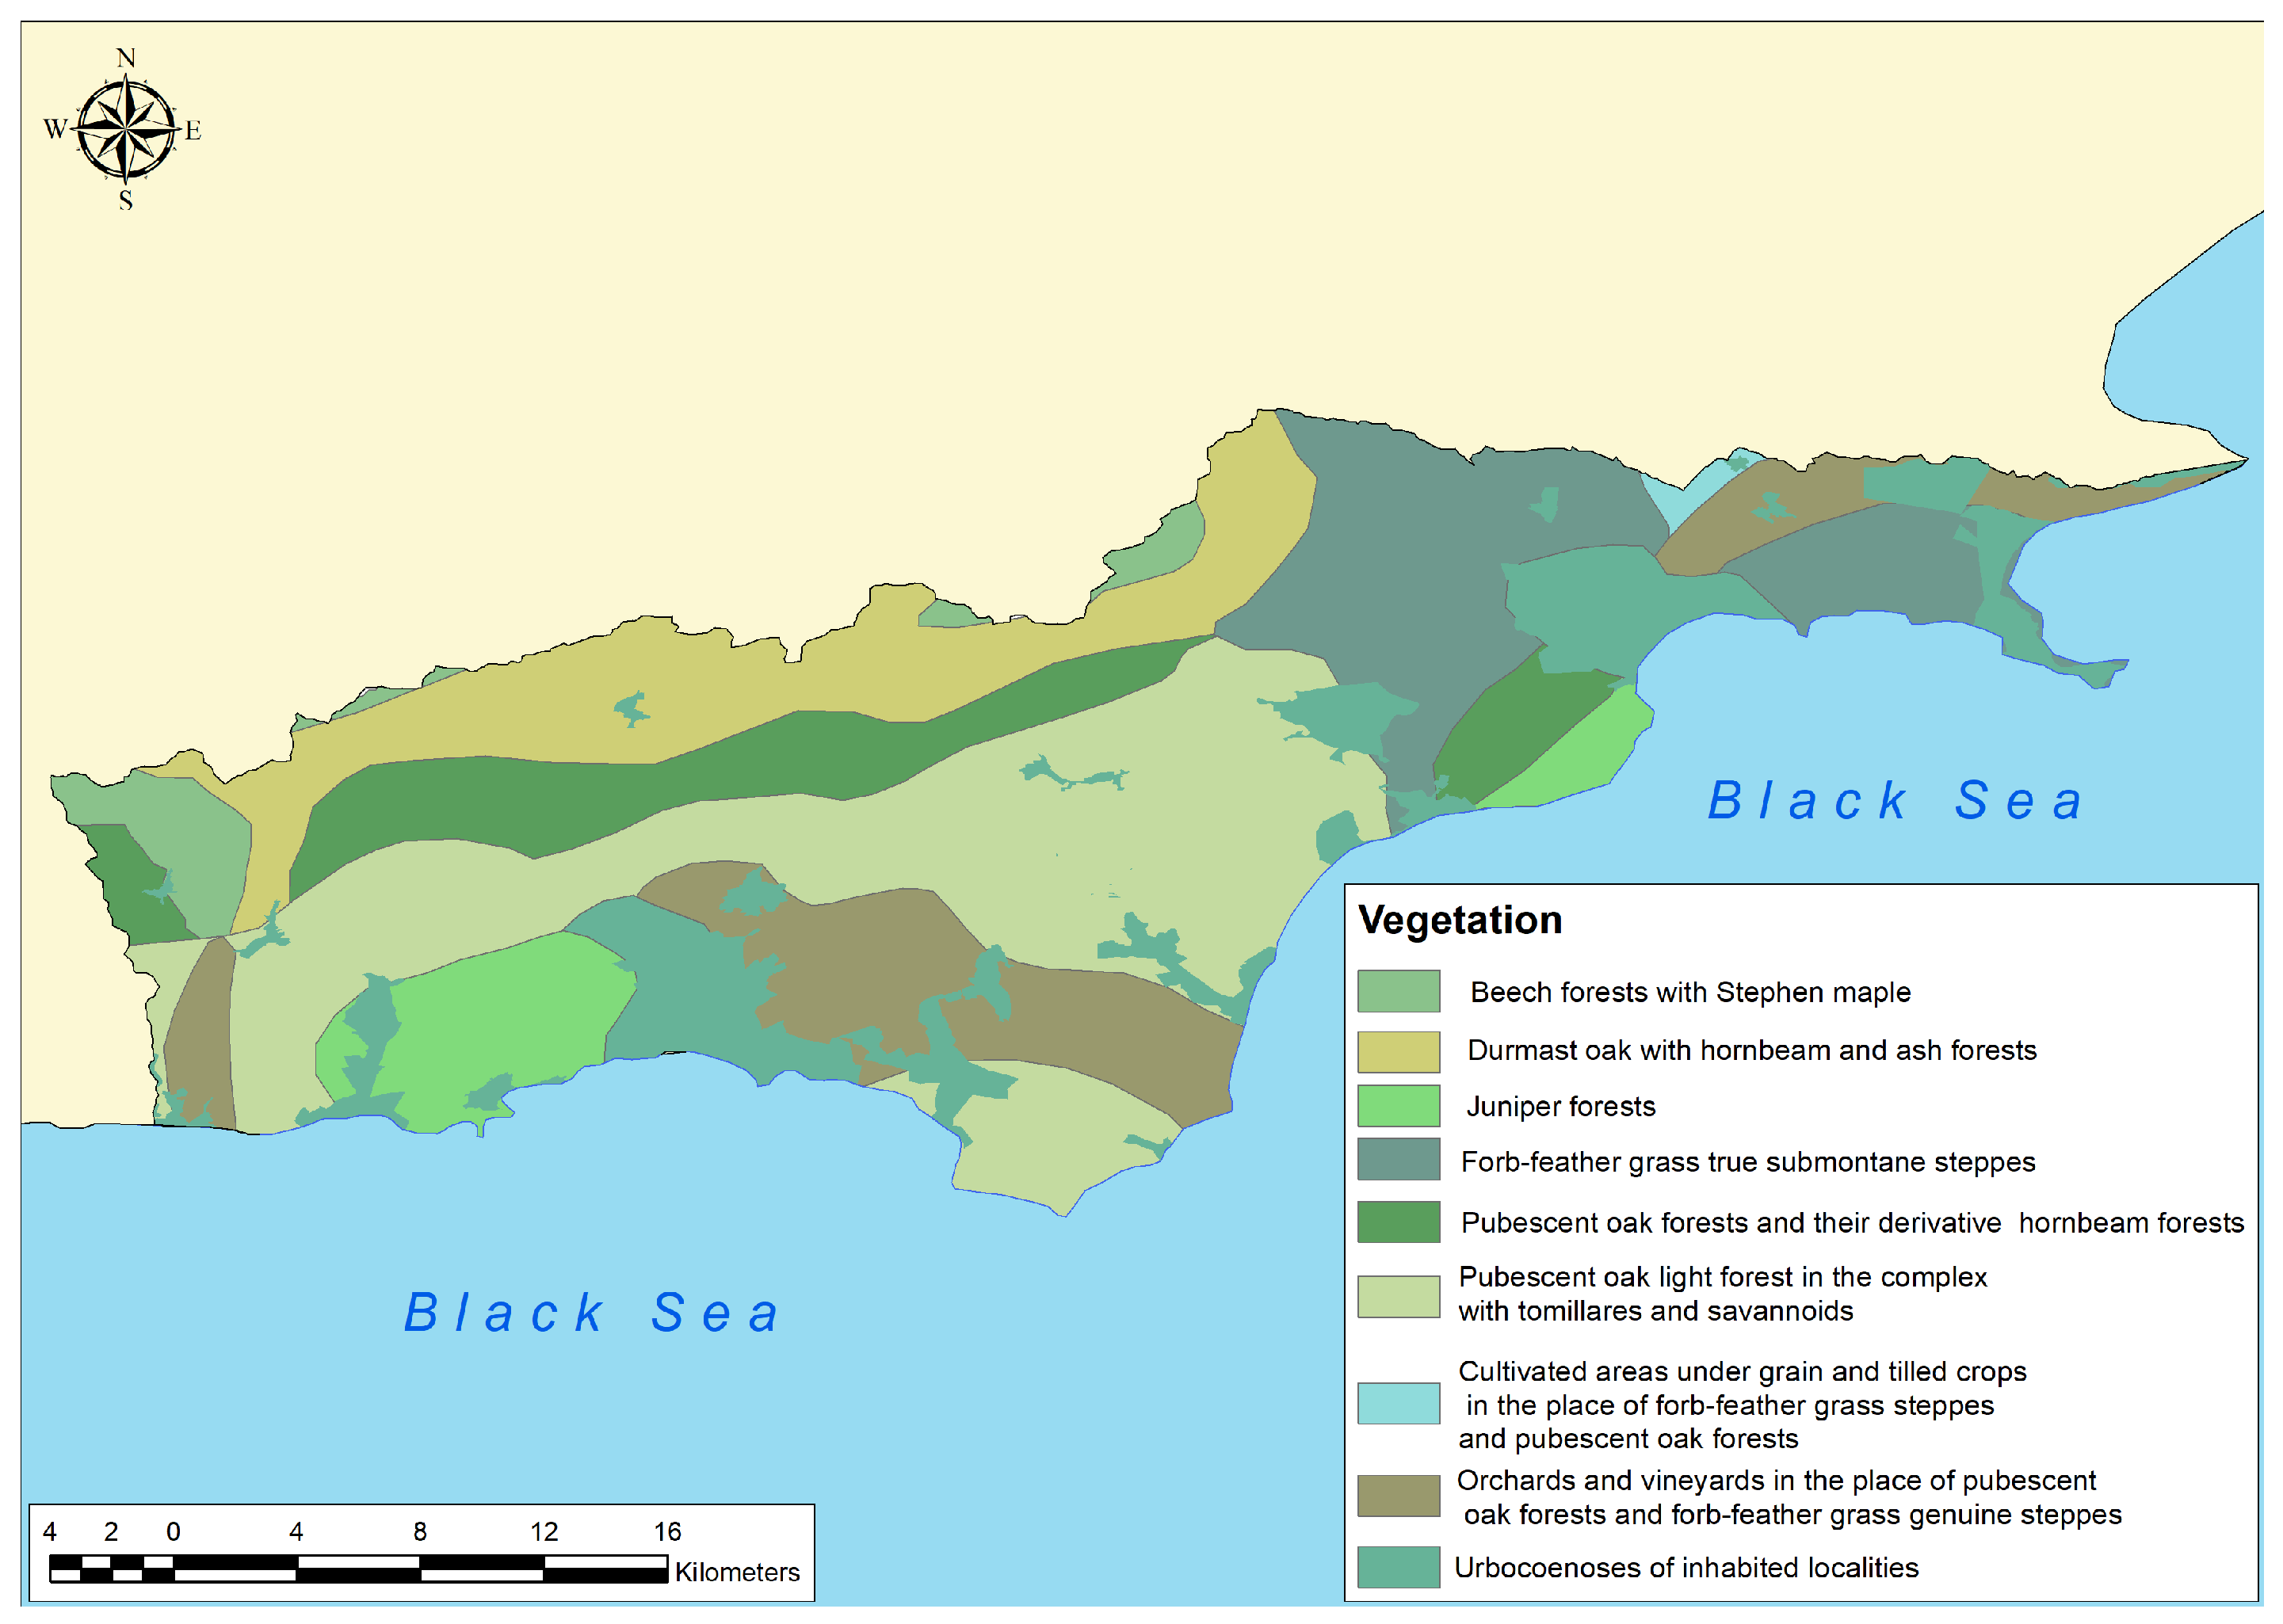
Data processing was performed in the cloud-based geoinformation platform Google Earth Engine (GEE) using JavaScript API. The main steps included: spatial filtering to the boundaries of the study area (roi, according to [18]), temporal filtering for the specified intervals, application of the scaling factor, image clipping, visual inspection, and export of the results to Google Drive in GeoTIFF format with the EPSG:4326 projection and 500 m resolution. As a result, raster datasets were obtained for southeastern Crimea. Raster processing was carried out using the ArcGIS 10.8 and R Studio v. 2026.07.0 software packages. Map production was performed in ArcGIS 10.8 (Esri, Redlands, CA, USA). RStudio/RStudio Desktop (Posit PBC [formerly RStudio, PBC], Boston, MA, USA) was used for statistical analysis. The pixels in the image that contain no data or have outliers (artifacts of maximum values) were excluded from the study by assigning “NA” values to the cells in the raster. Data on the vegetation cover of southeastern Crimea were obtained from [24] and are presented in Figure 3. According to [24], the spatial distribution of vegetation in the study region is influenced by altitudinal zonation. The altitudinal zones do not form uninterrupted belts and are disrupted by a number of local orographic factors. With decreasing absolute altitude from north to south, the following types successively replace one another: beech forests with an admixture of Stephen’s maple, durmast oak forests with an admixture of hornbeam and ash forests, pubescent oak forests, open woodlands of pubescent oak in a complex with tomillares and savannoids, and forb–feather grass true steppes of the foothills of the Crimean Mountains. In the flattest areas and in the lower part adjacent to the sea, southeastern Crimea contains agricultural lands occupied by orchards, vineyards and cultivated fields. Juniper forests occur along the coast. Urban coenoses of settlements are ubiquitous.
Figure 3.
Vegetation of southeastern Crimea [24].
Additionally, the carbon use efficiency (CUE) index was calculated using the formula [28]:
CUE = NPP/GPP
To identify the significance of environmental factors on productivity, the influence of precipitation amount and air temperature was analyzed. Air temperature data for southeastern Crimea were obtained from the ClimateEU database [29]. Precipitation amount data were obtained using the GEE cloud computing platform from the CHIRPS dataset [30].
Statistical analysis and data visualization were performed using the R Studio software environment. This software was employed to compute zonal statistics, calculate Theil–Sen slope estimates, and apply the Mann–Kendall trend test (using the packages ‘terra’, ‘dplyr’, ‘e1071’, ‘openxlsx’, ‘ggplot2’, ‘trend’, and ‘tidyr’). Correlation and relationship maps between gross and net primary productivity in southeastern Crimea and mean annual precipitation and mean annual air temperature were produced in R Studio. The analysis explicitly accounted for spatial autocorrelation by estimating effective degrees of freedom and adjusting significance tests accordingly. The processing code was written in R Studio using the ‘terra’ package.
3. Results
3.1. Southeastern Crimea
3.1.1. Gross Primary Productivity (GPP)
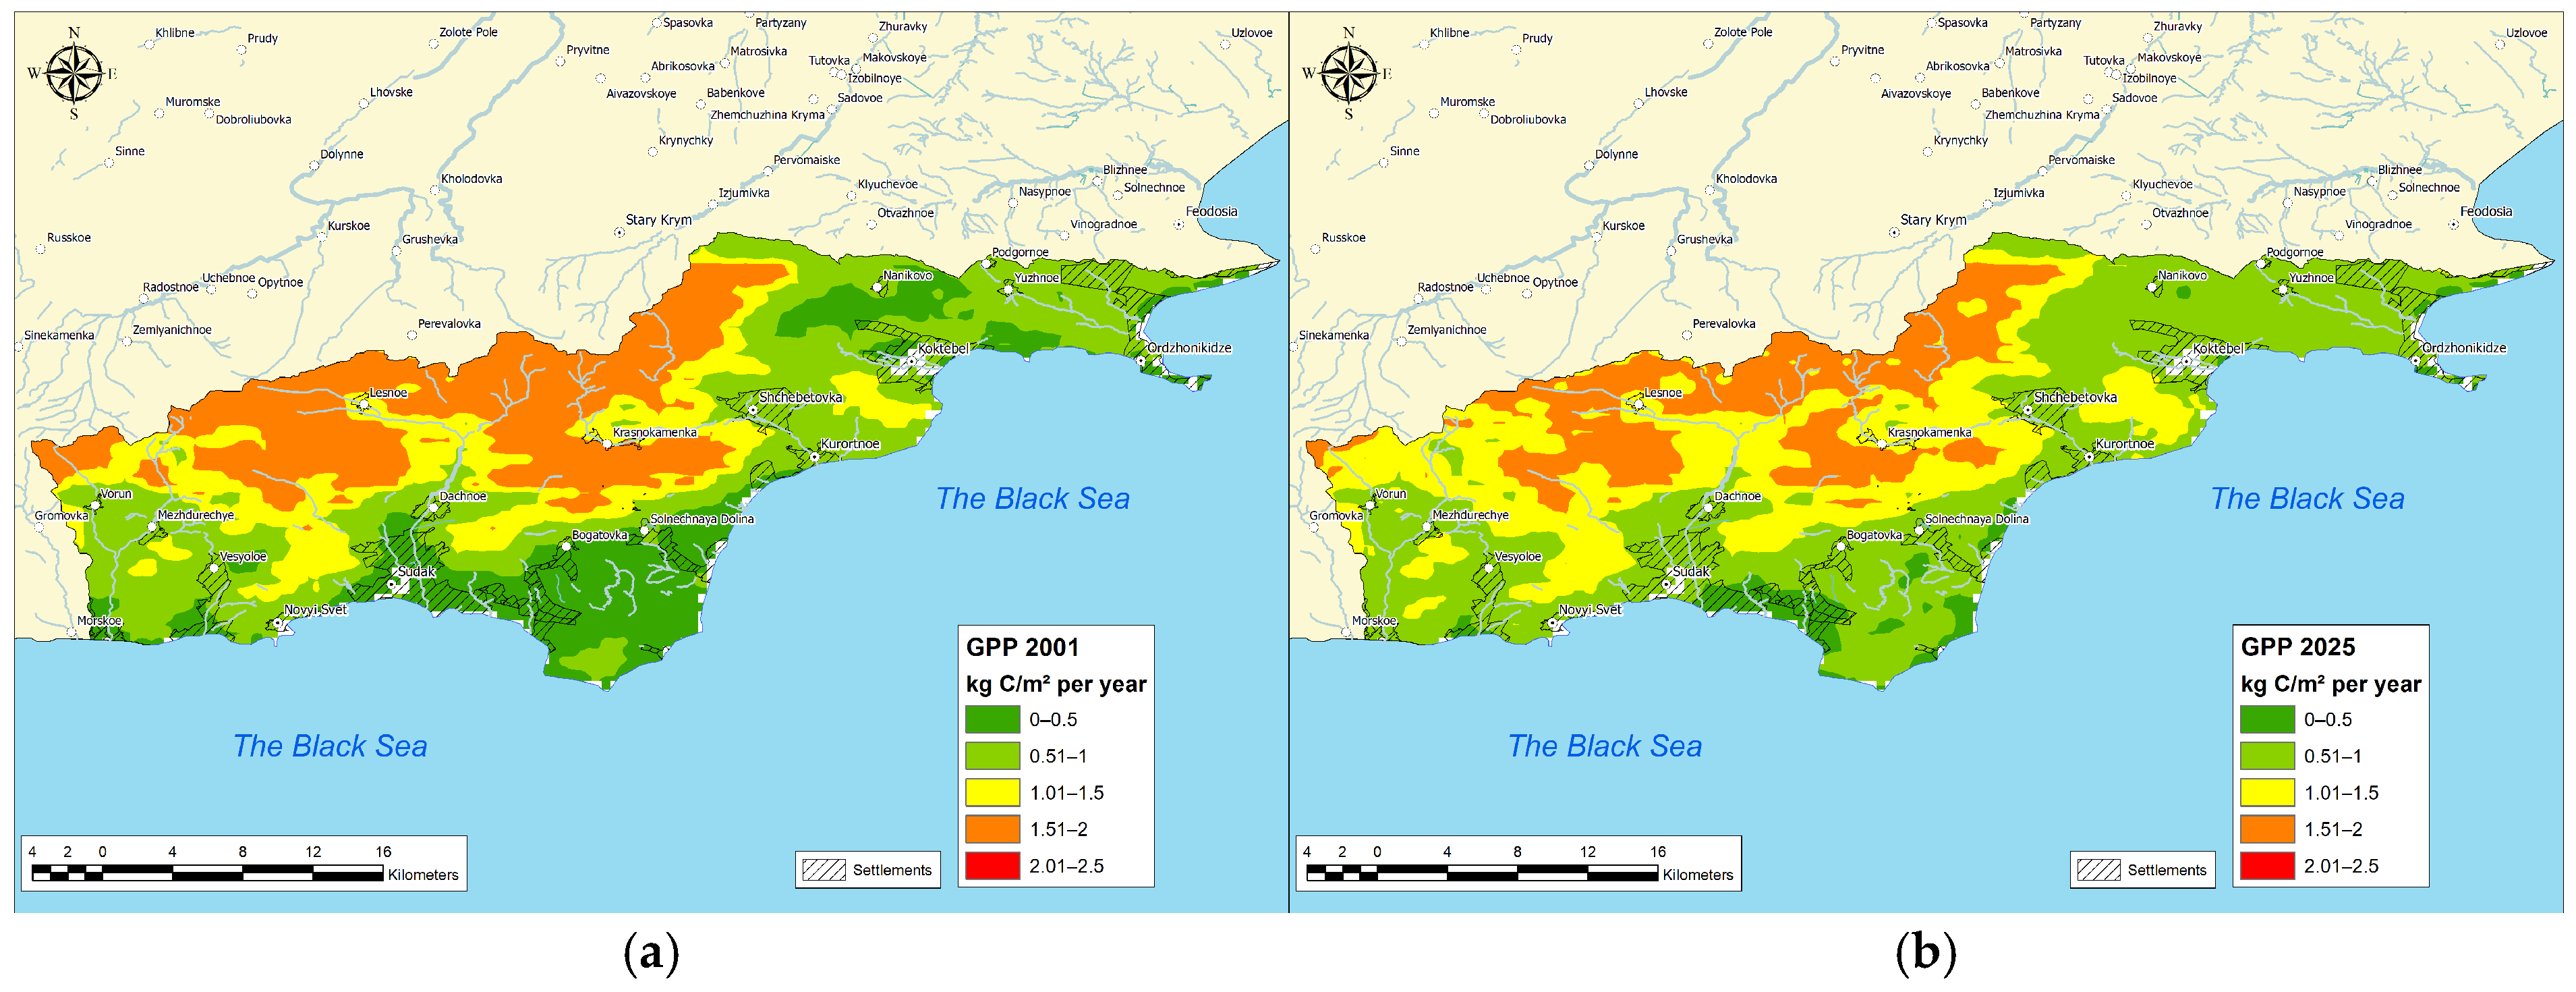
This study found that gross primary productivity values in southeastern Crimea for the period 2001–2025 range from 0.29 kg C/m2 per year to 6.55 kg C/m2 per year. The amplitude of values is 6.26 kg C/m2 per year, and the mean value is 1.13 kg C/m2 per year.
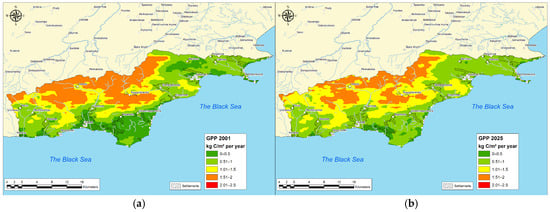
At the same time, annual dynamics of gross primary productivity values from 2001 to 2025 are observed, which are presented in Figure 4 and Table 1.
Figure 4.
Change in mean gross primary productivity in southeastern Crimea: (a) 2001, (b) 2025.
Table 1.
Change in mean gross primary productivity in southeastern Crimea (2001–2025).
Over the period 2001–2025, gross primary productivity in southeastern Crimea was characterized by minor variability in minimum and mean values. Throughout the entire observation period, the maximum values remained constant at 6.55 kg C/m2 per year. This is generally related to the upper threshold of productivity values calculated from the selected database. In this regard, we consider the values of 6.55 kg C/m2 per year as artifacts (outliers) and they were subsequently excluded from the analysis (these are a few image pixels within the entire study area). The minimum values of gross primary productivity showed more pronounced dynamics. The highest minimum value was recorded in 2004 (0.34 kg C/m2 per year), whereas in 2020 the lowest minimum for the entire observation period was recorded—0.16 kg C/m2 per year. The range of variation in values annual totals lay between 6.2 and 6.4 kg C/m2 per year. Mean gross primary productivity in 2001–2025 varied from 1.01 to 1.27 kg C/m2 per year. The highest value was observed in 2004, while the lowest was recorded in 2013. Overall, the dynamics of mean values reflect insignificant fluctuations with no pronounced long-term trend towards an increase or decrease in productivity. Of particular interest are years that can be considered anomalous. Thus, 2004 is characterized by the highest mean productivity level, 2013 by the lowest, and 2020 by an extremely low minimum.
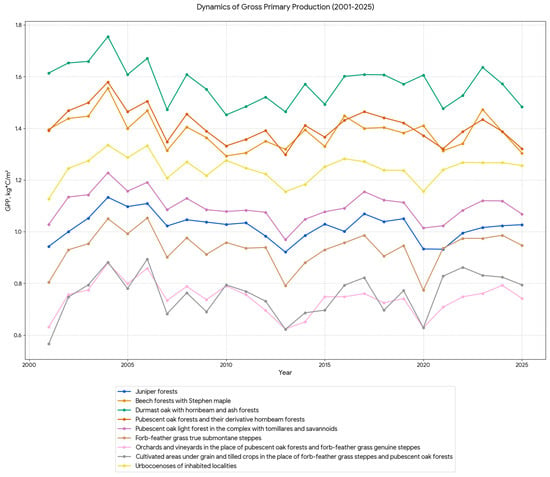
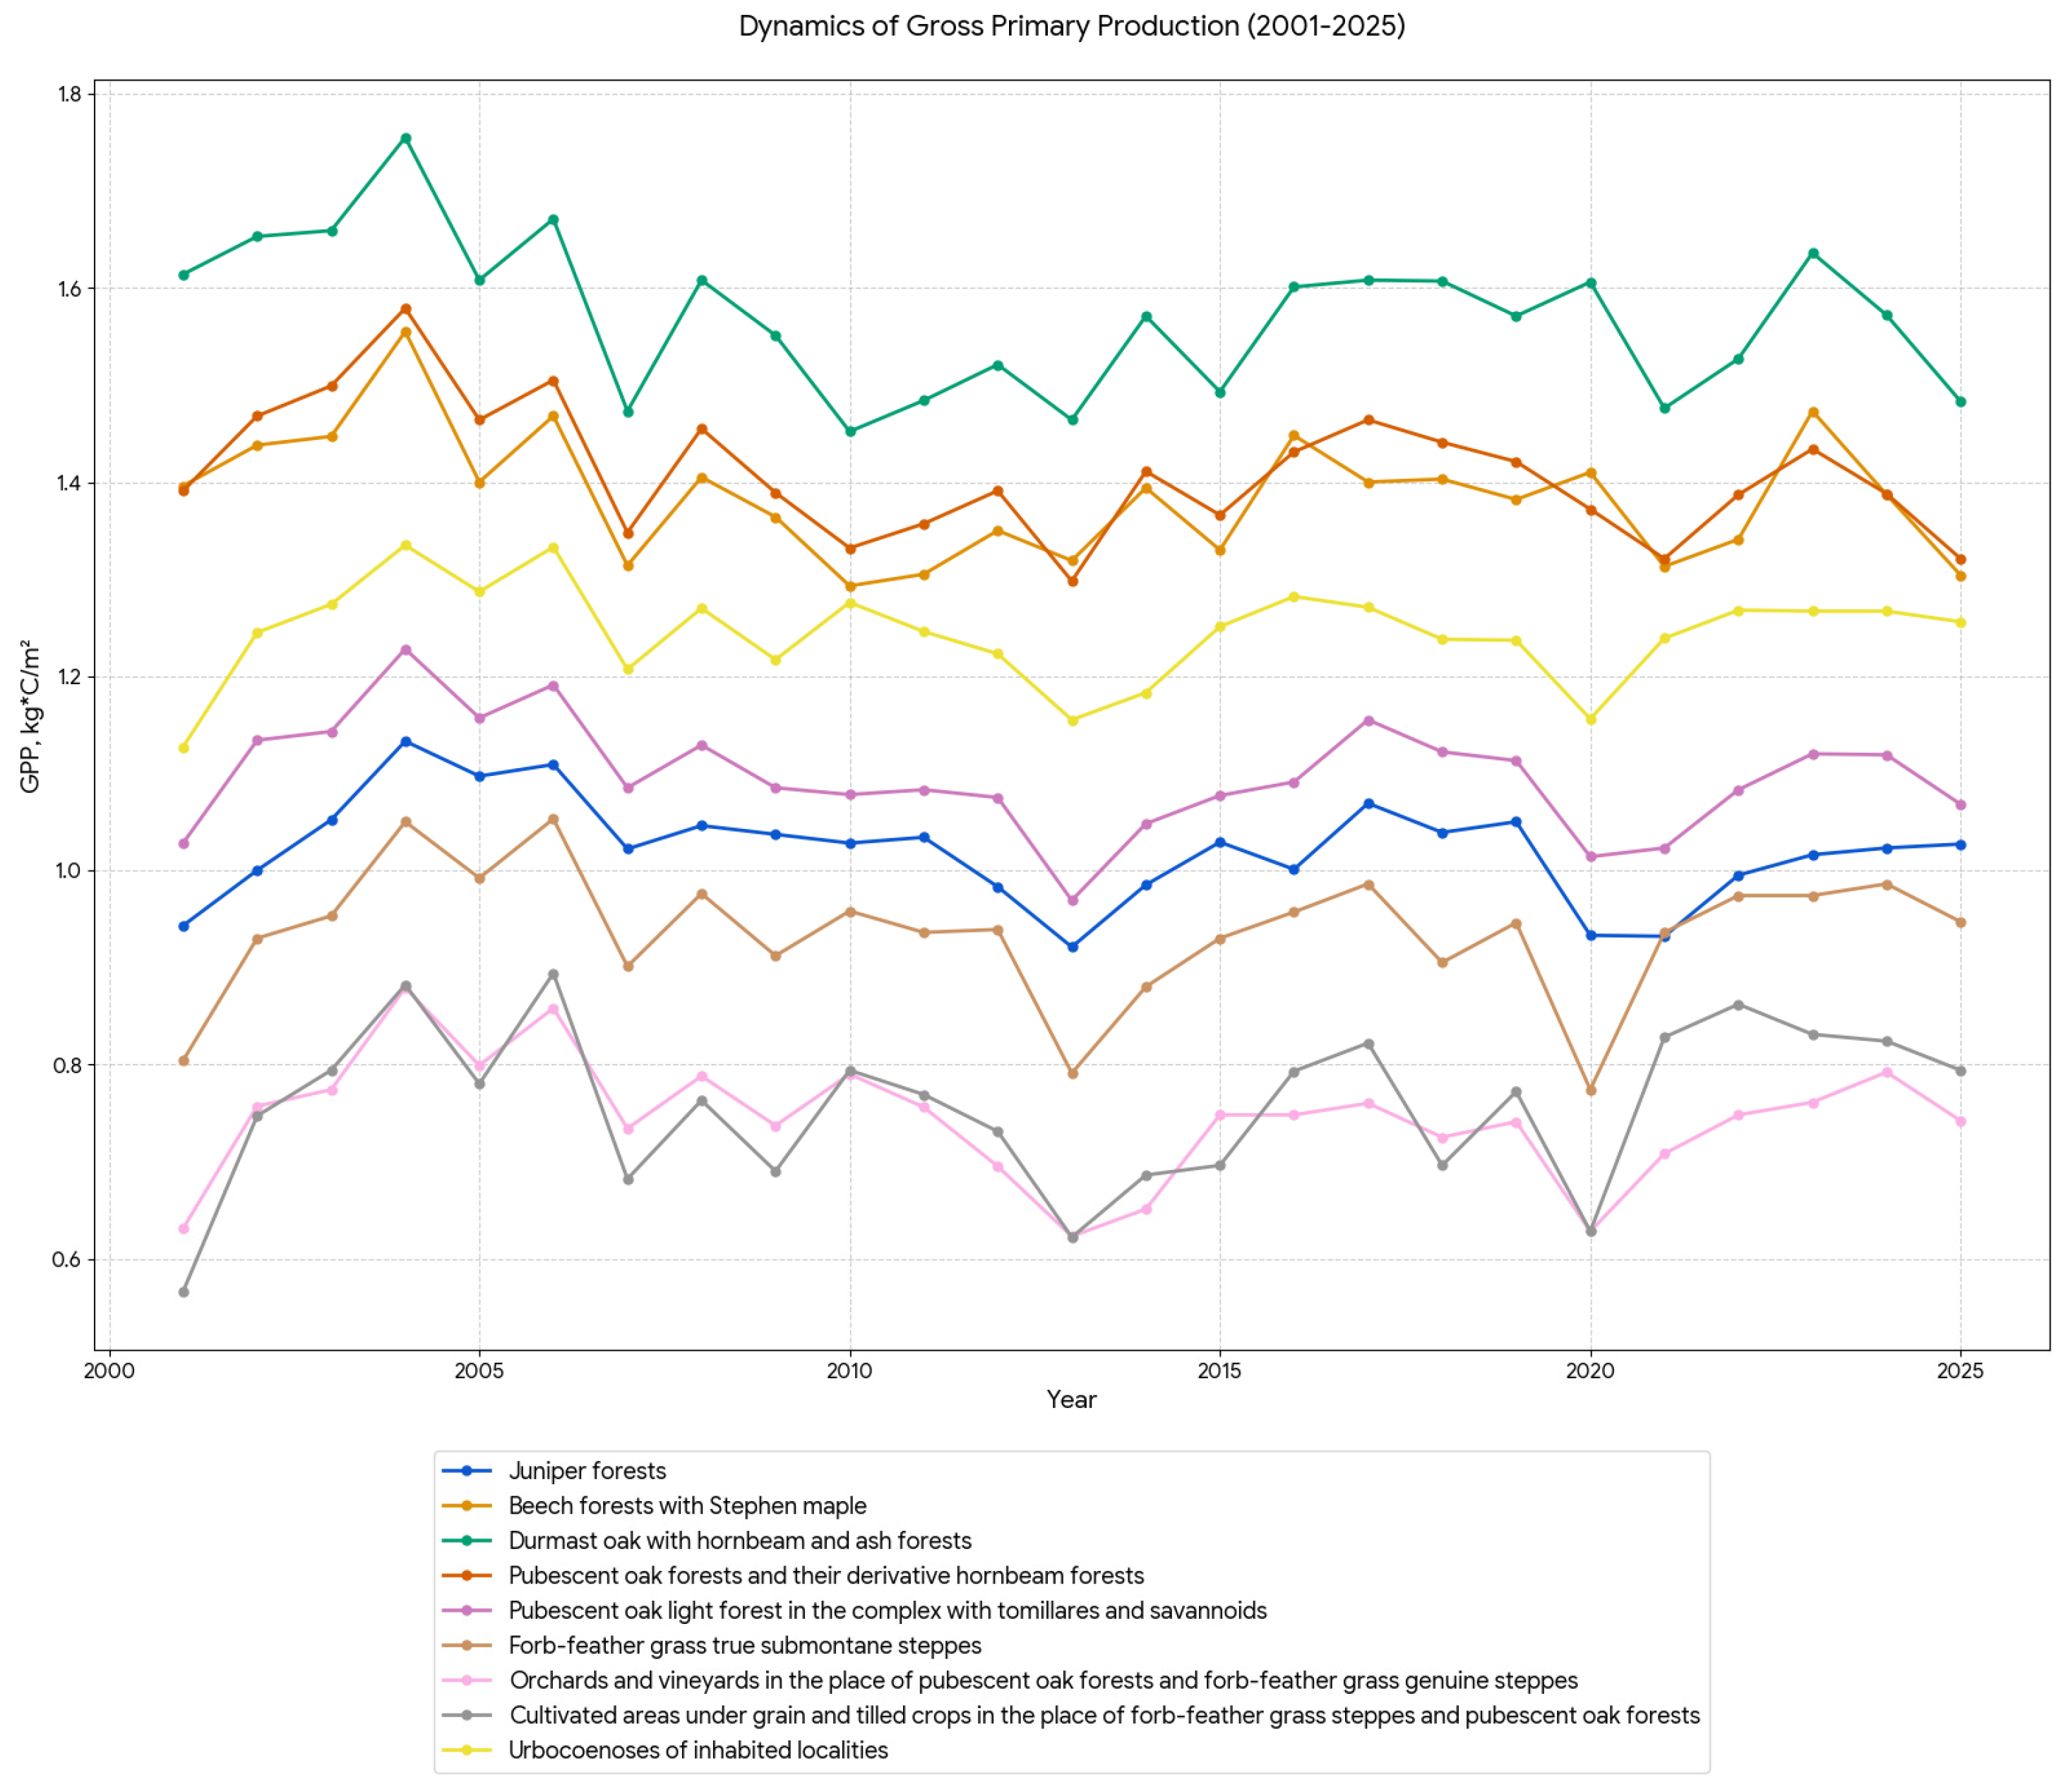
Based on the data presented for the period 2001–2025, the dynamics of mean gross primary productivity for different vegetation community types in southeastern Crimea can be characterized (Figure 5).
Figure 5.
Change in mean gross primary productivity in southeastern Crimea for different vegetation communities.
Sessile oak forests with an admixture of hornbeam and ash forests exhibit a relatively high productivity level, ranging from 1.45 kg C/m2 per year (2010) to 1.75 kg C/m2 per year (2004). Open woodlands of pubescent oak in a complex with tomillares and savannoids are characterized by a lower productivity level, varying from 0.97 kg C/m2 (2013) to 1.23 kg C/m2 per year (2004). Orchards and vineyards replacing pubescent oak forests and forb–feather grass true steppes show the lowest productivity values, in the range of 0.62–0.88 kg C/m2 per year. Juniper open woodlands are characterized by medium productivity at a level of 0.92–1.13 kg C/m2 per year, with moderate variability. A decline in productivity is noticeable in 2012–2013. Urban coenoses of settlements demonstrate a consistently high productivity level (from 1.13 to 1.33 kg C/m2 per year in the early years and up to 1.27 kg C/m2 per year in 2023). Forb–feather grass true steppes of the foothills possess moderate productivity, varying from 0.77 to 1.05 kg C/m2 per year, with a tendency towards small fluctuations in mean values. Pubescent oak forests and their derivative hornbeam forests show productivity in the range of 1.30–1.58 kg C/m2 per year. Cultivated land under grain and row crops replacing forb–feather grass steppes and pubescent oak forests is characterized by the lowest productivity (0.57–0.89 kg C/m2 per year). Beech forests with Stephen’s maple occupy an intermediate position in terms of gross primary productivity (1.29–1.55 kg C/m2 per year), with moderate interannual variability and a stable biomass level throughout the observation period.
Overall, the analysis of the dynamics of gross primary productivity for different vegetation community types shows that natural forest ecosystems—oak forests, beech forests and juniper forests—possess higher productivity values, while anthropogenically transformed and cultivated communities have lower gross primary productivity values. At the same time, the productivity of settlements areas is higher than that of natural steppe areas.
3.1.2. Net Primary Production (NPP)
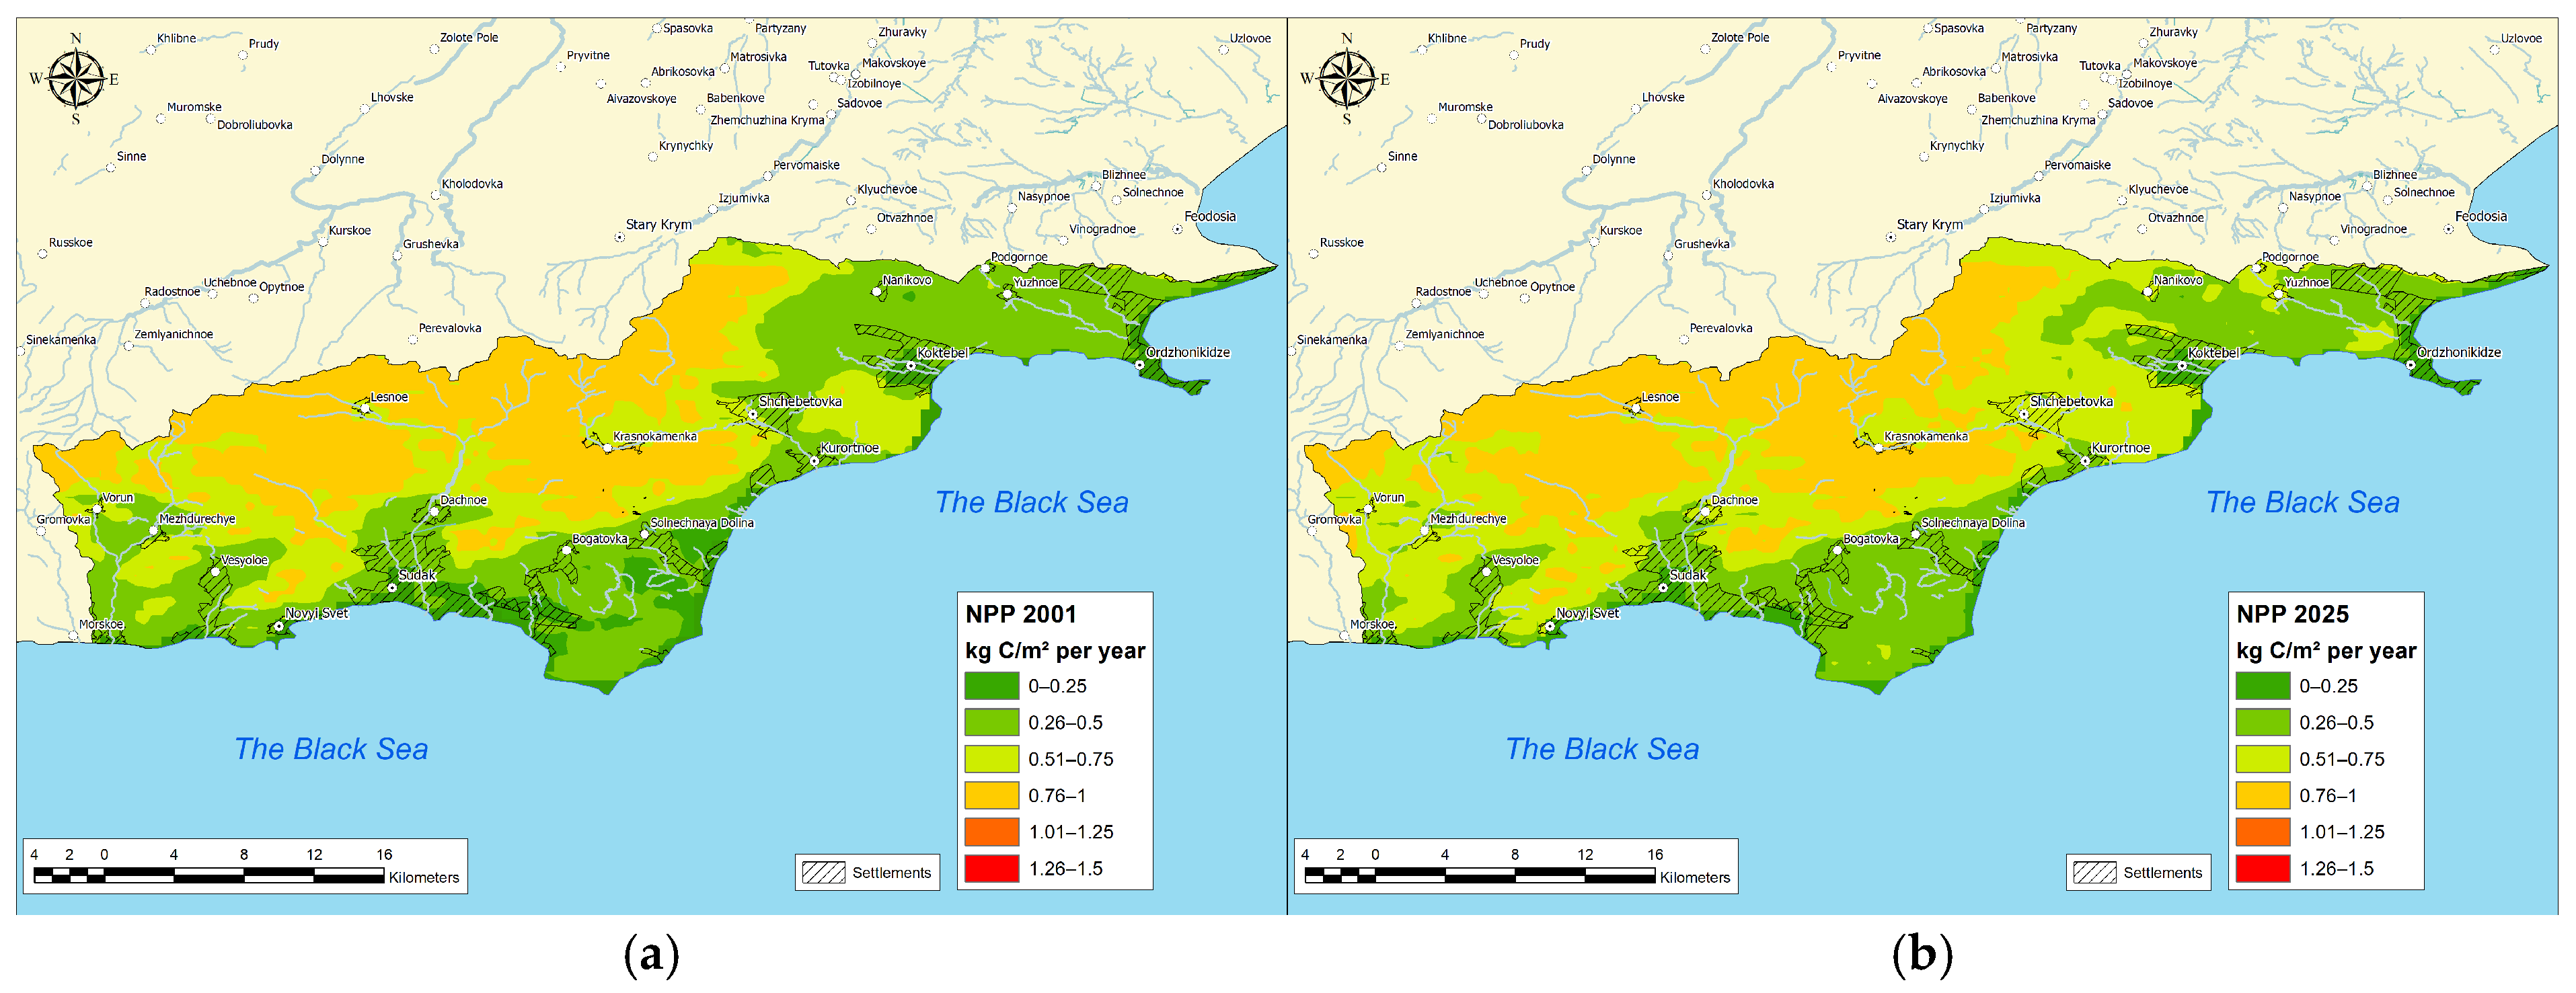
This study found that net primary production in southeastern Crimea for the period 2001–2025 ranges from 0.19 kg C/m2 per year to 0.94 kg C/m2 per year. The range of values is 0.75 kg C/m2, and the mean value is 0.61 kg C/m2 per year.
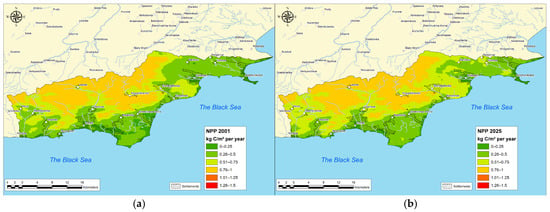
At the same time, the dynamics of annual net primary production values from 2001 to 2025 are observed, as presented in Figure 6 and Table 2.
Figure 6.
Change in mean net primary production in southeastern Crimea: (a) 2001, (b) 2025.
Table 2.
Dynamics of mean net primary production in southeastern Crimea (2001–2025).
Over the period 2001–2025, net primary production in southeastern Crimea was characterized by moderate interannual variability. Maximum values ranged from 0.83 kg C/m2 in 2010 to 1.19 kg C/m2 per year in 2004. Minimum values varied over a wider range: from 0.11 kg C/m2 per year in 2020 to 0.23 kg C/m2 per year in 2004. It is important to note that it is precisely 2004 that is characterized simultaneously by the highest minimum and the highest maximum, which also resulted in the highest mean values for the entire observation period. The range of variation was between 0.63 kg C/m2 per year (2010) and 0.96 kg C/m2 per year (2004). Mean net primary production varied from 0.53 kg C/m2 in 2013 to 0.74 kg C/m2 per year in 2004. The long-term dynamics do not reveal a pronounced upward or downward trend. At the same time, in a number of years, pronounced deviations from the average multi-year dynamics are observed. Thus, 2004 is characterized by the highest productivity level, whereas 2013 stands out for its minimal values. 2020 is notable for a record low minimum while maintaining a relatively high maximum, indicating increased spatial heterogeneity of productivity conditions in that year.
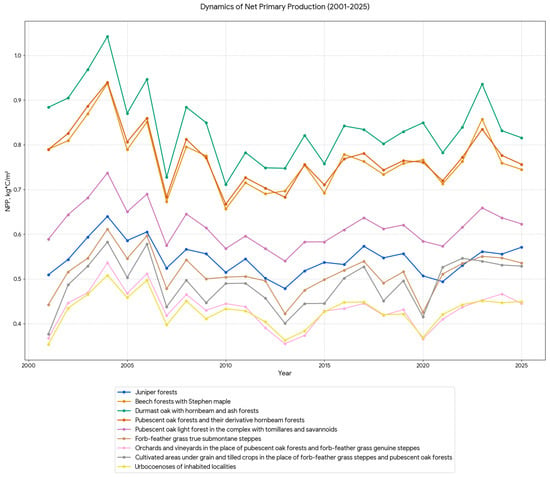
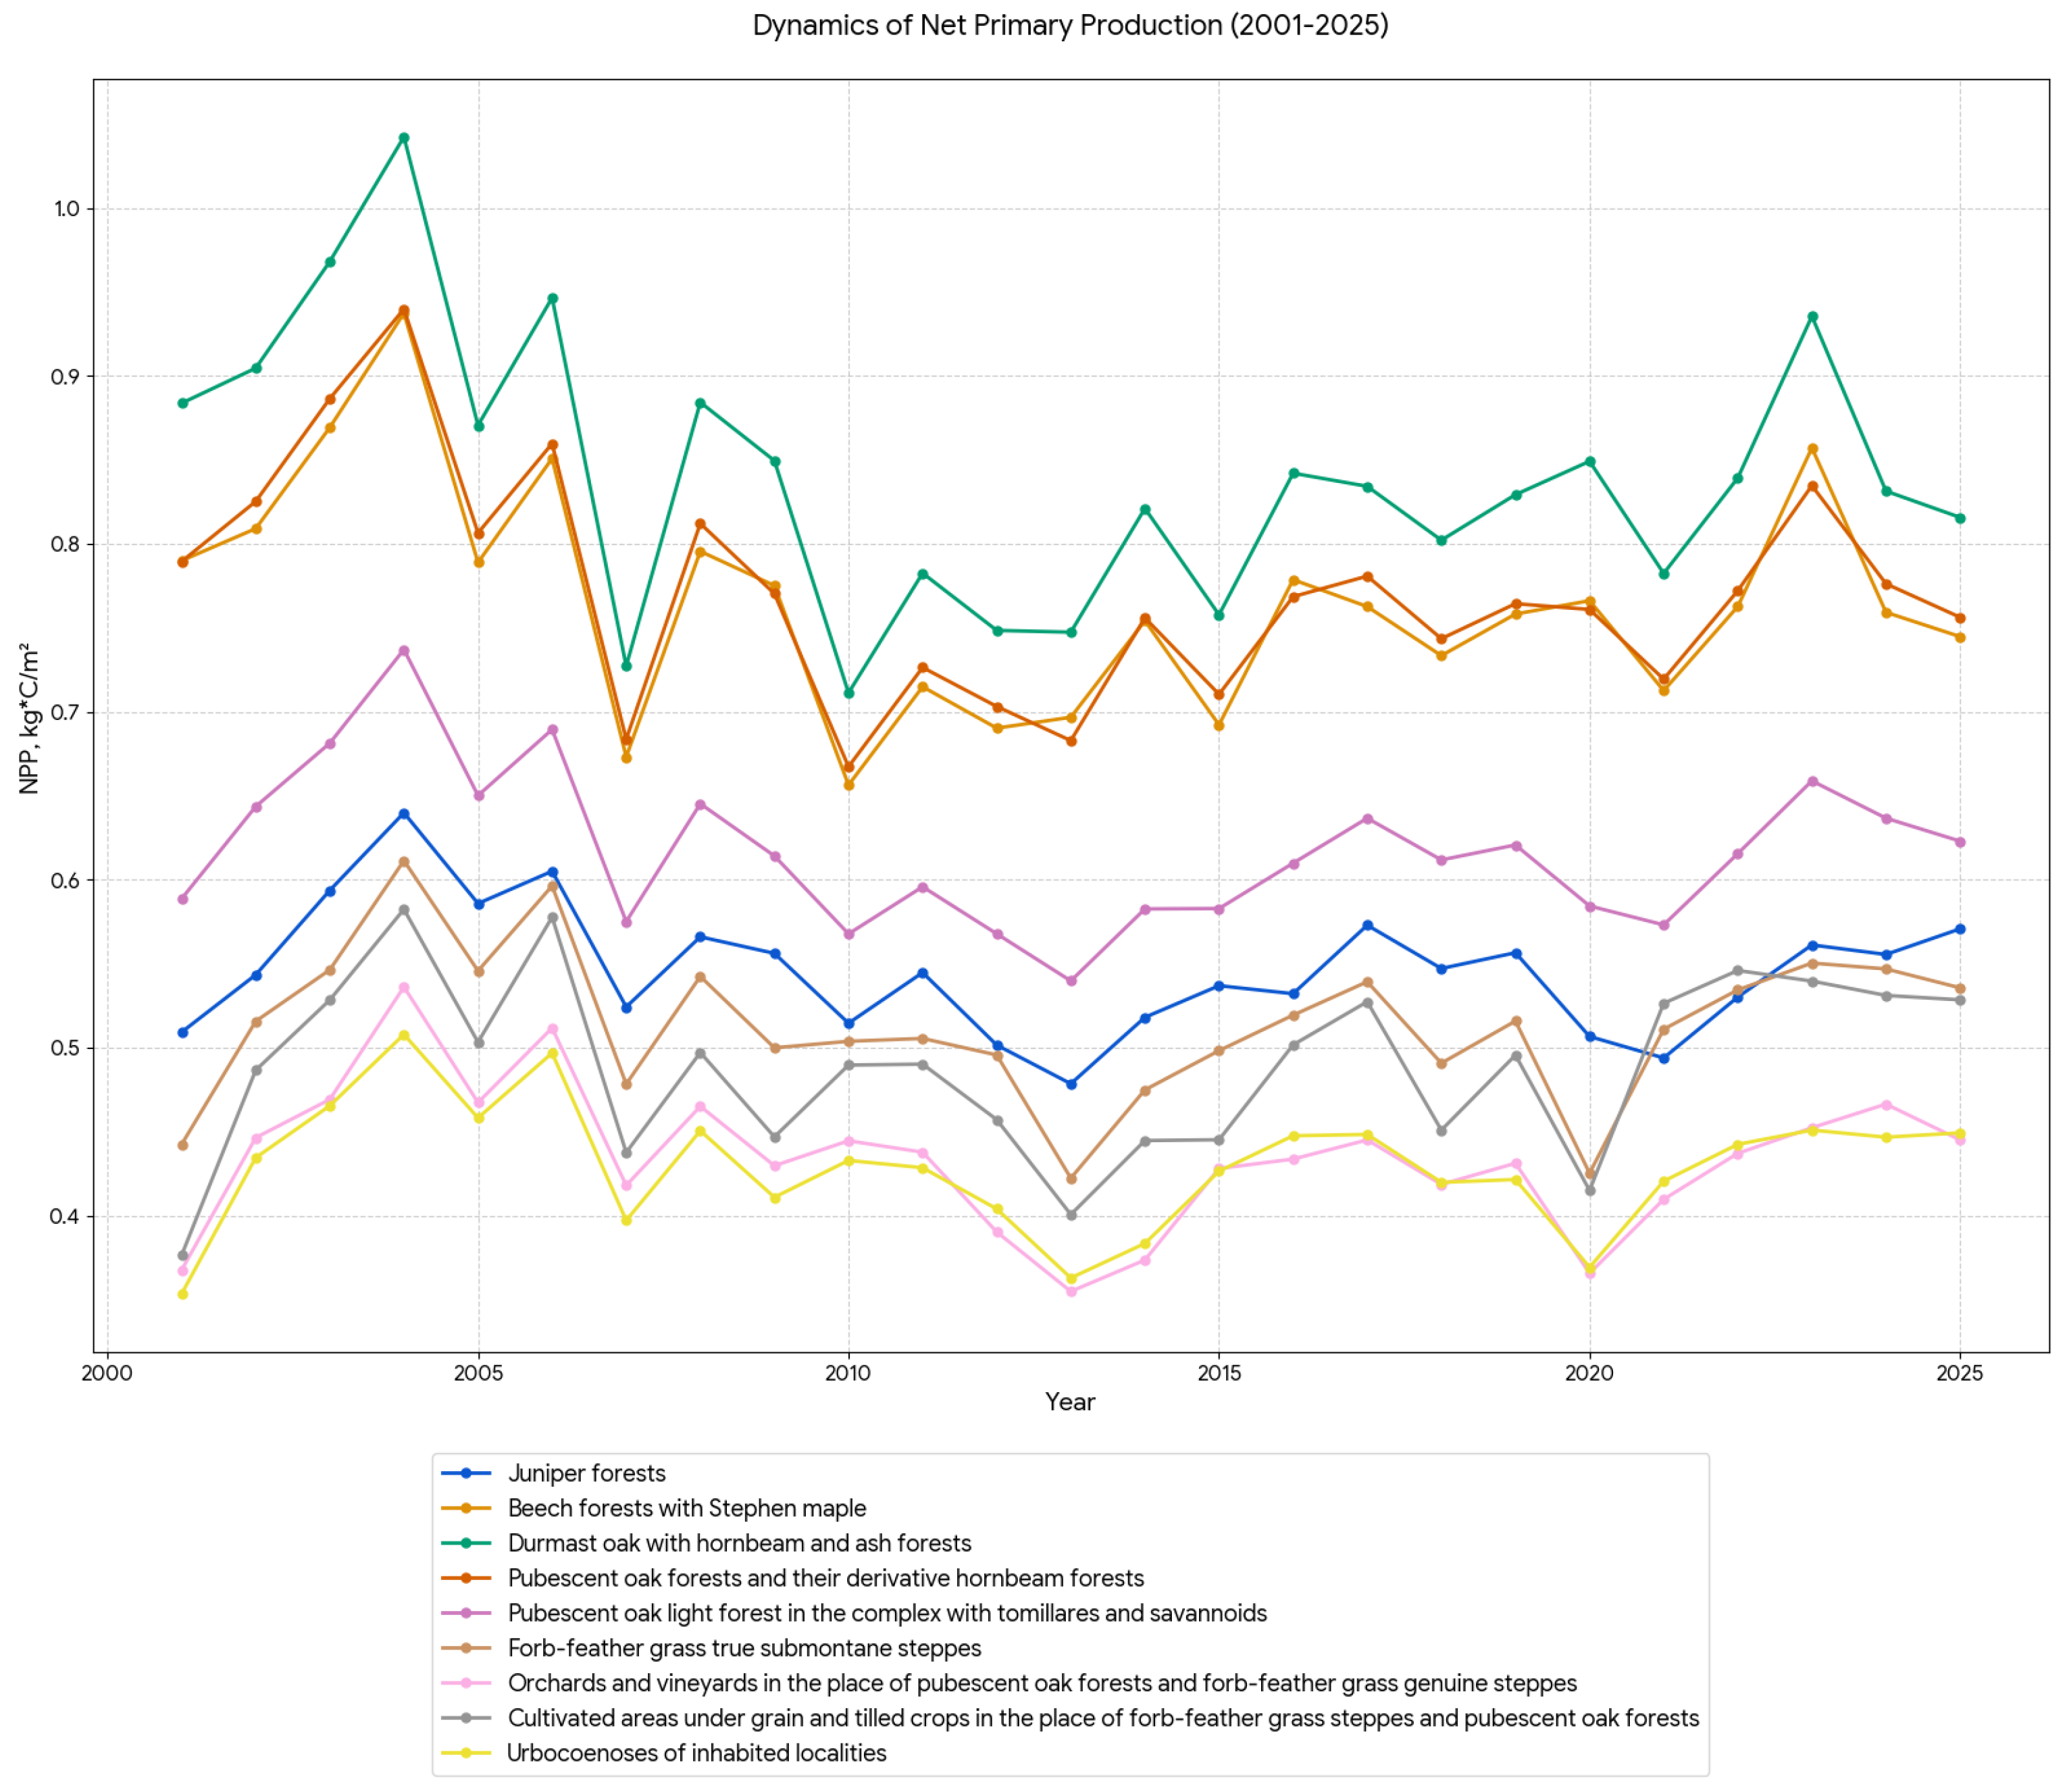
Let us examine in greater detail the changes in net primary production values by vegetation community type in southeastern Crimea (Figure 7).
Figure 7.
Dynamics of mean net primary production in southeastern Crimea for different vegetation communities.
Over the period 2001–2025, the net primary production indices of different vegetation community types in southeastern Crimea show pronounced interannual fluctuations. Sessile oak forests with an admixture of hornbeam and ash forests are characterized by the highest net primary production values, ranging from 0.71 kg C/m2 per year (2010) to 1.04 kg C/m2 per year (2004). The mean values remain relatively stable, with variations of about 0.1–0.2 kg C/m2 per year between individual years. Open woodlands of pubescent oak in a complex with tomillares and savannoids show values from 0.54 kg C/m2 per year (2013) to 0.74 kg C/m2 per year (2004), demonstrating moderate interannual fluctuations. Orchards and vineyards replacing pubescent oak forests and forb–feather grass true steppes have net primary production values in the range 0.35–0.54 kg C/m2 per year. After 2010, values remain relatively stable, not exceeding 0.45 kg C/m2 per year. Juniper open woodlands show net primary production values from 0.48 kg C/m2 per year (2013) to 0.64 kg C/m2 per year (2004), with minor interannual variability. Urban coenoses of settlements are characterized by productivity in the range 0.35–0.51 kg C/m2 per year. Forb–feather grass true steppes of the foothills exhibit net primary production from 0.42 to 0.61 kg C/m2 per year, with values fluctuating moderately and not exceeding 0.61 kg C/m2 per year; pubescent oak forests and their derivative hornbeam forests range from 0.68 to 0.94 kg C/m2 per year, with small year-to-year variations. Cultivated land under grain and row crops replacing forb–feather grass steppes and pubescent oak forests show the lowest productivity values, in the range 0.38–0.58 kg C/m2 per year. Beech forests with Stephen’s maple have productivity in the range 0.66–0.94 kg C/m2 per year, with values remaining relatively stable throughout the entire observation period. Overall, among the community types considered, the highest net primary production values are observed in sessile oak forests with an admixture of hornbeam and ash forests, and the lowest—within cultivated land under grain and row crops replacing forb–feather grass steppes and pubescent oak forests, with minor fluctuations in values across all community types over the 25 years of observations.
The time series of the indices for the different vegetation types were analyzed using the Theil–Sen slope estimator and the Mann–Kendall test to detect possible trends. The results show that the majority of vegetation types exhibit a weak negative slope, varying from −0.0007 to −0.0033 kg C/m2 per year. The exception is cultivated land under grain and row crops replacing forb–feather grass steppes and pubescent oak forests, where a minimal positive slope (0.0006 kg C/m2 per year) is observed.
3.2. Carbon Use Efficiency
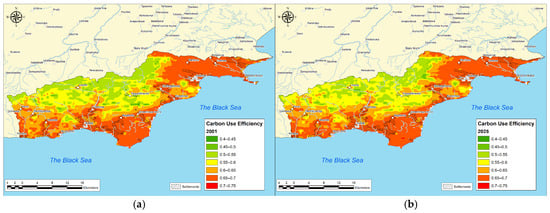
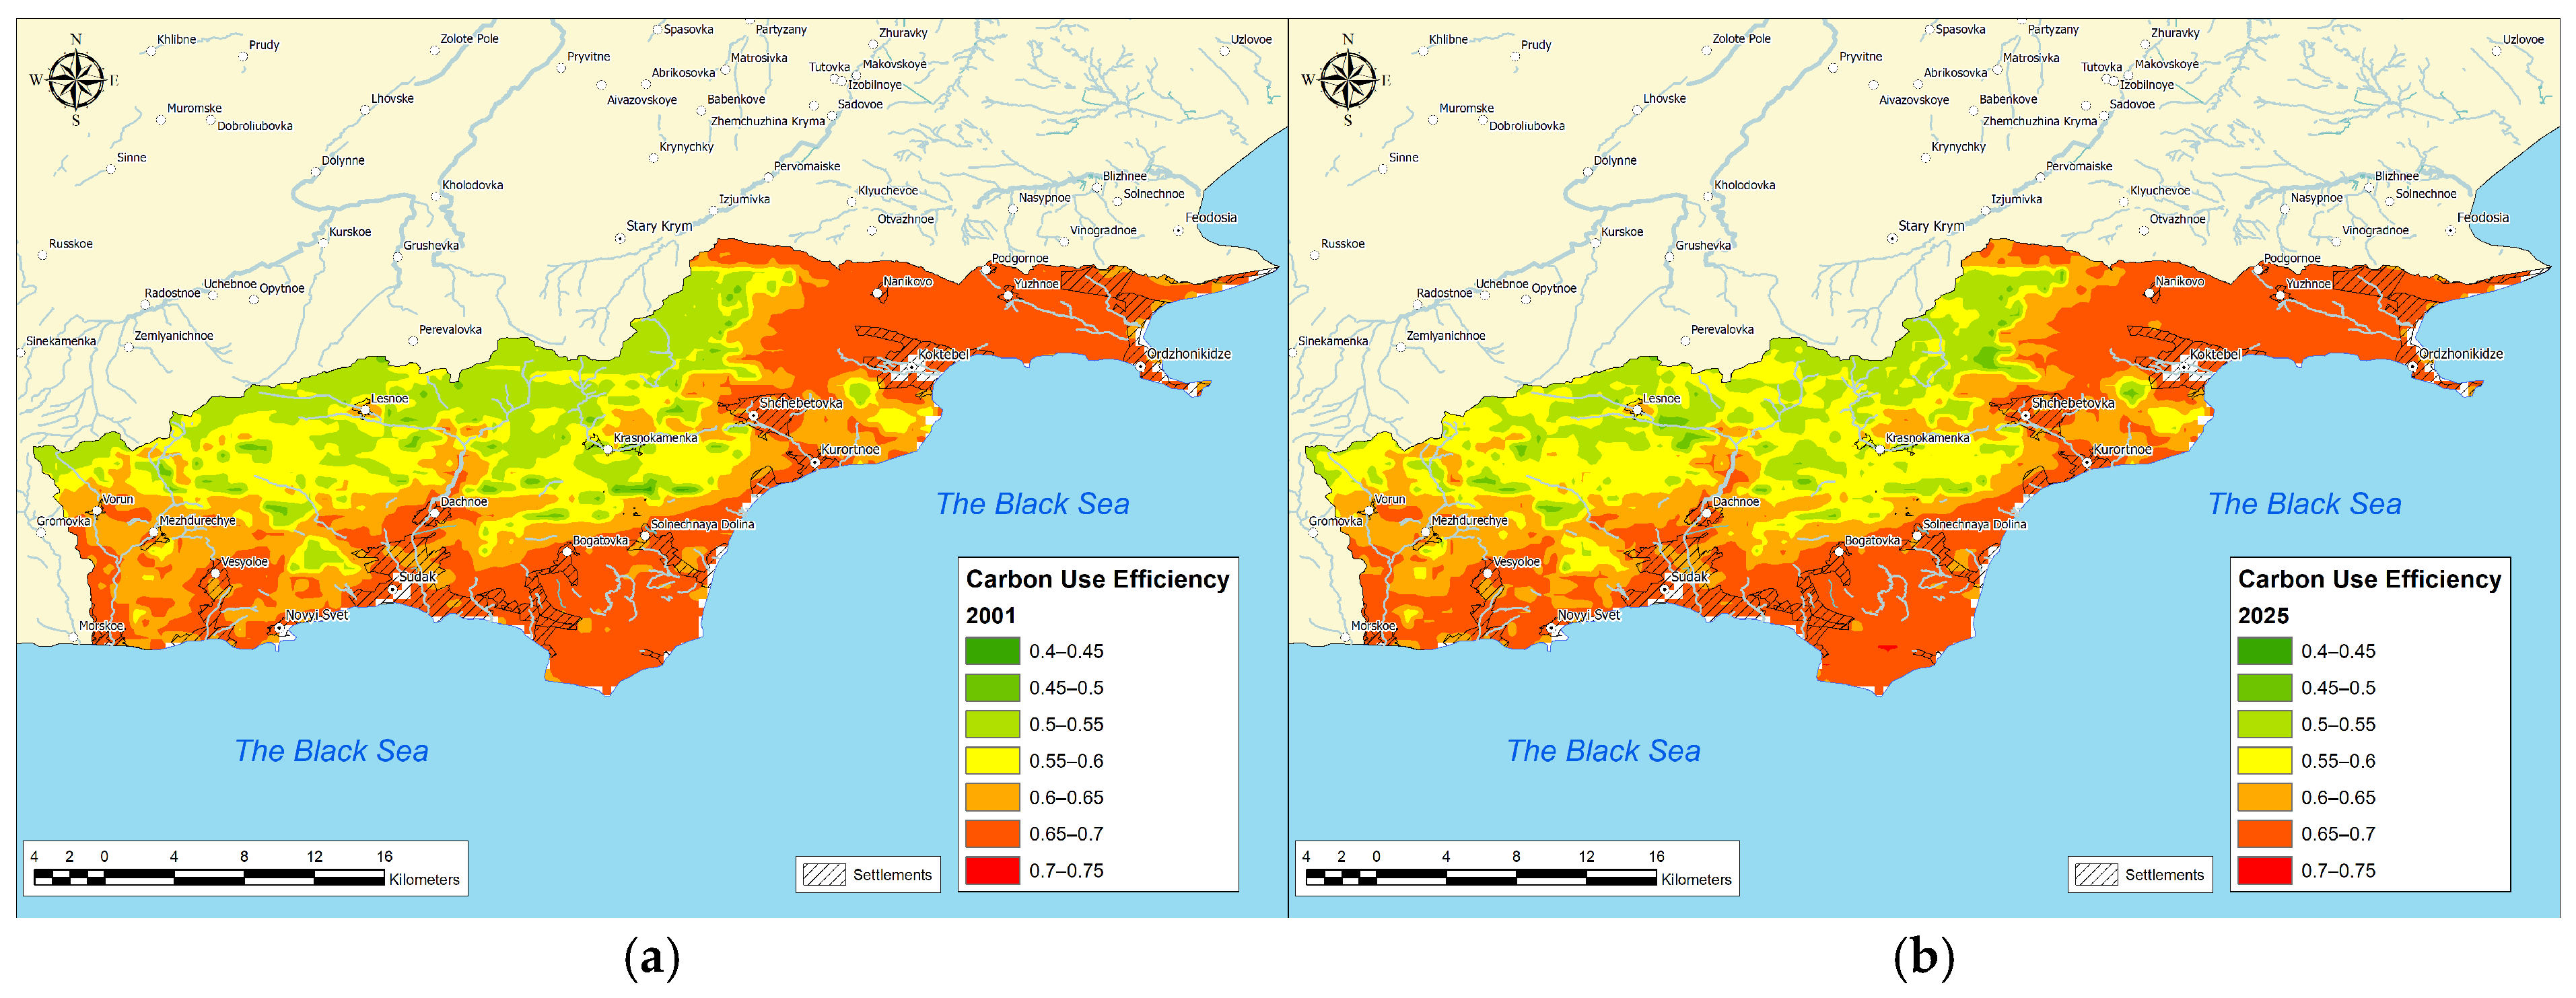
Studies [31,32] show that the NPP/GPP ratio (carbon use efficiency) is relatively constant (0.45–0.47) for various forest ecosystems. In our study, this index for southeastern Crimea was 0.54. At the same time, the values in southeastern Crimea are spatially distributed extremely unevenly (Figure 8).
Figure 8.
Change in mean carbon use efficiency in southeastern Crimea: (a) 2001, (b) 2025.
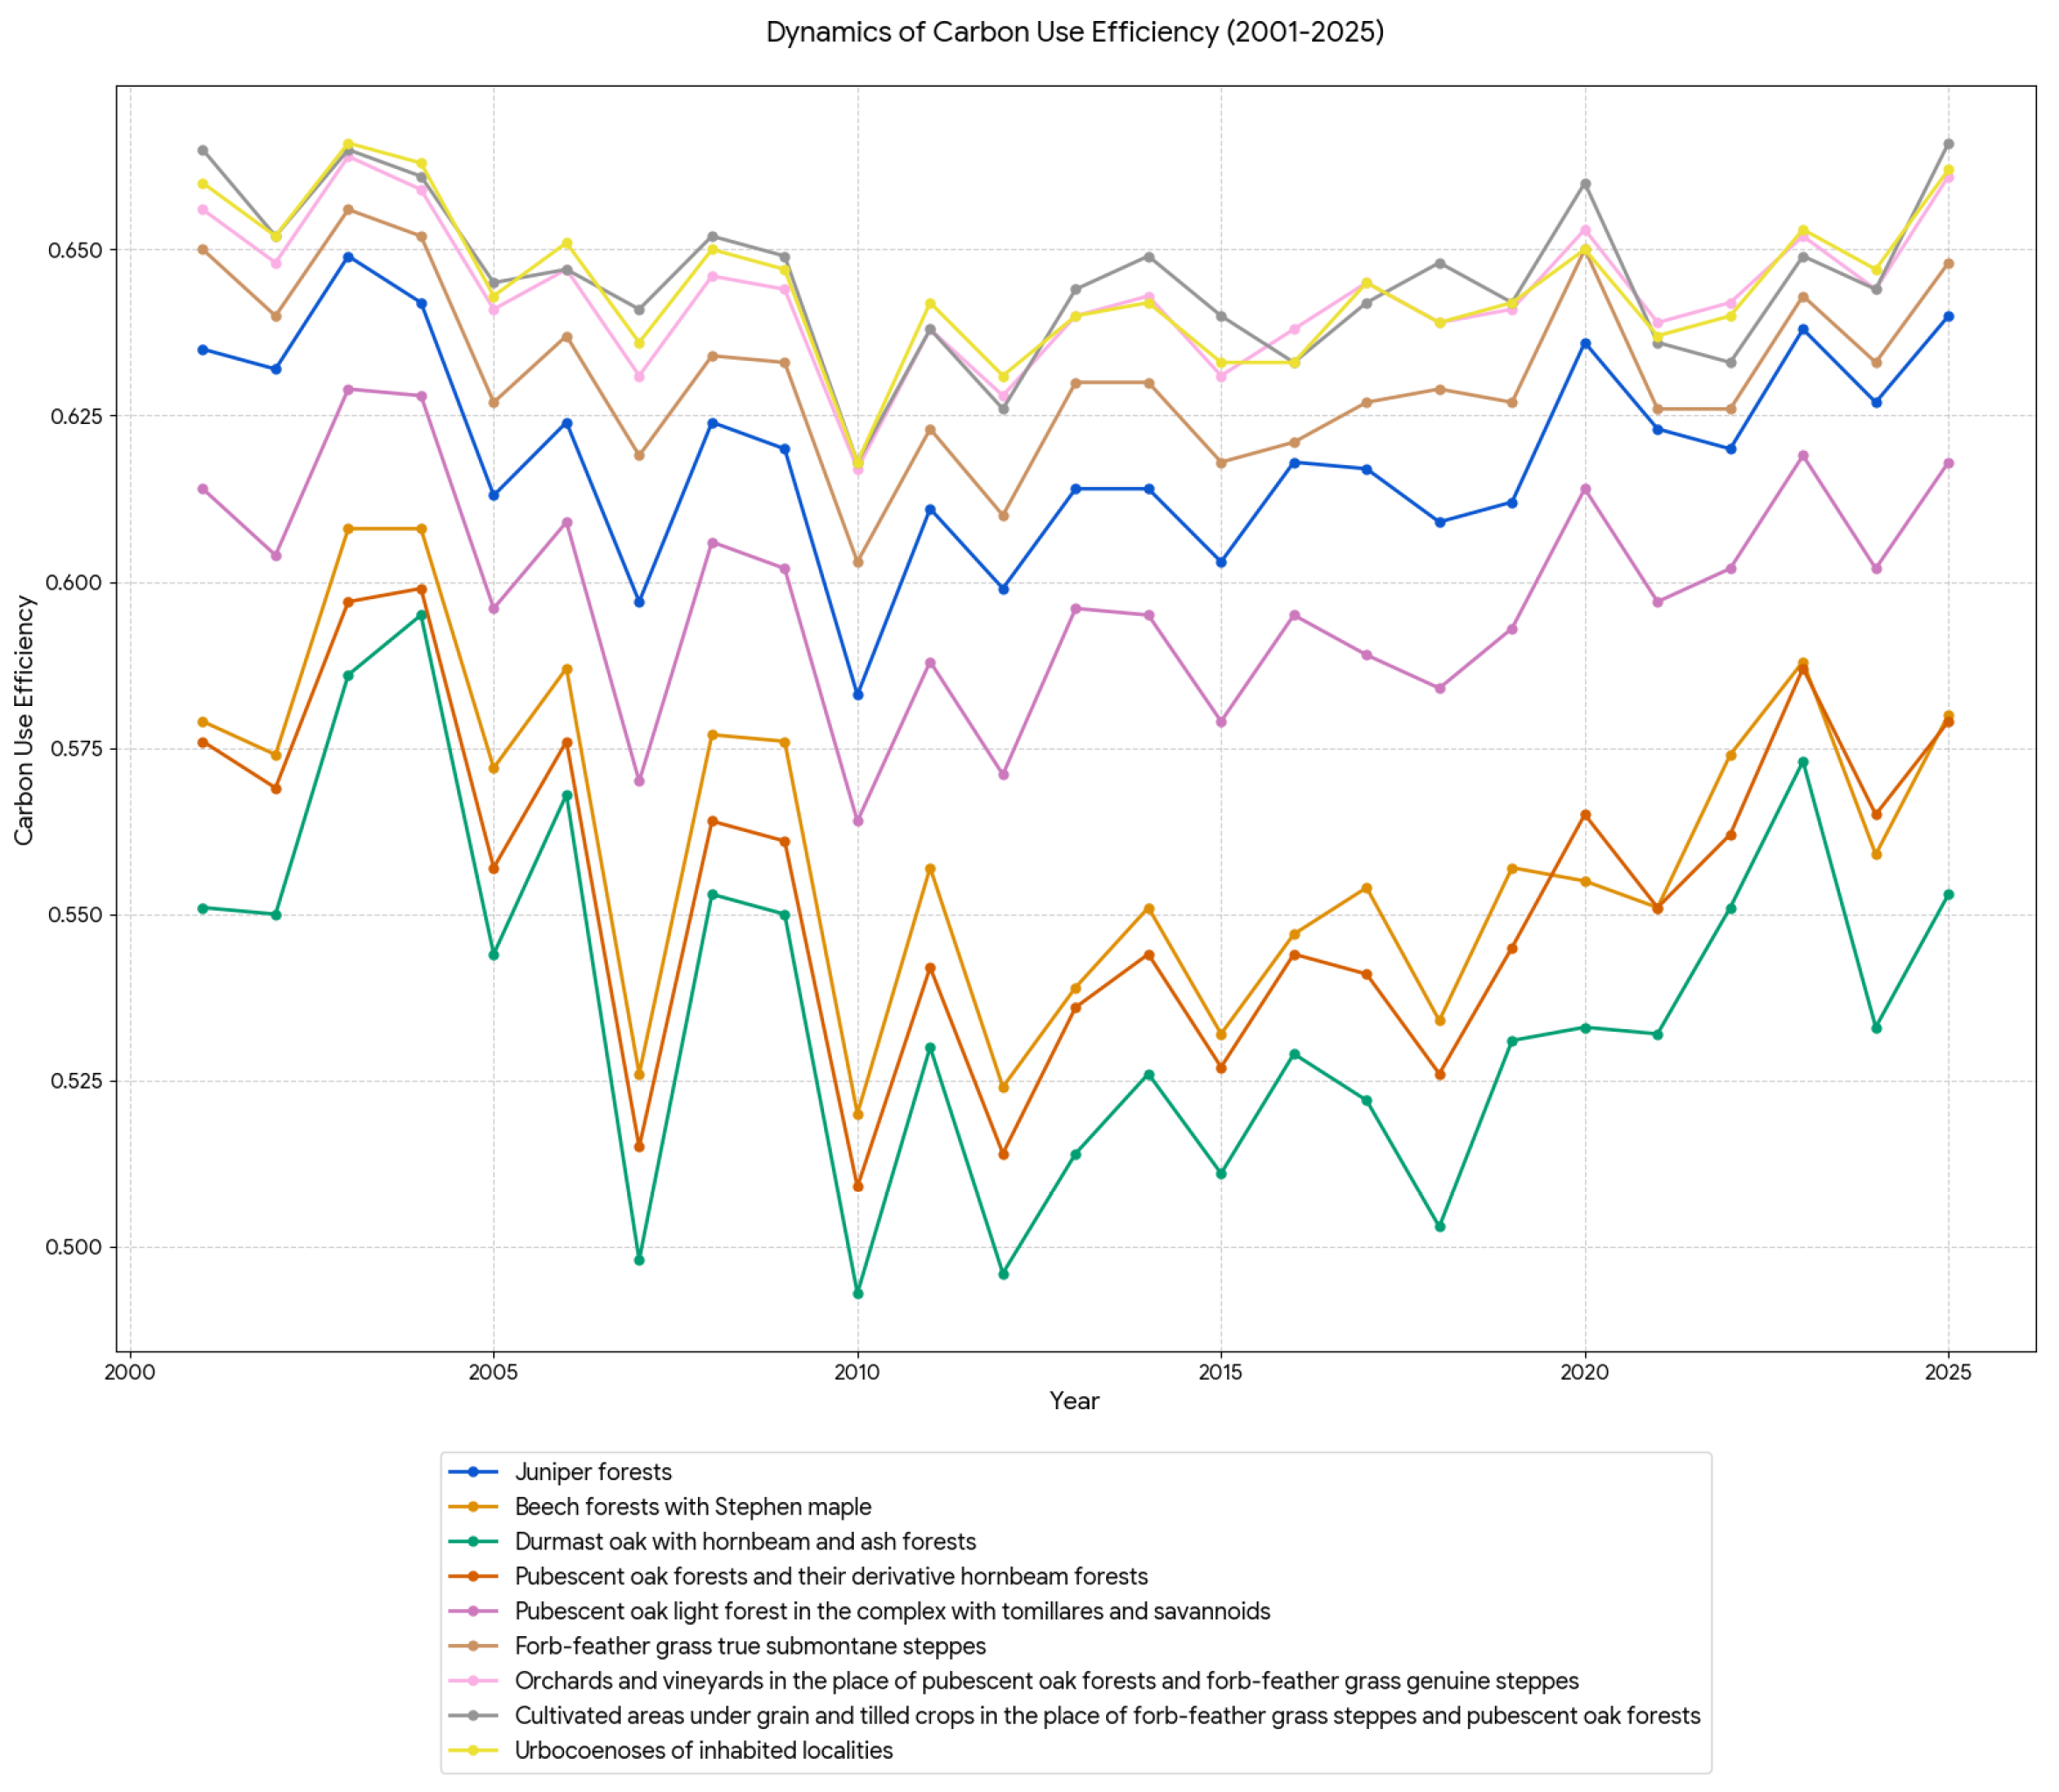
As regards the vegetation communities occurring in southeastern Crimea, the following data were obtained (Figure 9), showing their differentiation.
Figure 9.
Change in mean carbon use efficiency in southeastern Crimea.
The highest CUE values (in the range 0.63–0.66) are characteristic of anthropogenic landscapes (urban coenoses and agrocoenoses) and steppe landscapes, which is due to their simplified structure and minimal energy expenditure for the maintenance of accumulated biomass. Conversely, mesophytes forest communities (beech and oak–hornbeam forests) show consistently low values (0.49–0.57). This is explained by the high metabolic cost of maintaining massive skeletal organs and developed root systems, on the respiration of which a significant proportion of gross production is expended. The temporal dynamics of CUE over the period 2001–2025 are characterized by pronounced interannual synchronicity, reflecting the response of phytocoenoses to regional climatic changes. Thus, we can see that CUE is higher in agrolandscapes, steppes, and urbanized areas. At the same time, this cannot be interpreted as a direct consequence of the simplified structure of ecosystems, since CUE is a calculated indicator. Therefore, for now, we consider this to be merely an observed fact, and it should be regarded as a preliminary interpretation of the data.
3.3. Relationship Between Gross Primary Production, Net Primary Production and Environmental Factors
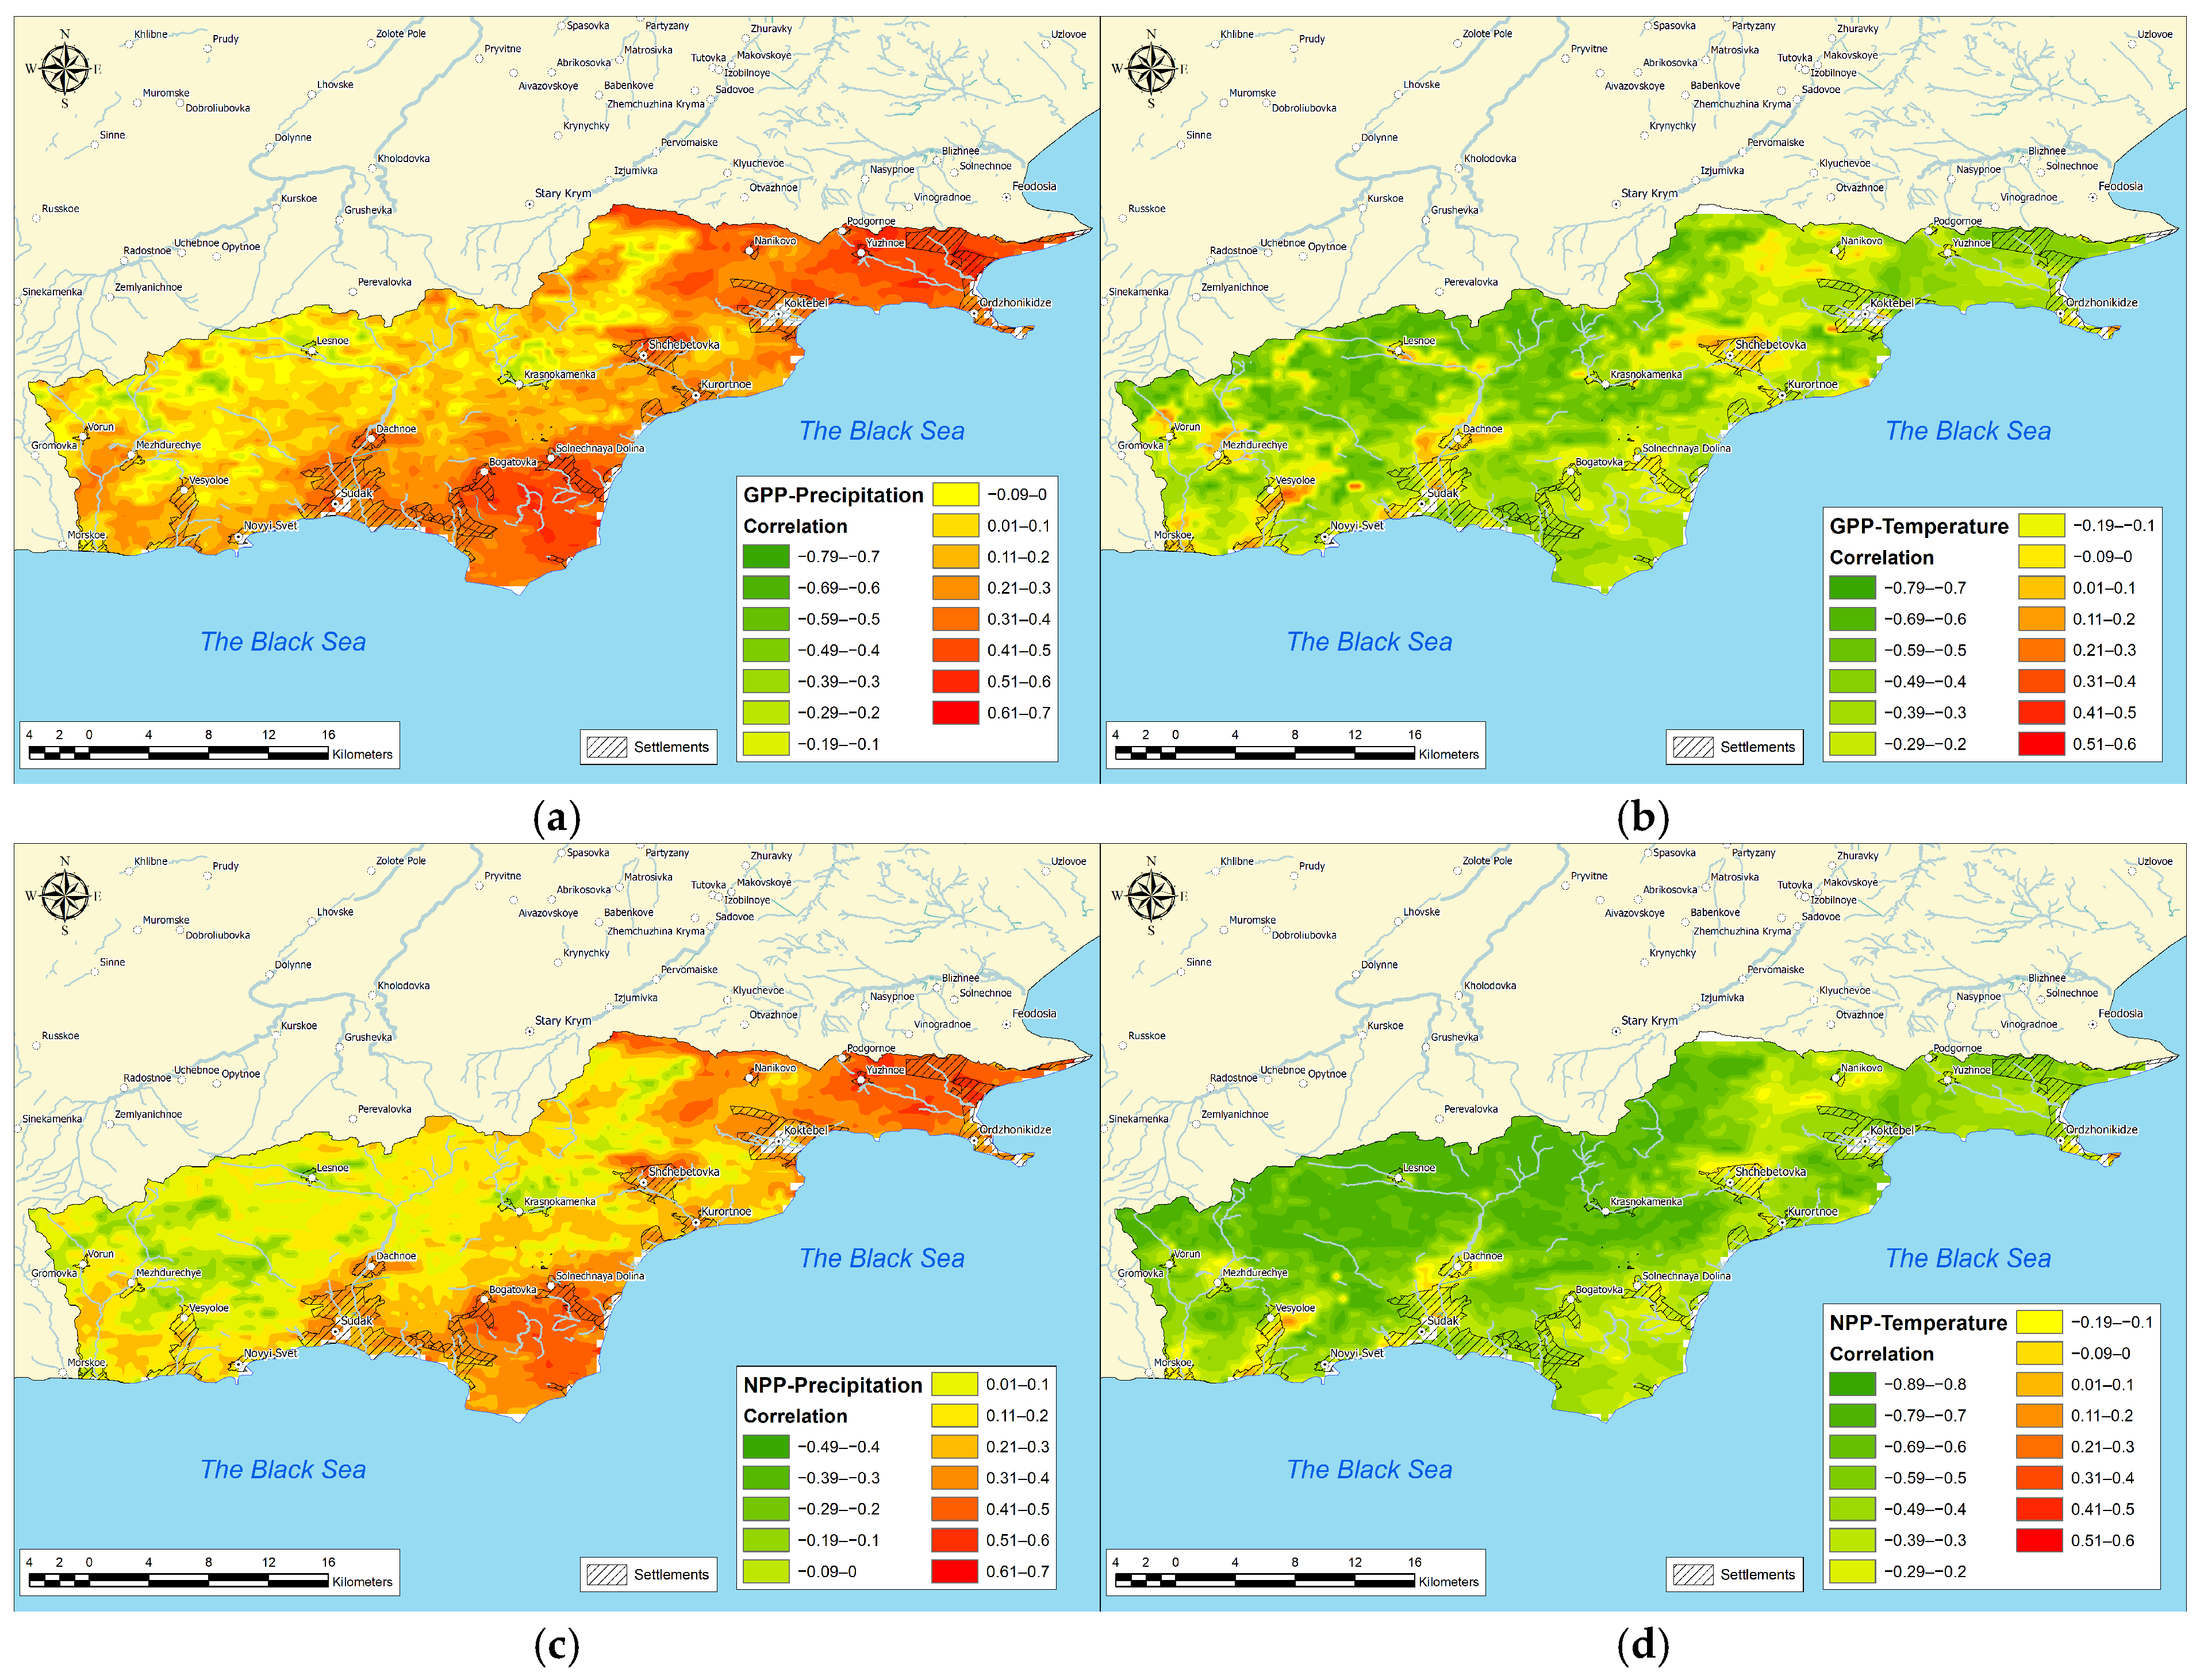
At the same time, if the spatio-temporal aspects of variability are considered at the level of each image pixel, the pairwise correlation coefficients of gross and net production with temperature and precipitation were additionally calculated for southeastern Crimea (Figure 10).
Figure 10.
Correlation coefficient: (a) relationship between gross primary production and precipitation; (b) relationship between gross primary production and temperature; (c) relationship between net primary production and precipitation; (d) relationship between net primary production and temperature.
As can be seen from Figure 10, overall, a positive correlation of gross primary production and net primary production with precipitation amount is observed in southeastern Crimea, and a negative correlation of gross primary production and net primary production with mean air temperature is observed in southeastern Crimea. This tendency is characteristic mainly of forest landscapes in the north of the study area. At the same time, within the territory of settlements and their surroundings, an inverse relationship is evident, which is associated with anthropogenic activity within the settlements. At the same time, we emphasize that the calculated correlation does not indicate direct cause-and-effect relationships in such a complex and heterogeneous area as southeastern Crimea, where many environmental factors act simultaneously (altitude, radiation balance, type of vegetation, soil conditions, anthropogenic pressure, etc.).
4. Discussion
The estimation of gross primary production (GPP) and net primary production (NPP) in most modern satellite-driven models is based on the light use efficiency (LUE) concept, first formulated and substantiated by John L. Monteith in [33], where he demonstrated that the accumulation of dry matter (biomass) in plant communities (especially in tropical and well-watered agro- and natural ecosystems) over periods of weeks to months is approximately linearly proportional to the amount of solar radiation absorbed by the photosynthetic apparatus (mainly leaves).
At the same time, a significant shortcoming for the study area is the insufficient data coverage (ground observations), which complicates the analysis compared with other regions (e.g., China and its regions [34], Europe and its parts [35,36,37], etc.). Nevertheless, there are many global-scale studies worldwide that use globally scaled data for calculations [38], which, due to their coarse resolution, cannot be applied at the regional or local level.
According to the literature, the average global net primary production (NPP) is about 0.41 kg C m−2 yr−1. The average global gross primary production (GPP) is estimated at roughly 0.75–0.81 kg C m−2 yr−1 [39,40]. The mean NPP in southeastern Crimea (0.61 kg C m−2 yr−1) is higher than the global average (0.41 kg C m−2 yr−1), which underscores the relatively high productivity of sub-Mediterranean landscapes.
A limitation of this study may be the MODIS data themselves and their coarse spatial resolution (500 m/pixel). It should be noted, however, that work is underway to improve these data [41], but their quality is still insufficient for conducting local-scale studies, including those in protected areas.
There are less common indicators that have been actively researched in recent years. For example, dry matter productivity (DMP) and gross dry matter productivity (GDMP). Dry matter productivity (DMP) is a vegetation productivity indicator representing the rate of dry matter (biomass) accumulation by vegetation per unit area over a specific time period [6,42]. The dry matter productivity product has a resolution of 300 m; however, it is calculated on the basis of different methodological principles, unlike gross primary production (GPP) and net primary production (NPP), which precludes direct comparison among them.
A prospect for further research is to expand the dataset used in this study and to analyze long-term temporal trends of these time series using the Hurst exponent, as shown in works [43,44] using the example of NDVI values. This will not only improve the accuracy of detecting stable patterns and fractal characteristics of time series but also provide a deeper understanding of the dynamics of processes associated with changes in natural and anthropogenic systems. In particular, expanding the dataset by incorporating additional sources, such as high-resolution satellite observations, meteorological indices and socio-economic data, can contribute to the identification of hidden correlations and cause-and-effect relationships. Further research may also be directed at developing adaptive algorithms that take into account the specificities of regional data, thereby ensuring more accurate modeling and forecasting of trends under global environmental change.
It must be acknowledged that the use of MOD17A2H products is subject to certain uncertainties, which may have influenced the obtained CUE estimates. When interpreting these results, the methodological limitation inherent in calculating CUE as a direct NPP/GPP ratio derived from standard MODIS products should be taken into account. Although these data have undergone standard preprocessing, we recognize that they are not free from accumulated uncertainties arising at every stage—from the atmospheric correction of spectral signals to the implementation of the productivity retrieval algorithm itself. In this study, we attempted to minimize the impact of artifacts by excluding coastal pixels from the analysis, where land-based algorithms exhibit systematic errors. However, as has been duly noted, this approach does not entirely eliminate the noise component, as the CUE calculation did not incorporate a formal error propagation procedure accounting for the quality assurance (QA) flags of the original MODIS data.
The novelty of this study lies in generating the first spatially explicit, 25-year (2001–2025) dataset of GPP and NPP for study region. By integrating remote sensing techniques with geoinformatics modeling, we have, for the first time, conducted a systematic assessment of the GPP and NPP of the vegetation cover across southeastern Crimea. Prior to this, systematic assessments of these indicators for the region, particularly those using modern satellite data and regional calibrated models, were carried out only sporadically and irregularly. The sub-Mediterranean landscapes of Crimea serve as a critical benchmark for understanding how productivity and CUE respond in transitional ecosystems situated at the very edge of their climatic range, especially under intensifying aridification. Regional-scale GPP and NPP estimates remain critically underexplored for such ecologically sensitive territories. Our novelty is further underscored by the conceptual value of comparing energetic costs and CUE between undisturbed mesophytic forests and anthropogenically simplified landscapes that coexist within the same rugged topography. That said, the authors recognize that further field campaigns are essential to rigorously validate and compare these satellite-derived retrievals against in situ measurements. The results obtained are of interest for the environmental monitoring of specially protected natural areas, assessing the regional carbon balance, forecasting the response of plant communities to climate change, and developing biodiversity conservation measures under the conditions of increasing aridization of southeastern Crimea.
5. Conclusions
The application of remote sensing methods and geoinformation modeling has for the first time enabled a systematic assessment of gross and net primary production of the vegetation cover of southeastern Crimea for the period 2001–2025. It is established that the mean gross primary production (GPP) for the entire region is 1.13 kg C m−2 per year, and net primary production (NPP) is 0.61 kg C m−2 per year, with the maximum values for both indices recorded in 2004, and the minimum values in 2013. No long-term trend toward an increase or decrease in productivity is identified, although moderate interannual fluctuations are observed. The most productive communities are natural forest communities (oak forests with hornbeam and ash, beech forests), whereas anthropogenically transformed landscapes (orchards, vineyards, croplands) show values 2–3 times lower. Carbon use efficiency averages 0.54, which is higher than global values for forests; maximum efficiency is characteristic of agrocoenoses and steppes, while minimum efficiency is observed for mesophytic forests due to high respiration costs. Analysis of climatic factors reveals a positive correlation of productivity with precipitation amount and a negative correlation with air temperature; in 2020, anomalously low GPP and NPP values were recorded, indicating severe vegetation stress. The novelty of this work lies in the creation of the first 25-year series of spatially distributed data on GPP and NPP for this territory. The results can be used for evaluating the effectiveness of conservation measures and monitoring the state of ecosystems under climate change. The main limitation is the spatial resolution of MODIS data (500 m), which requires caution when interpreting results at the local level.
Author Contributions
Conceptualization, V.T. and A.N.; methodology, V.T.; software, V.T.; validation, V.T.; formal analysis, V.T.; investigation, V.T.; resources, V.T.; data curation, V.T.; writing—original draft preparation, V.T., A.D., P.D., O.P., A.N., C.N.P., N.B., M.S., E.P., A.R. and I.K.; writing—review and editing, V.T., A.D., P.D., O.P., A.N., C.N.P., N.B., M.S., E.P., A.R. and I.K.; visualization, V.T.; supervision, V.T.; project administration, V.T. All authors have read and agreed to the published version of the manuscript.
Funding
This work was conducted within the framework of the state assignment of the T.I. Vyazemsky Karadag Scientific Station–Nature Reserve of RAS–Branch of A.O. Kovalevsky Institute of Biology of the Southern Seas of RAS, on the topic “Spatial and temporal variability of the carbon cycle in the landscapes of southeastern Crimea: comprehensive analysis and modeling” (State Registration Number 125061006869-4).
Institutional Review Board Statement
Not applicable.
Informed Consent Statement
Not applicable.
Data Availability Statement
The original contributions presented in this study are included in the article. Further inquiries can be directed to the corresponding author.
Conflicts of Interest
The authors declare no conflicts of interest.
Abbreviations
The following abbreviations are used in this manuscript:
| GPP | gross primary production |
| NPP | net primary production |
| CUE | carbon use efficiency |
| GEE | Google Earth Engine |
References
- Friedlingstein, P.; Le Quéré, C.; O’sUllivan, M.; Hauck, J.; Landschützer, P.; Luijkx, I.T.; Li, H.; van der Woude, A.; Schwingshackl, C.; Pongratz, J.; et al. Emerging climate impact on carbon sinks in a consolidated carbon budget. Nature 2025, 649, 98–103. [Google Scholar] [CrossRef] [Scilit] [PubMed]
- Friedlingstein, P.; O’SUllivan, M.; Jones, M.W.; Andrew, R.M.; Hauck, J.; Landschützer, P.; Le Quéré, C.; Li, H.; Luijkx, I.T.; Olsen, A.; et al. Global Carbon Budget 2024. Earth Syst. Sci. Data 2025, 17, 965–1039. [Google Scholar] [CrossRef] [Scilit]
- O’SUllivan, M.; Friedlingstein, P.; Sitch, S.; Pongratz, J.; Schwingshackl, C.; Gasser, T.; Ciais, P.; Arora, V.; Kato, E.; Knauer, J.; et al. An improved approach to estimate the natural land carbon sink. npj Clim. Atmos. Sci. 2026, 9, 29. [Google Scholar] [CrossRef] [Scilit]
- Keck, F.; Peller, T.; Alther, R.; Barouillet, C.; Blackman, R.; Capo, E.; Chonova, T.; Couton, M.; Fehlinger, L.; Kirschner, D.; et al. The Global Human Impact on Biodiversity. Nature 2025, 641, 395–400. [Google Scholar] [CrossRef] [Scilit] [PubMed]
- Díaz, S.; Settele, J.; Brondízio, E.S.; Ngo, H.T.; Agard, J.; Arneth, A.; Balvanera, P.; Brauman, K.A.; Butchart, S.H.M.; Chan, K.M.A.; et al. Pervasive Human-Driven Decline of Life on Earth Points to the Need for Transformative Change. Science 2019, 366, eaax3100. [Google Scholar] [CrossRef] [Scilit] [PubMed]
- Frank, T.; Junior, C.A.D.S.; Teodoro, P.E.; de Oliveira-Júnior, J.F.; Bennett, J.; Guo, X. Using the dry matter productivity model as an estimator of biomass production in native grassland communities. Remote Sens. Appl. Soc. Environ. 2024, 37, 101441. [Google Scholar] [CrossRef] [Scilit]
- Pan, S.; Tian, H.; Dangal, S.R.S.; Ouyang, Z.; Tao, B.; Ren, W.; Lu, C.; Running, S. Modeling and Monitoring Terrestrial Primary Production in a Changing Global Environment: Toward a Multiscale Synthesis of Observation and Simulation. Adv. Meteorol. 2014, 2014, 1–17. [Google Scholar] [CrossRef] [Scilit]
- Gómez-Giráldez, P.J.; Cristóbal, J.; Nieto, H.; García-Díaz, D.; Díaz-Delgado, R. Validation of Gross Primary Production Estimated by Remote Sensing for the Ecosystems of Doñana National Park through Improvements in Light Use Efficiency Estimation. Remote Sens. 2024, 16, 2170. [Google Scholar] [CrossRef] [Scilit]
- Martínez, B.; Sánchez-Ruiz, S.; Campos-Taberner, M.; García-Haro, F.J.; Gilabert, M.A. Exploring Ecosystem Functioning in Spain with Gross and Net Primary Production Time Series. Remote Sens. 2022, 14, 1310. [Google Scholar] [CrossRef] [Scilit]
- Mehmood, K.; Anees, S.A.; Rehman, A.; Rehman, N.U.; Muhammad, S.; Shahzad, F.; Liu, Q.; Alharbi, S.A.; Alfarraj, S.; Ansari, M.J.; et al. Assessment of climatic influences on net primary productivity along elevation gradients in temperate ecoregions. Trees For. People 2024, 18, 100657. [Google Scholar] [CrossRef] [Scilit]
- Liao, Z.; Zhou, B.; Zhu, J.; Jia, H.; Fei, X. A Critical Review of Methods, Principles and Progress for Estimating the Gross Primary Productivity of Terrestrial Ecosystems. Front. Environ. Sci. 2023, 11, 1093095. [Google Scholar] [CrossRef] [Scilit]
- Loescher, H.W.; Law, B.E.; Mahrt, L.; Hollinger, D.Y.; Campbell, J.; Wofsy, S.C. Uncertainties in, and interpretation of, carbon flux estimates using the eddy covariance technique. J. Geophys. Res. Atmos. 2006, 111, D21S90. [Google Scholar] [CrossRef] [Scilit]
- Campioli, M.; Malhi, Y.; Vicca, S.; Luyssaert, S.; Papale, D.; Peñuelas, J.; Reichstein, M.; Migliavacca, M.; Arain, M.A.; Janssens, I.A. Evaluating the convergence between eddy-covariance and biometric methods for assessing carbon budgets of forests. Nat. Commun. 2016, 7, 13717. [Google Scholar] [CrossRef] [Scilit] [PubMed]
- Riederer, M.; Serafimovich, A.; Foken, T. Net ecosystem CO2 exchange measurements by the closed chamber method and the eddy covariance technique and their dependence on atmospheric conditions. Atmos. Meas. Tech. 2014, 7, 1057–1064. [Google Scholar] [CrossRef] [Scilit]
- Ohtsuka, T.; Akiyama, T.; Hashimoto, Y.; Inatomi, M.; Sakai, T.; Jia, S.; Mo, W.; Tsuda, S.; Koizumi, H. Biometric based estimates of net primary production (NPP) in a cool-temperate deciduous forest stand beneath a flux tower. Agric. For. Meteorol. 2005, 134, 27–38. [Google Scholar] [CrossRef] [Scilit]
- Neumann, M.; Ukonmaanaho, L.; Johnson, J.; Benham, S.; Vesterdal, L.; Novotný, R.; Verstraeten, A.; Lundin, L.; Thimonier, A.; Michopoulos, P.; et al. Quantifying Carbon and Nutrient Input from Litterfall in European Forests Using Field Observations and Modeling. Glob. Biogeochem. Cycles 2018, 32, 784–798. [Google Scholar] [CrossRef] [Scilit]
- Liu, X.; Dong, W.; Wood, J.D.; Wang, Y.; Li, X.; Zhang, Y.; Hu, C.; Gu, L. Aboveground and belowground contributions to ecosystem respiration in a temperate deciduous forest. Agric. For. Meteorol. 2022, 314, 108807. [Google Scholar] [CrossRef] [Scilit]
- Tabunshchik, V.; Gorbunov, R.; Gorbunova, T. Anthropogenic Transformation of the River Basins of the Northwestern Slope of the Crimean Mountains (The Crimean Peninsula). Land 2022, 11, 2121. [Google Scholar] [CrossRef] [Scilit]
- Yu, D.; Fang, C. Urban Remote Sensing with Spatial Big Data: A Review and Renewed Perspective of Urban Studies in Recent Decades. Remote Sens. 2023, 15, 1307. [Google Scholar] [CrossRef] [Scilit]
- Tabunshchik, V.A.; Gorbunov, R.V. Otsenka Geoekologicheskogo Sostoyaniya Basseynov Rek Severo-Zapadnogo Sklona Krymskikh Gor (Assessment of the Geoecological State of the River Basins of the Northwestern Slope of the Crimean Mountains); IT “ARIAL”: Simferopol, Russia, 2025; 224p. (In Russian) [Google Scholar]
- Qi, S.; Zhang, H.; Zhang, M. Net Primary Productivity Estimation of Terrestrial Ecosystems in China with Regard to Saturation Effects and Its Spatiotemporal Evolutionary Impact Factors. Remote Sens. 2023, 15, 2871. [Google Scholar] [CrossRef] [Scilit]
- Li, M.; Zhu, Z.; Ren, W.; Wang, Y. Predicting Gross Primary Productivity under Future Climate Change for the Tibetan Plateau Based on Convolutional Neural Networks. Remote Sens. 2024, 16, 3723. [Google Scholar] [CrossRef] [Scilit]
- Zhang, Y.; Zhao, W.; Yang, J. Spatiotemporal Dynamics of Vegetation Net Primary Productivity (NPP) and Multiscale Responses of Driving Factors in the Yangtze River Delta Urban Agglomeration. Sustainability 2025, 17, 6119. [Google Scholar] [CrossRef] [Scilit]
- Gorbunov, R.; Tabunshchik, V.; Gorbunova, T.; Safonova, M. Water Balance Components of Sub-Mediterranean Downy Oak Landscapes of Southeastern Crimea. Forests 2022, 13, 1370. [Google Scholar] [CrossRef] [Scilit]
- Gorbunov, R.V.; Safonova, M.S.; Tabunshchik, V.A.; Gorbunova, T. Functioning of Low-Mountain Sub-Mediterranean Forest Landscapes (on the Example of South-Eastern Crimea); IT ARIAL: Simferopol, Russia, 2023; 148p. [Google Scholar]
- Running, S.; Mu, Q.; Zhao, M. MOD17A2H MODIS/Terra Gross Primary Productivity 8-Day L4 Global 500 m SIN Grid V061; NASA EOSDIS Land Processes DAAC: Sioux Falls, SD, USA, 2021. [CrossRef]
- Running, S.; Zhao, M. MOD17A3HGF MODIS/Terra Net Primary Production Gap-Filled Yearly L4 Global 500 m SIN Grid V061; NASA EOSDIS Land Processes DAAC: Sioux Falls, SD, USA, 2021. [CrossRef]
- Li, G.; Yi, Z.; Qian, T.; Chang, Y.; Gao, H.; Yu, F.; Han, L.; Lu, Y.; Zuo, K. Synergistic Effects of Drivers on Spatiotemporal Changes in Carbon and Water Use Efficiency in Irrigated Cropland Ecosystems. Agronomy 2025, 15, 1500. [Google Scholar] [CrossRef] [Scilit]
- Marchi, M.; Castellanos-Acuna, D.; Hamann, A.; Wang, T.; Ray, D.; Menzel, A. ClimateEU, Scale-Free Climate Normals, Historical Time Series, and Future Projections for Europe. Sci. Data 2020, 7, 428. [Google Scholar] [CrossRef] [Scilit] [PubMed]
- Funk, C.; Peterson, P.; Landsfeld, M.; Pedreros, D.; Verdin, J.; Shukla, S.; Husak, G.; Rowland, J.; Harrison, L.; Hoell, A.; et al. The Climate Hazards Infrared Precipitation with Stations—A New Environmental Record for Monitoring Extremes. Sci. Data 2015, 2, 150066. [Google Scholar] [CrossRef] [Scilit] [PubMed]
- Waring, R.H.; Landsberg, J.J. Net Primary Production of Forests: A Constant Fraction of Gross Primary Production? Tree Physiol. 1998, 18, 129–134. [Google Scholar] [CrossRef] [Scilit] [PubMed]
- Landsberg, J.J.; Waring, R.H. A Generalised Model of Forest Productivity Using Simplified Concepts of Radiation-Use Efficiency, Carbon Balance and Partitioning. For. Ecol. Manag. 1997, 95, 209–228. [Google Scholar] [CrossRef] [Scilit]
- Monteith, J.L. Solar Radiation and Productivity in Tropical Ecosystems. J. Appl. Ecol. 1972, 19, 747–766. [Google Scholar] [CrossRef] [Scilit]
- Zuo, C.; Wang, J.; Zhang, X.; Watson, A.E. Accelerated Vegetative Growth Measured by Gross Primary Productivity in China from 1980 to 2018. Ecol. Indic. 2023, 154, 110704. [Google Scholar] [CrossRef] [Scilit]
- Zhang, W.; Luo, G.; Hamdi, R.; Ma, X.; Li, Y.; Yuan, X.; De Maeyer, P. Can Gross Primary Productivity Products Be Effectively Evaluated in Regions with Few Observation Data? GISci. Remote Sens. 2023, 60, 2213489. [Google Scholar] [CrossRef] [Scilit]
- Zhang, Y.; Huang, K.; Zhang, T.; Zhu, J.; Di, Y. Soil nutrient availability regulated global carbon use efficiency. Glob. Planet. Change 2019, 173, 47–52. [Google Scholar] [CrossRef] [Scilit]
- Xia, J.; McGuire, A.D.; Lawrence, D.; Burke, E.; Chen, G.; Chen, X.; Delire, C.; Koven, C.; MacDougall, A.; Peng, S.; et al. Terrestrial Ecosystem Model Performance in Simulating Productivity and Its Vulnerability to Climate Change in the Northern Permafrost Region. J. Geophys. Res. Biogeosci. 2017, 122, 430–446. [Google Scholar] [CrossRef] [Scilit]
- Isik, M.S.; Parente, L.; Consoli, D.; Sloat, L.; Mesquita, V.V.; Ferreira, L.G.; Sabbatini, S.; Stanimirova, R.; Teles, N.M.; Robinson, N.; et al. Light Use Efficiency (LUE) Based Bimonthly Gross Primary Productivity (GPP) for Global Grasslands at 30 m Spatial Resolution (2000–2022). PeerJ 2025, 13, e19774. [Google Scholar] [CrossRef] [Scilit] [PubMed]
- Chen, M.; Rafique, R.; Asrar, G.R.; Bond-Lamberty, B.; Ciais, P.; Zhao, F.; O Reyer, C.P.; Ostberg, S.; Chang, J.; Ito, A.; et al. Regional Contribution to Variability and Trends of Global Gross Primary Productivity. Environ. Res. Lett. 2017, 12, 105005. [Google Scholar] [CrossRef] [Scilit]
- Sun, R.; Wang, J.; Xiao, Z.; Zhu, A.; Wang, M.; Yu, T. Estimation of Global Net Primary Productivity from 1981 to 2018 with Remote Sensing Data. In Proceedings of the IGARSS 2020—2020 IEEE International Geoscience and Remote Sensing Symposium, Virtual, 26 September–2 October 2020; pp. 4331–4334. [Google Scholar] [CrossRef] [Scilit]
- Yu, T.; Sun, R.; Xiao, Z.; Zhang, Q.; Wang, J.; Liu, G. Generation of High Resolution Vegetation Productivity from a Downscaling Method. Remote Sens. 2018, 10, 1748. [Google Scholar] [CrossRef] [Scilit]
- Kerimbay, B.S.; Musabayeva, M.N.; Kerimbay, N.N. Opredeleniye Produktivnosti Biomassy Rastitel’nosti Basseyna Reki Sharyn (Determination of Vegetation Biomass Productivity of the Sharyn River Basin). Gidrometeorol. Ekol. 2021, 1, 72–80. (In Russian) [Google Scholar]
- Wang, J.; Zhao, J.; Zhou, P.; Li, K.; Cao, Z.; Zhang, H.; Yuan, X. Study on the Spatial and Temporal Evolution of NDVI and Its Driving Mechanism Based on Geodetector and Hurst Indexes: A Case Study of the Tibet Autonomous Region. Sustainability 2023, 15, 5981. [Google Scholar] [CrossRef] [Scilit]
- Wang, H.; Wang, F.; Lv, H.; Yu, Z. Analysis of spatiotemporal variations and driving forces of NDVI based on random forest and Geodetector: A case study of the Heihe river basin in China. Ecol. Indic. 2026, 184, 114710. [Google Scholar] [CrossRef] [Scilit]

Disclaimer/Publisher’s Note: The statements, opinions and data contained in all publications are solely those of the individual author(s) and contributor(s) and not of MDPI and/or the editor(s). MDPI and/or the editor(s) disclaim responsibility for any injury to people or property resulting from any ideas, methods, instructions or products referred to in the content. |
© 2026 by the authors. Licensee MDPI, Basel, Switzerland. This article is an open access article distributed under the terms and conditions of the Creative Commons Attribution (CC BY) license.