Abstract
Croatia’s tourism market is highly exposed to digital platforms and peer-to-peer information flows, yet evidence on how Croatian users differentiate between promotional formats (digital channels, agency websites, traditional media and word-of-mouth) remains fragmented and rarely translated into actionable priorities. This study aims to identify the underlying dimensions of perceived promotional influence and to prioritize promotional formats for destination choice in Croatia by integrating PCA and the Analytic Hierarchy Process (AHP). An online survey (N = 299) was used to extract promotional dimensions via PCA and to test group differences by gender, age and primary information source, while AHP translated expert judgments into a comparative priority structure. Results consistently indicate that word-of-mouth is the most persuasive driver of destination choice, but its perceived importance varies significantly across demographic segments and information-source profiles. Younger respondents place greater emphasis on digital channels (especially social media and travel agency websites), whereas older respondents show higher reliance on traditional formats. The combined PCA–AHP approach provides a structured bridge between user perceptions and managerial prioritization, offering segment-specific guidance for more efficient allocation of promotional resources in Croatian destination marketing.
1. Introduction
Tourism represents one of the most important economic sectors in Croatia, characterized by strong international visibility, pronounced seasonality, and increasing competitive pressure among Mediterranean destinations. In such an environment, destination promotion is no longer defined solely by the volume of communication activities, but by their perceived credibility, relevance, and effectiveness among different segments of tourists. Croatian destination managers are therefore faced with a strategic challenge: how to allocate limited promotional resources across traditional media, digital platforms, intermediaries, and interpersonal communication in a way that maximizes destination choice and long-term competitiveness.
In an increasingly saturated global tourism market, the ability of destinations to stand out hinges more than ever on the effectiveness of their promotional strategies. Sustainable local food and drink, health-related services, and entertainment are pivotal attributes that influence responsible tourists’ choices (Gallardo-Vázquez, 2023). As traditional forms of advertising lose ground, modern promotional approaches, particularly those rooted in digital platforms and personal recommendations, are becoming central to influencing tourist behavior. The shift from conventional media to social media and other interactive channels reflects broader changes in how consumers engage with information and make travel decisions. Studies by Ray (2022) and Sarker and Dash (2024) emphasize that digital transformation allows for more authentic and dynamic communication between destinations and potential tourists, fostering deeper emotional engagement and trust.
Although previous studies have extensively documented the growing importance of digital platforms and the credibility of word-of-mouth communication, empirical evidence remains fragmented when it comes to understanding how tourists simultaneously evaluate multiple promotional formats. Most existing research examines individual channels in isolation or focuses on single outcome variables such as visit intention, without capturing the combined roles of perceived influence, trust, and accurate information. Moreover, within the Croatian tourism context, there is a lack of studies that move beyond descriptive assessments and translate user perceptions into clear promotional priorities relevant for strategic decision-making.
Digital storytelling, video-sharing apps like TikTok, and interactive platforms such as WeChat and Baidu Baijia have revolutionized the way destinations are marketed. Research by Lei and Gao (2022) shows that these tools significantly increase both tourist visits and destination revenues. In the context of Southeast Europe, Dramićanin et al. (2023) found that platforms like TikTok have a particularly strong influence on Millennials and Gen Z in their travel planning and inspiration phases. This highlights the need for destinations to adapt their promotional efforts not only to new media but also to evolving audience expectations.
However, modern tourism promotion goes beyond technological novelty. Word-of-mouth (WoM) remains a highly credible source of influence, often surpassing formal advertising in shaping destination image and traveler intentions. According to Govers et al. (2007), personal experience and peer recommendations are often more influential than official campaigns. Similarly, Solomon et al. (2022) argues that narrative-based promotion, particularly when rooted in local culture and identity, can enhance emotional bonds between tourists and destinations. Moreover, in times of uncertainty or crisis, as Xu et al. (2020) demonstrated, word-of-mouth becomes a key mediator between perceived destination image and tourist behavior, helping restore confidence and drive visitation.
This study addresses these gaps by combining Principal Component Analysis (PCA) and the Analytic Hierarchy Process (AHP) to examine destination promotion from both the users’ and decision-makers’ perspectives. While PCA is employed to identify and validate the underlying dimensions of promotional influence among Croatian tourists, AHP is used to translate these dimensions into a structured priority model that supports strategic promotional decision-making. The novelty of this approach lies not in confirming the importance of word-of-mouth, but in integrating perception-based evidence with a multi-criteria prioritization framework, while simultaneously accounting for differences related to age, gender, and primary information sources.
In this context, analyzing the impact of various promotional channels on tourist decision-making is not just timely but essential. The Croatian tourism sector, while well-developed, faces similar challenges as other destinations in adapting to this media and behavioural shift. By exploring different forms of promotion and their perceived influence, trustworthiness, and accuracy, this study aims to offer evidence-based and segment-sensitive insights relevant for tourism marketers, destination managers, and policymakers in the Croatian tourism context.
2. Literature Review
2.1. The Role of Promotion in the Selection of a Tourist Destination
Promotion is a key component of tourism marketing, as it shapes the perception of a destination, increases its visibility, and influences tourists’ decisions when choosing a place to travel. Through various forms of promotion, destinations position themselves in a competitive market and attract the attention of potential visitors. Y. Li et al. (2021) emphasizes that a combination of promotional elements, such as information about the destination, cultural attractions, and sustainability, strongly influences the formation of a positive destination image. In the same vein, Kennedy et al. (2023) recommend the development of unique tourism products and targeted promotion as ways to increase competitiveness in both domestic and international markets. In the context of developing countries, the example of Cameroon shows that promotion often relies on traditional media such as television, leaflets, and roadshows. However, despite efforts, challenges such as negative perceptions, limited resources, and a lack of infrastructure significantly hinder promotional activities (Bishar & Roberetine, 2023).
Setegn and Japee (2025) point out that public relations are a powerful intermediary tool that enhances the effects of promotional activities, while Guo et al. (2024) stress that abstract advertising-based on emotions and tourist identification with the destination’s image-has a greater impact on visit intention than concrete advertising. An important aspect of successful promotion is strategic planning and integrated communication between all stakeholders, as confirmed by Sotiriadis (2021) and Ali (2021). Danylyshyn et al. (2020) further emphasizes an integrated approach that includes the development of tourism products, infrastructure, and promotion through cross-sector collaboration.
In the digital era, visual content and user engagement via the internet have become key promotional tools. Afren (2024) and Ghorbani et al. (2023) highlight that visual element, such as attractive photographs, strongly influence tourist interest and their perception of a destination. On the other hand, Adam et al. (2023) reveals that marketing strategies themselves do not necessarily have a direct impact on tourism appeal, but certain elements of strategy improve destination perception, especially when based on unique natural and cultural resources. Destination branding is also a crucial step for building market recognition. Pogrebova and Ulyanchenko (2020) underline the importance of slogans and a clear brand strategy, while Islam (2021) adds that social media—enabling two-way communication and experience sharing, enhances destination visibility and influences tourist decisions. Technological advancements are further transforming tourism promotion. Artificial intelligence brings content personalization, predictive analytics, and improved user experience, significantly increasing the effectiveness of marketing activities (Bulchand-Gidumal et al., 2023).
Destination attractiveness, service quality, and image are especially important in semi-urban and rural areas, as highlighted by the research of Chin et al. (2020). Positive evaluations of service quality significantly enhance consumer perceptions of top hotels, as reflected in the sentiment polarity of online reviews, underscoring the critical role of service excellence in shaping customer attitudes in the Visegrad Group countries (Stefko et al., 2020). Ortaleza and Mangali (2021) identify key factors influencing travel decisions, including accommodation, storytelling, and accessibility. Traditional media still plays an important role. Abdelaziz (2023) shows how printed brochures, and promotional magazines can effectively shape a desirable destination image, as seen in the case of Egypt. However, Kwabi et al. (2023) warn that increased media attention in more developed regions may also lead to socioeconomic inequalities, particularly between urban and rural areas.
2.2. The Impact of Digital Media and Social Networks on Tourist Behavior
In today’s world, digital media and social networks play a key role in shaping tourist behavior. Visual content, reviews, recommendations, and authentic user experiences strongly influence destination choices. Research confirms that marketing activities on social networks, particularly Instagram, have a positive impact on the intention to visit specific locations (Fitri et al., 2023). Beyond mere presence on social platforms, visual elements and user comments are crucial, as positive or negative reviews can significantly shape potential visitors’ perceptions (Wibisono & Lale, 2024).
Destination marketing organizations increasingly use social media to showcase cultural, natural, and gastronomic features of destinations, influencing place image and tourist motivation (Kumar et al., 2021; Fatima et al., 2024; Agyapong & Yuan, 2022). This approach complements user-generated content, which becomes a source of trust and inspiration. Destination advocacy by users, the creation of a positive brand impression, and a sense of community are key success factors in digital tourism marketing (Deb & Mallik, 2023). Particularly during periods of uncertainty, such as the COVID-19 pandemic, digital platforms and adaptable marketing strategies proved crucial for the recovery of the tourism sector (Toubes et al., 2021). Digital technologies have enabled direct, personalized, and interactive communication between destinations and users, significantly transforming patterns of tourism promotion (Chen, 2020). Investments in digital campaigns, especially in advertising and the creation of visually appealing content, have led to increased tourism demand and sustained interest during crisis periods (Florido-Benítez, 2024). Audiovisual content such as films and TV series further shapes destination perceptions, highlighting the need for interdisciplinary research that connects media and tourism (Nieto-Ferrando et al., 2021).
Short videos and promotional content have a particularly strong impact, as their authority, emotional component, and appeal stimulate user emotions and travel decisions (Jiang et al., 2022; Wang and Han, 2022; Guerrero-Rodríguez et al., 2020; Dias & Lavaredas, 2024). The use of popular TV shows in promoting destinations further confirms this influence—the series Game of Thrones had a lasting positive effect on tourism performance in Spain, Croatia, and Malta (Contu & Pau, 2022). The visual aesthetics of destinations portrayed on screen play a decisive role in creating positive impressions and travel decisions (Deng et al., 2021). A similar influence is observed in video games featuring real-world locations. Players develop emotional connections with virtual environments, which can translate into interest in visiting the actual locations featured in the games (Shuhua et al., 2024). Despite the strong influence of digital platforms, traditional media such as television, radio, and print still play a significant role, especially in rural areas with limited internet access (Madonado et al., 2019). However, their effectiveness is considerably lower among younger generations of tourists, who rely more on digital sources (Hussain et al., 2024). Media content, especially TV shows and films, strongly impacts the formation of a positive image of a destination. It fosters emotional connections between viewers and the depicted locations, enhancing their attractiveness (Hua et al., 2021). Watching travel shows positively affects viewing satisfaction, the feeling of presence, and attitudes toward the locations shown (Nieto-Ferrando et al., 2024), while par-asocial relationships between viewers and media personalities increase the likelihood of travel decisions (Tkalec et al., 2017). Awareness of the location, along with motivation, are also key factors influencing visits to destinations featured in popular series (Vila et al., 2021).
Mass media, such as television and radio, still serve an important informational function, particularly in raising awareness of tourist destinations and sparking public interest (Enemuo & Amaechi, 2015). Interestingly, music can also have promotional value, popular songs associated with specific locations create mental images and emotions that encourage positive perceptions and increase visit intentions (Yin et al., 2020). On the other hand, specific communication strategies, such as the use of cognitive language on Facebook, can increase eWOM and user engagement (Silva et al., 2020).
Social networks also serve as platforms for promoting sustainable tourism practices, encouraging responsible behavior among tourists (Chatterjee & Dsilva, 2021; Alzaydi & Elsharnouby, 2023). Studies show that digital media significantly influence user perception and behavior, shaping their decisions toward sustainability, economic development, and cultural heritage preservation (Majeed & Gupta, 2024). A study from Portugal specifically highlights those online platforms strongly influence destination choice and enhance their attractiveness (Esteves et al., 2022). The effectiveness of social networks varies depending on the type of attraction and audience. Instagram has proven most effective for natural destinations, YouTube for cultural content, while Twitter has considerably less impact (Suryana et al., 2024). Through digital marketing and active stakeholder involvement, it is possible to build a strong destination image and increase visibility in the global market (Armutcu et al., 2023; de las Heras-Pedrosa et al., 2020). Decision-makers are increasingly recognizing the importance of websites, smart technologies, and digital tools for promoting cultural attractions, thereby enhancing competitiveness in the modern tourism landscape (Florčić et al., 2023).
2.3. Word-of-Mouth Promotion and Emotional Factors in the Decision-Making Process for Choosing a Tourist Destination
In the contemporary tourism context, word-of-mouth (WOM) promotion, especially its electronic form (e-WOM), increasingly influences tourist behavior and their decision-making when selecting destinations. Electronic word-of-mouth, due to its rapid dissemination and accessibility, has a far-reaching impact on the image of a destination, while traditional WOM retains a positive but weaker effect (Siang et al., 2020). Numerous studies confirm that authentic, visually appealing content on social media—often created by influencers—significantly shapes the perception of potential tourists (Hernández-Méndez & Baute-Díaz, 2023).
Tourist satisfaction, service quality, and emotional connection with a destination directly affect their willingness to share positive experiences, which in turn increases interest among others to visit (Taheri et al., 2021; López et al., 2022). Through e-WOM, tourists express their impressions and experiences in an online environment, where elements such as source credibility, perceived value, and attachment to the destination play a crucial role in visit intention (Luong, 2024; Setiawan et al., 2021).
Atmospheric factors of a destination, such as cultural features, spatial aesthetics, and ambiance, strongly influence tourists’ emotions and thus their readiness to share recommendations (Loureiro et al., 2020; Nieves-Pavón et al., 2024). Positive emotions encourage the spread of favorable WOM, whereas negative experiences may reduce the desire to share. At the same time, visual content and reviews on platforms like TikTok further increase travel intention, confirming the power of digital emotions (Zhou et al., 2022). The role of the local population in creating a positive image of a destination is also important. Friendliness of local people and the natural beauty of a destination significantly contribute to the generation of positive WOM among visitors (Meenakshy et al., 2024). Residents’ perception of tour-ism benefits also increases their willingness to promote the destination through personal recommendations (Blasco López et al., 2020; Šerić et al., 2022).
Online reviews, especially positive ones, influence expectations and behavior of potential tourists, and their effectiveness increases with the credibility of the source and the quality of the e-WOM communication (Akhi et al., 2023). However, some studies suggest that the quality of e-WOM alone does not necessarily lead to visit intention if it is not mediated by the destination’s image (Rahjasa et al., 2023). On the other hand, negative reviews have a stronger effect on Chinese tourists than on Korean tourists, indicating the need for strategic reputation management (W. Li & Liu, 2022). Cultural experiences further strengthen emotional bonds with a destination and encourage sharing of experiences via social media and digital channels (Nanggong & Mohammad, 2020). In the context of specific tourism niches, positive e-WOM about halal services increases trust and interest among religiously oriented tourists (Warapsari & Rusfian, 2021). Emotional aspects also play a key role in the hospitality sector, where satisfaction with a restaurant and emotional attachment to it significantly influence the intention to recommend it (López et al., 2022). Additionally, tourist satisfaction acts as a moderator between destination perception and behavior, amplifying the effect of WOM (Arismayanti et al., 2024). The alignment of resident identity with the destination and their positive evaluation of the place fosters a greater willingness to promote their own community (Šegota et al., 2021). Positive WOM communication can be further enhanced through authentic and consistent promotional activities that build emotional connection with the audience (Jalees et al., 2023). The COVID-19 pandemic has led to significant shifts in consumer behavior, with psychological factors playing a pivotal role in altering purchasing habits, thereby necessitating adaptable and sustainable business strategies to meet the evolving needs of consumers (Šostar & Ristanović, 2023a). During the COVID-19 pandemic, WOM communication proved even more significant. Trust in local authorities, low risk perception, and perceived tourism benefits influenced residents’ willingness to promote their destination even in times of crisis (Šerić et al., 2022). In this context, studies show that the pan-demic did not diminish the importance of e-WOM, on the contrary, it amplified its influence on shaping destination image (Goyal & Taneja, 2023). In conclusion, word-of-mouth promotion, both traditional and electronic, is largely shaped by emotional factors and the quality of the tourist experience. Authenticity, satisfaction, cultural and religious connection, and engagement of the local population play a crucial role in creating positive impressions and spreading recommendations. Destinations that recognize the importance of these factors can position themselves as desirable, emotionally resonant, and highly competitive in the global tourism market.
3. Materials and Methods
The online survey was conducted between March and May 2025, during the pre-season period of Croatian tourism, allowing respondents to reflect on recent travel experiences and destination planning behavior. The online questionnaire was created and distributed using Google Forms (Google LLC, Mountain View, CA, USA). Statistical analyses, including Principal Component Analysis (PCA), the Kaiser–Meyer–Olkin (KMO) test, Bartlett’s test of sphericity, reliability analysis (Cronbach’s alpha), Spearman’s rank correlation, and non-parametric tests (Mann–Whitney U and Kruskal–Wallis tests), were performed using IBM SPSS Statistics version 26.0 (IBM Corp., Armonk, NY, USA). The Analytic Hierarchy Process (AHP) calculations, including pairwise comparison matrices, eigenvalue computations, consistency index (CI), and consistency ratio (CR), were conducted using Microsoft Excel (Microsoft Corp., Redmond, WA, USA). Drawing on insights from the existing body of literature, this research aims to examine how different forms of promotion influence tourists’ decision-making when selecting a destination. Based on research objectives, the study examines differences in the perceived impact of tourism promotion, the relative importance of word-of-mouth communication, demographic effects, the role of information sources, and interrelationships among promotional formats. The hypotheses of the study are formulated as follows:
H1:
There are statistically significant differences in the perceived impact of different forms of tourism destination promotion on destination choice.
H2:
Word-of-mouth promotion has a significantly stronger influence on destination choice compared to other promotional forms.
H3:
Perceptions of the effectiveness of tourism promotion differ significantly according to gender.
H4:
Perceptions of the effectiveness of tourism promotion differ significantly across age groups.
H5:
Perceptions of promotional effectiveness differ depending on the primary source of information used when choosing a tourist destination.
H6:
There are statistically significant correlations between different forms of tourism destination promotion.
The process of prioritizing the tourist destinations’ promotion in the Croatian tourist offer begins with defining the general context of the tourist offer in which this prioritization will be realized. In the existing environment, like Hammadi et al. (2016), we will arrange the elements for the internal and external environment analysis to set the criteria and parameters for the prioritization process. The tourist offer, like any other system, generates its promotional activities. This requires a systematic approach to prioritizing types of promotions to determine the classes of promotions in Croatia’s overall tourism offering. Such an approach is crucial both in the decision-making process due to the high exposure to making the wrong choice and to allow everyone to recognize different approaches to promotional activities (highlight, hide, update). It is also crucial when deciding whether a type of promotion is acceptable and how directly it can lead a user to make it the best choice for themselves. This paper focuses on establishing the elements of tourist destination promotion. In this section, a promotion evaluation model using the AHP model is presented. The task is to use the model to determine the priorities of promoting tourist destinations as efficiently as possible. The following steps were considered to form an approach to destination promotion priorities (Figure 1): Problem decomposition—the AHP model structuring, Pair comparison—normalized weights determination, Prioritization—individual criteria and sub-criteria, and Synthesis—finding a solution to the problem.
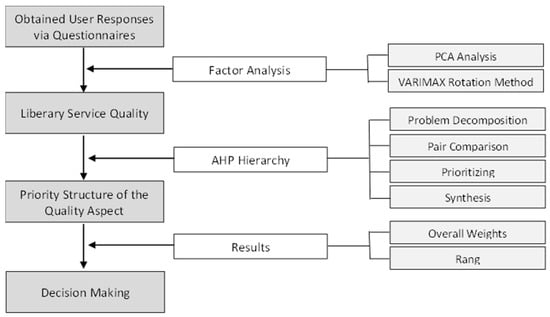
Figure 1.
Outline of the Methodological Procedure.
The questionnaire was distributed via social media platforms, allowing for the collection of responses from a total of 299 participants from Croatia. Out of a total of 299 respondents, 46.82% are male, while 53.18% are female. In terms of age structure, the largest group of respondents is between 26 and 40 years old (38.13%), followed by the 18 to 25 age group (22.74%). The 41 to 55 age group accounts for 27.43%, while 11.71% of respondents are aged 56 and above. Regarding employment status, most respondents are employed (75.92%), while 24.08% are unemployed. In terms of monthly income, 36.79% of respondents earn over 1000 euros, 36.12% earn between 501 and 1000 euros, 13.38% have an income of up to 500 euros, and 13.71% have no income. When it comes to the most important source of information about tourist destinations, 57.19% of respondents primarily use the internet (social media, portals/forums, travel agencies), while 23.41% consider personal recommendations from friends, family, or acquaintances to be the most important source. Television and radio account for 16.72%, while print media represent the smallest share at 2.68%. In terms of influence on the decision to choose a tourist destination, personal recommendations from friends, family, or acquaintances have the greatest impact on 47.49% of respondents, while the internet (social media, portals/forums, travel agencies) influences 45.82% of respondents. Television and radio influence 4.68% and print media influence 2.01% of respondents (Table 1). Exploratory factor analysis with Varimax rotation identified five promotional dimensions. The extracted structure grouped items measuring trust, perceived influence, and informational accuracy across different communication channels. General Destination Promotion encompassed social media and online portals/forums, reflecting respondents’ trust in these platforms, their influence on destination choice, and the perceived accuracy of the information provided (loadings 0.854–0.929). Digital Travel Agency Promotion captured trust in travel agency websites, their influence, and perceived accuracy (0.885–0.894). Word-of-Mouth Promotion included recommendations from friends, family, and acquaintances and demonstrated the strongest loadings (0.935–0.954). Traditional Electronic Media Promotion referred to radio and television (0.926–0.955), while Print Media Promotion covered newspapers, magazines, and other printed publications (0.910–0.943).

Table 1.
Sample Characteristics and Summary of Exploratory Factor Analysis.
The questionnaire consisted of items that measured the perceived influence, trustworthiness, and accuracy of information related to five main forms of promotion: promotion through social media and portals, websites of travel agencies, personal recommendations (WOM), traditional electronic media (TV/radio), and print media. To validate the measurement instrument, a Principal Component Analysis (PCA) with Varimax rotation was performed.
The results of the Principal Component Analysis (PCA) show that the first component has an eigenvalue of 6.721 and explains 37.337% of the total variance in the data, making it the most important component that represents the largest portion of the information contained in the original data. The second component explains an additional 18.835% of the variance, increasing the total percentage of variance explained by the first two components to 56.172%. The third component adds 13.795% of the variance, raising the cumulative variance to 69.968% for the first three components. The fourth component, with 11.910% of the variance, increases the cumulative variance to 81.878%. The fifth component explains an additional 7.660% of the variance, resulting in a total cumulative percentage of 89.538% of the variance explained by the first five components (Table 2).
Table 2.
Initial Eigenvalues from Principal Component Analysis.
The results of the communality analysis show that recommendations from friends, family, and acquaintances have a high communality of 0.892, meaning that 89.2% of the variance of this item is explained by the common factors. Trust in friends, family, and acquaintances when recommending a tourist destination has an even higher communality of 0.923, while the accuracy of information coming from them has a communality of 0.891, indicating a high level of explained variance. Print media also play a significant role, with a communality of 0.845 for their influence on destination choice, trust level of 0.913, and information accuracy of 0.880. Radio and television show similar results, with a communality of 0.879 for their influence, trust at 0.928, and information accuracy at 0.904. Social media has a communality of 0.855 for their influence, trust of 0.891, and information accuracy of 0.895, while portals and forums show an influence communality of 0.869, trust of 0.889, and information accuracy of 0.855. Tourist agency websites show the highest values, with a communality of 0.916 for their influence, trust level of 0.948, and information accuracy of 0.943. All these items exhibit very high communalities, indicating a high degree of variance explained by common factors and confirming the quality of the conducted factor analysis (Table 3). The results of the KMO measure of sampling adequacy and Bartlett’s test of sphericity indicate that the data are highly suitable for factor analysis. The KMO measure is 0.844, which suggests a very good level of sampling adequacy. A value between 0.8 and 1 indicates that the data are very well suited for factor analysis. Bartlett’s test of sphericity, with an approximate chi-square value of 6306.143, degrees of freedom of 153, and a significance level of 0.000, shows that the correlation matrix is significantly different from the identity matrix. This means that the variables are sufficiently correlated to justify factor analysis (Table 4).
Table 3.
Factorability, Communalities and Reliability Statistics.
Table 4.
Spearman’s Correlations Between Promotion Types.
The high KMO value and the significant result of Bartlett’s test confirm that the data are highly appropriate for factor analysis. The results of the principal component analysis after rotation reveal that the variables are grouped into five key components representing different aspects of tourism destination promotion. The first component, labelled General Destination Promotion (GDP), primarily captures promotion through social media and online portals/forums, reflecting user-generated and platform-based digital communication rather than institutionally controlled promotional activities. The term “general” is used to denote the broad, decentralized, and non-intermediated nature of these channels. The high values indicate a significant impact and the perceived accuracy of information from these sources. The second component, associated with digital agency promotion, encompasses items related to trust in and the influence of travel agency websites. These are accompanied by high communalities, indicating their importance in destination promotion (Table 1 and Table 3). Cronbach’s alpha, which measures the internal consistency of variables within each component, shows very high value for all aspects of promotion. Specifically, for general destination promotion, the Cronbach’s alpha value is 0.969, while for digital agency promotion of the destination it is 0.966. Word-of-mouth promotion and promotion via traditional electronic media both have an alpha value of 0.944, while promotion through print media has a slightly lower, but still high value of 0.927. These high Cronbach’s alpha values (greater than 0.70) indicate a very high level of internal consistency and reliability of the measured scale within each component. On the other hand, the K-S test (Kolmogorov-Smirnov test) is used to examine the normality of data distribution. In all cases, the K-S test shows a value of less than 0.001, indicating a statistically significant deviation from a normal distribution. This means that the data distribution for all aspects of promotion significantly deviates from normality (Table 3).
To further investigate the prioritization of different promotional forms, the Analytic Hierarchy Process (AHP) model was applied (a multi-criteria decision-making method based on pairwise comparisons that derive relative priority weights among alternatives). AHP allowed the development of a hierarchical structure comprising five promotional categories as main criteria and 24 sub-criteria (e.g., trust in social media, information accuracy, influence of websites, etc.). Experts in tourism and marketing evaluated the relative importance of each element through pairwise comparisons. The weights of criteria and sub-criteria were calculated, and the consistency of judgments was tested. The AHP approach provided a deeper understanding of the promotional priorities in tourism, offering clear insights into which channels exert the greatest influence on consumer behavior. Research by (Šostar & Ristanović, 2023b) confirms that personal and psychological factors, especially individual budget constraints, are the primary determinants of consumer purchasing behavior, underscoring the need for businesses to tailor their strategies to these dominant influences.
In this research, the AHP method was used to determine the priorities for promoting a tourist destination. The model was developed in the early 1970s by Saaty and is suitable for multi-criteria situations. It represents a practical approach to solving relatively complex problems. Within a hierarchical structure, questions are merely organized through a series of comparisons, rankings, and synthesis of results. The great model flexibility and simplicity make it a favorite tool for decision analysts. It has wide applications in numerous areas, such as management (Vargas, 2010), supply chains (Hammadi et al., 2016; Singh, 2013), agribusiness (Tošović-Stevanović & Ristanović, 2024), marketing (Šostar & Ristanović, 2024), green economy (Ristanović et al., 2024), etc.
The first step involves decomposing the appropriate AHP hierarchy. The structure consists of four levels: target, criteria, sub-criteria, and solutions (Figure 2). The target, i.e., research problem, is to prioritize the promotion of tourist destinations by making decisions regarding tourist travel. In the hierarchical structure, the target is placed at the first level of the hierarchy. At the second level, five strategic promotion frameworks (criteria) are identified to achieve the target from the first level of the hierarchy. The third level of the hierarchy consists of 24 sources of promotion from the five strategic promotion frameworks. The strategic frameworks and their sub-criteria, these two levels of hierarchical structure, are analyzed using the basic AHP approach. Pairwise comparisons are made of elements at each level to each previous element located one level above. The final or fourth level of the hierarchical structure consists of the solutions.
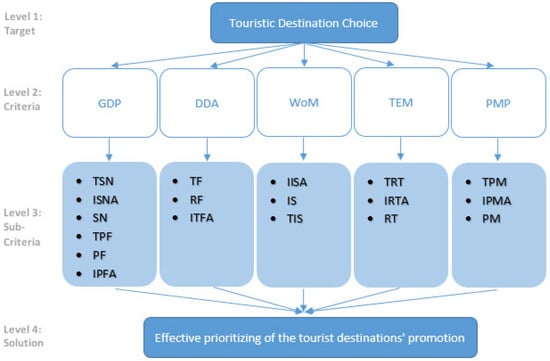
Figure 2.
Hierarchical structure of integrated touristic destination choice. Note: General Destination Promotion—GDP, Digital Destination Agency Promotion—DDA, Word-of-Mouth Promotion—WoM, Traditional Electronic Media Promotion—TEM, Print Media Promotion—PMP, Trust in Social Networks—TSN, Information of Social Networks is Accurate—ISNA, Social Networks—SN, Trust in Portals/Forums—TPF, Portals/Forums—PF, Information of Portals/Forums is Accurate—IPFA, Trust in Friend—TF, Recommendation of Friends—RF, Information of Friends is Accurate—IFA, Information of Internet Sites is Accu-rate—IISA, Internet Sites—IS, Trust in Internet Sites—TIS, Trust in Print Media—TPM, Trust in Radio and Television—TRT, Radio and Television is Accurate—IRTA, Radio and Television—RT, Information of Print Media is Accurate—IPMA, Print Media—PM.
The evaluation process begins with determining the normalized weights for the matrix. To evaluate promotional activities, it is necessary to prioritize the criteria and sub-criteria used in the AHP hierarchy. Based on their relative importance, a pairwise comparison matrix is formed. The comparison pairs are established based on the assessment of a team of experts (two from the fields of marketing and tourism and one from academia), who use Saaty’s nine-point scale (Saaty, 1994). The scale aims to convert human preferences into available alternatives by scaling them equally, moderately, strongly, moderately strongly, and extremely desirable and takes the values of 1, 3, 5, 7, and 9, respectively (Hammadi et al., 2016). The median values between two adjacent values are 2, 4, 6, and 8, which can also be used when a compromise is needed (Singh, 2013). Within the matrix (A = aij), the corresponding reciprocal values 1, 1/2, 1/3, …, 1/9, in the form (A = 1/aij) are used for the reverse comparison. The process of creating the matrix is complex. The importance of one element relative to another is measured from the same or different levels of the hierarchical structure, shown in Figure 2. For example, value 1 is assigned to a pair of elements of equal importance, and so on. A series of reasoning matrices were created, and doubts regarding controversial elements were resolved through discussion between experts. This use of the scale reduces subjectivity in comparison pairs. This is followed by calculating the relative weight of the elements of each hierarchical level for a given element. They are computed as components of the normalized vector linked with the largest eigenvalue of matrix A. The consistency test further includes the eigenvalues, and based on their maximum values (λmax), the consistency index (CI) and, finally, the consistency ratio (CR) are estimated, as shown in Equations (1) and (2).
where RI takes the values 0.58 for 3 elements and 1.24 for 6 elements, which are part of Saaty’s average random index values.
It is an established practice that CR should be less than or equal to 0.1 for each pairwise comparison matrix. Saaty (1994) goes a step further and sets out acceptable CR values for different matrix sizes: 0.05 for a 3 × 3 matrix, 0.08 for a 4 × 4 matrix, and 0.1 for large matrices. If the level of consistency is not within the acceptable range, the weight results are not valid, and the pairwise comparison should be repeated. Adequate use of the AHP procedure can contribute to the consistency of results.
The final phase involves synthesizing solutions for prioritizing the promotion of tourist destinations. It consists of evaluating the global composite priority weight of all sub-criteria by combining them at successive hierarchical levels. It should be acknowledged that the AHP evaluation was based on a limited expert panel (n = 3), which represents a methodological limitation of the study. However, this approach is consistent with prior applications of the AHP method, where a small number of highly knowledgeable experts are considered sufficient for structured pairwise comparisons. The purpose of the AHP analysis in this study was not to statistically generalize expert opinions, but to provide a decision-oriented prioritization framework that complements the perception-based findings obtained from the tourist survey.
4. Results
In this section, the results of the analyses are presented, providing in-sight into the perceptions and prioritization of different forms of tourism promotion. The findings are based on factor analysis, correlation testing, group comparisons, and AHP prioritization, offering a comprehensive overview of the key trends observed in the sample.
Word-of-mouth promotion has a median of 4.00, with an inter-quartile range (IQR) between 3.33 and 5.00, and an overall range from 1.00 to 5.00. This indicates that respondents, on average, rated this form of promotion highly, with a wide distribution of responses. Promotion through print media has a median of 2.67, with an interquartile range between 2.00 and 3.00, while the rating range varies from 1.00 to 5.00. This suggests that respondents consider print media to be less important compared to other forms of promotion, although there is still some variation in responses. Promotion via traditional electronic media has a median of 3.00, with an interquartile range from 3.00 to 4.00 and an overall range from 1.00 to 5.00. This shows that the perception of traditional electronic media as a promotional tool is moderate, with a relatively widespread response. General destination promotion has a median of 3.50, with an interquartile range between 3.00 and 4.00 and a range from 1.00 to 5.00. These results suggest that respondents view general destination promotion as moderately important, with a fair range of responses. Digital agency promotion of destinations has a median of 3.00, with an interquartile range between 2.00 and 3.33, and a range from 1.00 to 5.00. This median indicates that digital agency promotion, while rated somewhat lower compared to word-of-mouth promotion, is still considered significant, with notable variation in perception among respondents.
Word-of-mouth promotion is not significantly associated with promotion through print media, with a rho value of 0.02 and a p-value of 0.727. Additionally, word-of-mouth promotion shows a weak but statistically non-significant positive relationship with promotion via traditional electronic media, with a rho value of 0.103 and a p-value of 0.075. General destination promotion is significantly negatively correlated with word-of-mouth promotion, with a rho value of −0.215 and a p-value of less than 0.001, suggesting that a greater emphasis on word-of-mouth promotion may be associated with a reduced emphasis on general destination promotion. On the other hand, general destination promotion is not significantly associated with promotion through print media and traditional electronic media, with rho values of 0.008 and −0.118 and p-values of 0.896 and 0.041, respectively. Digital agency promotion of destinations is significantly positively correlated with general destination promotion, with a rho value of 0.505 and a p-value of less than 0.001, suggesting that a higher importance of digital agency promotion may be associated with a greater importance of general destination promotion. However, digital agency promotion is not significantly associated with word-of-mouth promotion, print media, or traditional electronic media promotion, with rho values of −0.009, 0.048, and −0.041 and p-values of 0.881, 0.406, and 0.485, respectively (Table 4).
For male respondents, the median rating of word-of-mouth promotion is 4.00, with an interquartile range (IQR) of 1.67, corresponding to a range between 3.00 and 4.67. For female respondents, the median rating is also 4.00, but with a narrower interquartile range of 1.33, corresponding to a range between 3.67 and 5.00. The results of the Mann-Whitney U test show a Z value of 2.03 and a p-value of 0.021, indicating a statistically significant difference in the perception of word-of-mouth promotion between men and women, with higher values observed among women compared to men (Table 5).
Table 5.
Differences in Perception of Word-of-Mouth Promotion by Gender (Mann–Whitney U Test).
For word-of-mouth promotion, the median for the 18–25 age group is 1.17 with an interquartile range (IQR) of 1.67, corresponding to a range between 3.33 and 5.00. These ratings are significantly lower compared to other age groups. The median for the 26–40 and 41–55 age groups is 4.00, while the median for the 56+ age group is 4.67, with an IQR of 1.00, corresponding to a range between 4.00 and 5.00. A statistically significant difference between age groups is indicated by a Z value of 10.67 and a p-value of 0.014, suggesting that the ratings for word-of-mouth promotion differ significantly among age groups. The significance of word-of-mouth promotion was found to be statistically higher among the population aged 56 and over compared to the population aged 26–40 years (p = 0.002) and the population aged 41–55 years (p = 0.029), while no statistically significant differences were observed among the other age groups (p > 0.050). For promotion through print media, the median for the 18–25 age group is 2.33 with an IQR of 1.00, corresponding to a range between 2.00 and 3.00. The other age groups have medians of 3.00, with an IQR of 1.00 for the 26–40 and 56+ age groups, and a median of 2.67 with an IQR of 1.00 for the 41–55 age group. A statistically significant difference between age groups is shown with a Z value of 20.76 and a p-value of less than 0.001, indicating significant differences in ratings of print media pro-motion across age groups. For promotion via traditional electronic media, the median for all age groups is 3.00, with IQRs ranging from 0.33 to 1.00. A statistically significant difference between age groups is indicated by a Z value of 19.47 and a p-value of less than 0.001, showing that perceptions of traditional electronic media promotion differ significantly among age groups. For general destination promotion, the median for the 18–25 age group is 4.00 with an IQR of 0.83, corresponding to a range between 3.50 and 4.33. The other age groups have medians of 3.67 for the 26–40 group, 3.17 for the 41–55 group, and 2.00 for the 56+ group, with respective IQRs. A statistically significant difference between age groups is indicated by a Z value of 85 and a p-value of less than 0.001, suggesting significant differences in the ratings of general destination promotion across age groups. For digital agency destination promotion, the median for the 18–25 age group is 3.00 with an IQR of 2.00, corresponding to a range between 2.00 and 4.00. Other age groups have medians of 3.00, with IQRs ranging between 1.00 and 2.00. A statistically significant difference between age groups is indicated by a Z value of 35.79 and a p-value of less than 0.001, suggesting significant differences in the ratings of digital agency destination promotion among age groups (Table 6).
Table 6.
Differences in Perception of Promotion Types by Age Group.
For word-of-mouth promotion, the median rating for the Internet (social media, portals/forums, travel agencies) is 3.67 with an interquartile range (IQR) of 1.00, corresponding to a range between 3.00 and 4.00. Television and radio have a median of 4.50 with an IQR of 1.00, corresponding to a range between 4.00 and 5.00, while personal recommendations from friends, family, or acquaintances have a median of 5.00 with an IQR of 1.00, corresponding to a range between 4.00 and 5.00. Print media have a median of 3.50 with an IQR of 1.50, corresponding to a range between 3.00 and 4.50. A statistically significant difference between groups is shown by a Z value of 61.52 and a p-value of less than 0.001, suggesting significant differences in perceptions of the importance of different sources of information about tourist destinations. Among the population for whom internet sources, such as social media, portals, and forums, represent the most important source of information, the significance of word-of-mouth promotion differs significantly compared to the population that primarily relies on television/radio (p < 0.001) and personal recommendations from friends, family, or acquaintances (p < 0.001). Additionally, in the population for whom print media are the main source of information, the significance of word-of-mouth promotion differs significantly compared to those who consider personal recommendations as their primary source (p = 0.010). No statistically significant differences in the significance of word-of-mouth promotion were found among the other sources of information (p > 0.050). For promotion through print media, the median for the Internet group is 2.67 with an IQR of 1.00, corresponding to a range between 2.00 and 3.00. Television and radio have a median of 2.33 with an IQR of 1.33, corresponding to a range between 1.67 and 3.00, while personal recommendations from friends, family, or acquaintances have a median of 3.00 with an IQR of 1.00, corresponding to a range between 2.00 and 3.00. Print media themselves have a median of 4.00 with an IQR of 0.33, corresponding to a range between 4.00 and 4.33. A statistically significant difference between groups is shown with a Z value of 22.73 and a p-value of less than 0.001, indicating significant differences in the perceived importance of different sources of information about tourist destinations. For promotion through traditional electronic media, the median for the Internet group is 3.00 with an IQR of 0.33, corresponding to a range between 2.67 and 3.00. Television and radio have a median of 4.17 with an IQR of 0.33, corresponding to a range between 4.00 and 4.33, while personal recommendations and print media both have a median of 3.00—with an IQR of 0.67 for personal recommendations and 0.00 for print media. A statistically significant difference between groups is indicated by a Z value of 116.67 and a p-value of less than 0.001, suggesting notable differences in how the importance of various information sources is perceived. For general destination promotion, the median for the Internet group is 4.00 with an IQR of 0.83, corresponding to a range between 3.50 and 4.33. Television and radio have a median of 3.00 with an IQR of 1.00, corresponding to a range between 2.00 and 3.00, while personal recommendations have a median of 2.83 with an IQR of 1.33, corresponding to a range between 2.00 and 3.33. Print media have a median of 2.00 with an IQR of 0.17, corresponding to a range between 1.83 and 2.00. A statistically significant difference between groups is shown with a Z value of 121.6 and a p-value of less than 0.001, indicating significant differences in perceptions of general destination promotion depending on the source of information. For digital agency destination promotion, the median for the Internet group is 3.00 with an IQR of 2.00, corresponding to a range between 2.00 and 4.00. Television and radio have a median of 3.00 with an IQR of 1.00, corresponding to a range between 2.00 and 3.00, while personal recommendations have a median of 2.33 with an IQR of 1.00, corresponding to a range between 2.00 and 3.00. Print media have a median of 2.00 with an IQR of 0.87, corresponding to a range between 1.67 and 2.00. A statistically significant difference between groups is shown with a Z value of 28.13 and a p-value of less than 0.001, suggesting significant differences in perceptions of the importance of various information sources for destination promotion (Table 7).
Table 7.
Perception of Promotion Types by Primary Source of Tourist Information.
For word-of-mouth promotion, the median value for the Internet sources (social media, portals/forums, travel agencies) was 3.67 with an interquartile range (IQR) of 1.00, corresponding to a range between 3.00 and 4.00. Television and radio had a median value of 4.00 with an IQR of 1.00, corresponding to a range between 3.00 and 4.00, while personal recommendations from friends, family, or acquaintances showed a median of 4.67 with an IQR of 1.00, corresponding to a range between 4.00 and 5.00. Print media had a median of 3.00 with an IQR of 1.00, corresponding to a range between 3.00 and 4.00. A statistically significant difference between groups was observed, indicated by a Z-value of 101.77 and a p-value of <0.001, suggesting significant differences in the perceived importance of various information sources about tourist destinations. Among the population for whom print media have the greatest influence on decision-making when choosing a tourist destination, the perceived importance of word-of-mouth promotion was significantly lower compared to those who primarily rely on personal recommendations (p = 0.001). Furthermore, respondents who consider the Internet (social media, portals/forums, travel agencies, etc.) as their main decision-making source showed a significantly lower perception of the importance of word-of-mouth compared to those relying on personal recommendations (p < 0.001). Similarly, those who primarily depend on television/radio also reported a significantly lower perceived importance of word-of-mouth compared to those relying on personal recommendations (p = 0.006). No statistically significant differences in the importance of word-of-mouth promotion were observed among the other sources of information (p > 0.050) (Table 8).
Table 8.
Pair-Wise Comparison Judgment Matrices.
The AHP analysis aims to determine the priorities of tourist destinations’ promotion using the weight of the priorities as an indicator for measuring the tourist offer. Such a measurable priority indicator will be facilitative, comparing the level of differences in the tourist offer in keeping with different approaches and for performing priority rankings. A higher promotion indicator corresponds to a higher perception of tourists, who require a specific choice. The quantitative analysis presented in this way confirms the effectiveness of the proposed model. After the priority weights for each matrix in the AHP hierarchy have been estimated, the next step is to discuss the results, as shown in Figure 3.
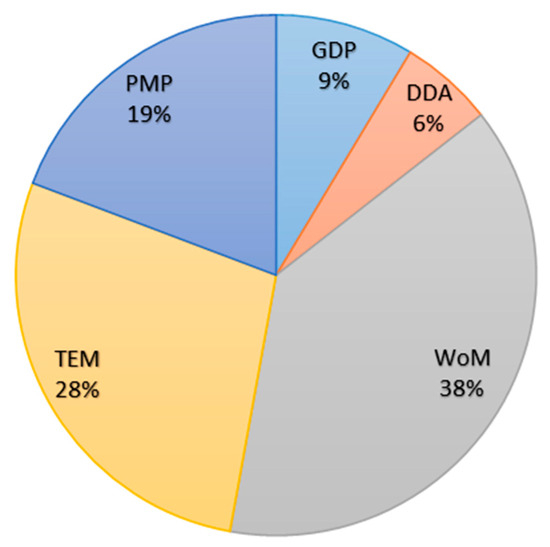
Figure 3.
Final weights of the main criteria. Note: GDP: 0.086291951, DDA: 0.058113019, WoM: 0.383958338, TEM: 0.27915876, PMP: 0.192477931.
The results are shown in Table 8. Word of mouth (WoM) is the most important criterion when choosing a tourist destination because it has the highest priority (0.38). Portals and forums (GDP), where a detailed visual offer of tourist destinations is created, do not correspond to standard offers for tourist destinations. They have a very low priority, as indicated by a priority vector of 0.09. Travel agency websites (TDA) can choose a tourist destination but require special treatment. Experience shows that consumers of tourist services seek additional information from agencies despite the availability of all information on their websites. This treatment is influenced by numerous issues, including hidden costs, benefits, internal capacity, risk assessment, refund in case of cancellation, reservations, and so on. Therefore, they have the lowest priority weight of 0.06. Radio and television (TEM) are traditionally the largest sources of information and have a high priority (0.28). Surprisingly, written media (newspapers, magazines, other printed publications) have a mid-level priority with a PMP weight of 0.19. Although GDP is strongly associated with social media and digital platforms at the perceptual level, its relatively low priority in the AHP model indicates that experts differentiate between high user engagement and strategic promotional importance.
Otherwise, the development of a priority model in the tourist offers helps determine the main promotion frameworks. It also provides answers to questions about where to direct resources for the next tourist season, what type of promotion is relevant to tourists, the preferences of target groups, and so forth. Finally, it allows us to quantify the promotional activities of the tourist offer in a way relevant for decision-making.
It should be noted that the priority structure obtained from the AHP model differs from tourists’ survey-based preferences, particularly regarding the relatively higher importance assigned by experts to traditional electronic and print media compared to digital channels.
5. Discussion
The results of the conducted research indicate multiple layers of differences in the perception and influence of various forms of promotion among respondents. The interpretation of these findings gains further weight when placed in the context of existing literature.
Hypothesis 1, which addresses the differences in the impact of various promotional formats, has been confirmed by results showing statistically significant variations among the types of promotion, as well as the influence of demographic variables on their perception. New media, such as TikTok, WeChat, and other interactive platforms, have demonstrated a particularly strong influence on younger respondents. This is in line with findings from Lei and Gao (2022) and Dramićanin et al. (2023), who emphasized the role of new media in increasing tourism flows and inspiring travel. These platforms are not merely communication tools, but emotionally and visually engaging channels, especially for Generation Z and Millennials. On the other hand, Govers et al. (2007) suggest that official promotion has a limited impact, while personal experiences and peer recommendations have a more lasting influence—an observation supported by this study as well. Furthermore, research by Madonado et al. (2019) and Belarmino et al. (2021) indicates that traditional media have a weaker effect on younger audiences, whereas Abdelaziz (2023) and Hussain et al. (2024) highlight that print media, though limited in reach, still maintain a certain role, particularly among older consumers and within specific market niches.
Hypothesis 2, which assumes the dominance of word-of-mouth (WOM) promotion, is also fully confirmed. An additional point requiring clarification concerns the construct labelled General Destination Promotion (GDP) and its relatively low weight in the AHP results. While GDP is strongly linked to social media and online platforms in the PCA, experts assigned it a lower strategic priority compared to word-of-mouth and traditional electronic media. This finding may appear counterintuitive at first glance; however, it reflects a distinction between visibility and engagement, on the one hand, and strategic controllability and reliability, on the other. Social media and portals enable rapid dissemination and high interaction, but they also involve fragmented messaging, limited institutional control, and increased exposure to reputational risk, which may reduce their perceived strategic value from a managerial perspective. From this perspective, the lower AHP weight assigned to GDP does not imply that social media is unimportant for destination promotion. Rather, it suggests that experts view these channels as supportive and complementary tools, effective for engagement and inspiration, but less suitable as primary instruments for long-term positioning, crisis communication, and coordinated destination branding. This distinction helps explain why GDP, despite its strong presence in tourists’ perceptions, received a comparatively lower priority in the expert-based decision model.
5.1. Misalignment Between Tourist Preferences and Expert Priorities
A critical insight emerging from this study is the misalignment between tourists’ promotional preferences and the priorities derived from the expert-based AHP model. While the survey findings show a strong preference for digital channels, particularly among younger respondents, the AHP results assign comparatively higher importance to traditional electronic and print media. This divergence does not indicate methodological inconsistency but rather reflects the fundamentally different perspectives captured by the two approaches. Tourists tend to evaluate promotional channels based on immediacy, convenience, and personal relevance, whereas experts assess them from a strategic perspective that emphasizes message control, institutional credibility, risk management, and broad population reach. Consequently, the expert-based prioritization should not be interpreted as superseding tourists’ preferences, but as complementing them by incorporating managerial and long-term strategic considerations that are less visible at the individual user level.
Traditional media, although perceived as less influential by many respondents, can play a stabilizing role in destination branding, crisis communication, and awareness-building among older or less digitally active audiences. The observed gap between user preferences and expert priorities therefore represents a valuable managerial signal, highlighting the need for hybrid promotional strategies that integrate user-driven digital engagement with strategically maintained traditional communication channels.
It is important to emphasize that the priority weights obtained through the AHP model are based exclusively on expert evaluations, whereas the survey-based results reflect consumer perceptions and preferences derived from responses provided by 299 tourists. The highest scores in the hierarchical analysis using the AHP model showed that WOM is the most influential form of promotion when it comes to travel decision-making. This finding aligns with multiple studies, including those by Xu et al. (2020) and Aprilia and Kusumawati (2021), who identified WOM as a strong driver of tourist intention and destination perception. Interestingly, traditional WOM still exerts a stronger emotional impact than electronic WOM (e-WOM), according to Setiawan et al. (2021), although both contribute to shaping tourists’ attitudes. Meenakshy et al. (2024) and Šegota et al. (2021) further emphasize that emotional engagement and personal experience stimulate further recommendations, forming a self-reinforcing cycle of influence that is difficult to replicate through formal promotional channels.
Hypothesis 3, concerning gender differences, has also been confirmed. The results show significant differences in how promotional content is perceived based on gender, particularly in terms of satisfaction and loyalty. Research by Martins et al. (2025) advocates for the development of tailored promotional messages that target specific demographic segments. Meanwhile, Grubor et al. (2020) note that although WOM is generally dominant, its intensity and emotional resonance may vary depending on gender. In this study, women exhibited greater sensitivity to emotionally driven promotional messages and demonstrated stronger loyalty toward recommended destinations. The study of (Šostar et al., 2024) confirm that online reviews significantly influence consumers’ perceptions of hotel attractiveness, with men showing a greater shift in ratings after reading reviews than women, highlighting the importance of gender-sensitive marketing strategies in the digital environment. By using a fuzzy logic-based system, tourist destinations can better promote themselves to people with disabilities (men and women) by offering personalized information about accessibility, making tourism marketing more inclusive and adapted to real user needs (Gavurova & Polishchuk, 2025).
Hypothesis 4, regarding age group differences, has also been con-firmed. Younger respondents showed a stronger preference for digital and interactive channels, while older individuals favored more traditional information sources. These findings are in line with Madonado et al. (2019), who reported a clear generational divide in preferences for promotional media. Similarly, Suryana et al. (2024) noted that younger users more often rely on platforms like Instagram and TikTok, whereas older groups value educational and informative content on platforms like YouTube. Kennedy et al. (2023) support the idea of developing targeted promotional strategies based on demographic profiles, which is also validated by this study’s results.
Hypothesis 5, which explored the influence of information sources on the perception of promotion, was also supported. Depending on whether the information originated from friends, online portals, social media, or official websites, respondents’ perceptions of its reliability and credibility varied significantly. Deb and Mallik (2023) argue that user-generated content often alters how others perceive a destination. Luong (2024) confirms that e-WOM plays a mediating role between the source of information and the intention to visit, while Silva et al. (2020) highlights the importance of Facebook posts and comments in shaping the perceived image of a destination.
Hypothesis 6, which posits the existence of correlations between different forms of promotion, was confirmed through strong positive correlations between awareness, satisfaction, and loyalty. This finding corresponds with research by Zhou et al. (2022), which highlights the synergistic effect of positive reviews and visual content, as well as Akhi et al. (2023), who demonstrate that different forms of e-WOM reinforce each other. Adam et al. (2023) takes this further, asserting that marketing elements do not function in isolation, but interact in integrated and complementary ways, an idea that is strongly supported by the findings of this study.
5.2. Limitations
Several limitations of this study should be acknowledged. First, the expert-based AHP evaluation relied on a relatively small expert panel (n = 3), which may limit the breadth of strategic perspectives captured, despite being consistent with established AHP practices. Second, the survey sample was limited to Croatian respondents, which constrains the generalizability of the findings. Finally, the cross-sectional design does not allow for observing changes in promotional preferences over time.
5.3. Future Research Recommendations
Future research should further investigate the identified misalignment between tourist preferences and expert priorities by incorporating additional stakeholder groups, such as destination management organizations and private sector marketers. Longitudinal designs and extended multi-criteria decision-making models, including Fuzzy AHP, could provide deeper insights into how promotional effectiveness evolves across market segments and over time.
6. Conclusions
This study has confirmed that the promotion of tourist destinations should no longer be viewed as a simple comparison between traditional and digital channels. Instead, it calls for a more nuanced understanding of how different types of promotion are perceived, depending on demographic factors such as gender and age, as well as the credibility of the information source. One of the most significant findings is the continued dominance of word-of-mouth (WOM) as the most influential form of communication, surpassing even the most advanced digital tools. Importantly, the differences observed between tourists’ preferences and expert-based promotional priorities indicate that effective destination promotion requires reconciling user-centered perceptions with strategic managerial judgment, rather than relying exclusively on a single perspective.
The evaluation of different promotional forms using the AHP model offered additional depth to the analysis. By constructing a hierarchical structure and assigning relative weights to various types of promotion, this approach has helped identify which channels have the strongest impact on tourist decision-making. The aim was not only to assess the effectiveness of promotional strategies but also to help tourists better navigate available offers and make more informed choices. In that sense, the model provides both practical guidance for marketers and useful reference points for consumers of tourist services.
The findings also reinforce the importance of personalization in tourism marketing, particularly in addressing the distinct preferences of different demographic groups. Furthermore, the strong correlations observed between awareness, satisfaction, and loyalty highlight the need for integrated marketing efforts, rather than fragmented campaigns.
Despite the robustness of the methodology, some limitations must be acknowledged. The AHP scale, which ranges from 1 to 9, can introduce subjectivity into the priority ratings, and inconsistencies may arise during pairwise comparisons. Moreover, while AHP effectively identifies promotional priorities, it does not offer guidance on addressing identified weaknesses. Future research could benefit from using Fuzzy AHP to reduce ambiguity and to explore additional factors influencing tourism promotion.
This research also provides a solid foundation for rethinking promotional strategies in tourism, particularly in the Croatian context. It also opens the door to more structured and evidence-based approaches to helping both marketers and tourists make better decisions.
Author Contributions
Conceptualization, M.Š.; methodology, M.Š. and V.R.; formal analysis, M.Š. and S.Č.; investigation, M.Š. and V.R.; resources, M.Š.; data curation M.Š. and V.R.; writing—original draft preparation, M.Š. and V.R.; writing—review and editing, M.Š. and V.R.; supervision, M.Š.; project administration M.Š. All authors have read and agreed to the published version of the manuscript.
Funding
This research received no external funding.
Institutional Review Board Statement
Ethical review and approval were waived for this study due to the Ethics Committee of University of Osijek, the Code of Ethics and Conduct of Research of our University (https://www.unios.hr/wp-content/uploads/2015/11/Code-of-Ethics.pdf, accessed on 21 December 2025).
Informed Consent Statement
Informed consent was obtained from all subjects involved in the study.
Data Availability Statement
The data presented in this study are available on request from the corresponding author. The data are not publicly available due to Croatian national law of privacy protection.
Acknowledgments
This research is related to the Croatian Science Foundation (HRZZ) research project “Tourism 5.0: Customer Satisfaction through the Digital Transformation of Tourist Destinations”, grant no. IP-2025-02-1899 (Croatian Science Foundation), but was not directly funded by the project.
Conflicts of Interest
Slavenko Čuljak is employed at Radio Vallis Aurea Ltd., Pozege, Croatia. The remaining authors declare that the research was conducted in the absence of any commercial or financial relationships that could be construed as a potential conflict of interest.
References
- Abdelaziz, O. A. (2023). The role of tourist media in promoting tourist areas and attracting new tourist markets to Egypt. International Journal of Tourism and Hospitality Studies, 4(2), 1–28. [Google Scholar] [CrossRef]
- Adam, M., Putra, I. R. T., Ibrahim, M., & Yunus, M. (2023). Marketing strategy for tourism potential in the framework of regional development as a tourist destination. Indatu Journal of Management and Accounting, 1(1), 12–20. [Google Scholar] [CrossRef]
- Afren, S. (2024). The role of digital marketing promoting tourism business: A study of use of the social media in promoting travel. World Journal of Advanced Research and Reviews, 21(1), 272–287. [Google Scholar] [CrossRef]
- Agyapong, E., & Yuan, J. (2022). Social media impact on tourism destination decision: Evidence from international students in China. Open Journal of Applied Sciences, 12, 2055–2080. [Google Scholar] [CrossRef]
- Akhi, M. T. J., Sarker, D. M. A. H., & Fakir, M. K. J. (2023). Factors’ influence of E-WOM on travel intentions of tourists: A study on tourist places located in Bangladesh. Journal of Sustainable Tourism and Entrepreneurship, 4(3), 223–239. [Google Scholar] [CrossRef]
- Ali, D. (2021). The impact of tourism marketing on the attracted tourists in the Shaqlawa. Studies of Applied Economics, 39, 1–17. [Google Scholar] [CrossRef]
- Alzaydi, Z. M., & Elsharnouby, M. H. (2023). Using social media marketing to pro-tourism behaviours: The mediating role of destination attractiveness and attitude towards the positive impacts of tourism. Future Business Journal, 9, 42. [Google Scholar] [CrossRef]
- Aprilia, F., & Kusumawati, A. (2021). Influence of electronic word of mouth on visitor’s interest to tourism destinations. Journal of Asian Finance, Economics and Business, 8(2), 993–1003. [Google Scholar] [CrossRef]
- Arismayanti, K. N., Andiani, D. N., & Kusyanda, R. M. (2024). Tourist satisfaction model: Structural relationship of destination image, electronic word of mouth, and service quality in Bali destination. Nurture, 18(2), 360–372. [Google Scholar] [CrossRef]
- Armutcu, B., Tan, A., Amponsah, M., Parida, S., & Ramkissoon, H. (2023). Tourist behaviour: The role of digital marketing and social media. Acta Psychologica, 240, 104025. [Google Scholar] [CrossRef]
- Belarmino, A., Demirciftci, T., & Zhang, L. (2021). Online reviews and travel magazine awards: Their influence on willingness-to-pay. Journal of Revenue Pricing Management, 20, 436–445. [Google Scholar] [CrossRef]
- Bishar, U. A., & Roberetine, L. P. (2023). Branding and promotion of tourism destinations in Africa: An investigation of the branding and promotion of tourism in Africa, case of Cameroon [Student thesis, 84. Linnaeus University]. Available online: https://lnu.diva-portal.org/smash/record.jsf?pid=diva2%3A1782133 (accessed on 27 March 2025).
- Blasco López, M. F., Virto, N. R., & Figueiredo, J. (2020). Determinants of residents’ word-of-mouth behaviour and support for tourism. Administrative Sciences, 10(3), 51. [Google Scholar] [CrossRef]
- Bulchand-Gidumal, J., William Secin, E., O’Connor, P., & Buhalis, D. (2023). Artificial intelligence’s impact on hospitality and tourism marketing: Exploring key themes and addressing challenges. Current Issues in Tourism, 27(14), 2345–2362. [Google Scholar] [CrossRef]
- Chatterjee, J., & Dsilva, N. R. (2021). A study on the role of social media in promoting sustainable tourism in the states of Assam and Odisha. Tourism Critiques, 2(1), 74–90. [Google Scholar] [CrossRef]
- Chen, L. (2020). Tourist destination marketing pattern based on new medium. In IOP conference series: Materials science and engineering (p. 750). IOP Publishing. [Google Scholar] [CrossRef]
- Chin, C. H., Lo, M. C., Razak, Z. b., Pasbakhsh, P., & Mohamad, A. A. (2020). Resources confirmation for tourism destinations marketing efforts using PLS-MGA: The moderating impact of semirural and rural tourism destination. Sustainability, 12(17), 6787. [Google Scholar] [CrossRef]
- Contu, G., & Pau, S. (2022). The impact of TV series on tourism performance: The case of Game of Thrones. Empirical Economics, 63, 3313–3341. [Google Scholar] [CrossRef]
- Danylyshyn, B., Bondarenko, S., Niziaieva, V., Veres, K., Rekun, N., & Kovalenko, L. (2020). Branding a tourist destination in the region’s development. International Journal of Advanced Research in Engineering and Technology, 1(4), 312–323. [Google Scholar]
- Deb, S. K., & Mallik, N. (2023). Effects of social media in tourism marketing: Outlook on user generated Content. Journal of Digital Marketing and Communication, 3(2), 49–65. [Google Scholar] [CrossRef]
- de las Heras-Pedrosa, C., Millan-Celis, E., Iglesias-Sánchez, P. P., & Jambrino-Maldonado, C. (2020). Importance of social media in the image formation of tourist destinations from the stakeholders’ perspective. Sustainability, 12(10), 4092. [Google Scholar] [CrossRef]
- Deng, W., Lin, Y., & Chen, L. (2021). Exploring destination choice intention by using the Tourism photographic: From the perspectives of visual esthetic processing. Frontiers in Psychological, 12, 713739. [Google Scholar] [CrossRef]
- Dias, F., & Lavaredas, A. M. (2024). Assessing the effectiveness of tourism promotional videos: Creativity, emotional impact, perceived quality, and attitude towards the destination. Administrative Sciences, 14(12), 323. [Google Scholar] [CrossRef]
- Dramićanin, S., Perić, G., & Gašić, M. (2023). The impact of TikTok on travel decision. International Scientific Conference on Economy, Management and Information Technologies, 1(1), 129–138. [Google Scholar] [CrossRef]
- Enemuo, O. B., & Amaechi, B. (2015). The role of mass media in tourism development in Abia State. Journal of Tourism, Hospitality and Sports, 11, 44–49. [Google Scholar]
- Esteves, S., Morais, P. E., & Azeredo, S. (2022). The influence of the internet and social networks on the choice of the tourist destination Serra a Estrela. Journal of Internet Social Networking & Virtual Communities, 2022, 719520. [Google Scholar] [CrossRef]
- Fatima, Z., Aboghebra, Y. M., Banu, B., & Nazneed, R. (2024). A review of marketing stratergies for promoting sustainable tourism destinations in India. Saudi Journal of Business and Management Studies, 9(11), 251–256. [Google Scholar] [CrossRef]
- Fitri, F. R., Februadi, A. C., Elisabeth, V., & Yuardani, A. M. (2023). The influence of Instagram social media marketing as a promotional means to increase intentions to visit tourist destinations. Journal of Marketing Innovation, 3(2), 169–185. [Google Scholar] [CrossRef]
- Florčić, T., Šker, I., & benassi, M. H. (2023). Enhancing digital promotion of cultural attractions: Assessing websites, online marketing tools and smart technologies. Business Systems Research, 14(1), 72–92. [Google Scholar] [CrossRef]
- Florido-Benítez, L. (2024). Tourism promotion budgets and tourism demand: The Andalusian case. Consumer Behavior in Tourism and Hospitality, 19(2), 310–322. [Google Scholar] [CrossRef]
- Gallardo-Vázquez, D. (2023). Attributes influencing responsible tourism consumer choices: Sustainable local food and drink, health-related services, and entertainment. Oeconomia Copernicana, 14(2), 645–686. [Google Scholar] [CrossRef]
- Gavurova, B., & Polishchuk, V. (2025). Decision-making support system for travel planning for people with disabilities based on fuzzy set theory. Oeconomia Copernicana, 16(1), 417–462. [Google Scholar] [CrossRef]
- Ghorbani, A., Mousazadeh, H., Golafshan, A., Almani, A. F., & Dávid, D. L. (2023). Tourists-generated photographs in online media and tourism destination choice: The case of Shiraz metropolis in Iran. Cogent Social Sciences, 9(1), 2225336. [Google Scholar] [CrossRef]
- Govers, R., Go, F. M., & Kumar, K. (2007). Promoting tourism destination image. Journal of Travel Research, 46(1), 15–23. [Google Scholar] [CrossRef]
- Goyal, C., & Taneja, U. (2023). Electronic word of mouth for the choice of wellness tourism destination image and the moderating role of COVID-19 pandemic. Journal of Tourism Futures, 11(3), 349–368. [Google Scholar] [CrossRef]
- Grubor, A., Marić, D., & Leković, K. (2020). Word of mouth in tourism—A sociodemographic analysis. International Journal of Multidisciplinarity in Business and Science, 6(9), 23–30. [Google Scholar]
- Guerrero-Rodríguez, R., Stepchenkova, S., & Kirilenko, A. (2020). Experimental investigation of the impact of a destination promotional video with physiological and self-reported measures. Tourism Management Perspectives, 33, 100625. [Google Scholar] [CrossRef]
- Guo, Y., Yu, M., & Zhao, Y. (2024). Impact of destination advertising on tourists’ visit intention: The influence of self-congruence, self-confidence, and destination reputation. Journal of Destination Marketing & Management, 31, 100852. [Google Scholar] [CrossRef]
- Hammadi, L., de Cursi, J. E. S., Ait Ouahman, A., & Ibourk, A. (2016). Prioritizing the risk in customs supply chain using AHP-based approach: Application to the Moroccan customs. Journal of Traffic and Logistics Engineering, 4(1), 47–55. [Google Scholar] [CrossRef][Green Version]
- Hernández-Méndez, J., & Baute-Díaz, N. (2023). Influencer marketing in the promotion of tourist destinations: Mega, macro and micro-influencers. Current Issues in Tourism, 27(8), 1332–1342. [Google Scholar] [CrossRef]
- Hua, Y., Jittithavorn, C., Lee, T. J., & Chen, X. (2021). Contribution of TV dramas and movies in strengthening sustainable tourism. Sustainability, 13(22), 12804. [Google Scholar] [CrossRef]
- Hussain, K., Alam, D. M. M., Malik, A., Tarhini, A., & Al Balushi, K. M. (2024). From likes to luggage: The role of social media content in attracting tourists. Heliyon, 10(19), e38914. [Google Scholar] [CrossRef]
- Islam, M. T. (2021). Applications of social media in the tourism industry: A review. SEISENSE Journal of Management, 4(1), 59–68. [Google Scholar] [CrossRef]
- Jalees, T., Alam, S. H., Zaman, S. I., & Qabool, S. (2023). Promotion strategies in consumer paradox towards word of mouth brand equity. ReMark—Revista Brasileira De Marketing, 22(2), 702–733. [Google Scholar] [CrossRef]
- Jiang, J., Hong, Y., Li, W., & Li, D. (2022). A study on the impact of official promotion short videos on tourists’ destination decision-making in the post-epidemic era. Frontiers in Psychology, 13, 1015869. [Google Scholar] [CrossRef]
- Kennedy, P. S. J., Tobing, S. J. L., & Lumbantoruan, R. (2023). Marketing strategy with marketing mix for Lake Toba tourism destination. Journal of Sustainable Tourism and Entrepreneurship, 3(3), 193–210. [Google Scholar] [CrossRef]
- Kumar, P., Mishra, J. M., & Rao, Y. V. (2021). Analysing tourism destination promotion through Facebook by Destination Marketing Organizations of India. Current Issues in Tourism, 25(9), 1416–1431. [Google Scholar] [CrossRef]
- Kwabi, F., Ezeani, E., Owusu, A., Wonu, C., & Hu, W. (2023). The impact of the media on tourism development and income inequality. Journal of Sustainable Tourism, 31(9), 2062–2079. [Google Scholar] [CrossRef]
- Lei, J., & Gao, H. (2022). Study on the impact of new media on Xi’an tourism. American Journal of Industrial and Business Management, 12, 294–301. [Google Scholar] [CrossRef]
- Li, W., & Liu, Z. (2022). A comparative study of the impact of negative word of mouth on travel intentions of Chinese and Korean consumers in tourism destinations. Sustainability, 14(4), 2062. [Google Scholar] [CrossRef]
- Li, Y., Xiao, H., Bu, N., Luo, J., Xia, H., Kong, L., & Yu, H. (2021). Configuration-based promotion: A new approach to destination image sustainability. Sustainability, 13(21), 12174. [Google Scholar] [CrossRef]
- Loureiro, S. M. C., Stylos, N., & Bellou, V. (2020). Destination atmospheric cues as key influencers of tourists’ word-of-mouth communication: Tourist visitation at two Mediterranean capital cities. Tourism Recreation Research, 46(1), 85–108. [Google Scholar] [CrossRef]
- López, R. C., Cázeres, T. M. M., & Pérez, L. F. J. (2022). Factors that impact the word-of-mouth intention (WOM) in the full-service restaurant industry: A stimuli-organism-response approach. Contaduría y Administración, 67(4), 28–47. [Google Scholar] [CrossRef]
- Luong, T.-B. (2024). The moderating role of e-word of mouth in the relationships between destination source credibility, awareness, attachment, travel motivation, and travel intention: A case study of Vietnamese film tourism. International Journal of Tourism Research, 26(4), e2729. [Google Scholar] [CrossRef]
- Madonado, E., Chiguvi, D., & Tadu, R. (2019). Assessment of the effectiveness of traditional media for the promotion of tourism in this digital age in KwaZulu-Natal South Africa. Business and Management Studies, 5(4), 36–48. [Google Scholar] [CrossRef]
- Majeed, R., & Gupta, R. (2024). An investigation into the impact of social media on the promotion of sustainable tourism in the tourist destinations of Kashmir division. Journal of Tourism Insights, 14(1), 20. [Google Scholar] [CrossRef]
- Martins, W. S., Martins, M., & Morais, E. P. (2025). Exploring the influence of social media on tourist decision-making: Insights from cape verde. Tourism and Hospitality, 6(1), 45. [Google Scholar] [CrossRef]
- Meenakshy, M., Prasad, K. D. V., Bolar, K., & Shamsunder, C. (2024). Electronic word-of-mouth intentions in personal and public networks: A domestic tourist perspective. Humanities & Social Sciences Communication, 11, 1226. [Google Scholar] [CrossRef]
- Nanggong, A., & Mohammad, A. (2020). The impact of cultural tourism experience on electronic word-of-mouth (e-WOM) and destination image. Diponegoro International Journal of Business, 3(2), 68–79. [Google Scholar] [CrossRef]
- Nieto-Ferrando, J., Gómez-Morales, B., & Sánchez-Castillo, S. (2024). A model for research on film-induced tourism: Audiovisual narrative texts, reception, and effects. Annals of Tourism Research Empirical Insights, 5(2), 100146. [Google Scholar] [CrossRef]
- Nieto-Ferrando, J., Sánchez-Castillo, S., & Gómez-Morales, B. (2021). Audiovisual fiction and tourism promotion: The impact of film and television on the image of tourist destinations and contributions from textual analysis. Profesional De La Información, 30(6), 1–24. [Google Scholar] [CrossRef]
- Nieves-Pavón, S., López-Mosquera, N., & Jiménez-Naranjo, H. (2024). The role emotions play in loyalty and WOM intention in a smart tourism destination management. Cities, 145, 104681. [Google Scholar] [CrossRef]
- Ortaleza, M. S., & Mangali, G. R. (2021). Attributes of travel destinations that influence tourists’ decisions: A systematic review. International Tourism and Hospitality Journal, 4(8), 1–10. [Google Scholar] [CrossRef]
- Pogrebova, S. E., & Ulyanchenko, A. L. (2020). Promotion of tourist destinations of the Russian federation on the international market. Utopía y Praxis Latinoamericana, 25(5), 302–315. [Google Scholar] [CrossRef]
- Rahjasa, P. S. L., Utama, I. P., & Wiarti, L. Y. (2023). The effect of promotion and E-WOM on tourists’ intention to visit denpasar: Destination image as a mediating variable. International Journal of Applied Research in Tourism and Hospitality, 1(1), 73–86. [Google Scholar] [CrossRef]
- Ray, S. (2022). Technology and destination promotion in Asian tourism: Challenges, changes, and bearing. In A. Hassan (Ed.), Handbook of technology application in tourism in Asia (Chapter 18) (pp. 377–402). Springer. [Google Scholar] [CrossRef]
- Ristanović, V., Primorac, D., & Dorić, B. (2024). The importance of green investments in developed economies—MCDM models for achieving adequate green investments. Sustainability, 16, 6341. [Google Scholar] [CrossRef]
- Saaty, T. L. (1994). How to make a decision: The analytic hierarchy process. Interface, 24(6), 19–43. [Google Scholar] [CrossRef]
- Sarker, I. S., & Dash, C. S. (2024). Role of information technology and tourism promotion in Bangladesh. International Journal of Marketing Research Innovation, 9(1), 1–11. [Google Scholar] [CrossRef]
- Setegn, E. A., & Japee, P. G. (2025). Promotional elements and the performance of tourism marketing of visitor attraction places with the mediating role of public relations: Empirical evidence from visitors in Ethiopia. Cogent Business & Management, 12(1), 2454325. [Google Scholar] [CrossRef]
- Setiawan, P. Y., Purbadharmaja, I. B. P., Widanta, A. A. B. P., & Hayashi, T. (2021). How electronic word of mouth (e-WOM) triggers intention to visit through destination image, trust and satisfaction: The perception of a potential tourist in Japan and Indonesia. Online Information Review, 45(5), 861–878. [Google Scholar] [CrossRef]
- Shuhua, Y., Tianyi, C., & Chengcai, T. (2024). The impact of tourism destination factors in video games on players’ intention to visit. Journal of Resources and Ecology, 15(2), 474–483. [Google Scholar] [CrossRef]
- Siang, J.-H., Yang, W.-G., & Liu, L.-W. (2020). Impact of WOM and online WOM on tourist destinations in Indonesia. Utopía y Praxis Latinoamericana, 25(10), 297–309. [Google Scholar] [CrossRef]
- Silva, L. M. A., Andrade, O. F. C., & Muñoz, P. P. J. (2020). Effects of the advertising language and the tourist destination used in Facebook commercial pages on the generation of electronic word of mouth. Estudios Gerenciales, 36(156), 264–271. [Google Scholar] [CrossRef]
- Singh, K. R. (2013). Prioritizing the factors for coordinated supply chain using analytic hierarchy process (AHP). Measuring Business Excellence, 17(1), 80–97. [Google Scholar] [CrossRef]
- Solomon, N.-A. E., Adu-Debrah, K. L., & Braimah, M. S. (2022). Promoting tourism destinations through storytelling. In Global perspectives on strategic storytelling in destination marketing. IGI Global. [Google Scholar] [CrossRef]
- Sotiriadis, M. (2021). Tourism destination marketing: Academic knowledge. Encyclopedia, 1(1), 42–56. [Google Scholar] [CrossRef]
- Stefko, R., Fedorko, R., Bacik, R., Rigelsky, M., & Olearova, M. (2020). Effect of service quality assessment on perception of TOP hotels in terms of sentiment polarity in the Visegrad group countries. Oeconomia Copernicana, 11(4), 721–742. [Google Scholar] [CrossRef]
- Suryana, M., Susanto, E., Prawira, A. F. M., & Afgani, F. K. (2024). Exploring the role of social media platforms in promoting tourism diversity. Journal of Business Management Education (JBME), 9(1), 13–26. [Google Scholar] [CrossRef]
- Šegota, T., Chen, N., & Golja, T. (2021). The impact of self-congruity and evaluation of the place on WOM: Perspectives of tourism destination residents. Journal of Travel Research, 61(4), 800–817. [Google Scholar] [CrossRef]
- Šerić, M., Došen, Đ. O., & Mikulić, J. (2022). Antecedents and moderators of positive word of mouth communication among tourist destination residents during the COVID-19 pandemic. Current Issues in Tourism, 26(2), 224–241. [Google Scholar] [CrossRef]
- Šostar, M., Andrlić, B., & Ramanathan, N. H. (2024). The influence of online reviews on hotel attractiveness perceptions: A gender-based comparative study. In Tourism and hospitality industry 2024: Trends and challenges: Congress proceedings (pp. 121–129). Fakultet za menadžment u turizmu i ugostiteljstvu. [Google Scholar] [CrossRef]
- Šostar, M., & Ristanović, V. (2023a). An assessment of the impact of the COVID-19 pandemic on consumer behavior using the analytic hierarchy process model. Sustainability, 15(20), 15104. [Google Scholar] [CrossRef]
- Šostar, M., & Ristanović, V. (2023b). Assessment of influencing factors on consumer behavior using the AHP model. Sustainability, 15(13), 10341. [Google Scholar] [CrossRef]
- Šostar, M., & Ristanović, V. (2024). Evaluating consumer preferences for sustainable products: A comparative study across five countries. World, 5(4), 1248–1266. [Google Scholar] [CrossRef]
- Taheri, B., Chalmers, D., Wilson, J., & Arshed, N. (2021). Would you really recommend it? Antecedents of word-of-mouth in medical tourism. Tourism Management, 83, 104209. [Google Scholar] [CrossRef]
- Tkalec, M., Zilic, I., & Recher, V. (2017). The effect of film industry on tourism: Game of thrones and dubrovnik. International Journal of Tourism Research, 19(6), 705–714. [Google Scholar] [CrossRef]
- Tošović-Stevanović, A., & Ristanović, V. M. (2024). Farm economy in Serbia—Distribution channels f sustainable products. Economic of Agriculture, 71(4), 1225–1235. [Google Scholar] [CrossRef]
- Toubes, D. R., Araújo Vila, N., & Fraiz Brea, J. A. (2021). Changes in consumption patterns and tourist promotion after the COVID-19 pandemic. Journal of Theoretical and Applied Electronic Commerce Research, 16(5), 75. [Google Scholar] [CrossRef]
- Vargas, R. V. (2010). Using the analytic hierarchy process (AHP) to select and prioritize projects in a Portfolio. In PMI global congress 2010—North America, Washington DC. Project Management Institute. [Google Scholar]
- Vila, A. N., Brea, F. A. J., & de Carlos, P. (2021). Film tourism in Spain: Destination awareness and visit motivation as determinants to visit places seen in TV series. European Research on Management and Business Economics, 27(1), 100135. [Google Scholar] [CrossRef]
- Wang, Y., & Han, W. (2022). The influence of destination promotion videos on residents’ sense of empowerment and support for tourism. SAGE Open, 12(3), 21582440221106730. [Google Scholar] [CrossRef]
- Warapsari, D., & Rusfian, Z. E. (2021). Electronic word-of-mouth turis muslim mengenai pariwisata halal di lombok, nusa tenggara barat, Indonesia. Religion and Culture in Tourism Studies, 5(1), 97–110. [Google Scholar] [CrossRef]
- Wibisono, D. R., & Lale, J. (2024). The impact of social media on tourist destination choices: A quantitative analysis. American Journal of Open Research, 3(6), 141–146. Available online: https://scispace.com/pdf/the-impact-of-social-media-on-tourist-destination-choices-a-2fv6o859rg.pdf (accessed on 20 January 2025). [CrossRef]
- Xu, F., Niu, W., Li, S., & Bai, Y. (2020). The mechanism of word-of-mouth for tourist destinations in crisis. SAGE Open, 10(2), 2158244020919491. [Google Scholar] [CrossRef]
- Yin, C.-Y., Bi, N., & Chen, Y. (2020). You exist in my song! How a destination-related popular song enhances destination image and visit intentions. Journal of Vacation Marketing, 26(3), 305–319. [Google Scholar] [CrossRef]
- Zhou, Y., Liu, L., & Sun, X. (2022). The effects of perception of video image and online word of mouth on tourists’ travel intentions: Based on the behaviors of short video platform users. Frontiers in Psychology, 13, 984240. [Google Scholar] [CrossRef] [PubMed]


Disclaimer/Publisher’s Note: The statements, opinions and data contained in all publications are solely those of the individual author(s) and contributor(s) and not of MDPI and/or the editor(s). MDPI and/or the editor(s) disclaim responsibility for any injury to people or property resulting from any ideas, methods, instructions or products referred to in the content. |
© 2026 by the authors. Licensee MDPI, Basel, Switzerland. This article is an open access article distributed under the terms and conditions of the Creative Commons Attribution (CC BY) license.