Abstract
It is necessary for the allocation of resources to be more efficient, and making more adequate operational strategies to realize productivity change is contributed to by the kind of output sources in the hotel’s production process. This study tries to propose hotel productivity change models from overall and disaggregate perspectives by using the Luenberger productivity index based on directional distance function. Empirical findings briefly show that the overall productivity change of ITHs in Taiwan has a growing trend and is driven from a technical change rather than an efficiency change. Moreover, the disaggregate hotel productivity growth comes from the service of hotel facilities, but improving the performance of the catering service is more important to a hotel’s overall performance. Individual ITHs can grasp the contribution of disaggregate hotel productivity growth on the overall productivity change, maintaining or developing competitive advantages in the hotel’s operation and management. Therefore, the viewpoint of this study can not only be used to examine the hotel issues but also be applied to other issues in the hospitality and tourism industry that target overall and disaggregate productivity growth.
1. Introduction
The tourism industry has had a certain degree of influence on economic development in Taiwan. In 2005, the government negotiated with the China Tourism Association for Chinese mainland residents traveling to Taiwan, subsequently implementing “Administrative Measures for Mainland Residents Traveling to Taiwan” the next year. Great numbers of tourists from China and other countries have come to Taiwan for tourism during the period 2009–2015. In fact, the number of visitor arrivals with the purpose of tourism accounted for 44.36% of total visitor arrivals in 2007 but jumped to 70.73% of total visitor arrivals in 2016, for a growth rate of 1.59 times (Tourism Administration, 2016). Moreover, the number of Taiwan’s tourist hotels has risen from 87 to 118 during the period of 2005 to 2015. These phenomena show that it is indeed worth exploring the development of the hotel industry during this period, especially for ITHs.
How to survive in this highly competitive market has become a critical issue for general managers of ITHs. Anderson et al. (2000) mentioned that the performance of a firm is an important determinant of its survival in the long run. Phillips (1999) indicated that performance of any management process not only reflects the business situation in reality but also gives a competitive advantage for follow-up operations. As a result, the evaluation of hotel performances has received wider attention in the literature (Morey & Dittman, 1995; Tsaur, 2001; Hwang & Chang, 2003; Chiang et al., 2004; Barros, 2005a, 2005b; Wang et al., 2006a, 2006b; Hu et al., 2009; Yu & Lee, 2009; Chiu & Wu, 2010; Shieh, 2012; Higuerey et al., 2020; Yin et al., 2020; El Alaoui et al., 2023; Zhu et al., 2023; Vidali et al., 2024).
Taiwan’s international tourist hotels (ITHs) mainly provide several services, including lodging service, food and beverage (F&B) service, as well as other services provided by a hotel’s recreational facilities. Yu and Chen (2016) noted that hotel operators need more information regarding their performance to maintain or promote their competitiveness in the ITH industry. The performances are evaluated using productivity scores that allow one to understand only the relative efficiency of transforming inputs into outputs in the current period and contain more information regarding driving forces of inter-temporal improvement. Hence, each ITH should pay more attention to its productivity performance, especially for knowing which is the main source of productivity change.
Realizing a hotel’s productivity change is contributed to by the kind of output sources is helpful for allocating the resources to be more efficient and for helping hotel management to make more adequate business strategies. Traditionally, the total factor productivity (TFP) index, compared to the partial factor productivity index, commonly evaluates the productivity change that considers all dimensions of production resources in each decision-making unit (DMU) (Coelli et al., 2005). The Malmquist productivity index (MPI) and Luenberger productivity index (LPI) are widely adopted to evaluate productivity change in various industries, but Boussemart et al. (2003) and Managi (2003) indicated that MPI may overestimate productivity growth. C. P. Chen et al. (2013) indicated that MPI is derived from the proportional distance function that assumes all factors have the same distance to the frontier, preventing us from examining the various contribution of each factor on productivity change. More importantly, MPI and LPI are aggressive and do not simultaneously evaluate the TFP change and the productivity change of a single factor under the total factor framework (Chang et al., 2012).
To our best knowledge, the existing studies mainly focus on evaluating overall hotel productivity change but neglect to discuss the main source of productivity change from a hotel’s multiple activities. Barros and Alves (2004), Barros (2005b), Hwang and Chang (2003), Yu and Chen (2016), and Cordero and Tzeremes (2017), use MPI to investigate the hotel’s overall productivity change. Moreover, Wheeler and Zang (2018), Tzeremes (2019), El Alaoui et al. (2023), and Choi and Kim (2024) discuss the hotel’s productivity change by using advanced DEA methodologies under overall productivity perspective, but they still do not point out the relationship between overall and disaggregate hotel productivity change. The existing studies have mentioned that disaggregate productivity change offers more information for nations and industries (C. P. Chen et al., 2011; Chang et al., 2012; C. P. Chen et al., 2013), but scant attention has been paid to measure the productivity change from the overall and disaggregate perspectives, especially for the hotel industry.
The distinguishing features of this study’s analysis are provided in several points. First, this paper aims to simultaneously evaluate the overall hotel productivity change and the productivity change of an individual output factor under the total factor framework. Different from the concept of the traditional productivity change index, we extend the traditional LPI with a strongly efficient vector for each output and then evaluate overall and disaggregate hotel productivity change indices. Second, the proposed index from the overall perspective enables us to adequately evaluate the overall hotel productivity changes and its components. We show that the overall productivity change of ITHs in Taiwan has a growing trend and is driven from the technical change rather than the efficiency change. Third, the proposed index herein mainly shows that the overall hotel productivity change is the average of disaggregate hotel productivity changes. The previous studies ignored the contribution of disaggregate hotel productivity changes on overall hotel productivity change. This study explores the contribution (improvement or deterioration) of each output factor from different hotel activities to the overall productivity change in the hotel industry. Fourth, understanding hotel productivity change from overall and disaggregate perspectives not only provide theoretical contributions but also have managerial implications for hotel resource allocation and operational strategies. Therefore, this study provides a reference direction for academic research and industrial practice in the hospitality industry.
The remainder of this study is organized as follows. Section 2 reviews the relevant literature of performance evaluation on the hotel industry. Section 3 addresses the estimating methodology, in which we propose the concept of overall and disaggregate hotel Luenberger productivity indices and also show how to evaluate them. Section 4 displays and discusses the estimating dataset and results of productivity change in Taiwan’s ITHs. The concluding remarks are discussed in the Section 7.
2. Literature Review
When the existing studies discuss a hotel’s performance, its efficiency is usually one of the various indicators for any performance evaluation. An efficiency indicator can simultaneously take into account multiple inputs and outputs rather than other indicators that only consider the performance of a single factor, which fails to reflect the multidimensional nature of a hotel (Yu & Chen, 2016). Two main approaches are used to evaluate hotel efficiency. One is the stochastic frontier approach (SFA), which is a parametric approach (Lovell & Schmidt, 1993). Several existing studies evaluate hotel efficiency under the SFA framework such as Anderson et al. (1999), Anderson et al. (2000), Barros (2004, 2006), C. Chen (2007), Assaf et al. (2012), Hu et al. (2010), Kim (2011), Lin (2011), Salman Saleh et al. (2012), Assaf (2012), Assaf and Barros (2013), Arbelo et al. (2017), and Assaf and Tsionas (2018). However, with the development of newer methodologies, more recent research has increasingly addressed the limitations of SFA, especially its inability to account for nonlinearity and the diverse nature of hotel operations.
The second common method is a non-parametric approach, which is the famous data envelopment analysis (DEA). To the best of our knowledge, DEA has two main advantages over SFA. First, DEA is more flexible than SFA, as the latter cannot assume the functional form of the production function or distance function when evaluating efficiency scores. Second, the DEA methodology can consider multiple outputs and inputs in the analysis, especially for the multiple output features of a firm’s operations. DEA has been applied for performance evaluation in many industries including the hotel industry. The existing studies on this issue that used traditional or advanced DEA models include Morey and Dittman (1995), Tsaur (2001), Hwang and Chang (2003), Chiang et al. (2004), Barros (2005a), Barros and Mascarenhas (2005), Wang et al. (2006a), Barros and Dieke (2008), Hu et al. (2009), Yu and Lee (2009), Chiu and Wu (2010), Shieh (2012), Manasakis et al. (2013), Luo et al. (2014), and Ramanathan et al. (2016).
Recent studies have extended the application of DEA models to hotel efficiency evaluation, such as Tan and Despotis (2021) and Choi and Kim (2024), who explored new DEA-based approaches for assessing hotel performance. Vidali et al. (2024) highlight the strengths and weaknesses of both parametric and non-parametric methods in measuring hotel efficiency. However, the hotel efficiency indices in the existing literature can offer insight only into the relative efficiency of converting inputs into outputs at a specific point in time. This static index provides no information about the driving forces behind inter-temporal efficiency or technical improvement.
3. Previous Study Analysis
This section provides a comparison of the existing studies and summarizes key articles, their methodologies, aim, variables, findings, and contributions as shown in Table A1. The hotel efficiency indices typically belong to a static measurement, but a productivity index belongs to a dynamic measurement, giving more information for understanding the intertemporal efficiency or technical improvement of hotel performance. Such an index would help hotel managers design appropriate strategies to improve resource allocation efficiently (Barros & Alves, 2004).
To address the limitations of traditional indices, this study adopts the Luenberger productivity index (LPI) to evaluate productivity changes in hotels. The LPI overcomes the main drawback of the Malmquist Productivity Index (MPI), which assumes all factors are equidistant from the frontier. The Malmquist productivity index developed by Caves et al. (1982) is widely adopted to analyze the nature of efficiency change in various industries. Several studies evaluate a hotel’s productivity change by using MPI such as Barros and Alves (2004), Barros (2005b), Hwang and Chang (2003), Yu and Chen (2016), and Cordero and Tzeremes (2017). However, recent studies have shifted to apply LPI to evaluate hotel productivity changes, such as Wheeler and Zang (2018) and Tzeremes (2019), indicating that LPI provides a more comprehensive view of productivity change by considering the contributions of individual factors.
This study fills the gap in the existing literature by evaluating productivity changes in hotels from both overall and disaggregate perspectives. By using LPI, we can simultaneously assess overall hotel productivity changes while also investigating the contributions (improvements or deteriorations) of each output factor to overall hotel productivity. This more granular approach allows for a deeper understanding of the dynamics of hotel performance. The existing research on hotel productivity largely focuses on overall efficiency or general productivity changes. However, few studies explore the contribution of individual factors to productivity changes, leaving a gap in understanding the specific drivers of hotel performance. This study aims to fill this gap by evaluating both overall and disaggregated hotel productivity changes by using the Luenberger productivity index (LPI), which provides a more precise and comprehensive assessment of each output factor’s contribution to overall productivity changes. The proposed model will be discussed in the next section.
4. Empirical Methodology
4.1. Overall and Disaggregate Hotel Luenberger Productivity Indices
This section introduces how to construct the disaggregate hotel productivity change by using the Luenberger productivity indicator. To model the production process, we assume that is the production technology in which ITH k adopts multiple inputs, to produce a vector of outputs, and in time period t. Here, for each ITH is defined as the set of all feasible input–output vectors:
After formally defining the production technology, we use the directional distance function (DDF) to construct the hotel Luenberger productivity indicator. Formally, the output DDF in period is defined as
where is non-zero vectors in . The output DDF directional allows decision-making units (DMUs) to simultaneously seek the maximum expansion of outputs (y) to optimize the production for any given production technology. The value of DDF equals zero if a country is technically efficient, whereas the value of indicates the production is inefficient.
We finally can use the directional distance function in different time periods relative to the different period technology to measure productivity change by following Chambers et al. (1996). The hotel Luenbereger productivity indicator (HLPI) is set up as follows:
If the value of the index is less than, equal to, or larger than zero, then it stands for productivity regress, no change, or progress between periods t and t + 1, respectively. Moreover, HLPI can be decomposed into hotel efficiency change (HEC) and hotel technical change (HTC) as follows:
We note that HEC equals the difference in the directional distance function between two periods, while technical change equals the average ‘shift’ in the frontier. Efficiency change measures any changes in the position of the production unit relative to the best-practice frontier over time and represents the so-called ‘catching up’ effect—that is, convergence towards or divergence from the best practice. On the other hand, HTC equals the average ‘shift’ in the best-practice frontier from period to period and represents the ‘innovation’ effect—that is, improvement or deterioration in the performance of best-practice production units.
Our aim is to understand the role of individual output in hotel productivity. This study thus first uses the concept of Equation (3) to propose the disaggregate hotel Luenberger productivity index (DHLPI), which represents the output-factor hotel productivity index as follows:
Note that if the value of DHPI is less than, equal to, or greater than zero, then it indicates that the productivity of the ith output regresses, does not change, or progresses from periods t to t + 1. Consequently, to measure the change in relative efficiency and the shift in the technology of the ith output, DHPI can be further decomposed into two components: disaggregate hotel efficiency change (DHEC) and disaggregate hotel technical change (DHTC).
We next convert the contribution of each DHPI in the overall HLPI by following the definition and its components of Equations (3)–(5). Since is equal to the arithmetic mean of the distance functions of all outputs, we decompose the hotel productivity change into the productivity change of the individual output as:
Equation (7) indicates that the overall hotel productivity change is the arithmetic mean of the change in individual output-factor productivity. Moreover, the efficiency change and technical change in individual output can be aggregated as overall hotel efficiency change and overall hotel technical change, respectively. Under the disaggregate perspective, we are interested in the main source of hotel productivity—that is, to explore which output factor mainly contributes to hotel productivity growth, especially in ITHs.
4.2. Model Specification and Evaluation
After defining the hotel productivity index and all its decompositions, the question becomes how to evaluate these indices. To our best knowledge, we can apply the directional distance function to evaluate the output DDF from the above equations. However, this prevents us from examining the possible difference in productivity change across output rather than the proportional distance function that assumes all factors have the same distance to the frontier. Therefore, as the goal of a hotel’s productivity activities focuses on creating more output, we assume that the linear programming method of the directional distance function will maximize expanding outputs (y) given fixed inputs.
Let there be S inputs and W good outputs for each hotel in time t. The sth input and wth good output variable of the kth hotel are represented by and in time t, respectively. Therefore, the directional distance function for hotel k in time t can be evaluated by the following linear programming (LP) model:1
where is the intensity variable that serves to form a convex combination of observed inputs and outputs. As shown in Equation (8), the variable is the inefficiency level of the disaggregate output. Consequently, the calculation of is similar to Equation (8), where t + 1 is substituted for t.
As for the evaluation of the two intertemporal directional distance functions, and , we obtain the measures by solving the following linear programming problems:
and
Finally, we obtain HLPI from solving the above linear programming problems. All decompositions of HLPI and can also be calculated from the results of the above linear programming problems.
5. Empirical Results
5.1. Data Descriptions and Sources
Since the hotel production process includes multiple decision-making activities, these ITHs not only provide accommodation services but also other services such as catering and entertainment from the hotel’s facilities (Wheeler & Zang, 2018). Only using number of rooms and number of employees, as well as total fixed assets, as inputs in the hotel production process is a common approach but not comprehensive. Several studies as shown in Table A1 have evaluated a hotel’s performance by employing a combination of flow and stock variables to represent the inputs and outputs, such as occupancy rate, revenues, number of rooms, expenditure, and number of employees, which may encounter double-counting problems.
In practice, most ITHs cannot immediately adjust the amount of fixed assets in the short run. A hotel general manager basically focuses on how to gain more revenue after paying those necessary operating expenditures. Therefore, the input–output variables of this study are adopted by the viewpoint of flow variables to show the operating conditions in each year of the current period when evaluating the hotel’s performance. Moreover, all resources required for the hotel production process can be comprehensively considered by using various expenditures as hotel production inputs, shown as the dotted line in Figure 1. Different from the existing studies, this alternative viewpoint for selecting the input–output variables when evaluating hotel productivity change are not only closer to the practical operations of hotel management but also provide another viewpoint for evaluating hotel performance as a future reference.
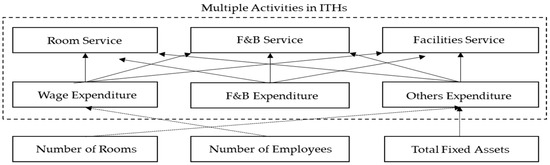
Figure 1.
Hotel production process from multiple activities.
Existing studies using the combination of flow and stock variables to represent the inputs and outputs may have the double-counting problem and be less close to practical experience. This study selects three input variables: employee wage expenditure, food and beverage (F&B) expenditure, and other facilities’ operating expenditure. Employee wage expenditure mainly includes total expenditure for all hotel staff such as the salaries, insurance fees, etc. The number of employees affects the level of this expenditure. To avoid the problem of double-counting for labor input, one can use this flow variable method as it does not need to be added to the labor stock variable. F&B and other facilities’ operating expenses mainly represent things like F&B ingredients, room accessories and amenities, other facility maintenance fees, etc., which come from fixed assets. More fixed assets at a hotel will directly reflect the level of these expenses. Similarly, using these flow variables to replace stock variables of F&B and other operations can avoid the double-counting problem of these inputs. On the other hand, three major outputs in this study include room operating revenue, F&B revenue, and other facilities’ operating revenue. Room and F&B operating revenues account for approximately 80% of the total revenue. Other facilities’ operating revenue may include revenue from the swimming pool, laundry, rental service, etc.
All output and input variables utilized in this study belong to a panel dataset of 56 ITHs over the period 2005–2014. Output and input variables of each international tourist hotel are mainly collected from the Tourism Statistics Annual Report and Annual Report on the International Tourist Hotel Business Survey published by the Taiwan Tourism Administration.2 Since the data cover a time span of ten years, all variables in monetary units have been transformed into real variables in terms of million New Taiwan Dollars (NTD) in the year 2010. Table 1 describes the summary statistics of these input and output variables. During the sampling period, Taiwan’s ITHs were facing a state of fierce competition, and it is worthwhile to investigate their productivity changes, especially from the overall and disaggregate perspectives. However, due to the limited official release of information, information in recent years has been restricted by the completeness of variable information disclosure, and there is no complete disclosure information about input variables. This limitation of the data period is a major difficulty facing this research. Despite such a limitation, it is still worth exploring the changes in hotel productivity from the overall and disaggregate perspectives.

Table 1.
Descriptive statistics of input and output variables.
Table 2 demonstrates the correlation matrix of input and output variables, whereby positive correlations exist between inputs and outputs, thus satisfying the isotonicity property that an output does not decrease with an increase in an input. These results not only confirm isotonicity between any input and both of the two outputs in the linear programming model but also can be applied to analyze HLPI and its components by our framework of inputs and outputs.
Table 2.
The correlation matrix of input and output variables.
5.2. Overall Hotel Productivity Change Index and Its Components
Based on the framework of the Luenberger productivity index, this study develops the hotel Luenberger productivity index (HLPI) and solves the aforementioned linear programming problem by using LINGO software 20.0. It enables us to adequately evaluate the productivity change in ITHs and further decompose it into two components parts: hotel efficiency change (HEC) and hotel technical change (HTC). The former is the change in relative hotel efficiency, measuring how each ITH is getting closer to or farther away from its annual frontier (catch-up effect or fall-behind effect). The latter is the shift in the production frontier under the total-factor framework. An expanding technology frontier is generally contributed to by innovations, technology upgrading, diffusion, etc. This is the so-called innovation effect.
Table 3 displays the empirical results of HLPI for each ITH during the 2005–2014 period, showing that the average HLPI reaches only a growth of 0.5894% for all sample hotels. In terms of operation type, the productivity of chain-operated hotels or independent-operated hotels averagely shows a positive growth trend, but the average productivity growth rate of independent-operated ITHs is higher than that of chain-operated ITHs. Table 3 also shows that the period of major productivity growth is from 2010 to 2011 and that there is a slight increase or decline in the remaining years. We also find that independent-operated ITHs on average have experienced a decline in the growth rate of productivity versus that of chain-operated hotels from 2011 to 2012.
Table 3.
Annual HLPI by operation type and region (%).
In terms of regions, the ITHs in the south on average show a higher productivity growth trend than do the other regions, followed by those in the east. In contrast, the productivity of ITHs in the north and central regions shows a declining trend. Moreover, ITHs in the north and east regions have higher productivity growth from 2010 to 2011, but they also show a large productivity decline from 2011 to 2012. ITHs in the south region show a productivity growth trend from 2010 to 2011 but do not show productivity decline from 2011 to 2012. Therefore, the average productivity growth trend in the south region is more obvious than in the other three regions as there is a fluctuation in productivity changes during the sampling periods.
Table 4 displays the result of HEC for each ITH during the period 2005–2014. Drawn from results in Table 4, it is surprising to see that the average HEC is negative, indicating that those ITHs on average have a declining trend of 0.2774% in efficiency change during the sampling period. In terms of operation types, the efficiency change in chain-operated hotels or independent-operated hotels on average mainly shows a fall-behind effect, which means each ITH is moving far away from its annual frontier. Moreover, the average efficiency change in independent-operated ITHs is worse than those chain-operated ITHs. We further find that HEC of independent-operated ITHs during periods 2006–2007, 2008–2009, and 2011–2012 shows greater growth than those chain-operated hotels, implying that there exists a catch-up effect during these periods.
Table 4.
Annual HEC and HTC by operation type and region (%).
As for the result of HEC for a hotel’s region, each region on average shows a trend of decline in efficiency change, with the largest decline in the south, followed by the north. Moreover, we find that each region exhibits a larger decline trend from 2010 to 2011 during the sampling period, but a larger growth trend from 2011 to 2012. The result of HEC in the north region is also similar to that in the east region, presenting a relatively large growth trend from 2010 to 2011 but also a relatively large decline from 2011 to 2012. Overall, HEC of the south region on average shows an obvious decline trend relative to the other regions, while the other regions mainly show a slight growth or decline trend during these periods.
Table 4 lists the result of HTC for each ITH during the period 2005–2014. On average, we find that the average HTC is positive, indicating that those ITHs have a growth trend of 0.8668% in technical change during the sampling period. In terms of operation types, the technical change in chain-operated hotels or independent-operated hotels averagely shows that there exists an innovation effect representing the improvement in the performance of best-practice production units. Moreover, the average technical change in independent-operated ITHs is better than those chain-operated ITHs. We further find that HTC of independent-operated ITHs has experienced a larger decline trend than that of chain-operated hotels during the period 2011–2012, showing that this is the main determination in the performance of best-practice production units during this period. Combined with the result of a negative average HEC in Table 4, we conclude that the positive hotel productivity change is mainly contributed to by technical change rather than efficiency change.
As for the result of HTC for a hotel’s region, each region on average shows a growth trend in technical change, with the largest growth in the south, followed by the east. Moreover, we find that the average HTC of the south and east regions shows a larger growth trend from 2010 to 2011, but a massive drop from 2011 to 2012. The result of HTC in the north region is also similar to the above two regions. Overall, the result of HTC in each region on average shows an obvious growth trend representing that there exists the innovation effect among these regions, especially in the south.
5.3. Disaggregate Hotel Luenberger Productivity Change Indices
Under the framework of the Luenberger productivity index, the linear programming problem in this study not only estimates HLPI and its components among ITHs but also evaluates the LPI of each output factor among these ITHs. This disaggregate perspective is from us defining DHLPI in Section 4.1, including the room hotel Luenberger productivity index (RHLPI), food and beverage hotel Luenberger productivity index (FHLPI), and other facilities’ hotel Luenberger productivity index (OHLPI) in order to explore the contribution of each output factor productivity change on overall hotel productivity change in a hotel.
The result of RHLPI during the period 2005–2014 appears in Table 5. On average, RHLPI shows a slight decline trend of 0.0030% during the sampling period. In accordance with the type of a hotel’s operation, RHLPI of independent-operated ITHs on average shows a growth trend of 0.0087%, while the RHLPI of chain-operated ITHs shows a decline trend of 0.0106%. Moreover, RHLPI of chain-operated ITHs experienced a large decline from 2008 to 2009 but productivity growth from 2009 to 2010. As a whole, RHLPI of chain-operated ITHs has shown a declining trend since the growth rate is less than the rate of decline. In 2009, when a large number of visitors from mainland China came to visit in Taiwan due to the open policy of tourism, independent-operated or chain-operated ITHs in response to market competition will adopt various operation strategies or establish more marketing channels to attract more tourists in advance. As a result, RHLPI of ITHs between these two types has a growth trend from 2009 to 2010.
Table 5.
Annual RHLPI by operation type and region (%).
As for the result of RHLPI for a hotel’s region, ITHs in the east region on average show a higher productivity growth trend of 0.0416% than in the other regions. ITHs in the east region exhibit a growth trend of RHLPI during the periods 2006–2008 and 2009–2013. ITHs in the south region also on average show a productivity growth trend of 0.0259%. ITHs there have a growth trend of RHLPI during the periods 2006–2007, 2009–2012, and 2013–2014. On the other hand, RHLPI of the north and central regions on average shows a decline trend of 0.0283% and 0.0305%, respectively. ITHs in the north and central regions similarly have a larger decline trend during the periods 2008–2009 and 2010–2011. Although these two regions have a growth trend during the periods 2008–2009 and 2009–2010, the growth rates of RHLPI in the two regions are less than the rate of decline. Overall, the result of RHLPI in the east region has an obvious growth trend compared to other regions, since eastern Taiwan has many natural and beautiful sights such as Taroko National Park, which is always a famous destination for international tourists.
The result of FHLPI during the period 2005–2014 is in Table 6. On average, FHLPI shows a slight decline trend of 0.0153% during the sampling period. FHLPI of chain-operated ITHs on average has a slight growth trend of 0.0088%, while FHLPI of independent-operated ITHs has a decline trend of 0.0528%. Moreover, FHLPI of chain-operated ITHs has a productivity growth trend for almost the whole sampling period. Although there are three periods of productivity decline, the overall growth rate of FHLPI is larger than the decline rate for chain-operated ITHs. On the contrary, independent-operated ITHs have a tendency for their FHLPI to drop during the sampling period. Typically, chain-operated ITHs have more advantages in catering costs for food purchases and economies of scale and are also more flexible for the types of catering services and adjustments. Therefore, the performance of FHLPI for chain-operated ITHs is generally better than that of independent-operated ITHs.
Table 6.
Annual FHLPI by operation type and region (%).
As for the result of FHLPI for a hotel’s region, ITHs in the north on average show a growth trend of 0.0148%, while ITHs in the south on average show a growth trend of 0.0110%. The catering markets for ITHs in the north and south regions are much more competitive since these two regions include Taipei and Kaohsiung, which are the two most populous cities in the country. In such a highly competitive environment, ITHs located in these two regions must pay more attention to the control of catering costs and how to create more revenue, even for types of services or meals. On the other hand, FHLPI of central and east regions on average has a decline trend of 0.0111% and 0.1691%, respectively. Looking at the productivity trends in each period, the east region has experienced a drop in FHLPI since 2011. The central region has trends of growth or decline during the sampling period, but the growth is less than the decline. Overall, the result of FHLPI in the north region has an obvious growth trend compared to the other regions.
The result of OHLPI during the period 2005–2014 appears in Table 7. On average, OHLPI shows a slight growth trend of 1.7673% during the sampling period. In accordance with the type of hotel operations, RHLPI of independent-operated and chain-operated ITHs on average shows a growth trend of 1.5105% and 2.1623%, respectively. Looking at the productivity trends in each sub-period, independent-operated ITHs have a relatively large growth trend from 2010 to 2011. Although OHLPI has been declining from 2011 to 2012, the growth is larger than the decline. Typically, the performance of other facilities is very important for international tourist hotels, especially for independent-operated ones, since the provision of other facilities’ services can make hotel operations more diverse, while at the same time creating unique hotel style characteristics. Therefore, the performance of FHLPI for independent-operated ITHs is generally better than that of chain-operated ITHs.
Table 7.
Annual OHLPI by operation type and region (%).
As for the result of OHLPI for a hotel’s region, ITHs in the south and east, respectively, show a growth trend of 5.5731% and 3.8388%. This finding represents that the ITHs located in these two regions put more emphasis on the performance of other facilities in their hotel. On the other hand, FHLPI of central and east regions on average shows a decline trend of 0.7308% and 0.3448%, respectively. In general, the facilities of Taiwan’s ITHs in the south and east regions are much richer and more diverse than those in the north and central regions, mainly due to these hotels having the characteristics of attractive sightseeing spots and abundant natural resources and taking the purposes of resort and leisure as their development features. Therefore, a hotel’s facilities not only are regarded as a marketing tool but also play a very important role in improving a hotel’s productivity, especially for ITHs in the south and east regions.
6. Summary and Discussions
Based on the above-mentioned empirical results, this section first summarizes our main finding in several points:
- Hotel productivity change in Taiwan slightly reaches a growth of 0.5894% during the sample periods. No matter what kind of operation-type, hotels show a positive growth trend, but the independent-operated hotels are averagely higher than chain-operated hotels.
- As for the changes in Taiwan’s hotel productivity change in different regions, the southern and eastern regions showed growth, while the northern and central regions showed a decline trend.
- The main source of growth in Taiwan’s hotel productivity is from technological progress rather than efficiency improvement, implying that the innovation effect dominates the catch-up effect, especially for independent-operated ITHs.
- Hotel productivity change based on the disaggregate perspective can provide more detailed information for the individual output’s productivity change. Productivity growth from hotel facilities’ service is more beneficial to the overall hotel’s performance, especially in Taiwan’s ITHs.
- Although accommodation service is still the main service for all hotels, independent operators need to pay more attention to the productivity growth from hotel facilities’ services.
Second, this study further explores the contribution of disaggregate hotel productivity on the overall hotel productivity change in each ITH. This study compares the above-mentioned four productivity indicators, HLPI, RHLPI, FHLPI, and OHLPI, as listed in Table 8 below. On average, overall hotel productivity change exhibits a growth trend, in which disaggregate hotel productivity changes in rooms and food and beverages have slightly declined, while the disaggregate hotel productivity change in other facilities has increased. Therefore, the main source of productivity growth among the 56 ITHs is productivity growth from a hotel’s facilities, but the productivity decline from food and beverage service is detrimental to the hotel’s overall performance.
Table 8.
Comparison with overall and disaggregate productivity indices.
Finally, this study can provide the main sources of productivity changes in each ITH for reference in Taiwan’s hotel industry. From Table 8, we can take a look into those 25 of the 56 international tourist hotels that are showing overall productivity growth. There are seven ITHs in which all three disaggregate hotel productivities contribute to the hotels’ overall productivity growth, such as Numbers 11, 12, 33, 44, 46, 48, and 55. Six ITHs incur a contribution of disaggregate hotel productivity from rooms and other facilities on their overall hotel productivity growth, such as Numbers 18, 36, 37, 45, 52, and 56. Ten ITHs see a contribution of disaggregate hotel productivity from food and beverages or other facilities on overall hotel productivity growth such as Numbers 1, 2, 3, 11, 20, 26, 27, 38, 40, and 43. Therefore, an individual ITH can grasp the contribution of disaggregate hotel productivity growth on overall productivity and thus maintain or develop competitive advantages in its operations and management.
On the other hand, the empirical results show that 31 of the 56 international tourist hotels experience an overall hotel productivity decline. Ten ITHs have a deterioration in all three disaggregate hotel productivities on their overall hotel productivity changes, such as Numbers 5, 10, 20, 21, 25, 28, 42, 47, 48, and 51. Ten ITHs illustrate a deterioration of disaggregate hotel productivity from rooms and other facilities on their overall hotel productivity changes, such as Numbers 4, 7, 9, 13, 17, 19, 24, 26, 30, and 49. Eleven ITHs show a deterioration of disaggregate hotel productivity from food and beverages or other facilities on their overall hotel productivity growth, such as Numbers 6, 8, 16, 22, 29, 32, 34, 39, 50, 53, and 54. Therefore, an individual ITH with deterioration of disaggregate hotel productivity can relocate its hotel operating resources and formulate improvement strategies as a source of motivation for overall productivity improvement in the future.
7. Conclusions and Implications
With the rapid change in demand and a more competitive market in the global tourism industry, international tourist hotels (ITHs) must pay more attention to their productivity performance and whether their output has reached the optimum stage or not. The existing studies have mainly focused on evaluating overall performance with few discussing the contributions of ITH resources. Therefore, this study establishes an index to evaluate the productivity changes in ITHs from overall and disaggregate perspectives. Through these two perspectives, we are able to explore the productivity change in each hotel and also fully investigate the main source of productivity change from the types of output factors. The contribution of disaggregate hotel productivity changes can be used as a decision-making reference for ITH management.
This study utilizes a panel dataset of 56 ITHs in Taiwan during the period 2005–2014 to evaluate the main source of productivity change from overall and disaggregate perspectives by using the Luenberger productivity index based on the directional distance function. Our main findings are briefly summarized as follows. First, the overall productivity change in ITHs in Taiwan shows a growing trend and the main source of productivity change is technical change rather than efficiency change. Productivity growth mainly comes from the innovative effect, in which non-chain-operated ITHs have higher productivity growth than chain-operated ITHs. Second, from the disaggregate perspective, non-chain-operated ITHs show an increasing trend in the productivity of rooms and other facilities, while chain-operated ITHs have a growing trend in the productivity of food and beverages. Lastly, the productivity growth of other facilities plays an important role in the hotel’s overall productivity growth, but a decline in the productivity of food and beverage is detrimental to the hotel’s overall productivity growth among these 56 ITHs.
As for implications from this study, the proposed productivity indices in this study can firstly provide theoretical contributions relative to traditional productivity indices for researchers in the field of hospitality management in three points:
- This disaggregate hotel productivity index easily evaluates total factor productivity growth and decomposes overall productivity growth into the productivity change in each output.
- The overall hotel productivity growth is measured by the arithmetic mean of each output’s productivity change, implying it is the main force behind the hotel’s total factor productivity growth.
- The framework of this study can directly explore productivity changes by using financial data such as revenues and expenditure when more detailed hotel operational data are not available.
Second, while multiple inputs can produce various outputs in each decision-making unit of the hospitality industry, managerial implications inspired from this study can be provided in three points:
- Hotel managers should analyze the main source of hotel productivity growth for how to allocate their resources more efficiently and what is the best strategy in their hotel’s operations for improving productivity from the main output factor.
- Understanding the source of productivity growth is not only limited to the hotel industry. Similarly, the tourism and catering industry also need to pay more attention to the relationship between overall and disaggregate productivity growth.
- The results of overall and disaggregate productivity change are not only applicable to interpreting the Taiwan case but can also be extended to investigating other country’s cases.
Finally, since the issue of hotel productivity is important to researchers and managers, we can provide further research directions and limitations as follows:
- Since hotel performance has gradually been discussed through a dynamic framework in recent years, it is still less accurate to grasp the dynamic correlation of resource usage between the input and output factors across time periods in a hotel’s operation process. Thus, how to describe the dynamic framework of a hotel’s business performance still needs to be developed.
- The framework of this study does not take into account the sources or types of a hotel’s residents, especially in the face of the increasing number of visitor arrivals year after year for Taiwan. Due to the characteristics of different sources or types of a hotel’s residents, the performance of each hotel may seem to be different. Therefore, if this characteristic can be included in the analysis framework, then it will be more in line with practical needs.
- If detailed data are available, then examining the productivity change in general tourist hotels and comparing this to international tourist hotels can provide more insightful implications for the hotel industry within a country, especially for Taiwan’s case.
Author Contributions
Conceptualization, M.-C.C. and C.-P.C.; methodology, C.-P.C.; software, M.-C.C.; validation, M.-C.C., C.-P.C. and K.-W.C.; formal analysis, M.-C.C. and C.-P.C.; resources, K.-W.C.; data curation, K.-W.C.; writing—original draft preparation, C.-P.C.; writing—review and editing, M.-C.C.; visualization, K.-W.C.; supervision, M.-C.C.; project administration, C.-P.C. All authors have read and agreed to the published version of the manuscript.
Funding
This research was funded by [National Science and Technology Council] grant number [105-2410-H-434-001].
Institutional Review Board Statement
Not applicable.
Informed Consent Statement
Not applicable.
Data Availability Statement
The original data presented in the study are openly available in [Taiwan’s tourism statistics website] at [https://reurl.cc/VYad2n] (accessed on 30 March 2024).
Conflicts of Interest
The authors declare no conflicts of interest.
Appendix A
Table A1.
Summary of key studies for hotel’s efficiency and productivity.
Table A2.
List of international tourist hotels in Taiwan.
Notes
| 1 | In fact, this model’s DDF is similar to the Russell-based directional distance function (RDDF, hereafter) approach. Moreover, P. C. Chen et al. (2015) prove that the RDDF model presents some well-behaved properties and has a higher discriminating power than the Farrell efficiency measure. |
| 2 | Tourism statistics website: https://reurl.cc/VYad2n (accessed on 30 March 2024). |
References
- Anderson, R. I., Fish, M., Xia, Y., & Michello, F. (1999). Measuring efficiency in the hotel industry: A stochastic frontier approach. International Journal of Hospitality Management, 18, 45–57. [Google Scholar]
- Anderson, R. I., Fok, R., & Scott, J. (2000). Hotel industry efficiency: An advanced linear programming examination. American Business Review, 18, 40–48. [Google Scholar]
- Arbelo, A., Pérez-Gómez, P., & Arbelo-Pérez, M. (2017). Cost efficiency and its determinants in the hotel industry. Tourism Economics, 23, 1056–1068. [Google Scholar]
- Assaf, A. (2012). Benchmarking the Asia Pacific tourism industry: A Bayesian combination of DEA and stochastic frontier. Tourism Management, 33, 1122–1127. [Google Scholar]
- Assaf, A., & Barros, C. P. (2013). A global benchmarking of the hotel industry. Tourism Economics, 19, 811–821. [Google Scholar]
- Assaf, A., Barros, C. P., & Josiassen, A. (2012). Hotel efficiency: A bootstrapped metafrontier approach. International Journal of Hospitality Management, 31, 621–629. [Google Scholar]
- Assaf, A., & Tsionas, M. (2018). Measuring hotel performance: Toward more rigorous evidence in both scope and methods. Tourism Management, 69, 69–87. [Google Scholar] [CrossRef]
- Barros, C. P. (2004). A stochastic cost frontier in the Portuguese hotel industry. Tourism Economics, 10, 177–192. [Google Scholar]
- Barros, C. P. (2005a). Evaluating the efficiency of a small hotel chain with a Malmquist productivity index. International Journal of Tourism Research, 7, 173–184. [Google Scholar]
- Barros, C. P. (2005b). Measuring efficiency in the hotel sector. Annals of Tourism Research, 32, 456–477. [Google Scholar]
- Barros, C. P. (2006). Analyzing the rate of technical change in the Portuguese hotel industry. Tourism Economics, 12, 325–346. [Google Scholar] [CrossRef]
- Barros, C. P., & Alves, F. P. (2004). Productivity in the tourism industry. International Advances in Economic Research, 10, 215–225. [Google Scholar] [CrossRef]
- Barros, C. P., & Dieke, P. U. C. (2008). Technical efficiency of African hotels. International Journal of Hospitality Management, 27, 438–447. [Google Scholar] [CrossRef]
- Barros, C. P., & Mascarenhas, M. J. (2005). Technical and allocative efficiency in a chain of small hotels. International Journal of Hospitality Management, 24, 415–436. [Google Scholar]
- Boussemart, J. P., Briec, W., Kerstens, K., & Poutineau, J. C. (2003). Luenberger and Malmquist productivity indices: Theoretical comparisons and empirical illustration. Bulletin of Economic Research, 55, 391–405. [Google Scholar]
- Caves, D. W., Christensen, L. R., & Diewert, W. E. (1982). The economic theory of index numbers and the measurement of input, output, and productivity. Econometrica, 50, 1393–1414. [Google Scholar]
- Chambers, R. G., Chung, Y. H., & Färe, R. (1996). Benefit and distance function. Journal of Economic Theory, 70, 407–419. [Google Scholar] [CrossRef]
- Chang, T. P., Hu, J. L., Chou, R. Y., & Sun, L. (2012). The sources of bank productivity growth in China during 2002–2009: A disaggregation view. Journal of Banking and Finance, 36, 1997–2006. [Google Scholar]
- Chen, C. (2007). Applying the stochastic frontier approach to measure hotel managerial efficiency in Taiwan. Tourism Management, 28, 696–702. [Google Scholar] [CrossRef]
- Chen, C. P., Hu, J. L., & Yang, C. H. (2011). An international comparison for R&D efficiency of multiple innovative outputs: The role of the national innovative system. Innovation: Management, Policy, and Practice, 13, 341–360. [Google Scholar]
- Chen, C. P., Hu, J. L., & Yang, C. H. (2013). Produce patents or journal articles? A cross-country comparison of R&D productivity change. Scientometrics, 94, 833–849. [Google Scholar]
- Chen, P. C., Yu, M. M., Chang, C. C., Hsu, S. H., & Managi, S. (2015). The enhanced Russell-based directional distance measure with undesirable outputs: Numerical example considering CO2 emissions. Omega, 53, 30–40. [Google Scholar] [CrossRef]
- Chiang, W., Tsai, M., & Wang, L. S. (2004). A DEA evaluation of Taipei hotels. Annals of Tourism Research, 31, 712–715. [Google Scholar] [CrossRef]
- Chiu, Y. H., & Wu, M. F. (2010). Performance evaluation of international tourist hotels in Taiwan—Application of context-dependent DEA. INFOR: Information Systems and Operational Research, 48, 155–170. [Google Scholar]
- Choi, K., & Kim, J. (2024). Measuring hotel service productivity using two-stage network DEA. Sustainability, 16, 8995. [Google Scholar] [CrossRef]
- Coelli, T., Rao, D. S. P., O’Donnell, C. J., & Battese, G. E. (2005). An introduction to efficiency and productivity analysis (2nd ed.). Spinger. [Google Scholar]
- Cordero, J., & Tzeremes, N. (2017). Evaluating hotel productivity growth in Balearic and Canary islands. Tourism Economics, 23, 1146–1154. [Google Scholar] [CrossRef]
- El Alaoui, M. H., Ibrahim, M. D., Daneshvar, S., Alola, U. V., & Alola, A. A. (2023). A two-stage data envelopment analysis approach to productivity, efficiency and their sustainability in the hotel industry of Tunisia. Quality & Quantity, 57, 955–972. [Google Scholar]
- Higuerey, A., Viñan-Merecí, C., Malo-Montoya, Z., & Martínez-Fernández, V. A. (2020). Data envelopment analysis (DEA) for measuring the efficiency of the hotel industry in Ecuador. Sustainability, 12, 1590. [Google Scholar] [CrossRef]
- Hu, J. L., Chiu, C. N., Shieh, H. S., & Huang, C. H. (2010). A stochastic cost efficiency analysis of international tourist hotels in Taiwan. International Journal of Hospitality Management, 29, 99–107. [Google Scholar] [CrossRef]
- Hu, J. L., Shieh, H. S., Huang, C. H., & Chiu, C. N. (2009). Cost efficiency of international tourist hotels in Taiwan: A data envelopment analysis application. Asia Pacific Journal of Tourism Research, 14, 371–384. [Google Scholar] [CrossRef]
- Hwang, S. N., & Chang, T. Y. (2003). Use data envelopment analysis to measure hotel managerial efficiency change in Taiwan. Tourism Management, 24, 357–369. [Google Scholar]
- Kim, S. (2011). Factor determinants of total factor productivity growth in the Malaysian hotel industry: A stochastic frontier approach. Cornell Hospitality Quarterly, 52, 35–47. [Google Scholar]
- Lin, Y. H. (2011). Estimating cost efficiency and the technology gap ratio using the metafrontier approach for Taiwanese international tourist hotels. Cornell Hospitality Quarterly, 52, 341–353. [Google Scholar]
- Lovell, C. A. K., & Schmidt, P. (1993). Production frontiers and productive efficiency: Techniques and applications. Oxford University Press. [Google Scholar]
- Luo, H., Yang, Y., & Law, R. (2014). How to achieve a high efficiency level of the hotel industry? International Journal of Contemporary Hospitality Management, 26, 1140–1161. [Google Scholar] [CrossRef]
- Managi, S. (2003). Luenberger and Malmquist productivity indices in Japan, 1955–1995. Applied Economics Letters, 10, 581–584. [Google Scholar]
- Manasakis, C., Apostolakis, A., & Datseris, G. (2013). Using data envelopment analysis to measure hotel efficiency in Crete. International Journal of Contemporary Hospitality Management, 25, 510–535. [Google Scholar]
- Morey, R. C., & Dittman, D. A. (1995). Evaluating a hotel GM’s performance: A case study in benchmarking. Cornell Hotel Restaurant and Administration Quarterly, 36, 30–35. [Google Scholar]
- Phillips, P. A. (1999). Performance measurement systems and hotels: A new conceptual framework. International Journal of Hospitality Management, 18, 171–182. [Google Scholar]
- Ramanathan, R., Ramanathan, U., & Zhang, Y. (2016). Linking operations, marketing and environmental capabilities and diversification to hotel performance: A data envelopment analysis approach. International Journal of Production Economics, 176, 111–122. [Google Scholar]
- Salman Saleh, A., Assaf, A. G., & Son Nghiem, H. (2012). Efficiency of the Malaysian hotel industry: A distance function approach. Tourism Analysis, 17, 721–732. [Google Scholar]
- Shieh, H. S. (2012). Does cost efficiency lead to better financial performance? A study on Taiwan international tourist hotels. The Journal of Hospitality Financial Management, 20, 17–30. [Google Scholar]
- Tan, Y., & Despotis, D. (2021). Investigation of efficiency in the UK hotel industry: A network data envelopment analysis approach. International Journal of Contemporary Hospitality Management, 33, 1080–1104. [Google Scholar]
- Tourism Administration. (2016). Tourism statistics annual report 2016. Tourism Administration, Ministry of Transportation and Communications. [Google Scholar]
- Tsaur, S. H. (2001). The operating efficiency of international tourist hotels in Taiwan. Asia Pacific Journal of Tourism Research, 6, 73–81. [Google Scholar]
- Tzeremes, N. (2019). Hotel productivity: A robust Luenberger productivity indicator. Tourism Economics, 25, 987–996. [Google Scholar]
- Vidali, M. E., Menegaki, A. N., & Ahmad, N. (2024). Parametric and nonparametric measurement of efficiency in hotel industry: A systematic literature review. Journal of Economic Surveys. [Google Scholar] [CrossRef]
- Wang, F. C., Hung, W. T., & Shang, J. K. (2006a). Measuring pure managerial efficiency of international tourist hotels in Taiwan. Service Industries Journal, 26, 59–71. [Google Scholar]
- Wang, F. C., Shang, J. K., & Hung, W. T. (2006b). Productivity and service quality changes of international tourist hotels in Taiwan. Annals of Tourism Research, 33, 571–574. [Google Scholar]
- Wheeler, B., & Zang, L. (2018). Profit Luenberger and Malmquist-Luenberger indexes for multi-activity decision-making units: The case of the star-rated hotel industry in China. Tourism Management, 69, 1–11. [Google Scholar]
- Yin, P., Chu, J., Wu, J., Ding, J., Yang, M., & Wang, Y. (2020). A DEA-based two-stage network approach for hotel performance analysis: An internal cooperation perspective. Omega, 93, 102035. [Google Scholar] [CrossRef]
- Yu, M. M., & Chen, L. H. (2016). Productivity growth of Taiwanese international tourist hotels in a metafrontier framework. Cornell Hospitality Quarterly, 57, 38–50. [Google Scholar]
- Yu, M. M., & Lee, C. Y. (2009). Efficiency and effectiveness of service business: Evidence from international tourist hotels in Taiwan. Tourism Management, 30, 571–580. [Google Scholar] [CrossRef]
- Zhu, W., Lin, H., Yu, Y., & Ghiyasi, M. (2023). Performance measurement of Taiwan hotels with a hierarchical network DEA with shared inputs. International Journal of Applied Decision Sciences, 16, 474–507. [Google Scholar] [CrossRef]

Disclaimer/Publisher’s Note: The statements, opinions and data contained in all publications are solely those of the individual author(s) and contributor(s) and not of MDPI and/or the editor(s). MDPI and/or the editor(s) disclaim responsibility for any injury to people or property resulting from any ideas, methods, instructions or products referred to in the content. |
© 2025 by the authors. Licensee MDPI, Basel, Switzerland. This article is an open access article distributed under the terms and conditions of the Creative Commons Attribution (CC BY) license (https://creativecommons.org/licenses/by/4.0/).