


Abstract
Background/Objectives: PgRMC1 is a progesterone-binding protein often overexpressed in breast cancer, correlating with tumor progression and chemoresistance. Identifying predictive markers for neoadjuvant chemotherapy (NAC) response is crucial for guiding therapeutic decisions. This study examines PgRMC1 expression in breast cancer tissues and its correlation with clinicopathological characteristics and NAC response. Methods: PgRMC1 expression in normal and cancerous breast tissues was evaluated via immunohistochemistry (IHC). Expression of ER, PgR, HER2, AR, and PGRMC1 mRNA was determined by qPCR in 112 patients. A separate 44-patient neoadjuvant chemotherapy (NAC) cohort was assessed for intrinsic subtypes (pretreatment biopsies) alongside PgRMC1 IHC expression and pathological response (post-NAC surgical specimens). In vitro chemoresistance and qPCR analyses were performed in breast cancer cell lines following PgRMC1 overexpression or siRNA-mediated knockdown. Results: PgRMC1 expression was detected in breast cancer tissue, while no immunoreactivity was observed in normal breast tissue. PGRMC1 mRNA expression levels were significantly higher in luminal and HER2 subtypes. In the distinct cohort of patients treated with NAC, those with a poorer pathological response had significantly higher PgRMC1 expression than those with a good response. In vitro, forced overexpression of PgRMC1 in two breast cancer cell lines, MCF7 and MDA-MB-468, significantly reduced chemosensitivity. Overexpression of PgRMC1 modulated the expression of epithelial and differentiation markers, including CDH1, AR, KRT19, and GATA3. Conclusions: PgRMC1 may contribute to chemoresistance and serves as a candidate biomarker for assessing neoadjuvant chemotherapy sensitivity.
1. Introduction
Systemic therapies, including chemotherapy and endocrine therapy, have significantly improved the overall survival of patients with early-stage breast cancer [1,2]. Anthracycline-based and taxane-based chemotherapy regimens are widely employed in adjuvant settings for early-stage breast cancer. Additionally, patients with certain intrinsic subtypes exhibit high sensitivity to neoadjuvant chemotherapy (NAC) [3]. NAC aims to downstage the disease, potentially enabling breast-conserving surgery as an alternative to mastectomy. However, chemoresistance remains a critical challenge in breast cancer recurrence and metastasis [3,4,5]. Currently, established clinicopathological predictors for NAC response include estrogen receptor (ER), progesterone receptor (PgR), human epidermal growth factor receptor 2 (HER2) status, Ki-67 labeling index, which collectively define the intrinsic subtypes, and histological grade. Identifying novel markers that predict a patient’s response to NAC can significantly guide therapeutic decisions and thereby improve patient outcomes [6].
Progesterone receptor membrane component 1 (PgRMC1) is a progesterone-binding protein, initially purified from liver membrane fractions [7]. PgRMC1 exhibits diverse subcellular localizations, including the plasma membrane, endoplasmic reticulum, Golgi apparatus, and nucleus [8,9]. While its biological function is not completely understood, recent studies have highlighted elevated PgRMC1 expression in various cancer cells, including ovarian, liver, lung, colon, and breast cancer cells [10,11,12]. Notably, PgRMC1 expression correlates with cancer development, chemoresistance, and poor prognosis [9,13,14]. In the specific context of breast cancer treatment, a previous study by Willibald et al. demonstrated that high levels of PgRMC1 in tumor tissues are associated with a significantly worse response to anthracycline-based NAC [15].
Functional investigations have revealed that PgRMC1 plays a role in cell proliferation, independent of the classical progesterone receptor (PgR) pathway [16,17]. Furthermore, PgRMC1 interacts directly with P450 proteins, including CYP3A4, plasminogen activator inhibitor mRNA-binding protein 1 (PAIR-BP1), and epidermal growth factor receptor (EGFR) [8]. Notably, PgRMC1 undergoes unique haem-dependent dimerization, further enhancing its binding to EGFR and cytochrome P450, thereby promoting tumor cell proliferation and chemoresistance [18].
To clarify the biological function of PgRMC1 in breast cancer, we examined PgRMC1 expression in human breast cancer specimens and its association with response to NAC in operable breast cancer. We also investigated the mechanisms underlying PgRMC1-related chemoresistance in breast cancer cell lines.
2. Materials and Methods
2.1. Materials
Endoribonuclease-prepared siRNAs (esiRNAs) for PgRMC1 (EHU003641) and their negative controls were purchased from Merck (St. Louis, MO, USA). Progesterone (P8783) was purchased from Merck (St. Louis, MO, USA). Rabbit antibodies against PgRMC1(D6M5M), phospho-p44/42 MAPK (Erk1/2)(Thr202/Tyr204)(#9101), and phospho-Akt(Ser473)(D9E) were purchased from Cell Signaling Technology (Beverly, MA, USA). The CONFIRM anti-estrogen receptor (ER) (SP1) rabbit monoclonal antibody (ultraView kit, no. 790-4324), anti-PgR (1E2) rabbit monoclonal antibody (ultraView kit, no.760-2223), and PATHWAY anti-HER-2/neu (4B5) rabbit monoclonal antibody (no.790-2991) were all purchased from Ventana (Roche Diagnostics, Indianapolis, IN). Monoclonal mouse anti-human Ki-67 antibody (clone MIB-1) was obtained from Dako (Agilent Technologies, Inc., Santa Clara, CA, USA). The rabbit monoclonal antibody against PgRMC1 (D6M5M) (#13856, Cell Signaling Technology, MA, USA) was selected due to its validated sensitivity in varied IHC applications.
2.2. Patients and Samples
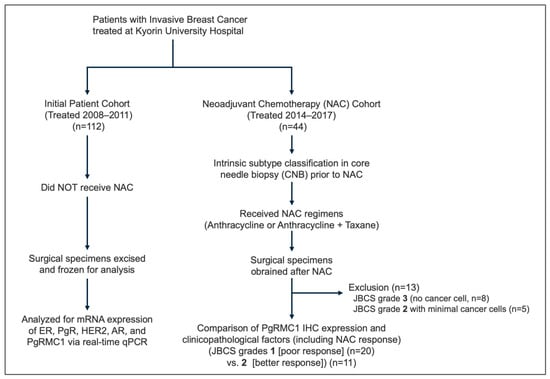
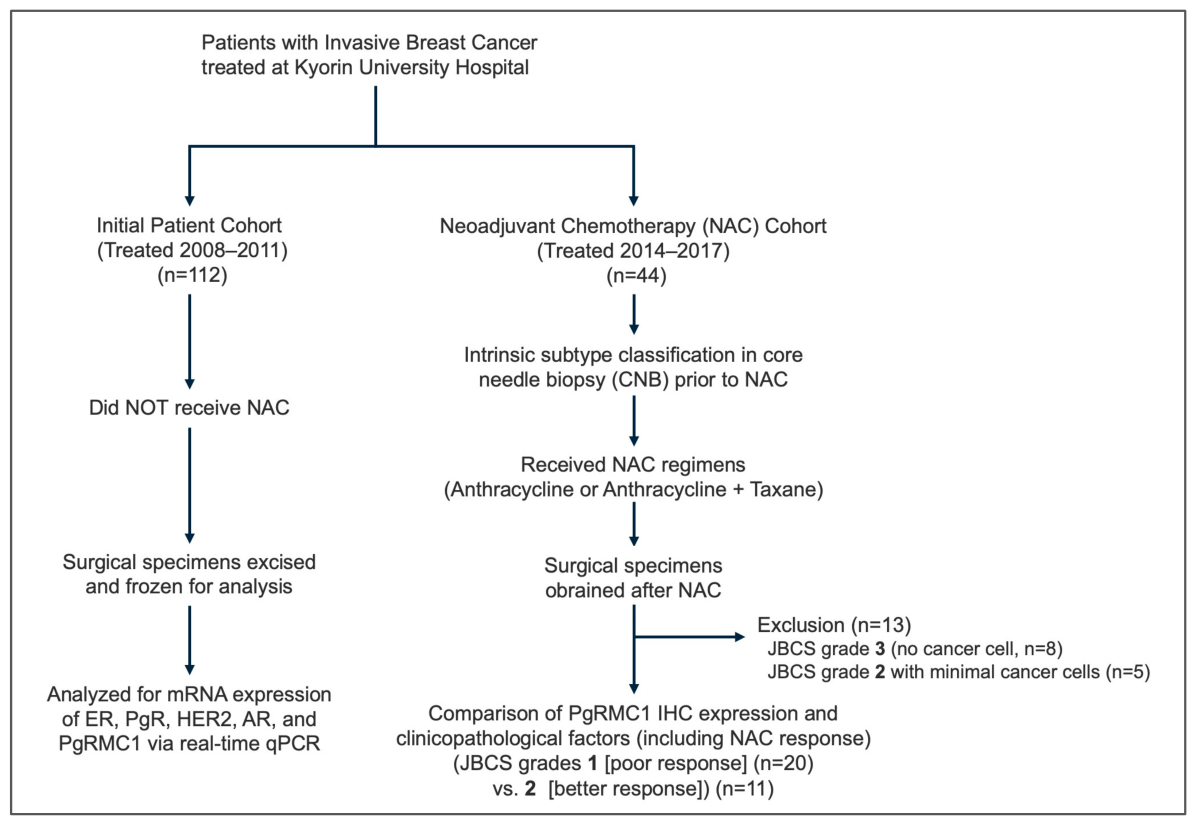
Breast cancer surgical specimens were obtained from patients with invasive breast cancer who were treated at Kyorin University Hospital between 2008 and 2011 (n = 112, Figure 1 and Table 1). From each specimen, approximately 125 mm3 of cancer tissues and paired adjacent non-cancerous tissue were excised and frozen at −80 °C for gene expression analysis. The rest of the tissues were fixed in 10% neutral buffered formalin for 48 h and embedded in paraffin. For patients treated with NAC between 2014 and 2017 (n = 44), pretreatment core needle biopsy (CNB) samples were used to classify intrinsic subtypes. Operatively resected surgical specimens obtained after NAC from these same patients were utilized for PgRMC1 IHC staining and association analyses with chemotherapy response. This study was approved by the institutional review board of Kyorin University School of Medicine (approval nos. 287 and 616; approval date: 8 October 2014).
Figure 1.
CONSORT flow diagram illustrating the selection and analysis of the two independent breast cancer patient cohorts. The study evaluates patients with invasive breast cancer treated at Kyorin University Hospital, divided into two distinct groups. The initial cohort (left) consists of 112 patients treated between 2008 and 2011 who did not receive neoadjuvant chemotherapy (NAC). Frozen surgical specimens from these patients were analyzed for the mRNA expression of ER, PgR, HER2, AR, and PgRMC1 using real-time qPCR. The second cohort (right) comprises a separate group of 44 patients treated between 2014 and 2017 who received NAC (anthracycline or anthracycline plus taxane regimens). For this NAC cohort, core needle biopsy (CNB) specimens obtained prior to treatment were used to classify intrinsic subtypes via immunohistochemistry (IHC) and WHO grade. Following NAC, operatively resected surgical specimens were evaluated for PgRMC1 expression via IHC, which was subsequently correlated with their pathological therapeutic response evaluated according to the histological therapeutic response criteria defined by the Japanese Breast Cancer Society (JBCS) [19] (Supplementary Table S1). No Grade 0 cases were observed in this cohort. Grade 3 cases were excluded from the PgRMC1 IHC evaluation. The distribution across subtypes was as follows: luminal A (6 in Grade 1, 4 in Grade 2); luminal B (7 in Grade 1, 4 in Grade 2); HER2 (0 cases); and TNBC (7 in Grade 1, 3 in Grade 2).
Table 1.
Patient demographic data of the initial patient cohort (n = 112).
2.3. Immunohistochemistry
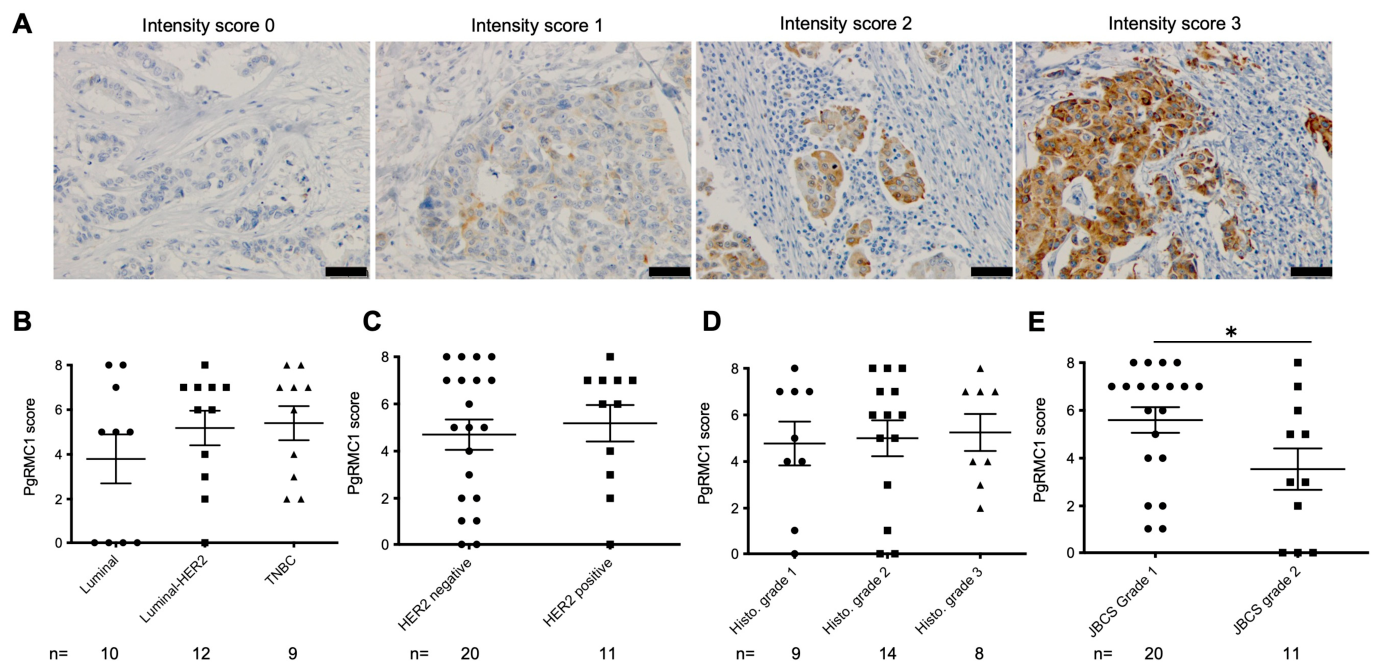
Immunohistochemistry (IHC) was performed as previously described [20]. Briefly, 4 µm thick sections were prepared on silane-coated glass slides. Standard antigen retrieval protocols were utilized prior to staining. Samples were incubated with appropriate primary antibodies (PgRMC1, dilution 1:1000; Ki-67, 1:100). Immunoreactivity was visualized with diaminobenzidine (DAB) using an Envision IHC kit from DAKO (Carpinteria, CA, USA), according to the manufacturer’s instructions. The PgRMC1 expression levels in the operatively resected surgical specimens were evaluated using the Allred score (sum of the intensity score and proportional score; total 0–8 points) for IHC. The intensity score (IS) was defined as 0 for no expression, IS 1 for slight staining visible at high magnification, IS 2 for weak to moderate staining visible at low magnification, and IS 3 for strong staining visible at low magnification. The proportional score (PS) was determined according to the Allred score as follows: PS 0 = 0% positive cells, PS 1 = <1%, PS 2 = 1–10%, PS 3 = 11–33%, PS 4 = 34–66%, and PS 5 = >66%. ER, PgR, HER2, and Ki-67 IHC were evaluated following the ASCO/CAP guidelines [21] and tumors were classified into surrogate intrinsic subtypes: luminal A (ER/PgR+, HER2−, low Ki-67), luminal B (ER/PgR+, HER2+; or ER/PgR+, HER2−, high Ki-67), HER2 (ER/PgR−, HER2+), and triple-negative (ER/PgR−, HER2−).
2.4. Real-Time qPCR Analyses
Total RNA was extracted from frozen tissue samples. Real-time qPCR was performed as previously described [22]. In brief, total RNA was prepared from frozen tissue samples using the RNeasy Plus Mini Kit from QIAGEN (Hilden, Germany), according to the manufacturer’s instructions. Reverse transcription was carried out using the ReverTra Ace kit from TOYOBO (Osaka, Japan). RT-PCR was performed using Fast SYBR® Green Master Mix from Applied Biosystems (Foster City, CA, USA) under the following conditions: denaturation at 95 °C for 30 s, annealing at 60 °C (PgRMC1 62.5 °C) for 30 s, and extension at 72 °C for 60 s, repeated 40 cycles (primer sets used in the study are indicated in Table 2). The relative mRNA expression was determined by the 2−∆∆Ct method with GAPDH mRNA for normalization.
Table 2.
Primer sets used in the study.
2.5. Cell Lines and Chemoresistance Assays
We used six human breast cancer cell lines: luminal subtype cell lines (MCF7 and T47D), HER2 subtype cell line (SKBR3), and triple-negative cell lines (MDA-MB231, MDA-MB453, and MDA-MB-468). All cells were cultured in Dulbecco’s Modified Eagle’s Medium (DMEM) (Merck) with 10% fetal bovine serum (FBS) (Bio West, Nuaillé, France), supplemented with 50 U/mL penicillin and 100 µg/mL streptomycin (Merck) at 37 °C and 5% CO2.
For transient transfection, 1 × 10⁶ cells were seeded in each well of a 6-well plate the day before transfection and transfected with 2.5 μg PgRMC1 vector (pCMV6-PgRMC1/Myc-DDK-tagged [human PgRMC1; NM_006667], cat no. RC201918, purchased from OriGene Technologies, Inc. (Rockville, MD, USA) and empty backbone vector using Lipofectamine 3000 (Thermo Fisher Scientific, Waltham, MA, USA) according to the manufacturer’s instructions. For PgRMC1 knockdown, 1 × 10⁶ cells were transfected with 30 pmol of esiRNAs targeting PgRMC1 (Merck) or negative controls (Merck) using Lipofectamine RNAiMAX (Thermo Fisher Scientific) according to the manufacturer’s instructions.
For cytotoxicity assays, cells with or without overexpression/knockdown of PgRMC1 were seeded at 3 × 10³ cells/well in 96-well plates. Cells were cultured in DMEM supplemented with charcoal-treated FBS (10%) and 1nM E2 + 10nM progesterone [23], together with the indicated concentrations of adriamycin, paclitaxel, and docetaxel for 48 h. We added the CCK-8 (WST-8) solution (Dojindo Molecular Technologies, Inc., Rockville, MD, USA) to detect relative cell viability and measured the absorbance at 450 nm using a microplate reader.
2.6. Immunoblot Analysis
Immunoblot analyses were carried out as previously described [22]. Briefly, 20 μg of protein was subjected to normal SDS-PAGE with 8–16% precast polyacrylamide gels (Bio-Rad, Hercules, CA, USA) and was transferred onto a polyvinylidene difluoride (PVDF) membrane (Bio-Rad). Membranes were soaked with appropriate primary antibodies at 4 °C overnight (PgRMC1, 1:1000; β-actin, 1:5000; p-ERK1/2, 1:1000; p-Akt, 1:2000). Immunogenic bands were visualized using an enhanced chemiluminescence reagent (Super Signal Western blot Enhancer; Thermo Scientific) and ChemiDoc XRS+ System (Bio-Rad). The original, uncropped immunoblot images are presented in the Supplementary Materials (Supplementary Figures S1 and S2). Densitometric analysis was performed using ImageJ software (version 1.54g).
2.7. KM Plotter Analysis
The prognostic values of PGRMC1 in breast cancer were evaluated using the Kaplan–Meier Plotter database (KM plotter; www.kmplot.com), an online database containing gene expression profiles and clinical information from publicly available databases [24]. PGRMC1 expression was assessed using the Affymetrix probe ID 201120_s_at. Overall survival (OS) was analyzed for all breast cancer patients and for each intrinsic subtype defined according to PAM50 classification. For the analysis of all patients, the cutoff value was determined using the “best cutoff” option provided by KM plotter. For subtype-specific analyses, patients were stratified using the upper-tertile cutoff. Standard reference gene sets were used for molecular subtype classification. The number of patients included in each cohort was obtained directly from the KM plotter database.
2.8. Statistical Analysis
Continuous variables are expressed as means and standard deviations (SD) or standard errors of the mean (SEM). For continuous variables conforming to a normal distribution, such as the in vitro gene expression data, statistical significance between two independent groups was determined using Student’s t-test. Non-parametric tests, including the Kruskal–Wallis test or Mann–Whitney U test, were utilized to compare variables that did not assume a normal distribution, such as the clinical IHC scores and mRNA expression levels across subtypes. Correlations between continuous variables were assessed using Spearman’s rank correlation. For the cell viability assays, statistical significance was determined using a two-way analysis of variance (ANOVA) to evaluate the main effects of PgRMC1 expression status (overexpression) and chemotherapeutic drug concentration, as well as their interaction, followed by Bonferroni’s post hoc test for multiple comparisons. Statistical analyses were performed using JMP® 13 (SAS Institute Inc., Cary, NC, USA). p < 0.05 was considered statistically significant.
2.9. Illustrations
The graphical abstract and Figure 9 are created with BioRender.com.
3. Results
3.1. PgRMC1 Is Expressed in Breast Cancer Cells
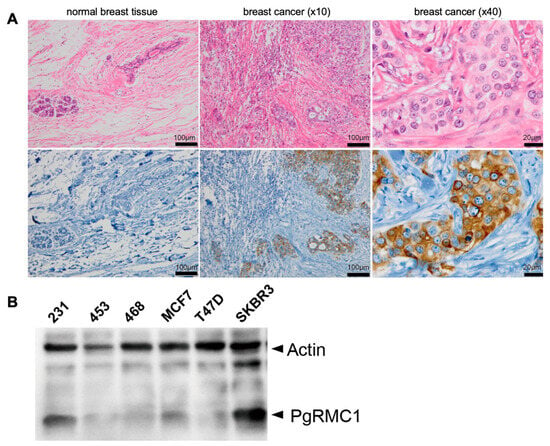
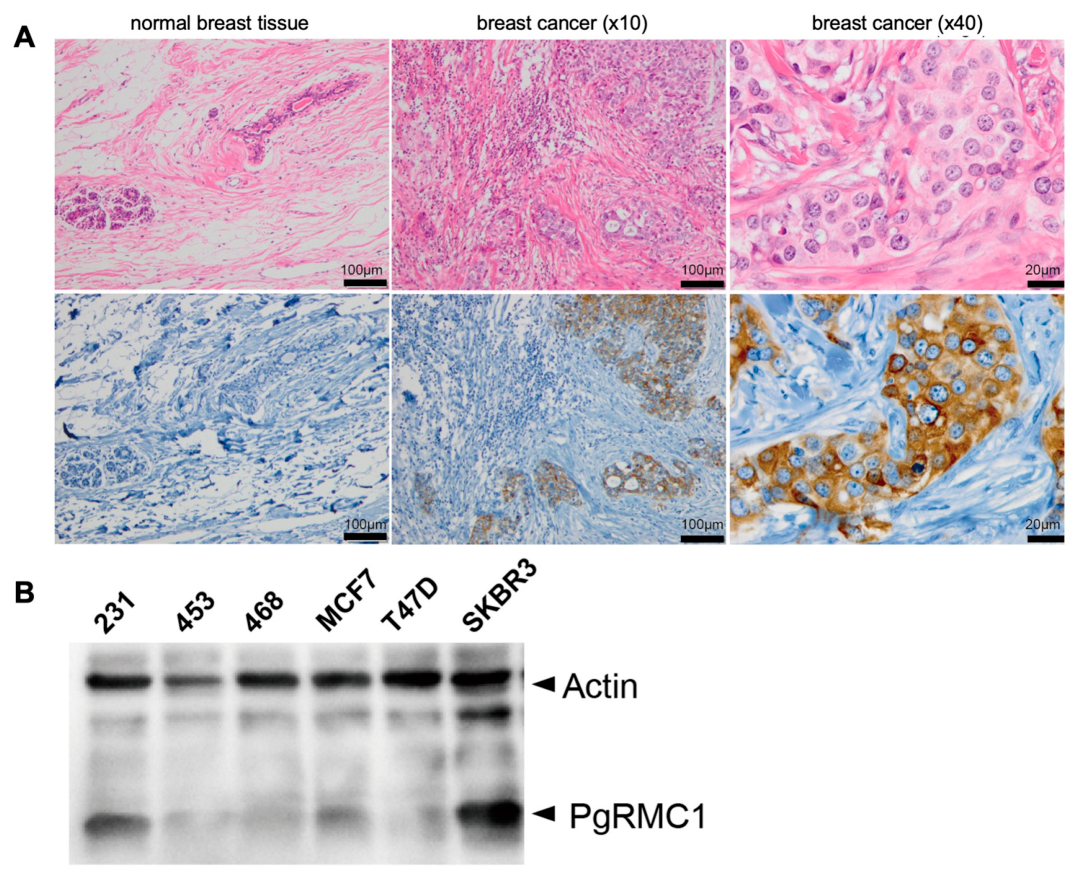
PgRMC1 protein expression was examined by IHC in normal human breast tissue and breast cancer specimens (Figure 2A). The expression of PgRMC1 was confirmed in breast cancer tissues, while almost no PgRMC1 was detected in normal adjacent tissue. PgRMC1 is diffusely located in the cytoplasm of breast cancer cells and focally detected on the plasma membrane and perinuclear region.
Figure 2.
PgRMC1 expression in breast cancer cells. (A) Representative pictures of H.&E.-stained sections (upper panels) and PgRMC1-IHC stained sections (lower panels). PgRMC1 protein expression was assessed in both normal breast tissues and breast cancer tissues from patients. (B) Immunoblot analyses of breast cancer cell lines. Cell lysates from MDA-MB-231 (231), MDA-MB-453 (453), MDA-MB-468 (468), MCF7, T47D, and SKBR3 were subjected to the analysis. Immunoreactive bands for beta-actin (42 kDa) and PgRMC1 (21.7 kDa) are indicated.
3.2. Expression Levels of PgRMC1 in Surgical Specimens Correlated with Responses to Neoadjuvant Chemotherapy
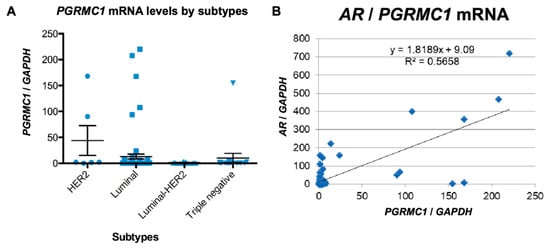
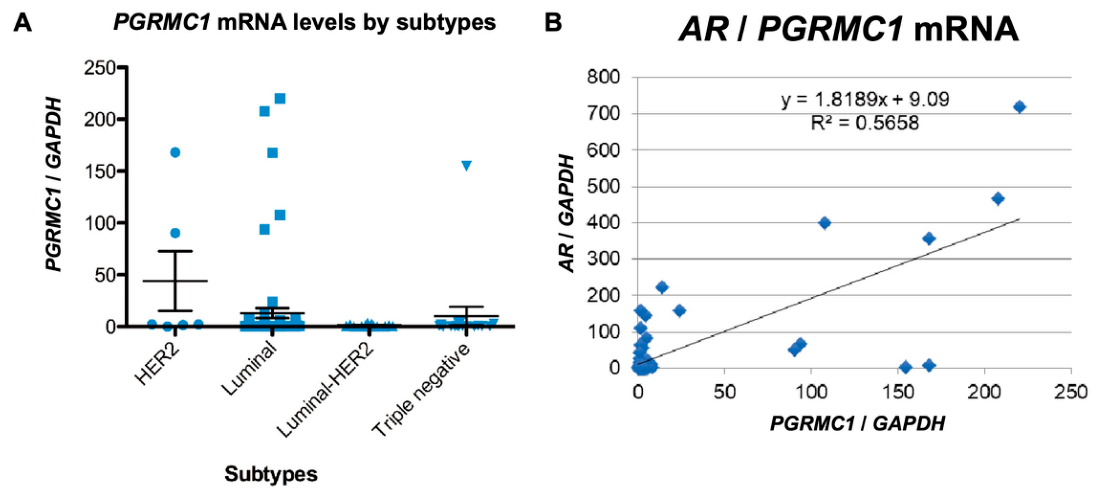
We explicitly separated our patient analysis into two cohorts, detailed in a CONSORT flow diagram (Figure 1). First, in a cohort of 112 patients who did not receive NAC, the mRNA expression levels of ER, PgR, HER2, AR, and PGRMC1 were determined by real-time qPCR from frozen breast cancer tissue samples. PGRMC1 mRNA expression levels were higher in luminal and HER2 subtypes (Figure 3A). Additionally, we investigated the correlation between PGRMC1 and AR mRNA expression due to AR’s emerging role in therapeutic resistance. PGRMC1 mRNA expression levels were significantly correlated with AR expression levels (Figure 3B).
Figure 3.
PGRMC1 mRNA expression levels in frozen breast cancer patient samples (n = 112). (A) Relative expression levels of PGRMC1 mRNA (mean ± SEM) were measured by real-time qPCR analyses from frozen cancer specimens. Blue circles, squares, and triangles represent individual patient data points corresponding to each intrinsic subtype. PGRMC1 mRNA expression levels were higher in luminal and HER2 subtypes (Kruskal–Wallis; p = 0.0054). (B) Scattered plot analysis of AR and PGRMC1 mRNA levels. Blue squares represent individual patient data points, and the solid line represents the linear regression line. PGRMC1 mRNA expression levels were significantly correlated with AR expression levels (Spearman’s rank correlation ρ, p < 0.0001).
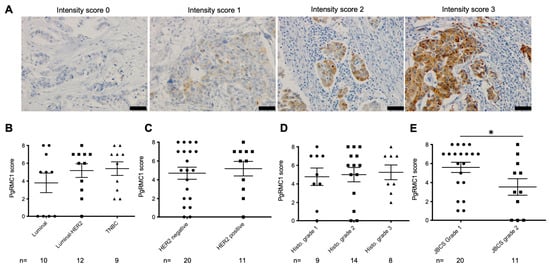
Next, we examined PgRMC1 protein expression in a separate cohort of 44 invasive breast cancer patients who received NAC. In this small cohort, we classified the intrinsic subtypes according to the IHC analyses in CNB specimens prior to treatment. We then examined the PgRMC1 expression in the operatively resected surgical specimens excised after NAC, which were pathologically evaluated according to the histological therapeutic response criteria defined by the Japanese Breast Cancer Society (JBCS) [19]. In this NAC cohort, PgRMC1 IHC score could be evaluated in 31 cases, as eight patients achieved a complete response and five patients achieved a near-complete response to NAC, leaving no or insufficient residual tumor for IHC evaluation. PgRMC1 expression levels showed a slight tendency to be higher in the luminal B and TNBC subtypes (Figure 4B) and in HER2-positive cases (Figure 4C), although these differences were not statistically significant. PgRMC1 expression levels did not differ significantly among WHO histological grades (Figure 4D). Crucially, patients with poorer pathological therapeutic responses to NAC (JBCS Grade 1) showed significantly higher PgRMC1 expression levels than those with better pathological responses (JBCS Grade 2) (Figure 4E). The distribution of the 31 evaluable cases across intrinsic subtypes and JBCS grades is summarized in Supplementary Table S2. No HER2-positive cases were evaluable, as all HER2-positive patients in this cohort achieved a complete or near-complete pathological response. These findings suggest that the association between higher PgRMC1 expression and poor NAC response was not simply attributable to an imbalance in intrinsic subtypes.
Figure 4.
Expression levels of PgRMC1 in breast cancer patients by immunohistochemistry. (A) Representative images of PgRMC1 immunohistochemical (IHC) staining by intensity scores (0–3). The intensity score was defined as follows: IS 0 for no expression, IS 1 for slight staining visible at high magnification, IS 2 for weak to moderate staining visible at low magnification, and IS 3 for strong staining visible at low magnification. PgRMC1 IHC staining was evaluated in the operatively resected surgical specimens obtained after neoadjuvant chemotherapy (NAC). PgRMC1 expression levels were assessed using the Allred total score (TS), calculated as the proportional score plus the intensity score. Dot plots summarize PgRMC1 Allred TS according to (B) intrinsic subtype, (C) HER2 expression status, (D) WHO histological grade, and (E) pathological therapeutic response grade evaluated according to the JBCS criteria. Black circles, squares, and triangles represent individual patient data points. The number of cases in each group is indicated below each dot plot. Because of the relatively small sample size of the NAC cohort, patients with poor pathological response (JBCS Grade 1) were compared with those showing a better pathological response (JBCS Grade 2). * p = 0.0471, Mann–Whitney U test.
3.3. PgRMC1 Augments Resistance to Chemotherapeutic Drugs in Breast Cancer Cell Lines
We investigated the functional effects of PgRMC1 modulation in breast cancer cell lines using lipid-mediated transient transfection. Forced ectopic overexpression (OE) was performed using a PgRMC1 expression vector, whereas knockdown (KD) was performed using esiRNAs targeting PgRMC1. Cell lines were selected according to their endogenous PgRMC1 protein expression levels: MCF7 and MDA-MB-468 cells, which exhibit relatively low endogenous PgRMC1 protein expression, were used for OE experiments, whereas MDA-MB-231 and SKBR3 cells, which exhibited robust endogenous PgRMC1 expression, were selected for KD experiments (Figure 2B).
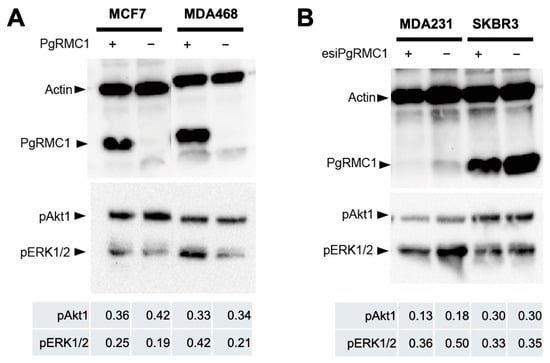
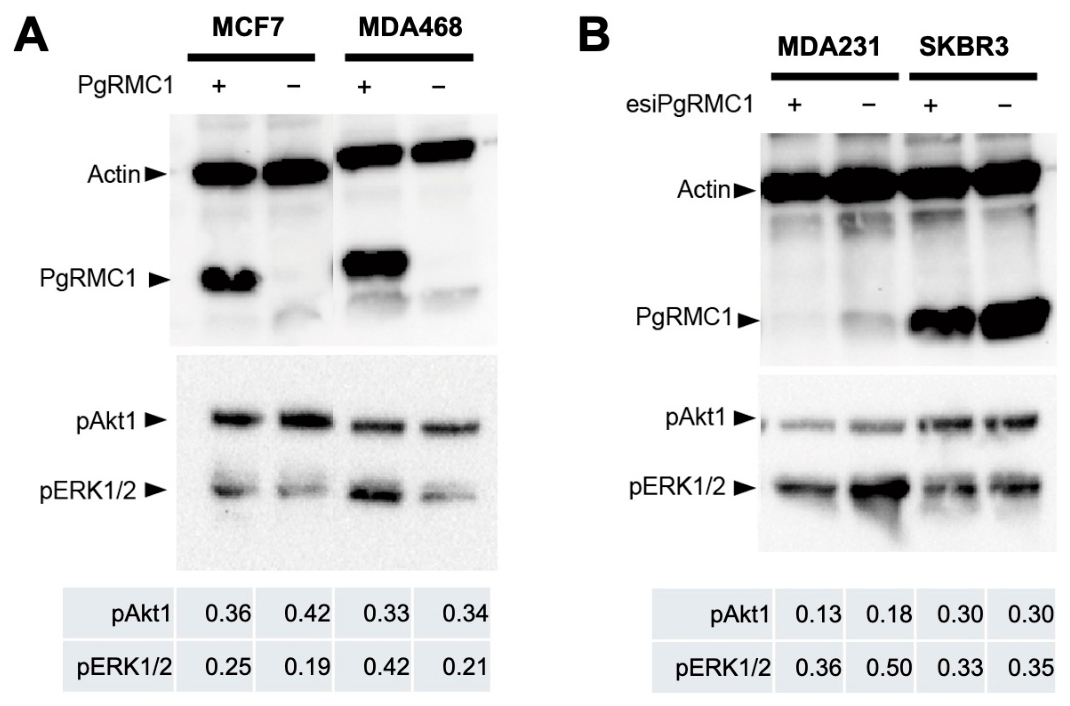
PgRMC1-OE induced phosphorylation of ERK1/2 (pERK1/2) (Figure 5A). In the KD experiments, PgRMC1 expression was only modestly reduced in both MDA-MB-231 and SKBR3 cells, accompanied by a slight decrease in pERK1/2 (Figure 5B). Across all immunoblots, actin was used as a loading control, and phosphorylated Akt1 (pAkt1) was examined as a specificity control for pERK1/2; pAkt1 levels remained largely unchanged.
Figure 5.
Immunoblot analysis of breast cancer cell lines following modulation of PgRMC1 expression. (A) Immunoblot analysis of MCF7 and MDA-MB-468 cells (MDA468) following forced ectopic overexpression using a PgRMC1 expression vector (+) compared to an empty vector control (−). PgRMC1 protein expression was strongly induced in both cell lines and was accompanied by increased phosphorylation of ERK1/2 (pERK1/2), without affecting phosphorylated Akt1 (pAkt1). (B) Immunoblot analysis of MDA-MB-231 (MDA231) and SKBR3 cells following transient transfection with endoribonuclease-prepared siRNAs (esiPgRMC1) targeting PgRMC1 (esiPgRMC1, +) compared to a negative control (−). PgRMC1 expression was only marginally reduced in both cell lines, accompanied by a slight decrease in pERK1/2 without affecting pAkt1 levels. Actin was used as an internal loading control. Relative densitometric values for pAkt1 and pERK1/2, normalized to actin, are shown below each panel.
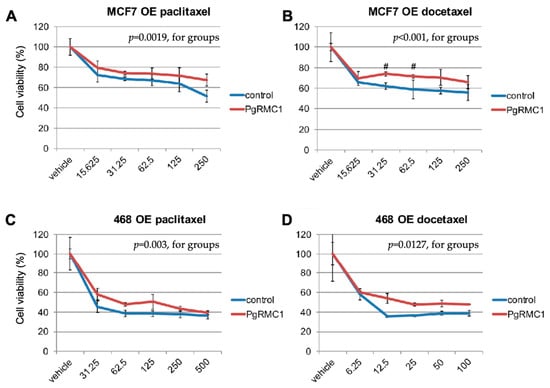
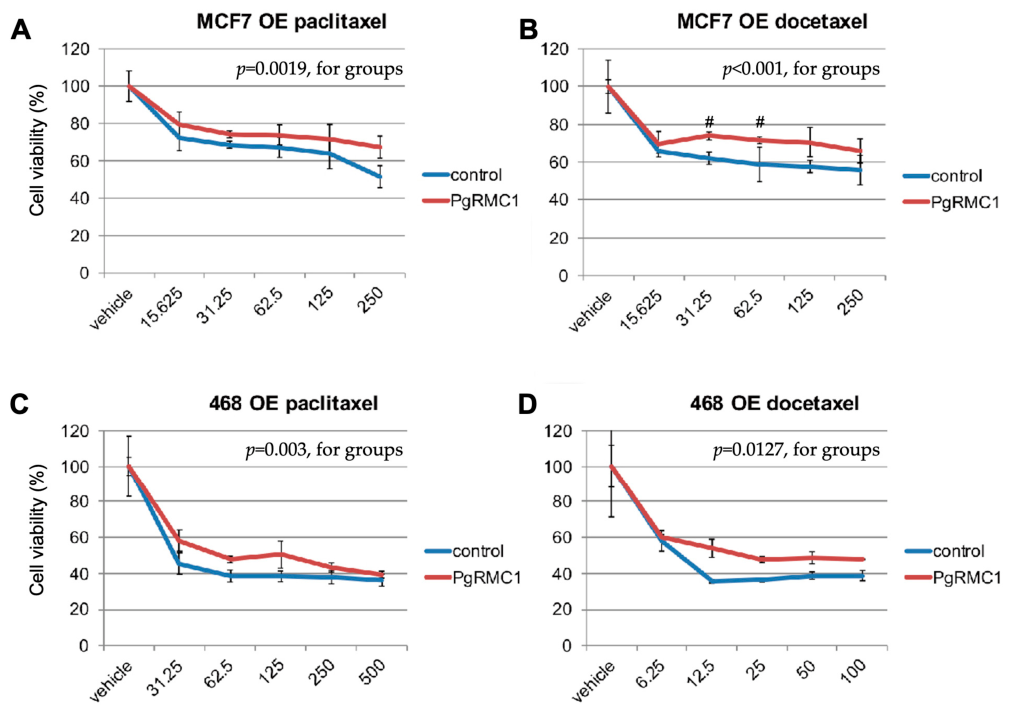
To determine whether PgRMC1 expression affects the sensitivity of breast cancer cells to chemotherapeutic drugs in vitro, we assessed cell viability using CCK-8 (WST-8) assays under E2- and progesterone-supplemented conditions. We first evaluated the effects of the taxane-based chemotherapeutic agents, paclitaxel (PTX) and docetaxel (DTX) in cells with transient PgRMC1-OE. PgRMC1-OE significantly reduced sensitivity to both PTX and DTX in MCF7 and MDA-MB-468 cells (p < 0.05). Specifically, PgRMC1-OE cells maintained significantly higher cell viability than empty vector-transfected control cells across various concentrations (nM) of PTX and DTX (Figure 6A–D).
Figure 6.
PgRMC1 regulates cellular responses to chemotherapeutic drugs in breast cancer cell lines. Cell viability (%) was measured using CCK-8 assays in breast cancer cells with forced ectopic overexpression (OE) of PgRMC1 (red line), compared with the controls (empty vector control, blue line). The panels show cell viability in (A) MCF7 PgRMC1-OE cells treated with paclitaxel (PTX), (B) MCF7 PgRMC1-OE cells treated with docetaxel (DTX), (C) MDA-MB-468 (468) PgRMC1-OE cells treated with PTX, and (D) 468 PgRMC1-OE cells treated with DTX. All the experiments were performed under E2- and progesterone-supplemented conditions. Cells were treated with the indicated concentrations (nM) of the respective chemotherapeutic agents for 48 h. Data are presented as mean ± SD (n = 3). PgRMC1-OE significantly increased cell viability across various PTX and DTX concentrations compared to the control cells (main effect p = 0.0019 for (A), p < 0.001 for (B), p = 0.003 for (C), and p = 0.0127 for (D); two-way ANOVA). # p < 0.05 indicates statistical significance at individual drug concentrations compared with the corresponding control group, as determined by Bonferroni post hoc test.
3.4. PgRMC1 Affects Gene Expression in Breast Cancer Cell Lines
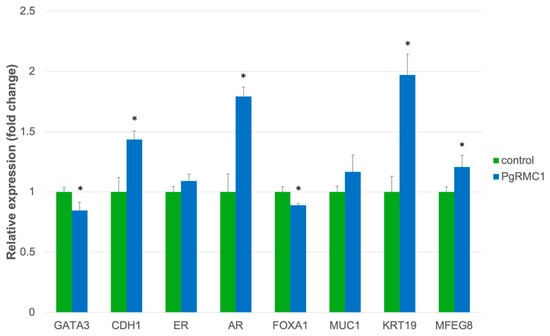
We further examined the effects of forced PgRMC1 expression on the gene expression profiles of MCF7 cells by real-time qPCR analyses to delineate the mechanisms underlying PgRMC1-induced chemoresistance (Figure 7). PgRMC1 led to the significant upregulation of epithelial and resistance-associated genes such as CDH1, AR, KRT19, and MFGE8, but caused a significant decrease in the expression of GATA3 and FOXA1. Because classical luminal markers like FOXA1 and GATA3 were downregulated alongside the high proliferation observed, these results suggest that PgRMC1 modulates specific context-dependent survival pathways and might suppress epithelial–mesenchymal transition (EMT), rather than strictly inducing straightforward mammary luminal epithelial differentiation.
Figure 7.
Relative mRNA expression profiles in MCF7 cells following forced ectopic overexpression of PgRMC1 (blue bars) compared to the empty vector control (green bars), measured by real-time qPCR. Target gene expression was normalized to the internal control GAPDH, and data are presented as relative fold change. PgRMC1 overexpression significantly upregulated CDH1 (p = 0.00582), AR (p = 0.00122), KRT19 (p = 0.00153), and MFGE8 (p = 0.02849), while significantly downregulating GATA3 (p = 0.02958) and FOXA1 (p = 0.01534). No significant change was observed for ER (p = 0.09815) and MUC1 (p = 0.11821). Data are presented as the mean ± SD of three independent biological replicates (n = 3). Statistical significance for these continuous variables was determined using Student’s t-test. * p < 0.05.
3.5. PGRMC1 mRNA Expression Levels Are Correlated with Overall Survival of Breast Cancer Patients
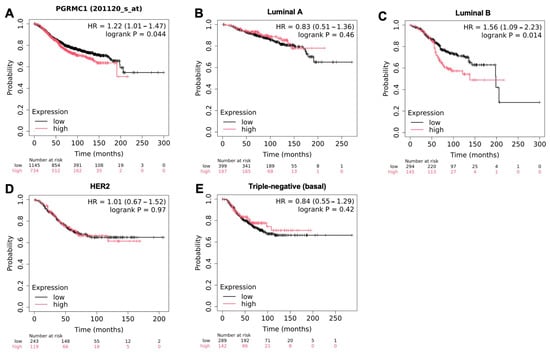
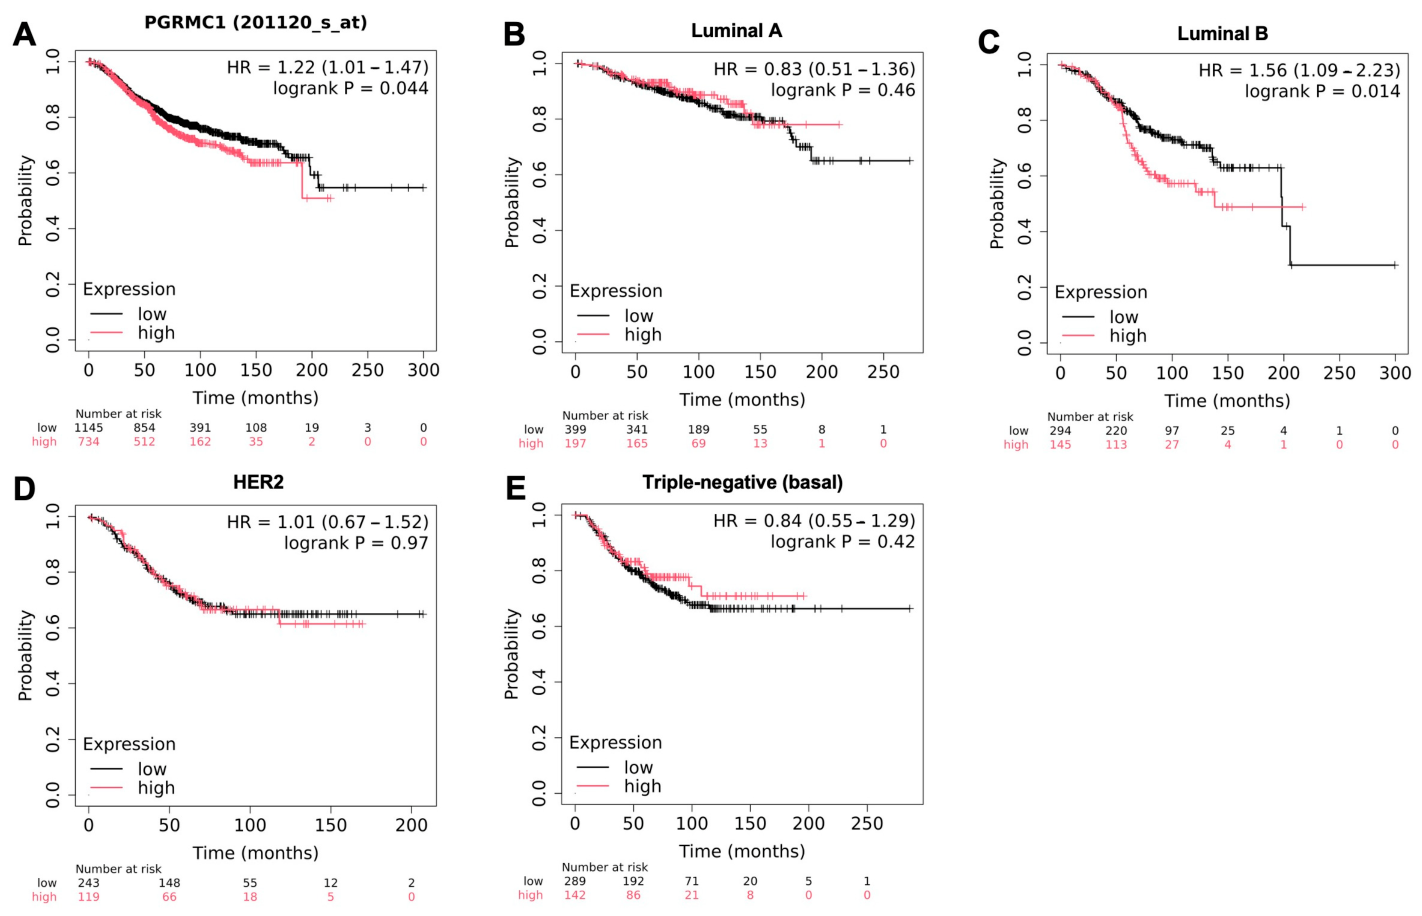
To examine whether PGRMC1 mRNA expression levels are correlated with the overall survival of breast cancer patients, we analyzed publicly available gene expression and survival data using “Kaplan–Meier plotter (http://kmplot.com/analysis/ [accessed on 2 June 2024])”. Kaplan–Meier curves revealed a significant prolongation of overall survival for breast cancer patients with lower PgRMC1 expression across the entire patient cohort (p = 0.044) (Figure 8A). When analyzed by specific intrinsic subtypes, lower PgRMC1 expression elicited a significant survival benefit exclusively within the luminal B subtype (p = 0.014) (Figure 8C). Conversely, no significant differences in overall survival associated with PgRMC1 expression were observed in patients with luminal A, HER2, or basal-like (triple-negative) breast cancer subtypes (Figure 8B,D,E).
Figure 8.
Kaplan–Meier curves for the overall survival of breast cancer patients by intrinsic subtypes. Survival curves comparing patients with low (black line) versus high (red line) PgRMC1 expression in (A) all patients, (B) luminal A subtype, (C) luminal B subtype, (D) HER2 subtype, and (E) basal-like (triple-negative) subtype. Plots were generated utilizing the Kaplan–Meier Plotter database (http://kmplot.com/analysis/ [accessed on 2 June 2024]).
4. Discussion
In this study, we demonstrated that PgRMC1 is highly expressed in breast cancer tissues. In our initial cohort (n = 112), PGRMC1 mRNA expression levels were higher in breast cancer compared to normal breast tissues, significantly elevated in the luminal and HER2 subtypes, and positively correlated with AR expression. In the separate NAC cohort, in which PgRMC1 immunohistochemistry could be evaluated in 31 of 44 patients, the PgRMC1 protein expression patterns did not perfectly align with the mRNA findings from the initial cohort. However, when evaluated using the Allred score for IHC, PgRMC1 protein expression still showed a tendency to be higher in the luminal B and TNBC subtypes. Importantly, higher PgRMC1 scores were significantly associated with poorer pathological therapeutic responses (JBCS grade 1) than with a favorable response (Grade 2), suggesting that elevated PgRMC1 expression may contribute to resistance to neoadjuvant chemotherapy.
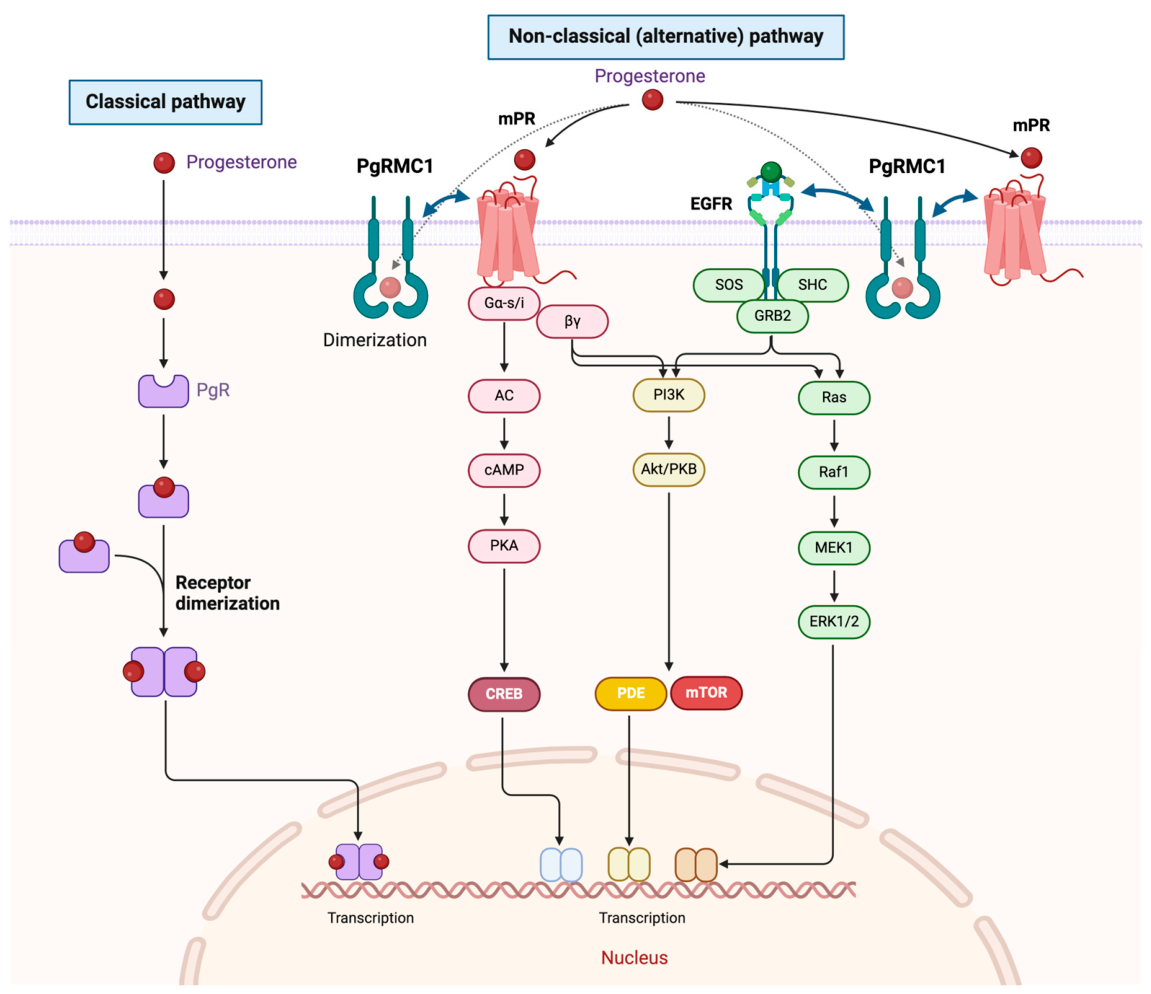
As depicted in our schematic model (Figure 9), PgRMC1 has been implicated as a mediator of the non-classical, or alternative, progesterone signaling pathway, which is distinct from the classical genomic PgR pathway. PgRMC1 has been reported to localize to the plasma membrane; however, our IHC analyses revealed that PgRMC1 immunoreactivity was predominantly observed in the cytoplasm, with focal staining at the plasma membrane and perinuclear region of breast cancer cells. Consistent with our findings, several studies using different antibodies have reported similar cytoplasmic expression patterns and have shown that PgRMC1 is more highly expressed in breast cancer cells than in benign or normal breast tissue [12,15,25,26,27,28,29]. These observations suggest that PgRMC1 may localize not only to the cell surface but also to intracellular compartments such as endosomes and may maintain a dynamic equilibrium between the plasma membrane and the cytoplasm. In tumor cells, particularly under conditions of elevated PgRMC1 expression, this equilibrium may shift toward the cytoplasmic localization, resulting in the strong cytoplasmic staining pattern observed by IHC.
PgRMC1 is generally expressed in reproductive organs such as the ovary and placenta. The reason for its increased expression in breast cancer cells is not yet known. It is possible that PgRMC1 upregulation reflects altered sex hormone signaling or hormone-related cellular states that contribute to breast carcinogenesis. In the present study, PgRMC1 expression was not restricted to a specific intrinsic breast cancer subtype, suggesting that its regulation may involve mechanisms beyond conventional subtype-defining pathways. Further studies are needed to clarify the upstream regulatory mechanisms controlling PgRMC1 expression in breast cancer.
We evaluated PgRMC1 expression using surgically resected specimens, which generally contain abundant tumor cells, and demonstrated that tumors with high PgRMC1 expression exhibited significantly poorer pathological therapeutic responses (JBCS grade 1) to NAC regimens, including anthracyclines and taxanes (Figure 4E). Because PgRMC1 expression has been reported to be unaffected by anticancer drug treatment [15], the high expression of PgRMC1 observed in the post-NAC surgical specimens may reflect the intrinsic nature of the tumor rather than a treatment-induced change. PgRMC1 expression levels could potentially be evaluated in pretreatment CNB specimens to predict NAC sensitivity, provided that sufficient tumor material is available.
Consistent with the clinical data, our in vitro analyses examining sensitivity to paclitaxel and docetaxel revealed that forced PgRMC1 overexpression reduced chemosensitivity in breast cancer cell lines (Figure 6A–D). Several mechanisms have been suggested for this resistance, including promotion of cancer cell proliferation [12,25,26], protection from anticancer drugs [27], and maintenance of cancer stem cell survival [28]. PgRMC1 is also a heme-binding protein that interacts with P450 enzymes and contributes to sterol synthesis. Taken together, our findings support the hypothesis that PgRMC1 may contribute to chemoresistance in breast cancer, at least in part by enhancing cellular survival under cytotoxic stress [29].
To delineate the mechanisms underlying PgRMC1-associated chemoresistance, we performed immunoblot and real-time qPCR analyses focusing on EMT- and differentiation-related markers [15,18,25,28]. PgRMC1 OE induced pERK1/2, whereas pAkt was not altered; conversely, PgRMC1 knockdown modestly reduced pERK1/2 (Figure 5B). These reciprocal findings suggest that PgRMC1 may preferentially activate the ERK1/2 signaling pathway, possibly through interaction with membrane progesterone receptors (mPRs), EGFR, or related signaling molecules [30,31] (Figure 9). In the qPCR analyses, PgRMC1 induced the expression of epithelial and resistance-associated markers, such as CDH1, KRT19, and MFGE8, while decreasing the expression of classical luminal markers such as GATA3 and FOXA1. This expression pattern suggests that PgRMC1 may maintain an epithelial-like cellular state while attenuating conventional luminal differentiation. Although suppression of EMT might appear paradoxical in the context of chemoresistance, maintenance of a differentiated epithelial phenotype is consistent with previous reports showing that pathological complete response (pCR) rates are low in well-differentiated luminal A subtype [32,33]. In addition, PgRMC1 induced AR expression in breast cancer cells, and PgRMC1 levels were positively correlated with AR expression in breast cancer specimens. AR has been reported to be strongly associated with ER positivity and poor pathological response to NAC [34], further supporting a potential link between PgRMC1, hormone-related signaling, and therapeutic resistance. Future studies, including rescue of chemosensitivity following PgRMC1 knockdown and pharmacological inhibition of ERK signaling, are warranted to determine whether the PgRMC1-mediated resistant phenotype can be reversed.
Finally, to evaluate the clinical relevance of PGRMC1 expression, we analyzed publicly available survival data using the Kaplan–Meier Plotter (Figure 8). This analysis showed that higher PGRMC1 expression was associated with poorer overall survival in the entire breast cancer cohort. Subtype-specific analyses further revealed that this association was significant only in the luminal B subtype. This finding is particularly noteworthy because luminal B breast cancers are generally more proliferative and clinically aggressive than luminal A cancers, while still retaining hormone receptor-related signaling features. The association between high PGRMC1 expression and unfavorable prognosis was further supported by analysis using another public database, GEPIA3 (Supplementary Figure S3) [35], consistent with a previous bioinformatic analysis of public datasets [36]. These results suggest that PgRMC1 may have particular clinical significance in luminal B breast cancer, potentially as a marker of therapeutic resistance and adverse outcome.
Limitations
This study has several limitations. First, the clinical analysis was based on a limited number of cases, particularly in the cohort evaluated for NAC resistance. Ideally, PgRMC1 expression should have been evaluated using pretreatment CNB specimens, because such an approach would allow assessment of PgRMC1 expression before exposure to NAC and would be more appropriate for evaluating its predictive value for chemotherapy response. However, many pretreatment CNB specimens contained only a small amount of carcinoma tissue, and the use of these samples would have further reduced the already limited number of evaluable cases. Therefore, we evaluated PgRMC1 protein expression using post-NAC surgically resected specimens.
As a preliminary experiment, we performed bulk mRNA expression analysis, including PGRMC1, using frozen breast cancer tissues from both initial cohort without NAC treatment and a subset of cases with post-NAC specimens. However, in post-NAC specimens from cases with favorable therapeutic responses, the amount of residual tumor cells was often markedly reduced, and the expression levels of many genes were globally decreased. Conversely, specimens from cases with poor therapeutic responses tended to retain abundant tumor cells and showed globally higher expression levels of many genes. These findings suggested that bulk mRNA expression analysis of post-NAC frozen tissues was strongly influenced by residual tumor cellularity rather than reflecting true biological differences in gene expression. For this reason, we considered bulk mRNA analysis of post-NAC specimens unsuitable for evaluating PgRMC1 expression in relation to NAC response.
Accordingly, we performed IHC analysis of PgRMC1 on histological sections of post-NAC surgically resected specimens, which allowed direct evaluation of PgRMC1 expression in residual tumor cells while minimizing the confounding effect of variable tumor cellularity. Nevertheless, because PgRMC1 protein expression was evaluated after NAC, we cannot completely exclude the possibility that treatment-related effects influenced PgRMC1 expression. In addition, the limited sample size and the use of post-NAC specimens may partly explain the discrepancies between the PGRMC1 mRNA expression patterns observed in the initial cohort and the PgRMC1 protein expression patterns observed in the NAC cohort. Larger studies using pretreatment CNB specimens with sufficient tumor volume are therefore needed to validate the predictive significance of PgRMC1 expression for NAC response.
Second, our in vitro experiments were performed exclusively using breast cancer cell lines cultured under conventional two-dimensional conditions. To better recapitulate the complex in vivo tumor microenvironment, further analyses using spheroid cultures, primary cultures, or patient-derived organoid models of human breast cancer are warranted.
Third, although our in vitro experiments indicated that PgRMC1 may contribute to reduction in chemosensitivity in breast cancer cell lines, we did not directly validate this effect in vivo. In vivo models, such as mouse xenograft models or patient-derived xenograft (PDX) models, would be necessary to confirm whether PgRMC1 promotes resistance to anticancer drugs within the tumor microenvironment. In addition, PgRMC1-mediated signaling pathways may be influenced by stromal cells, immune cells, extracellular matrix components, and systemic hormonal conditions, which cannot be fully recapitulated in conventional cell culture systems. Therefore, further in vivo studies are warranted to clarify the role of PgRMC1 in chemoresistance under physiologically relevant conditions.
Fourth, a clinically applicable cutoff value for PgRMC1 protein expression has not yet been established. In the present study, PgRMC1 protein expression was evaluated using the Allred scoring system, and its associations with clinicopathological factors, including pathological response to NAC, were analyzed. However, we did not stratify patients into PgRMC1-high and PgRMC1-low groups using a predefined IHC cutoff. Future studies using larger, independent clinical cohorts are needed to determine whether a reproducible IHC-based cutoff for PgRMC1 can be established and whether such a cutoff is useful for predicting chemotherapy response and prognosis in breast cancer.
Figure 9.
Schematic representation of the classical and non-classical (alternative) progesterone signaling pathways. In the classical pathway (left), progesterone binds to the intracellular progesterone receptor (PgR), leading to receptor dimerization and direct regulation of target gene transcription in the nucleus. In the non-classical pathway (right), progesterone exerts rapid, membrane-initiated effects. PgRMC1 undergoes dimerization at the plasma membrane and interacts with membrane progesterone receptors (mPRs) and the epidermal growth factor receptor (EGFR). These interactions facilitate the activation of multiple downstream intracellular kinase cascades, including the G-protein-coupled AC/cAMP/PKA/CREB pathway, the PI3K/Akt/mTOR pathway, and the Ras/Raf/MEK/ERK1/2 pathway. These alternative signaling cascades ultimately modulate gene transcription to promote cell proliferation, survival, and chemoresistance in breast cancer. Created in BioRender. Chiba, T. (2026) https://BioRender.com/chify4z (accessed on 22 July 2026).
5. Conclusions
In summary, this study demonstrated that breast tumors with elevated PgRMC1 protein expression were associated with poorer responses to NAC. Consistent with these clinical findings, our in vitro analyses confirmed that PgRMC1 may contribute to resistance to chemotherapeutic drugs in breast cancer cells, potentially by suppressing EMT and modulating specific survival pathways. These results suggest that PgRMC1 is involved in chemoresistance and could serve as a putative biomarker for chemotherapy sensitivity and patient prognosis in breast cancer.
Supplementary Materials
The following supporting information can be downloaded at https://www.mdpi.com/article/10.3390/jmp7030027/s1. Table S1: Histological therapeutic response criteria for neoadjuvant chemotherapy defined by the Japanese Breast Cancer Society (JBCS). Table S2: Number of intrinsic subtypes included in each JBCS Grades. Figure S1: Original uncropped images of the immunoblotting presented in Figure 2B. Figure S2: Original uncropped images of the immunoblotting presented in Figure 5A,B. Figure S3: Kaplan–Meier analysis of overall survival according to PGRMC1 mRNA expression in breast cancer (TCGA dataset).
Author Contributions
Conceptualization, T.C., T.U., and S.I.; methodology, M.T.; formal analysis, M.T., T.C., T.U., and S.I.; investigation, M.T., C.S., and T.K.; data curation, M.T.; writing—original draft preparation, M.T. and T.C.; writing—review and editing, M.T., T.C., Y.I., K.M., H.I., C.S., T.K., T.U., H.K., and S.I. All authors have read and agreed to the published version of the manuscript.
Funding
This work was partly supported by scholarship donations from Taiho Pharmaceutical Co., Ltd., Eisai Co., Ltd., and Chugai Pharmaceutical Co., Ltd.
Institutional Review Board Statement
This study protocol was conducted in accordance with the provisions of the 1975 Declaration of Helsinki, in line with the Ethical Guidelines for Epidemiological Research by the Japanese government and the Good Clinical Practice guidelines of the International Conference on Harmonization. All clinical experiments were approved by the internal review board of the Faculty of Medicine Research Committee at Kyorin University (approval number 287, 616; approval date: 8 October 2014).
Informed Consent Statement
Written informed consent for participation was obtained from all individual participants included in the study under the overarching, comprehensive research project entitled “Exploratory research into breast cancer diagnostic markers, treatment response predictors and prognostic markers, as well as therapeutic targets, using protein and gene expression analysis”.
Data Availability Statement
The datasets used and/or analyzed during the current study are available from the corresponding author upon reasonable request.
Acknowledgments
We thank the members of the Department of Breast Surgery and Pathology, Kyorin University Hospital, for their essential assistance.
Conflicts of Interest
The authors declare no conflicts of interest. The funders had no role in the design of the study; in the collection, analyses, or interpretation of data; in the writing of the manuscript; or in the decision to publish the results.
Abbreviations
The following abbreviations are used in this manuscript:
| ALDH1 | Aldehyde Dehydrogenase 1 |
| AR | Androgen Receptor |
| ASCO | American Society of Clinical Oncology |
| CAP | College of American Pathologists |
| CCK-8 | Cell-Counting Kit-8 |
| CDH1 | Cadherin-1 (E-cadherin) |
| CNB | Core Needle Biopsy |
| ER | Estrogen Receptor |
| esiRNA | Endoribonuclease-Prepared Small Interfering RNA |
| FOXA1 | Forkhead Box Protein A1 |
| GAPDH | Glyceraldehyde 3-Phosphate Dehydrogenase |
| GATA3 | GATA-Binding Protein 3 |
| HER2 | Human Epidermal Growth Factor Receptor 2 |
| IHC | Immunohistochemistry |
| JBCS | Japanese Breast Cancer Society |
| KD | Knockdown |
| KRT19 | Keratin 19 |
| MAPK | Mitogen-Activated Protein Kinase |
| NAC | Neoadjuvant Chemotherapy |
| OE | Overexpression |
| OS | Overall Survival |
| PgR | Progesterone Receptor |
| PgRMC1 | Progesterone Receptor Membrane Component 1 |
| qPCR | Quantitative Polymerase Chain Reaction |
| siRNA | Small Interfering RNA |
| TNBC | Triple-Negative Breast Cancer |
References
- Early Breast Cancer Trialists’ Collaborative Group (EBCTCG). Polychemotherapy for early breast cancer: An overview of the randomised trials. Lancet 1998, 352, 930–942. [CrossRef] [Scilit]
- Early Breast Cancer Trialists’ Collaborative Group (EBCTCG). Relevance of breast cancer hormone receptors and other factors to the efficacy of adjuvant tamoxifen: Patient-level meta-analysis of randomised trials. Lancet 2011, 378, 771–784. [PubMed]
- Boughey, J.C.; McCall, L.M.; Ballman, K.V.; Mittendorf, E.A.; Ahrendt, G.M.; Wilke, L.G.; Taback, B.; Leitch, A.M.; Morton, T.F.; Hunt, K.K. Tumor biology correlates with rates of breast-conserving surgery and pathologic complete response after neoadjuvant chemotherapy for breast cancer: Findings from the ACOSOG Z1071 (Alliance) Prospective Multicenter Clinical Trial. Ann. Surg. 2014, 260, 608–614. [Google Scholar] [CrossRef] [Scilit] [PubMed]
- Mieog, J.S.; van der Hage, J.A.; van de Velde, C.J. Preoperative chemotherapy for women with operable breast cancer. Cochrane Database Syst. Rev. 2007, 2, CD005002. [Google Scholar] [CrossRef] [Scilit] [PubMed]
- Early Breast Cancer Trialists’ Collaborative Group (EBCTCG). Long-term outcomes for neoadjuvant versus adjuvant chemotherapy in early breast cancer: Meta-analysis of individual patient data from ten randomised trials. Lancet Oncol. 2018, 19, 27–39. [Google Scholar] [CrossRef] [Scilit] [PubMed]
- Heil, J.; Kuerer, H.M.; Pfob, A.; Rauch, G.; Sinn, H.P.; Golatta, M.; Liefers, G.J.; Vrancken Peeters, M.J. Eliminating the breast cancer surgery paradigm after neoadjuvant systemic therapy: Current evidence and future challenges. Ann. Oncol. 2020, 31, 61–71. [Google Scholar] [CrossRef] [Scilit] [PubMed]
- Falkenstein, E.; Meyer, C.; Eisen, C.; Scriba, P.C.; Wehling, M. Full-length cDNA sequence of a progesterone membrane-binding protein from porcine vascular smooth muscle cells. Biochem. Biophys. Res. Commun. 1996, 229, 86–89. [Google Scholar] [CrossRef] [Scilit] [PubMed]
- Hughes, A.L.; Powell, D.W.; Bard, M.; Eckstein, J.; Barbuch, R.; Link, A.J.; Espenshade, P.J. Dap1/PGRMC1 binds and regulates cytochrome P450 enzymes. Cell Metab. 2007, 5, 143–149. [Google Scholar] [CrossRef] [Scilit] [PubMed]
- Cahill, M.A.; Jazayeri, J.A.; Catalano, S.M.; Toyokuni, S.; Kovacevic, Z.; Richardson, D.R. The emerging role of progesterone receptor membrane component 1 (PGRMC1) in cancer biology. Biochim. Biophys. Acta 2016, 1866, 339–349. [Google Scholar] [CrossRef] [Scilit] [PubMed]
- Panda, H.; Chuang, T.D.; Luo, X.; Chegini, N. Endometrial miR-181a and miR-98 expression is altered during transition from normal into cancerous state and target PGR, PGRMC1, CYP19A1, DDX3X, and TIMP3. J. Clin. Endocrinol. Metab. 2012, 97, E1316–E1326. [Google Scholar] [CrossRef] [Scilit] [PubMed]
- Tsai, H.W.; Ho, C.L.; Cheng, S.W.; Lin, Y.J.; Chen, C.C.; Cheng, P.N.; Yen, C.J.; Chang, T.T.; Chiang, P.M.; Chan, S.H.; et al. Progesterone receptor membrane component 1 as a potential prognostic biomarker for hepatocellular carcinoma. World J. Gastroenterol. 2018, 24, 1152–1166. [Google Scholar] [CrossRef] [Scilit] [PubMed]
- Neubauer, H.; Ma, Q.; Zhou, J.; Yu, Q.; Ruan, X.; Seeger, H.; Fehm, T.; Mueck, A.O. Possible role of PGRMC1 in breast cancer development. Climacteric 2013, 16, 509–513. [Google Scholar] [CrossRef] [Scilit] [PubMed]
- Ahmed, I.S.; Rohem, H.J.; Twist, K.E.; Craven, R.J. Pgrmc1 (progesterone receptor membrane component 1) associates with epidermal growth factor receptor and regulates erlotinib sensitivity. J. Biol. Chem. 2010, 285, 24775–24782. [Google Scholar] [CrossRef] [Scilit] [PubMed]
- Peluso, J.J.; Gawkowska, A.; Liu, X.; Shioda, T.; Pru, J.K. Progesterone receptor membrane component-1 regulates the development and Cisplatin sensitivity of human ovarian tumors in athymic nude mice. Endocrinology 2009, 150, 4846–4854. [Google Scholar] [CrossRef] [Scilit] [PubMed]
- Willibald, M.; Wurster, I.; Meisner, C.; Vogel, U.; Seeger, H.; Mueck, A.O.; Fehm, T.; Neubauer, H. High Level of Progesterone Receptor Membrane Component 1 (PGRMC1) in Tissue of Breast Cancer Patients is Associated with Worse Response to Anthracycline-Based Neoadjuvant Therapy. Horm. Metab. Res. 2017, 49, 595–603. [Google Scholar] [CrossRef] [Scilit] [PubMed]
- Bali, N.; Arimoto, J.M.; Iwata, N.; Lin, S.W.; Zhao, L.; Brinton, R.D.; Morgan, T.E.; Finch, C.E. Differential responses of progesterone receptor membrane component-1 (Pgrmc1) and the classical progesterone receptor (Pgr) to 17ß-estradiol and progesterone in hippocampal subregions that support synaptic remodeling and neurogenesis. Endocrinology 2012, 153, 759–769. [Google Scholar] [CrossRef] [Scilit] [PubMed]
- Su, C.; Cunningham, R.L.; Rybalchenko, N.; Singh, M. Progesterone increases the release of brain-derived neurotrophic factor from glia via progesterone receptor membrane component 1 (Pgrmc1)-dependent ERK5 signaling. Endocrinology 2012, 153, 4389–4400. [Google Scholar] [CrossRef] [Scilit] [PubMed]
- Kabe, Y.; Nakane, T.; Koike, I.; Yamamoto, T.; Sugiura, Y.; Harada, E.; Sugase, K.; Shimamura, T.; Ohmura, M.; Muraoka, K.; et al. Haem-dependent dimerization of PGRMC1/Sigma-2 receptor facilitates cancer proliferation and chemoresistance. Nat. Commun. 2016, 7, 11030. [Google Scholar] [CrossRef] [Scilit] [PubMed]
- Shien, T.; Tsuda, H.; Sasaki, K.; Mizusawa, J.; Akiyama, F.; Kurosumi, M.; Sawaki, M.; Tamura, N.; Tanaka, K.; Kogawa, T.; et al. Comparison of proportions and prognostic impact of pathological complete response between evaluations of representative specimen and total specimen in primary breast cancer after neoadjuvant chemoradiotherapy: An ancillary study of JCOG0306. Breast. Cancer Res. Treat. 2024, 208, 145–154. [Google Scholar] [CrossRef] [Scilit] [PubMed]
- Ueno, T.; Saji, S.; Chiba, T.; Kamma, H.; Isaka, H.; Itoh, H.; Imi, K.; Miyamoto, K.; Tada, M.; Sasano, H.; et al. Progesterone receptor expression in proliferating cancer cells of hormone-receptor-positive breast cancer. Tumour Biol. 2018, 40, 1010428318811025. [Google Scholar] [CrossRef] [Scilit] [PubMed]
- Allison, K.H.; Hammond, M.E.H.; Dowsett, M.; McKernin, S.E.; Carey, L.A.; Fitzgibbons, P.L.; Hayes, D.F.; Lakhani, S.R.; Chavez-MacGregor, M.; Perlmutter, J.; et al. Estrogen and progesterone receptor testing in breast cancer: ASCO/CAP guideline update. J. Clin. Oncol. 2020, 38, 1346–1366. [Google Scholar] [CrossRef] [Scilit] [PubMed]
- Yang, C.M.; Chiba, T.; Groner, B. Expression of reprogramming factors in breast cancer cell lines and the regulation by activated Stat3. Horm. Mol. Biol. Clin. Investig. 2012, 10, 241–248. [Google Scholar] [CrossRef] [Scilit] [PubMed]
- Chen, F.P.; Chien, M.H.; Chen, H.Y.; Ng, Y.T. Effects of different progestogens on human breast tumor cell growth. Climacteric 2011, 14, 345–351. [Google Scholar] [CrossRef] [Scilit] [PubMed]
- Gyorffy, B.; Lanczky, A.; Eklund, A.C.; Denkert, C.; Budczies, J.; Li, Q.; Szallasi, Z. An online survival analysis tool to rapidly assess the effect of 22,277 genes on breast cancer prognosis using microarray data of 1809 patients. Breast Cancer Res. Treat. 2010, 123, 725–731. [Google Scholar] [CrossRef] [Scilit] [PubMed]
- Neubauer, H.; Adam, G.; Seeger, H.; Mueck, A.O.; Solomayer, E.; Wallwiener, D.; Cahill, M.A.; Fehm, T. Membrane-initiated effects of progesterone on proliferation and activation of VEGF in breast cancer cells. Climacteric 2009, 12, 230–239. [Google Scholar] [CrossRef] [Scilit] [PubMed]
- Bai, Y.; Ludescher, M.; Poschmann, G.; Stühler, K.; Wyrich, M.; Oles, J.; Franken, A.; Rivandi, M.; Abramova, A.; Reinhardt, F.; et al. PGRMC1 Promotes Progestin-Dependent Proliferation of Breast Cancer Cells by Binding Prohibitins Resulting in Activation of ERα Signaling. Cancers 2021, 13, 5635. [Google Scholar] [CrossRef] [Scilit] [PubMed]
- Crudden, G.; Chitti, R.E.; Craven, R.J. Hpr6 (heme-1 domain protein) regulates the susceptibility of cancer cells to chemotherapeutic drugs. J. Pharmacol. Exp. Ther. 2006, 316, 448–455. [Google Scholar] [CrossRef] [Scilit] [PubMed]
- Hampton, K.K.; Stewart, R.; Napier, D.; Claudio, P.P.; Craven, R.J. PGRMC1 Elevation in Multiple Cancers and Essential Role in Stem Cell Survival. Adv. Lung Cancer 2015, 4, 37–51. [Google Scholar] [CrossRef] [PubMed]
- Rohe, H.J.; Ahmed, I.S.; Twist, K.E.; Craven, R.J. PGRMC1 (progesterone receptor membrane component 1): A targetable protein with multiple functions in steroid signaling, P450 activation and drug binding. Pharmacol. Ther. 2009, 121, 14–19. [Google Scholar] [CrossRef] [Scilit] [PubMed]
- Thomas, P. Membrane Progesterone Receptors (mPRs, PAQRs): Review of Structural and Signaling Characteristics. Cells 2022, 11, 1785. [Google Scholar] [CrossRef] [Scilit] [PubMed]
- Wendler, A.; Wehling, M. Many or too many progesterone membrane receptors? Clinical implications. Trends Endocrinol. Metab. 2022, 33, 850–868. [Google Scholar] [CrossRef] [Scilit] [PubMed]
- von Minckwitz, G.; Untch, M.; Blohmer, J.U.; Costa, S.D.; Eidtmann, H.; Fasching, P.A.; Gerber, B.; Eiermann, W.; Hilfrich, J.; Huober, J.; et al. Definition and impact of pathologic complete response on prognosis after neoadjuvant chemotherapy in various intrinsic breast cancer subtypes. J. Clin. Oncol. 2012, 30, 1796–1804. [Google Scholar] [CrossRef] [Scilit] [PubMed]
- Lips, E.H.; Mulder, L.; de Ronde, J.J.; Mandjes, I.A.; Koolen, B.B.; Wessels, L.F.; Rodenhuis, S.; Wesseling, J. Breast cancer subtyping by immunohistochemistry and histological grade outperforms breast cancer intrinsic subtypes in predicting neoadjuvant chemotherapy response. Breast Cancer Res. Treat. 2013, 140, 63–71. [Google Scholar] [CrossRef] [Scilit] [PubMed]
- Loibl, S.; Muller, B.M.; von Minckwitz, G.; Schwabe, M.; Roller, M.; Darb-Esfahani, S.; Ataseven, B.; Bois, A.; Fissler-Eckhoff, A.; Gerber, B.; et al. Androgen receptor expression in primary breast cancer and its predictive and prognostic value in patients treated with neoadjuvant chemotherapy. Breast Cancer Res. Treat. 2011, 130, 477–487. [Google Scholar] [CrossRef] [Scilit] [PubMed]
- Kang, Y.J.; Pan, L.; Liu, Y.; Rong, Z.; Liu, J.; Liu, F. GEPIA3: Enhanced drug sensitivity and interaction network analysis for cancer research. Nucleic Acids Res. 2025, 53, W283–W290. [Google Scholar] [CrossRef] [Scilit] [PubMed]
- Xu, X.; Ruan, X.; Zhang, Y.; Cai, G.; Ju, R.; Yang, Y.; Cheng, J.; Gu, M. Comprehensive Analysis of the Implication of PGRMC1 in Triple-Negative Breast Cancer. Front. Bioeng. Biotechnol. 2021, 9, 714030. [Google Scholar] [CrossRef] [Scilit] [PubMed]

Disclaimer/Publisher’s Note: The statements, opinions and data contained in all publications are solely those of the individual author(s) and contributor(s) and not of MDPI and/or the editor(s). MDPI and/or the editor(s) disclaim responsibility for any injury to people or property resulting from any ideas, methods, instructions or products referred to in the content. |
© 2026 by the authors. Licensee MDPI, Basel, Switzerland. This article is an open access article distributed under the terms and conditions of the Creative Commons Attribution (CC BY) license.