Abstract
The iterative development process of forming tools is cost- and labor-intensive. The main reason for this is the high complexity of interaction between forming machine, tool structure, and process, which is currently only partially taken into account in simulations and during tool tryout. By digitizing the tool development process, it is possible to save iteration loops during the design phase before tool production and during rework in the adjustment phase. In this article, a novel approach for the consideration of the elastic properties of the clamping surfaces of the forming machine within the forming simulation is presented. A case study on the virtualization of pressure distribution (PD) during the die spotting process and the derivation of recommended actions for the rework based on virtual PDs was conducted. The results demonstrate the potential for saving time, cost, and labor during the tryout process in sheet metal forming.
1. Introduction and Motivation
Today, the production of forming tools is still a very time-intensive process and is accordingly associated with high costs [1]. This leads to a very high percentage of the cost of production or assembly and the downstream necessary tryout process up to the production of quality-compliant parts. The basis for this are tools with an exact fit of the active tool surfaces of the upper and lower die under real forming force distribution. Currently, this fit can only be identified by the manual creation of a visualization of the pressure distribution (by first pressing a sheet metal part that has been coated with spotting paint). In addition to errors in the machining of the die surfaces, the individual elastic deformation behavior of the dies, and especially that of the forming machine, has an immense influence on this fit. An incorrect or insufficiently accurate consideration of the elastic behavior of the forming machine and tool in the design of the die surfaces thus leads to high manual tooling costs [2,3].
By knowing the die and clamping surface elasticities of the press (slide or table clamping surface) and the sheet thinning from the drawing process, appropriate corrections can be made to the die surfaces during die creation to take these dependencies into account [4]. The basic prerequisite for this is a sufficiently accurate model (digital twin) that takes the above-mentioned properties into account. Furthermore, this model can be used to generate virtual spotting patterns similar to the practical spotting process in order to better understand functional relationships during the spotting process and to support with an assistance system working on this basis in the future. The described digital spotting pattern is a fundamental building block in the implementation of an automated tryout process.
This paper describes the entire process of generating a model to describe the elastic properties of the die and the adjacent clamping surfaces of a press, as well as its use for calculating the die correction surfaces and as a support during the spotting process.
2. Methodology for Creating Reduced Models Representing the Elastic Characteristic of Press Ram and Press Table
2.1. Metrological Survey of Machine Components
For the estimation of the influence of the elastic behavior of the machine and the die on the forming process, the knowledge of the elastic behavior of the dies itself and the subsequent clamping surfaces of the forming tool on the machine side is crucial. For this purpose, a method was developed by Fraunhofer IWU, which allows the creation of simplified FE models on the base of a metrological analysis of a press [5,6].
For the measurement of the deflection behavior of the press table and ram clamping surface, it is necessary to load the assemblies with a defined force. In a hydraulic press, the force is generated directly from the main drive of the machine. The force is applied to the table and slide assembly by means of load columns arranged in the working area and is equipped with appropriate measuring sensors, specifically load cells (cf. Figure 1a). An individual load case is thereby defined by the number, the positions of the load columns, and the applied force in each case, as shown in Figure 1b. These load cases are used both for defined recording of the deflection at the clamping surfaces as well as an input variable for model generation afterwards [5].
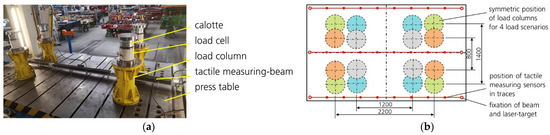
Figure 1.
(a) Apparatus for load application and measurement of load via load cells as well as elastic deflection of the press table via tactile measurement beam in the workspace of a hydraulic press. (b) Positions of the four load columns on the press table (and ram, identically) for four different load scenarios (different colors) as well as the position of three tactile measurement beams.
To achieve a sufficient accuracy of a generated model, information from several load cases is required [6] because of the intended usage of the model representing one individual press in simulations with various forming tools, whereby each of the tools carries its own load distribution, which usually is not known a priori.
The deflection of the table and ram was locally measured at predefined measuring points using a combination of a laser tracker and/or a measuring beam with tactile sensors, with results shown in Figure 2a.
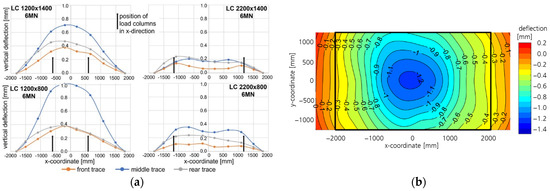
Figure 2.
(a) Measured elastic deflection of the press table under four different load scenarios (summed load of 6 MN, 75% nominal press load) with three traces each (front, middle, and rear); (b) derived compliance of press table (load of 6 MN at 1200 × 800 mm load column position).
2.2. Processing of Deflections
The measured displacements due to the applied static loads have to be processed to transform them into elastic deformations, which can be used to generate the reduced FE models. The procession includes the separation of the total displacements into rigid body movements and elastic deflection of the components as well as a linearization against the applied summed load. Linearization is necessary because of the linear characteristic of the FE models to be generated. The resulting deflections in the form of three traces over the press table are shown for four load scenarios in Figure 2a with a scaled summed load of 6 MN.
For the interaction with the forming tool, a two-dimensional distributed contact is necessary; therefore, a correct interpolation of the deflected clamping surface of the press table and ram is essential. Figure 2b shows the interpolated (and partially extrapolated in the x-direction) surface of the press table for the load case (LC) with column position at 1200 × 800 mm and a summed load of 6 MN.
2.3. Structure and Generation of Reduced Fe Models for Clamping Surfaces of the Machine
The structure of the models to be created requires a compromise between a structure that is as simple as possible, in order avoid to increasing the simulation effort too much, and a sufficiently complex structure that is able to qualitatively reproduce the structure of the machine components with unknown internal design (e.g., rib structure). At the same time, the compromise must be met that measured deflections as well as the introduction of loads can be implemented as precisely and comparably as possible both in the FE environment and during the metrological investigation.
A model structure meeting these requirements is shown in Figure 3 and consists of two plates of homogeneous thickness combined with an array of unidirectional springs coupling both plates. This generic model structure is capable of covering the elastic properties of the press table as well as those of the press ram.
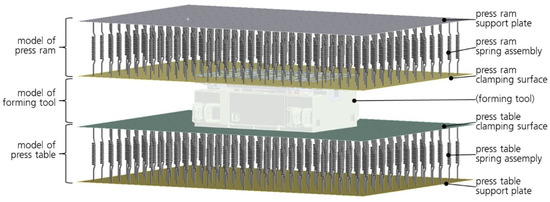
Figure 3.
Geometry of generic substitute models to represent the elastic behavior of the clamping surface at the ram (top) and the clamping surface at the table (bottom), consisting of elastic plates and discrete spring stiffnesses.
The plate facing the forming tool fulfills the function of the contacting clamping surface of the ram or press table, while the plate facing away from the tool acts as a support plate and improves the reproduction of the bending stiffness of the press component. The spring assembly consists of regularly arranged unidimensional spring elements that couple the two plates in the form of individual compression stiffnesses.
The design of the FE model of the press table and press ram in the form of generic models includes a geometry that is largely independent of the respective press. Thus, different machines can be converted into reduced models that can be handled as identically as possible using a largely uniform methodology. This prevents the developed approach from being a special solution, thus ensuring the widest possible reusability.
In addition to the internal structure with the parameters of the elastic plates and the coupling stiffnesses, the boundary conditions of the model are of decisive importance for the model behavior. To reduce the influence of the meshing, the model boundary was applied as a translational fixture of all nodes at the edges of the two plates, as shown in Figure 4 with the blue marks at the press table. The real structure of a sheet metal forming press differs significantly in the design of the table or ram as a box structure. This apparent discrepancy is eliminated by the fact that the dimension of the model exceeds that of the clamping surface so that the clamping surface to be described is only a part of the elastic plate represented in the model. For this area, the resulting (inner) boundary conditions are again very close to reality.
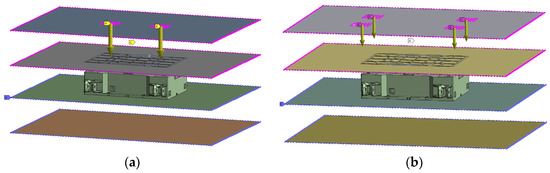
Figure 4.
Principal representation of the boundary conditions used in the simulation to create virtual pressure distribution for a (a) 2-point press and a (b) 4-point press.
For the model of the ram, additional degrees of freedom have to be included, especially the vertical movement of the press drive and the tilting of the ram in the sense of a rigid body movement. Therefore, the nodes of the plate edges of the ram (Figure 4, pink marks) are rigidly connected to a single pilot node that is capable of compensating for the tilting stiffness in both directions. A rotation around the vertical axis was excluded. Additionally, the nodes in the area of the presses pressure points (Figure 4, yellow arrows) were used for the application of the press load. Thus, the initial distribution of the applied force is much more realistic for the individual machine by only using the available geometric information and without affecting the model complexity.
The determination of the required model parameters, such as the plate thicknesses and the stiffnesses of the individual spring elements, requires numerical optimization. This is established not only by approximating a single measured load case but several in combination, as shown, for example, in Figure 1b, with four load scenarios including four load columns each. For the processed deflections, the clamping surface is then gridded so that the quality of the approximation can be reproducibly determined at discrete positions.
3. Reduction of Potential Rework by Usage Elastic Models in Design Phase
3.1. Demonstrator Forming Tool Manufactured for Experimental Validation
To evaluate and validate the assumptions as well as the results from the simulations, a forming tool was designed, manufactured, and used in experiments on the same press, for which the reduced models of the components’ elastic behavior were generated. The tool is a drawing die (consists of a lower and upper part as well as a blank holder), which is used to realize a drawing process with subsequent calibration of the die at the bottom dead center and is shown by a 3D CAD in Figure 5a, with its single components, and in Figure 5b in its mounted state during experiments. In particular, the calibration process, similar to other stamping processes, is largely affected by the machine compliance.
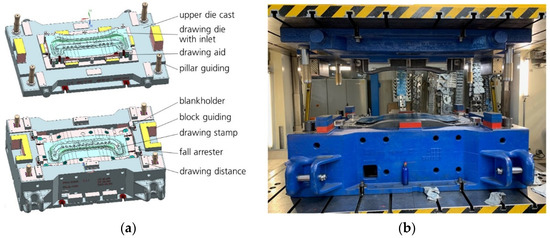
Figure 5.
(a) Geometry of forming tool created for the experimental research by CAD with upper and lower tool part; (b) manufactured tool mounted in hydraulic press during experiments.
3.2. Elastic Deflection of Forming Tool and Machine
Cambering of forming tools is a generally necessary procedure in the design process to create a more homogeneous pressure distribution during the forming process compared to the ones resulting from the unvaried CAD geometry. The largest portion of the necessary cambering results from the compensation of the elastic deflection of the forming tool, the elastic deflection of the press table and press ram, and the thinning of the sheet metal. The calculation of the elastic deflection of the forming tool, especially for the calibrating part of the forming process in the bottom dead center, is state-of-the-art [7,8] and widely usable, since the geometry of the forming tool is available to the tool maker by CAD.
In Figure 6, the reaction of the tool’s active surface (drawing die and drawing stamp) is shown in the form of a vertical deflection under an applied acting force of 6 MN, which is the typical forming force for this tool. The load distribution applied to the surfaces is the result of a forming simulation that was previously performed and the clamping surfaces of the upper and lower tool are fixed, which would represent an ideally rigid press.
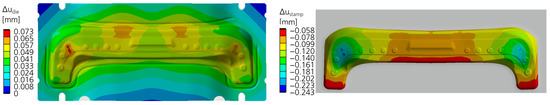
Figure 6.
Displacement of active surface of die and stamp due to applied forming process pressure distribution on both sides of the active surfaces in contact with the metal sheet (calculated with ideal stiff press behavior).
More relevant than global deflection at the entire clamping surface of the press is the variation in the deflection over the contact area between forming tool and press. This variation was estimated to be circa Δudie = 0.073 mm for the die and circa Δustamp = 0.034 mm for the stamp.
Increasing the model complexity by adding the reduced models for the press table and ram leads to more realistic boundary conditions of the tool clamping surfaces. Figure 7a shows the deformed model of the press ram and table together with the mounted tool, whereby the active surfaces of the die and stamp are loaded and the ram and table are fixed. The gap between the active surfaces (sum of Δudie and Δustamp) indicates the necessary portion of the cambering. The deflection of the single active surfaces is shown in Figure 7b and results in a variation in the vertical deflection in the contacting area of Δudie = 0.330 mm for the drawing die and of Δustamp = 0.254 mm for the drawing stamp.
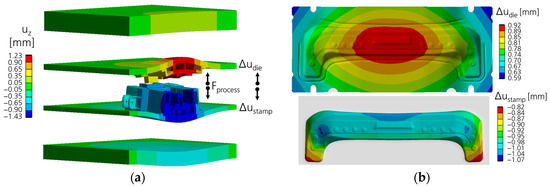
Figure 7.
(a) Displacement of forming tool and reduced model of press table and ram (4-point hydraulic press) due to applied forming process pressure distribution on both sides of the active surfaces in contact with the metal sheet; (b) detailed displacement of active surfaces of die and stamp including press elasticity.
This solidifies the assumption that the deflection of the press is commonly more important than the deflection of the forming tool itself and is responsible for around 80% of the total deflection in the presented scenario.
Another strategy next to the mapping of simulated pressure distributions is the application of a homogenous pressure in an area correlating to the size of the stamp, respectably, the forming tool. The spreading of the force from the active surface to the clamping is not trivial [9] and has to be taken into account because of its large effect on the deflection.
4. Virtual Tryout Process: Virtual Spotting Pattern
4.1. Comparison of Real and Corresponding Virtual Spotting Pattern
As mentioned in Section 1, the quality of a die during the tryout process is evaluated according to the spotting pattern. The ideal spotting pattern is defined as the equal pressure distribution when all active die surfaces are in exact contact and maximum calibrating force is applied. A real spotting pattern deviates from that ideal state due to the tolerances during die manufacture, the sheet thinning from the drawing process, which is often not taken into account during die design, and the elastic deformations of the die halves, as well as that of the workpiece clamping surfaces.
By mechanical reworking during the tool tryout of the geometry of the dies’ effective surfaces, which are in contact with the blank, the actual spotting pattern (with failures) converges on the ideal spotting pattern. To check the real spotting pattern, the pre-drawn sheet metal part was covered with spotting paint from both sides before the forming process (calibrating part) was performed. After opening the die, the local die closure can be identified by the color distribution on the sheet metal component (upper and lower side) as well as on the effective die surface. The same process can be virtually performed using an FE model. By introducing the press force into an FE model modified for this purpose, the corresponding surface pressure can be determined at the die’s active surfaces, which are in contact with the sheet metal part, as shown in Figure 8a.
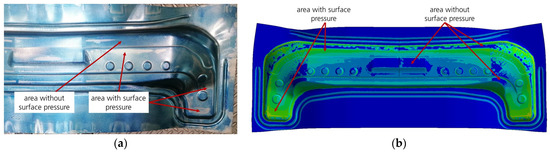
Figure 8.
Comparison of (a) real and (b) virtual spotting pattern including elasticity of press, sheet thinning, and refined tool geometry.
4.2. FE Model for the Calculation of the Virtual Spotting Pattern
To calculate the virtual spotting pattern (Figure 8b), the model described in Figure 5, consisting of the substitute model of the die as well as the models of the press ram and table, is supplemented with the model of the pre-drawn sheet metal part with the sheet thickness thinned out by a previous drawing process that has been stopped before the press reaches the bottom dead center, shown in Figure 9. The boundary conditions of the table as well as the clamping conditions of the die are identical. The ram is supported at the edge with free stroke direction. The force is applied via the pressure points of the press as a reaction force resulting from the displacement of the pressure points. Only the calibration process of the component is considered for the generation of the virtual spotting pattern.
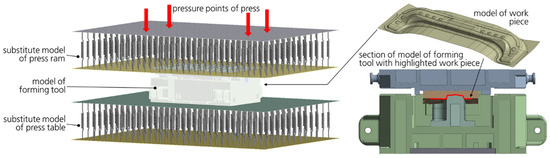
Figure 9.
FE model for calculation of virtual spotting pattern, including formed workpiece.
By means of the described FE model, analyses can be carried out regarding the influence of different parameters as well as boundary conditions on the spotting pattern (sensitivity analysis), which serves as a basis for pattern recognition of the design of an assistance system for the practical spotting process. The most interesting parameters to analyze concerning the spotting pattern are, for example: tool stiffness, sheet thinning, stiffness of the clamping surfaces on the table and ram, geometric errors on the die’s active surfaces due to FE meshing or machining errors, and the press force.
4.3. Reference Simulation as State of the Art and Influence of Sheet Thinning
A reference scenario is given by state-of-the-art simulations in the industry, where rigid clamping surfaces are common and the elasticity of the forming tool is covered independent of the chosen simulation environment.
Figure 10 (left) shows a virtual spotting pattern calculated under these boundary conditions (rigid ram and table, elastic die, and elastic blank) with an ideal die geometry and a constant sheet thickness of 1.15 mm. Due to the non-homogeneous stiffness distribution in the die (design of the die, Figure 11), there is no homogeneous spotting pattern but nearly all areas are in contact.
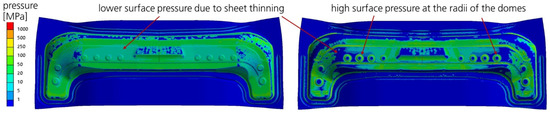
Figure 10.
Virtual spotting pattern with 6 MN press force, ideal die geometry, infinite stiffness of the table and ram clamping surface, without sheet thinning (left) and with sheet thinning (right).
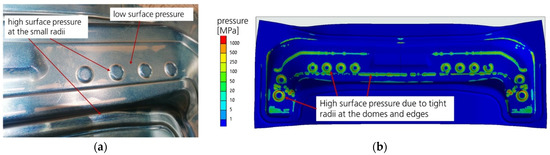
Figure 11.
(a) Real first spotting pattern before mechanical reworking and (b) in simulation with unoptimized tool geometry including machine elasticity and sheet thinning at 6 MN press force.
Even though the elasticity of the sheet is of subordinated relevance in the calibration process, the thinning due to the preceding drawing process has a large influence on the pressure distribution. Figure 10 (right) shows the spotting pattern resulting from the same simulation, including the varying sheet thickness of the previously drawn workpiece, which results in areas with lower pressure and, consequently, local pressure hotspots, especially in the areas of smaller radii (domes).
Both simulated patterns with constant and varying sheet thicknesses show a local characteristic of the deviations in pressure, whereas the inclusion of the ram and table elasticity (Figure 8) leads to a superpositioned global pressure deviation.
4.4. Influence of Geometric Adjustment on the Virtual Spotting Pattern
Even minor errors in the production or design of small radii on the active surfaces of the punch or die have a very strong influence on the load-bearing behavior of the die, since minor displacements even on the x-y plane (horizontal) lead to large geometric deviations of the two die halves in the z-axis. This results in high local surface pressures, especially along the radii.
Parallel to the virtual analysis, the real tryout process was carried out with the described test tool on the test machine. The first spotting loops in Figure 11a showed qualitatively similar pressure patterns, with the dominance of the pressure distribution along the narrow radii, as seen in the simulation by the raw CAD geometry in Figure 11b.
Parallel to the practical spotting process, further FE analyses were carried out with the FE model including the elastic behavior of the table and ram of the press. In the process, it was possible to qualitatively verify the first real spotting loop. Figure 12 shows virtual spotting patterns with modified contact conditions that qualitatively correspond to the mechanical rework, especially along the small radii. It turned out that, during the simulation process, the machine of the contacting sheet is of uttermost importance and the best results in the sense of stability and reliability have been obtained using shell elements, including midside nodes, whereby it is essential that the contact includes the midside nodes as well. Linear elements often lead to a nodewise inhomogeneous contact pressure distribution. Figure 12 compares the virtual and real spotting pattern after the described tryout loop, showing an excellent correlation.
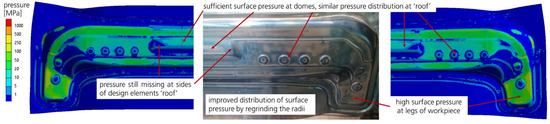
Figure 12.
Spotting patterns with 6 MN press force after mechanical processing of the radii.
The process of die spotting with an incremental adjustment of single die areas via grinding can be accompanied and traced with the simulation. Additionally, as seen with the small radii, the process can also be assisted by recommendations out of the simulation.
5. Summary and Outlook
Today’s common forming simulations are quite advanced and comprehensive but can only be as accurate as the set boundary conditions. The elastic behavior of the machine clamping surfaces as the tool boundary condition is usually not known and thus is not integrated. Since its influence on the workpiece quality is undoubted, there is a high potential use for FE models that describe the complex elastic behavior of the die in interaction with the press assemblies. The models used to represent the elastic deformation of the clamping surface of the ram and table of a press are described in this paper regarding their metrological determination, structural setup, and usage inside an FE environment.
One main advantage is the usage to calculate the correction surfaces of the active tool surfaces based on the elastic die and press behavior with a given or estimated load distribution resulting from the process. The knowledge of necessary crowning during the design phase leads to the reduction in the number of iteration loops during die spotting, which was experimentally validated with the test tool via an exchangeable inlet in the drawing die.
Furthermore, FE models will prospectively form the basis for assistance systems in the spotting process, thus constituting an essential building block for the automated tryout process and leading to more transparency in the process of die spotting, which, until now, has been highly dependent on the toolmaker’s experience.
Author Contributions
Conceptualization, R.T., T.P. and R.K.; methodology, R.T. and T.P.; software, R.T., W.R. and M.N.; validation, R.T., T.P. and R.K.; writing—original draft preparation, R.T. and T.P.; writing—review and editing, R.T., T.P., R.K. and S.I.; visualization, R.T. and T.P.; supervision, R.K. and S.I.; project administration, R.K. and T.P.; funding acquisition, T.P., R.T., R.K. and S.I. All authors have read and agreed to the published version of the manuscript.
Funding
Research funded by Sächsische Aufbaubank (Nr. 100376773). This work was supported by the Fraunhofer High-Performance Center for Smart Production and Materials and the Fraunhofer Cluster of Excellence Cognitive Internet Technologies CCIT.
Institutional Review Board Statement
Not applicable.
Informed Consent Statement
Not applicable.
Data Availability Statement
Not applicable.
Conflicts of Interest
The authors declare no conflict of interest.
References
- Zgoll, F. Methodik zur Maschinenoptimalen Werkzeugeinarbeitung Durch Virtuelle Kompensation der Werkzeug- und Pres- sendurchbiegung. Ph.D. Thesis, Technical University of Munich, Munich, Germany, 2021. [Google Scholar]
- Brecher, C.; Esser, M.; Witt, S. Interaction of manufacturing process and machine tool. CIRP Ann. 2009, 58, 588–607. [Google Scholar] [CrossRef]
- Struck, R.; Kulp, S.; Behrens, B.A.; Krimm, R. Improving the press tonnage prediction in sheet metal forming simulation incor- porating the elastic tool and press deformation. In Proceedings of the 14th International Conference on Simulation in Vehicle Engineering (SIMVEC), Baden-Baden, Germany, 26–27 November 2008; pp. 185–199. [Google Scholar]
- Behrens, B.A.; Bouguecha, A.; Krimm, R.; Matthias, T.; Czora, M. Consideration of the Machine Influence on Multistage Sheet Metal Forming Processes. In Process Machine Interactions; Denkena, B., Hollmann, F., Eds.; Springer: Berlin/Heidelberg, Germany, 2013; pp. 403–417. [Google Scholar]
- Tehel, R.; Päßler, T.; Mihm, M. Modeling elastic behavior of forming machine components to reduce tool manufacturing time. Procedia Manuf. 2019, 27, 177–184. [Google Scholar] [CrossRef]
- Tehel, R.; Päßler, T.; Bergmann, M. Effective FE-models for simulating the elasto-mechanical characteristics of forming ma- chines. Int. J. Adv. Manuf. Technol. 2020, 58, 3505–3514. [Google Scholar] [CrossRef]
- Chen, J.; Xu, D.; Xia, G.; Li, X.; Chen, J.; Zhang, J.; Yan, W.; Li, Y. Geometric compensation for automotive stamping die design integrating structure deflection and blank thinning. Int. J. Adv. Manuf. Technol. 2013, 66, 1449–1456. [Google Scholar] [CrossRef]
- Neto, D.M.; Coër, J.; Oliveira, M.C.; Alves, J.L.; Manach, P.Y.; Menezes, L.F. Numerical analysis on the elastic deformation of the tools in sheet metal forming processes. Int. J. Solids Struct. 2016, 100–101, 270–285. [Google Scholar] [CrossRef]
- Bogon, P. Notwendige Kennwerte zur Beschreibung der Eigenschaften von Pressmaschinen zur Herstellung von großflächigen Karosseriebauteilen. In Fabrik der Zukunft-5 Jahre Erfahrung mit Servopressen; Europäische Forschungsgesellschaft für Blechverarbeitung: Hannover, Germany, 2014; pp. 143–181. (In German) [Google Scholar]


Publisher’s Note: MDPI stays neutral with regard to jurisdictional claims in published maps and institutional affiliations. |
© 2022 by the authors. Licensee MDPI, Basel, Switzerland. This article is an open access article distributed under the terms and conditions of the Creative Commons Attribution (CC BY) license (https://creativecommons.org/licenses/by/4.0/).