Abstract
SCALEeat, a self-contained smart food scale, was developed to offer a convenient solution and replace manual logging with on-device recognition and weighing. The device integrated a Raspberry Pi 5, a camera, and a load cell, identifies foods and computes calories, carbohydrates, protein, and fat from measured weight through the Philippine Food Composition Tables (PhilFCT). Using transfer learning, a MobileNetV3-Large model trained on 25 commonly consumed items from ENNS, this achieved a 97.33% top-1 accuracy on a 300-image test set. Deployed on the prototype, SCALEeat achieved 93.60% accuracy, demonstrating practical accuracy and a lower-friction path to routine dietary assessment.
1. Introduction
Technology-enabled self-monitoring has heightened interest in smart tools for meal planning and dietary tracking. However, leading nutrition applications frequently misestimate intake—underreporting energy and lipids and inconsistently estimating protein—primarily because they rely on non-localized composition tables and user-generated entries [1]. Adoption is further constrained by usability and trust concerns, including database quality and the effort required for manual input, underscoring the need for tailored and reliable solutions [2].
Ingredient recognition has proven feasible: edge vision systems report 85–90% accuracy; an 84.76% precision and recall of You Only Look Once Version 8 (YOLOv8) with cosine similarity, and 90% of MobileNetV2-based RecipeLens. This shows reliable detection for downstream nutrition tasks [3,4]. In contrast, image-only calorie estimation remains error-prone. A chamber-based CNN with an ultrasonic height sensor reported a 12% calorie error [5], while single-image “chopstick reference” methods achieved 6–7% weight/calorie error [6]. Both approaches infer mass from volume proxies rather than directly weighing portions, allowing bias to accumulate. This limitation motivates the development of systems that integrate recognition with physical weighing to improve nutrient estimation reliability.
In this study, we developed SCALEeat, a smart food scale that performs on-device food identification and macronutrient estimation at the point of preparation, thereby reducing manual logging and aligning outputs with locally relevant foods. The system integrates a Raspberry Pi 5, camera, and YZC-131 load cell with a MobileNetV3-Large classifier adapted via transfer learning to an Expanded National Nutrition Survey (ENNS)-based dataset. Nutrient values are derived from the Philippine Food Composition Tables (PhilFCT) per 100 g and are scaled by the measured mass to compute calories, carbohydrates, protein, and fat. We used a set of 25 commonly consumed foods, detailing the dataset, model design, and hardware workflow, and evaluated system performance on held-out tests.
2. Materials and Methods
2.1. System Workflow
The scale’s process begins as the user places a food item on the scale; the camera captures an image while the load cell records net weight. The image is preprocessed and classified by the onboard CNN. The predicted label pulls nutrient values from the local PhilFCT database, which are scaled by the measured mass to compute calories, carbohydrates, protein, and fat, then displayed to the user (Figure 1).
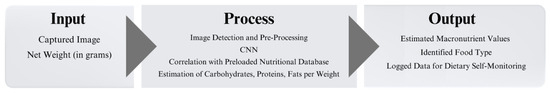
Figure 1.
System pipeline illustrating the Input-Process-Output (IPO) stages.
2.2. Data Preparation
2.2.1. Nutritional Database and Food Classes
We trained on 25 classes drawn from ENNS’ most-consumed Filipino foods [7]. Per-100 g energy and macronutrient values (kcal, carbohydrates, protein, fat) were obtained from the Philippine Food Composition Tables (PhilFCT, Table 1) [8]. To account for preparation effects, certain items were divided into subclasses (e.g., chicken: boiled or fried). Labels include state qualifiers (e.g., unpeeled, boiled), and when no preparation method is specified, the item is treated as uncooked.

Table 1.
Nutritional database and food classes per 100 g.
2.2.2. Image Dataset and Augmentation
The image dataset comprised 50% researcher-captured photos and 50% open-source images for diversity. Per class, we allocated 35, 15, and 12 images to training, validating, and testing datasets. As illustrated in Figure 2, training images were resized and padded to 640 × 640 (black fill) and augmented in Roboflow (version 3.0, Roboflow Inc., Des Moines, IA, USA), expanding the training set to 8750 samples (Figure 2). Validation and test sets were unaugmented to enable unbiased performance estimation.
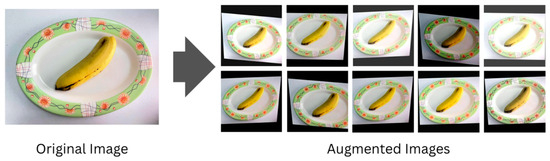
Figure 2.
Image dataset and augmentation. Example input and augmented variants.
2.3. Classification Model
2.3.1. Model Architecture
The classifier uses MobileNetV3-Large for high accuracy-per-compute on embedded hardware [8]. It employs a flexible input with resize to 320 × 320, and a lightweight head (Dense + Sigmoid Linear Unit; final Softmax). It includes batch normalization and two dropout layers (0.20, 0.10) to limit overfitting. With ~3.25 M parameters, the model runs on a Raspberry Pi in real time while maintaining strong classification accuracy (Table 2).
Table 2.
Model layers and parameters.
2.3.2. Model Training
In training, we used two-stage transfer learning with Adam and categorical cross-entropy. In Stage 1, the custom head is trained with the MobileNetV3 backbone frozen, while in Stage 2, the model is fine-tuned at a reduced learning rate, unfreezing all layers except batch-norm to adapt features to the dataset. Training is stopped on validation loss to prevent overfitting.
2.4. Hardware Development
The device with the model integrates a Raspberry Pi 5 with a 7-inch touchscreen, a camera with a white LED, and a 5 kg YZC-131 load cell read by an HX711 24-bit ADC in a reinforced 3D-printed enclosure (Figure 3). The load cell was calibrated in two steps: (1) zero offset from ~30 empty readings; (2) scale factor from a known mass to convert counts to grams.
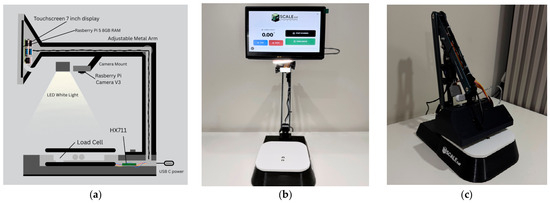
Figure 3.
Hardware development: (a) design schematic; (b) prototype; (c) storage configuration.
2.5. Performance Evaluation
The evaluation was conducted using a confusion matrix along with five key metrics. These metrics included accuracy, which measures overall correctness; precision, which reflects the proportion of correctly identified positives; recall, which indicates the proportion of actual positives that were successfully recovered; the false-positive rate, which captures the proportion of incorrect positives; and the F1-score, which represents the harmonic mean of precision and recall.
3. Results and Discussion
3.1. Model Training and Validation
We trained a MobileNetV3-Large classifier via transfer learning using Adam and categorical cross-entropy with a batch size of 32 and the optimized hyperparameters presented in Table 3.
Table 3.
Optimized model hyperparameters.
Figure 4 illustrates the validation accuracy and loss across epochs during model training. Stage 1, with the backbone frozen, exhibited an early plateau, reaching 95.47% validation accuracy at approximately epoch 17. Subsequent fine-tuning in Stage 2 surpassed this threshold, increasing validation accuracy to 97.60% while reducing validation loss, indicative of improved generalization. Performance then stabilized, confirming effective adaptation of pretrained features to the food dataset. Although the peak validation accuracy reached 97.60%, the corresponding checkpoint was associated with a higher validation loss (0.7946). In practice, the model achieving 97.07% accuracy with a lower validation loss (0.7305) demonstrated superior generalization and was therefore selected for deployment. This outcome underscores that validation loss, rather than marginal gains in accuracy, often provides a more reliable criterion for model selection and generalization.
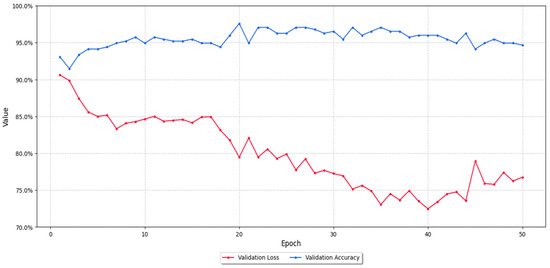
Figure 4.
Model training and validation accuracy and loss per epoch. The plot shows the initial plateau during stage one and the subsequent improvement during the fine-tuning stage.
3.2. Performance on the Test Set
The selected model was evaluated on a held-out test set comprising 300 images independent of the training data. Table 4 presents the performance metrics, computed using functions from the scikit-learn library. The model achieved an overall accuracy of 97.33%, demonstrating strong classification capability for food items. With a macro-averaged precision of 0.9741 and an F1-score of 0.9737, the model effectively balanced correct identifications while minimizing misclassifications. Furthermore, its low false-positive rate of 0.0011 highlights the robustness and reliability of its predictions.
Table 4.
Overall model performance on the held-out test set.
3.3. Deployed System Performance and Discussion
When the model predicts chicken white meat–fried, the device looks up its per-100 g nutrients in PhilFCT (226 kcal, 40.3 g protein, 0.0 g carbs, and 7.2 g fat) and then scales each value by the measured weight. For a portion weighing 81.11 g, the system multiplies 0.8111 by each per-100 g value, yielding ≈183 kcal, ≈32.7 g protein, 0.0 g carbohydrates, and ≈5.8 g fat (rounded to the display precision). For testing, we used 3–5 exemplars per class and created ten trials per item by varying background, orientation, cutting, and portion size (Figure 5).
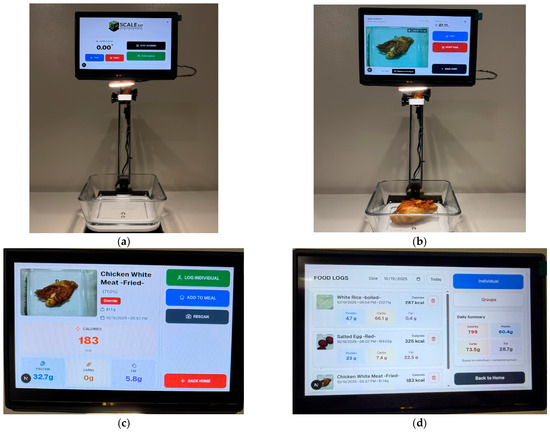
Figure 5.
SCALEeat workflow: (a) tared container in place; (b) capture image and weight; (c) on-device classification and nutrient computation/display; (d) on-device log of saved entries.
From the actual testing, the system achieves 234 correct predictions out of 250 samples (10 samples per class), which gives an overall accuracy of 93.60% in a real-world setting still validates the system’s effectiveness, even though it drops from 97.33% accuracy in the test set. Using the calculated true positive (TP), true negative (TN), false positive (FP), and false negative (FN) per class on the testing and averaging the performance per class gives us the macro performance of the model, as shown in Table 5. The precision, recall, and F1-score values align with the accuracy value, showing a good model performance in all the metrics. Given the environmental variance, a slight increase in the false positive rate of 0.0027 is expected, yet it remains deficient.
Table 5.
Overall model performance in real-world testing.
4. Conclusions and Recommendations
The MobileNetV3 model achieved 97.33% top-1 accuracy on a 300-image test set and 93.60% accuracy when integrated into SCALEeat, the end-to-end prototype, establishing a strong baseline for a vision-guided food scale with automated macronutrient estimation. The system reliably identifies single items and logs kcal, carbohydrates, protein, and fat from measured weight using PhilFCT. For future work, expand the class set and diversify the dataset (more images per class across backgrounds, lighting, preparation states, and regions) to improve dietary coverage.
Author Contributions
Conceptualization, A.P.A. and C.G.D.G.C.; methodology, C.G.D.G.C.; software, A.P.A.; validation, J.T.S.; formal analysis, C.G.D.G.C.; investigation, A.P.A. and C.G.D.G.C.; resources, A.P.A.; data curation, C.G.D.G.C.; writing—original draft preparation, A.P.A. and C.G.D.G.C.; writing—review and editing, A.P.A. and J.T.S.; visualization, A.P.A.; supervision, J.T.S. All authors have read and agreed to the published version of the manuscript.
Funding
This research received no external funding.
Institutional Review Board Statement
Not applicable.
Informed Consent Statement
Not applicable.
Data Availability Statement
The data presented in this study are available upon request from the corresponding author.
Conflicts of Interest
The authors declare no conflict of interest.
References
- Tosi, M.; Radice, D.; Carioni, G.; Vecchiati, T.; Fiori, F.; Parpinel, M.; Gnagnarella, P. Accuracy of applications to monitor food intake: Evaluation by comparison with 3-d food diary. Nutrition 2021, 84, 111018. [Google Scholar] [CrossRef] [PubMed]
- König, L.M.; Attig, C.; Franke, T.; Renner, B. Barriers to and facilitators for using nutrition apps: Systematic review and conceptual framework. JMIR mHealth uHealth 2021, 9, e20037. [Google Scholar] [CrossRef] [PubMed]
- Tipan, I.P.A.; Yumang, A.N. Integrating YOLOv8 and Cosine Similarity for Food Recipe-Specific Ingredient Collection and Recommendation. In Proceedings of the 2024 15th International Conference on Computing Communication and Networking Technologies (ICCCNT), Kamand, India, 24–28 June 2024; pp. 1–6. [Google Scholar]
- Prajapati, A.; Nigam, M.; Priyanka, R. RecipeLens: Revolutionizing Meal Preparation with Image-Based Ingredient Detection and Recipe Suggestions. In Proceedings of the 2024 International Conference on Intelligent Systems for Cybersecurity (ISCS), Gurugram, India, 3–4 May 2024; pp. 1–6. [Google Scholar]
- Balbin, J.R.; Valiente, L.D.; Monsale, K.M.P.; Olorvida, E.D.; Salazar, G.G.V.; Soto, L.M.L. Determination of Calorie Content in Different Type of Foods Using Image Processing. In Proceedings of the 2019 IEEE 11th International Conference on Humanoid, Nanotechnology, Information Technology, Communication and Control, Environment, and Management (HNICEM), Laoag, Philippines, 29 November–1 December 2019; pp. 1–6. [Google Scholar]
- Akpa, E.A.H.; Suwa, H.; Arakawa, Y.; Yasumoto, K. Smartphone-Based Food Weight and Calorie Estimation Method for Effective Food Journaling. SICE J. Control Meas. Syst. Integr. 2017, 10, 360–369. [Google Scholar] [CrossRef]
- Food and Nutrition Research Institute (DOST–FNRI). 2021 (ENNS). Available online: https://enutrition.fnri.dost.gov.ph/uploads/2021%20ENNS%20FandF%20Food%20Consumption%20Survey.pdf (accessed on 20 October 2025).
- Philippine Food Composition Tables (PhilFCT). Available online: https://i.fnri.dost.gov.ph/login/fct (accessed on 20 October 2025).


Disclaimer/Publisher’s Note: The statements, opinions and data contained in all publications are solely those of the individual author(s) and contributor(s) and not of MDPI and/or the editor(s). MDPI and/or the editor(s) disclaim responsibility for any injury to people or property resulting from any ideas, methods, instructions or products referred to in the content. |
© 2026 by the authors. Licensee MDPI, Basel, Switzerland. This article is an open access article distributed under the terms and conditions of the Creative Commons Attribution (CC BY) license.