


Abstract
The operational reliability of wind turbines is critical for sustainable energy production in smart grids. This study proposes a remote monitoring approach using perceptually enhanced satellite imagery. Sentinel-2 multispectral data (10 m resolution) has been processed with a Super-Resolution Generative Adversarial Network (SRGAN) to improve visual quality to a perceptual resolution of 30 cm. Although true spatial refinement is not achieved, the sharper structural details enhance classification accuracy. The data set comprises 15,000 images—10,000 SRGAN-enhanced and 5000 augmented through rotation, zoom in, increasing brightness, noise addition, and blurring. A custom Convolutional Neural Network (CNN) has been trained to classify turbines as damaged or intact, achieving 95% accuracy, a 0.99 ROC-AUC, and a 0.95 F1 score. These results demonstrate that perceptually sharpened satellite data can effectively support automated wind turbine damage detection and predictive maintenance. The proposed framework also lays the groundwork for broader real-time and multimodal monitoring and cost-efficient applications in renewable energy systems.
1. Introduction
Wind energy is one of the most popular renewable energy sources, which is very efficient, with a small carbon footprint, and is long-lasting [1]. As more wind turbines are built worldwide, keeping them operational and finding problems has become increasingly challenging. Structural failures, particularly cracks in the blades, gearbox issues, or tower deformations, significantly lead to inefficiency in energy production and higher operating costs [2]. For this reason, there is a growing need for automated, scalable, and cost-effective solutions that can monitor the status of wind energy infrastructure. Systems developed in this field are based on vibration analysis for condition monitoring of wind turbines, SCADA-based monitoring, and sensor fusion [3]. However, these methods cannot be used in large turbine areas because they require expensive equipment. The Copernicus program provides images from the Sentinel-2 satellite with a ground sampling distance (GSD) of 10 m [4,5]. According to the satellite images provided by this program, it is undeniably good for large-scale environmental monitoring, but it has been observed to be insufficient for detecting small damages on wind turbines. To address this, deep learning-based super-resolution methods, including Super-Resolution Generative Adversarial Networks (SRGANs), are used to improve visual clarity by enhancing perceptual sharpness [6]. It is emphasized that, considering the physical sensor limitations of Sentinel-2, the conversion from 10 m to 30 cm should be evaluated not as a true improvement in spatial resolution, but rather as a perceptual enhancement facilitated by SRGAN. This method aims to visually inspect the structural integrity of wind turbines and improve the accuracy of CNN-based models in classifying objects. Combining advances in satellite imaging, super-resolution methods, and deep learning can be presented as a new cost-effective solution [7,8]. Convolutional Neural Network (CNN) architectures have been successful in detecting damage in images and enabling the automated inspection of energy infrastructure [9,10]. Compared to UAV (drone) or manual inspections, satellite-based methods offer a more advantageous solution because they are cheaper, cover a wider area and are always accessible [11]. In this context, enhancing Sentinel-2 data with SRGAN improves fine structural details in wind turbine images and aids in extracting more prominent features for CNN models.
This study presents an innovative deep learning framework that autonomously classifies wind turbine damage using perceptually enhanced Sentinel-2 images improved with SRGAN. It is observed that the proposed custom CNN model can classify images of damaged and undamaged turbines. The results of wind turbine damage detection are comprehensively observed with accuracy, precision, sensitivity, F1 score, ROC-AUC, and confusion matrix to validate the proposed methods. The details of the study performed are explained in the following sections.
2. Methodology
The methodology of a CNN framework is specifically designed for the detection of damage on wind turbine blades using SRGAN-based super-resolution Sentinel-2 images. It consists of five key components: satellite image acquisition and enhancement, SRGAN optimization, dataset generation and augmentation, CNN-based classification, and model performance evaluation.
2.1. Sentinel-2 Satellite Imagery
Sentinel-2 satellites send publicly available multispectral images with spatial resolutions ranging from 10 to 60 m [5]. However, natural 10 m ground sampling distances are not sufficient to find small defects in wind turbine blades [12]. To overcome this issue, SRGAN is used to synthetically enlarge the images, making them appear sharper and revealing more local texture [13]. Although the term “30 cm resolution” is used, due to sensor limitations [14,15], it refers not to the actual physical resolution but to synthetic perceptual clarity. The SRGAN architecture consists of a generator that reconstructs high-resolution (HR) images from low-resolution (LR) inputs, and a discriminator that distinguishes between original and generated HR samples. Metrics such as Mean Squared Error (MSE), Peak Signal-to-Noise Ratio (PSNR), Structural Similarity Index (SSIM), and Learned Perceptual Image Patch Similarity (LPIPS) are used to check the quality of the enhanced images.
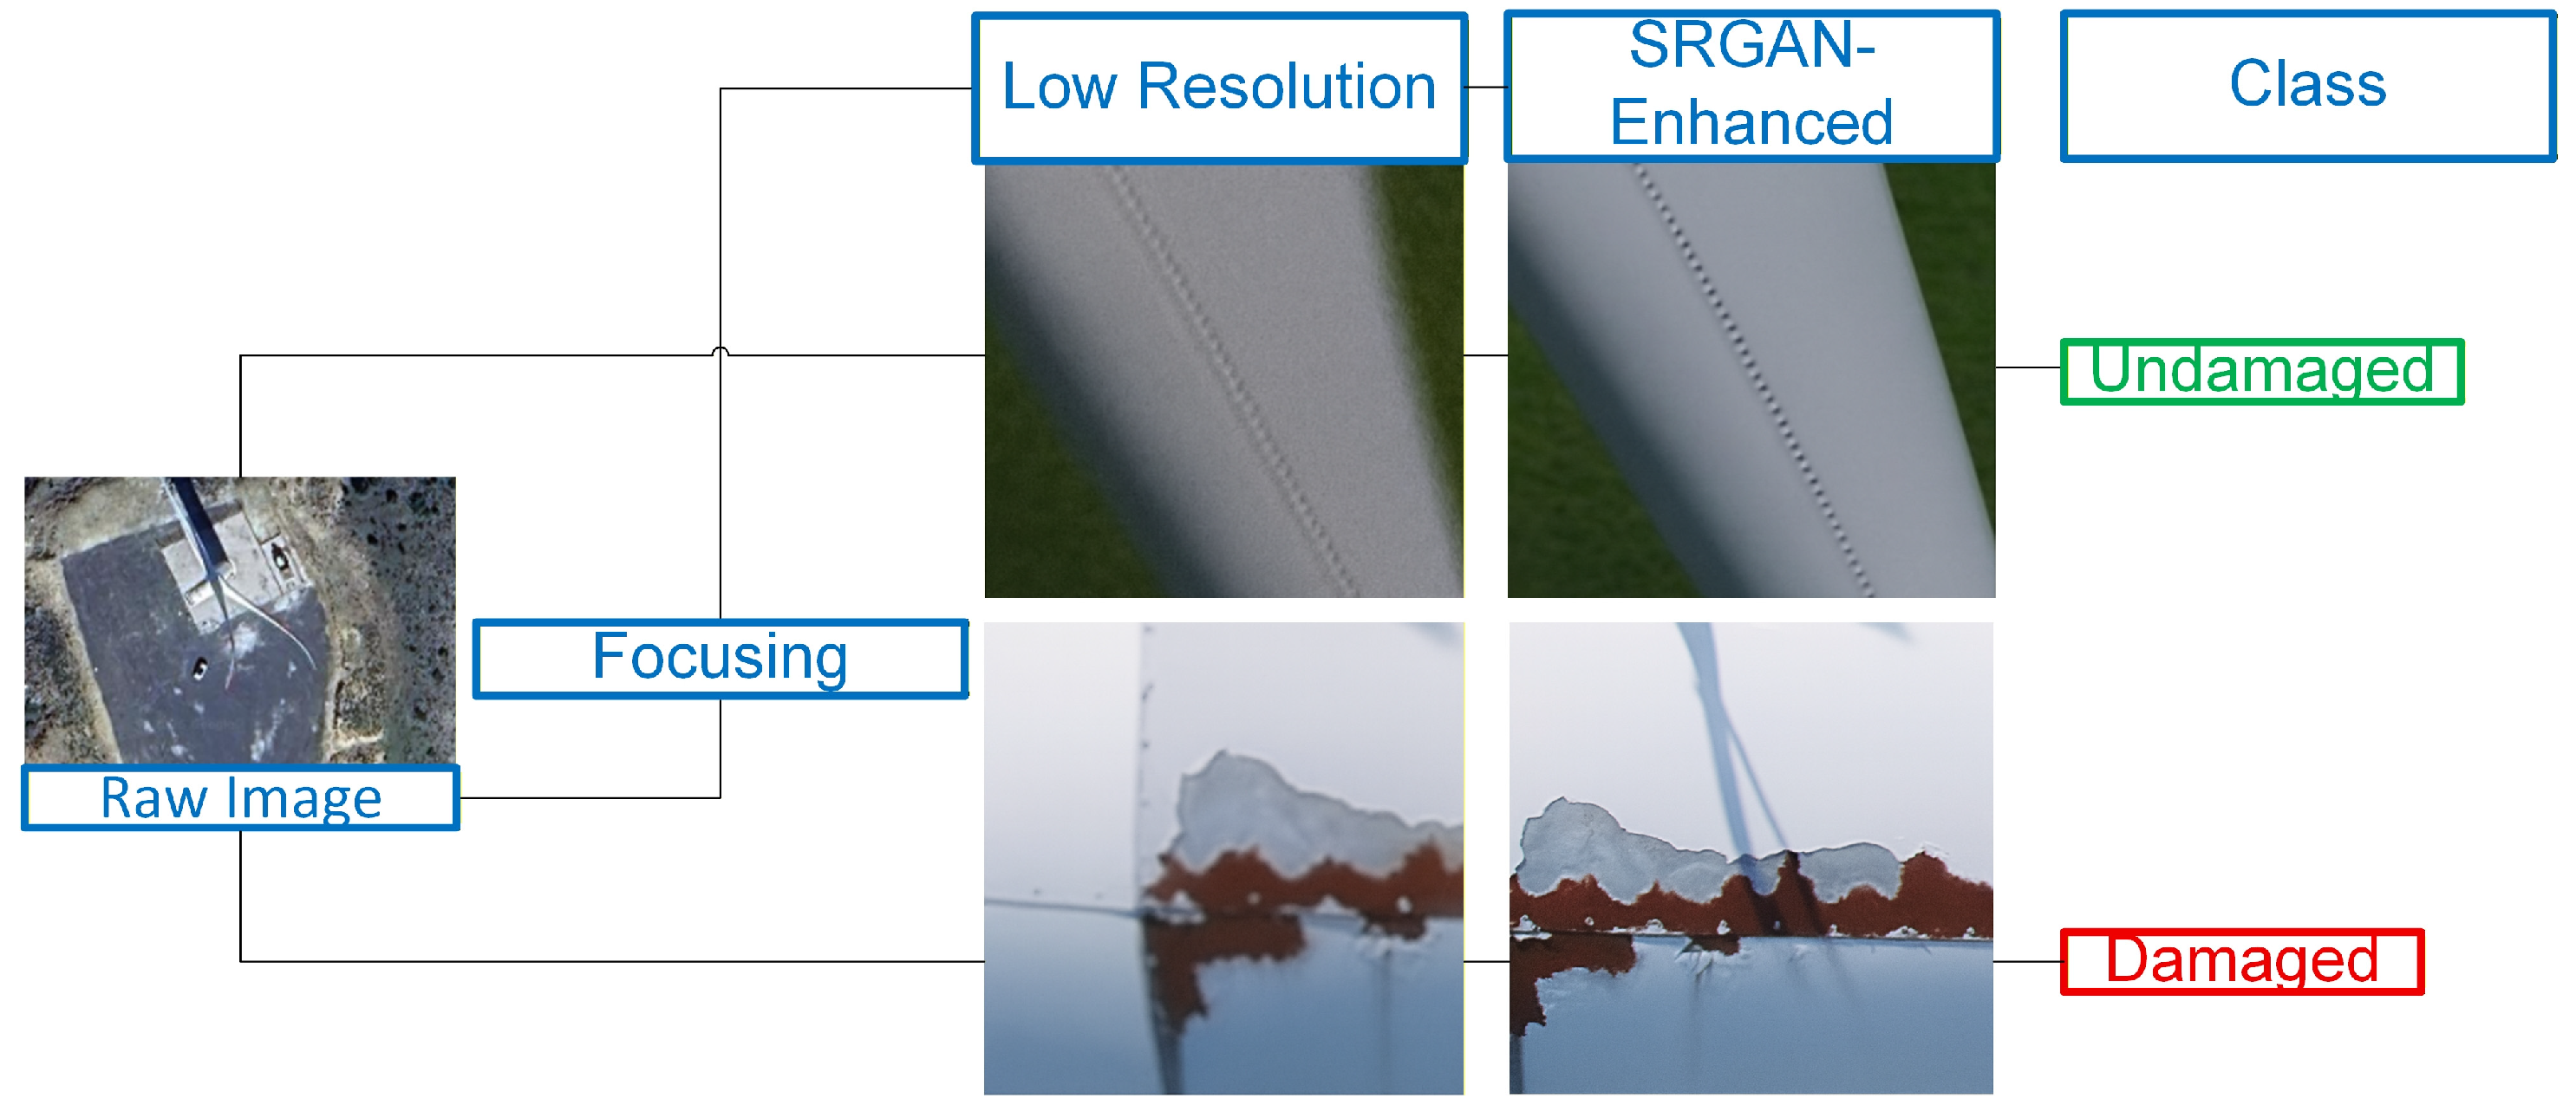
The results presented in Table 1 confirm that while details are indistinguishable from raw Sentinel-2 images, SRGAN-enhanced Sentinel-2 images provide sufficient visual clarity to highlight fine structural features such as turbine blade cracks, erosion marks, and surface deformations. Figure 1 shows a visual comparison of the classified turbine blade areas obtained from raw Sentinel-2 inputs.

Table 1.
Evaluation metrics for SRGAN-enhanced Sentinel-2 images.
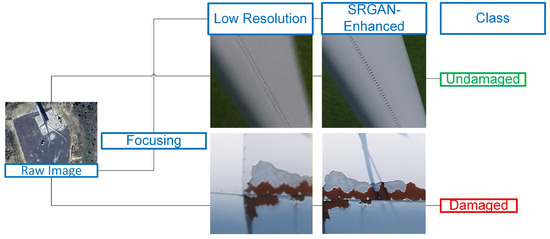
Figure 1.
Visual comparison of raw Sentinel-2 images and identified turbine blade regions.
2.2. SRGAN Objective Function
The loss function guiding SRGAN optimization is:
where : pixel-wise fidelity loss between LR and HR, is the perceptual loss from intermediate layers of a pre-trained VGG network, is the adversarial loss enforced by the discriminator, and and weighting factors for perceptual and adversarial terms.
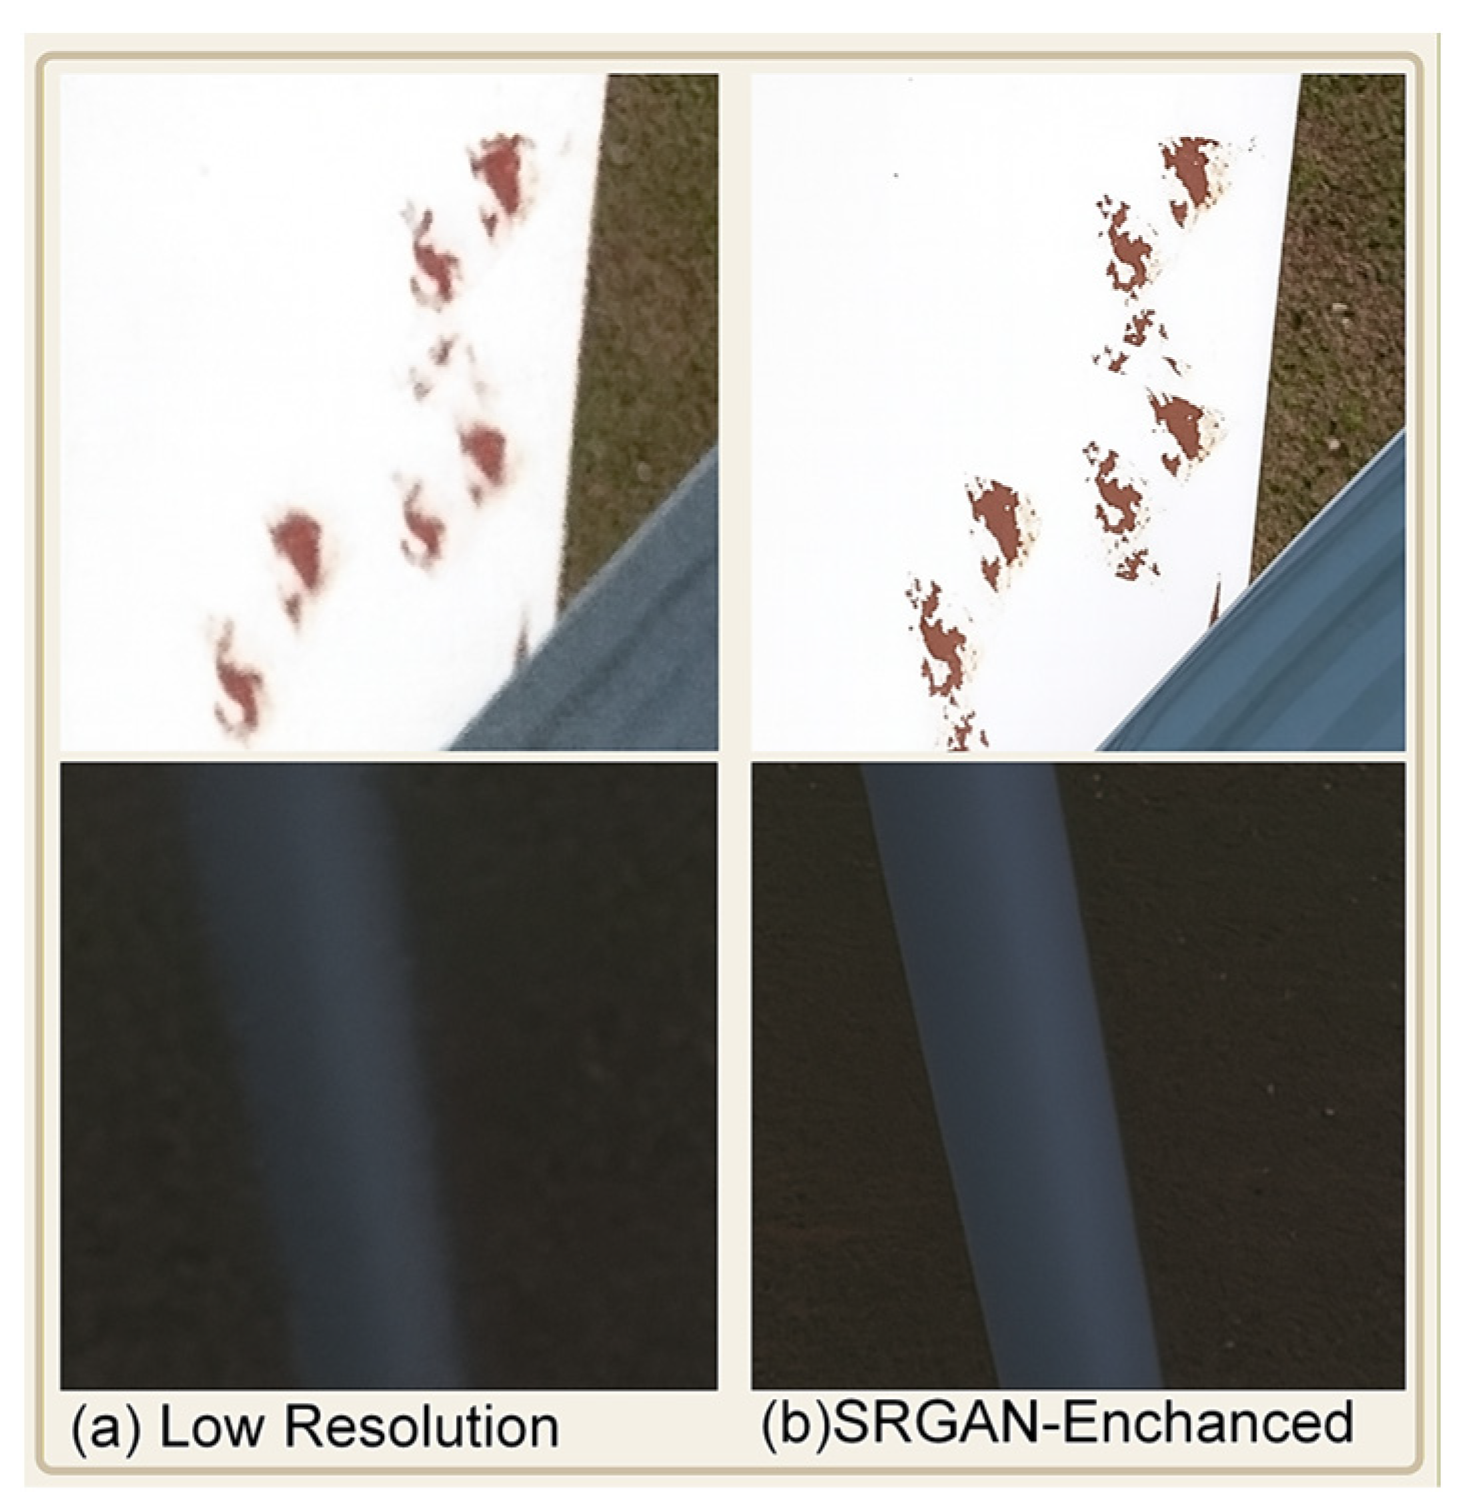
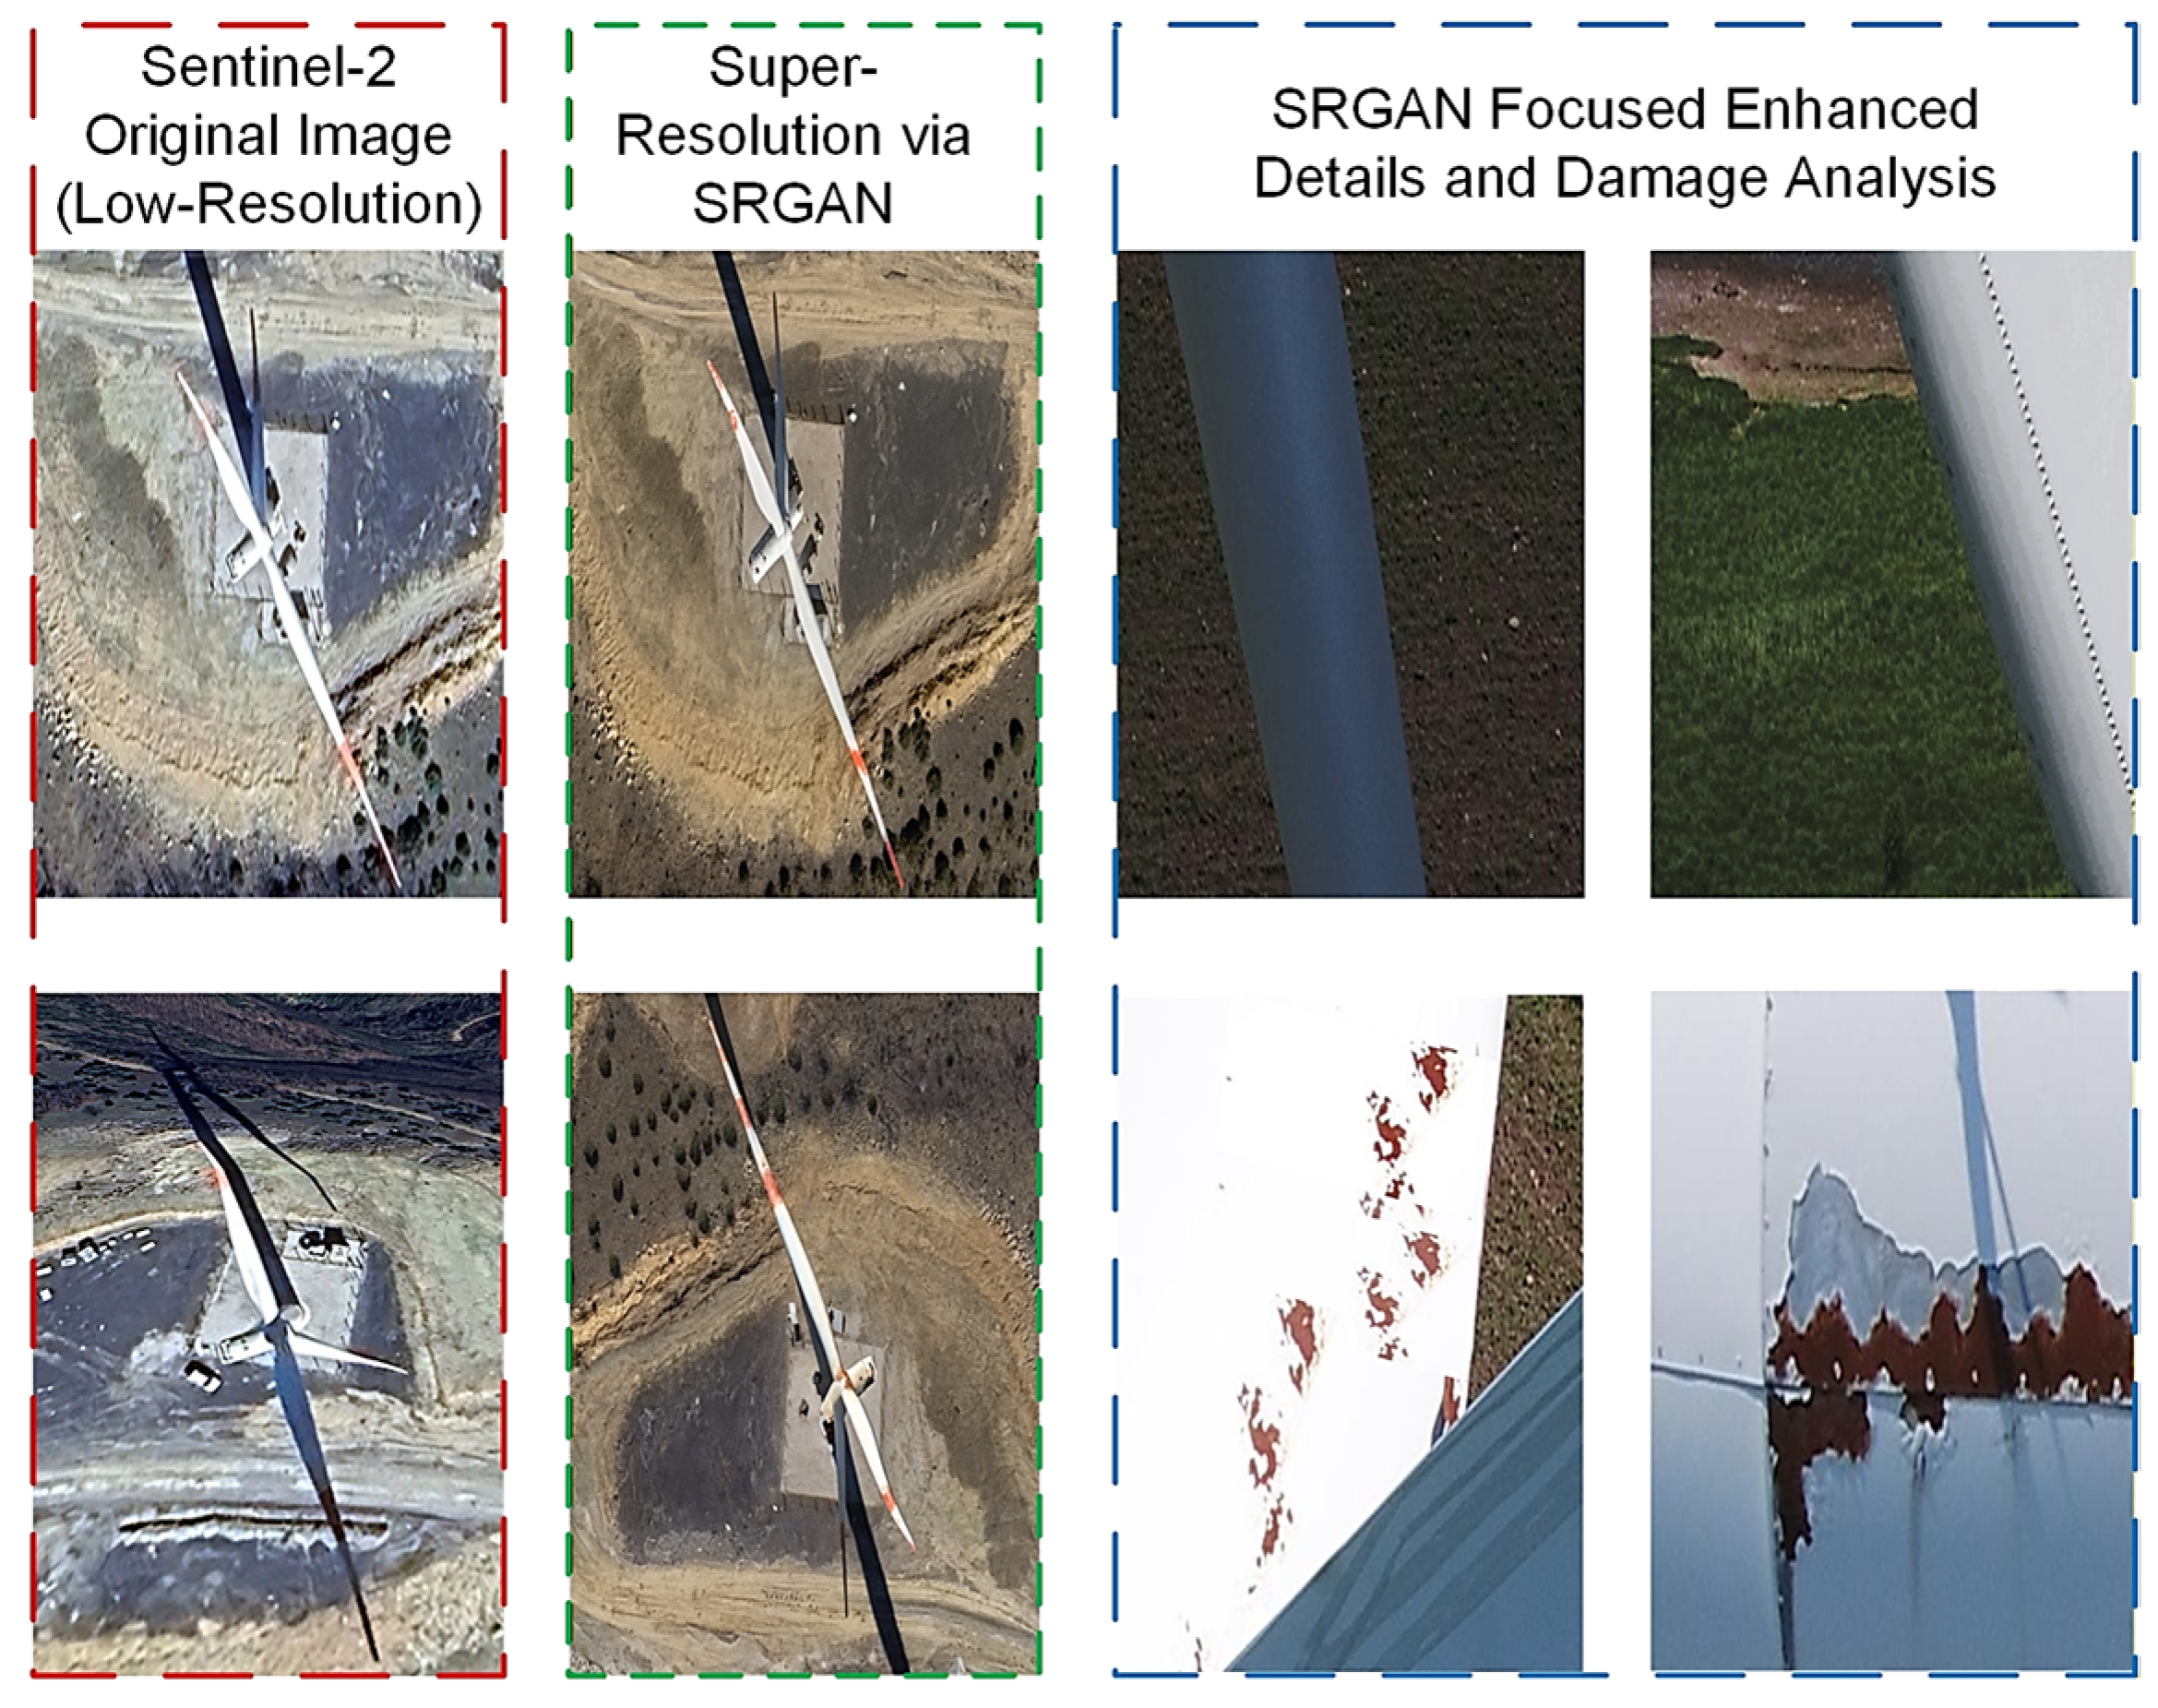
This formulation allows SRGAN to create outputs that are visually sharp and structurally meaningful, which makes them good for image classification tasks that come after them. Figure 2 and Figure 3 show the comparison of the original Sentinel-2 and SRGAN enhancement, supported by images where the enhancement increases the resolution and defects become clearer.
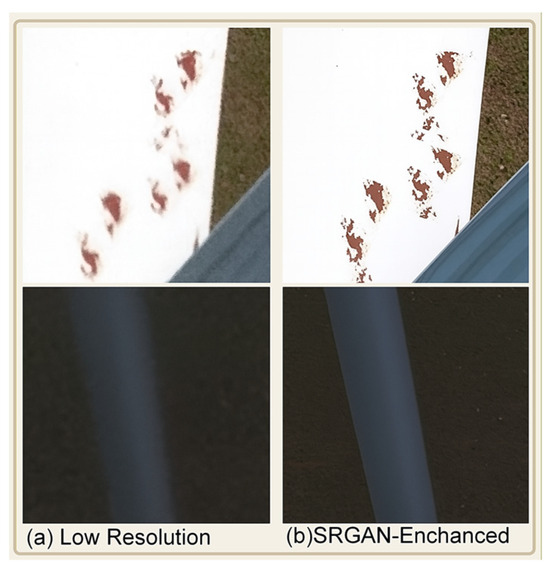
Figure 2.
(a) Low resolution details, (b) SRGAN-enhanced close-ups revealing sharper edges and finer details.
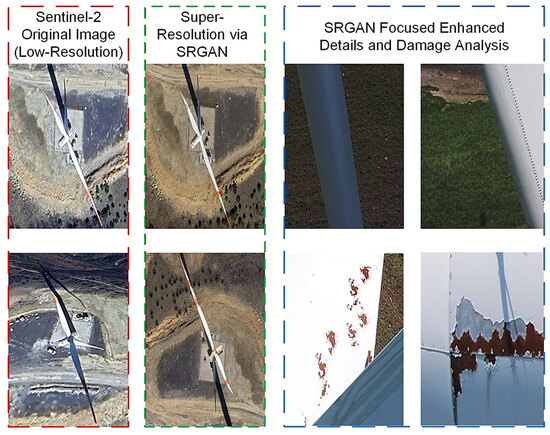
Figure 3.
Comparison of original Sentinel-2 images with SRGAN-enhanced outputs.
The use of SRGAN-based super-resolution for Sentinel-2 wind turbine imagery is grounded in the need to overcome the limited 10 m ground sampling distance (GSD) of the satellite, which is inadequate for monitoring the complex and micro-level structural integrity of turbine components. To address this limitation, low-resolution images were first extracted from raw Sentinel-2 data using image-processing techniques. Subsequently, a deep learning framework based on SRGAN was developed to enhance the spatial resolution of these images, enabling more detailed analysis of structural features relevant to damage detection. The main purpose here is not to produce a real-world image that Sentinel-2 cannot physically provide, but to produce more noticeable details for the human eye and deep learning algorithms. SRGAN converts low-resolution (LR) satellite images into images with greater perceptual detail (e.g., 30 cm GSD) by using statistical relationships learned from high-resolution (HR) images in the training data. The details produced in this process are entirely statistical and “hallucinatory” (estimated), and do not correspond to physically measured data. However, studies have shown that this type of “perceptual solution” increases meaningful information [15]. The goal is for the generator to produce fake high-resolution (SR) images from low-resolution inputs, while the discriminator tries to distinguish between real and generated images.
This loss enforces radiometric fidelity by minimizing the pixel-level difference between the generated super-resolved image and its high-resolution reference .
Here, ϕ(⋅) denotes the feature representation extracted from an intermediate layer of a pre-trained VGG-19 network. This term guides the generator to reproduce perceptually meaningful structures (edges, textures) rather than merely pixel-wise similarity.
This loss term reflects the generator’s success in fooling the discriminator D(⋅), thereby improving the photorealism of the synthesized image. In advanced SRGAN variants, spatial smoothness and noise suppression are often encouraged by including a Total Variation (TV) regularizer:
The complete objective function can therefore be expressed as:
where , , and are positive hyperparameters that balance the contributions of perceptual, adversarial, and regularization components, respectively.
The concept of a “30 cm resolution” achieved through the application of SRGAN refers solely to the pixel dimensions of the generated output, rather than to an actual optical resolution. The fine-grained details represented within these pixels are statistically synthesized rather than physically captured. So, it is not possible to retrieve genuine spatial information at the 30 cm scale. Nonetheless, the model produces perceptually plausible details that are of considerable analytical value. Such synthesized features enhance the visual salience of small-scale surface anomalies (e.g., cracks, erosion, or deformations), thereby improving the performance of deep learning–based classifiers (e.g., CNNs) and facilitating more accurate interpretation by human analysts.
Indeed, in experiments conducted, Sentinel-2 images enhanced with SRGAN; Classification accuracy: 95%, AUC: 0.99, F1 score: 95% have been achieved. These results show that an increase in perceptual resolution leads to practical success in applications such as damage detection, even if it does not contain actual sub-meter details. A lightweight SRGAN architecture specifically designed for remote sensing applications has also been introduced in the literature [15]. Furthermore, numerous recent studies have reported high performance in object detection and classification when using SRGAN-enhanced imagery [13,14,15]. Although the SRGAN-based super-resolution approach cannot overcome the inherent physical limitations of Sentinel-2 sensors, it enhances the informational value of the imagery for both visual inspection and automated damage assessment. This capability offers a durable foundation for comprehensive, cost-effective, and scalable wind turbine monitoring systems and can be readily extended to other remote sensing and industrial inspection domains.
2.3. Dataset Description and Augmentation
The dataset is composed of 15,000 images. 10,000 of these images are Sentinel-2 images enhanced with SRGAN, and 5000 images have been obtained through augmentation. Table 2 shows the image enhancement methods used to increase the reliability of the dataset [12].
Table 2.
Image augmentation methods.
2.4. Image Preprocessing and Labeling
Each image in the dataset is labeled as damaged or undamaged. This labeling process is performed to ensure the reliability of the model training results. Damaged images are identified by the presence of observable structural anomalies such as blade cracks, edge fractures, wear marks, or localized surface deformations. Intact images may contain dust accumulation and slight shadows that do not affect the turbine’s operating performance.
To ensure the reliability of model results, 70% of the dataset is used for training, 15% for validation, and the remaining 15% for testing. This grouping ensures class balance during model optimization and evaluation by ensuring equal numbers of damaged and undamaged images across all sub-datasets. The training subset is used to update Adaptive Moment Estimation (ADAM) model parameters for gradient-based optimization. Through all the processing steps in this study, including rigorous labeling, refinement, and the preprocessing framework, it provides a high-quality input base for the CNN classifier.
2.5. CNN Architecture Proposed in This Study
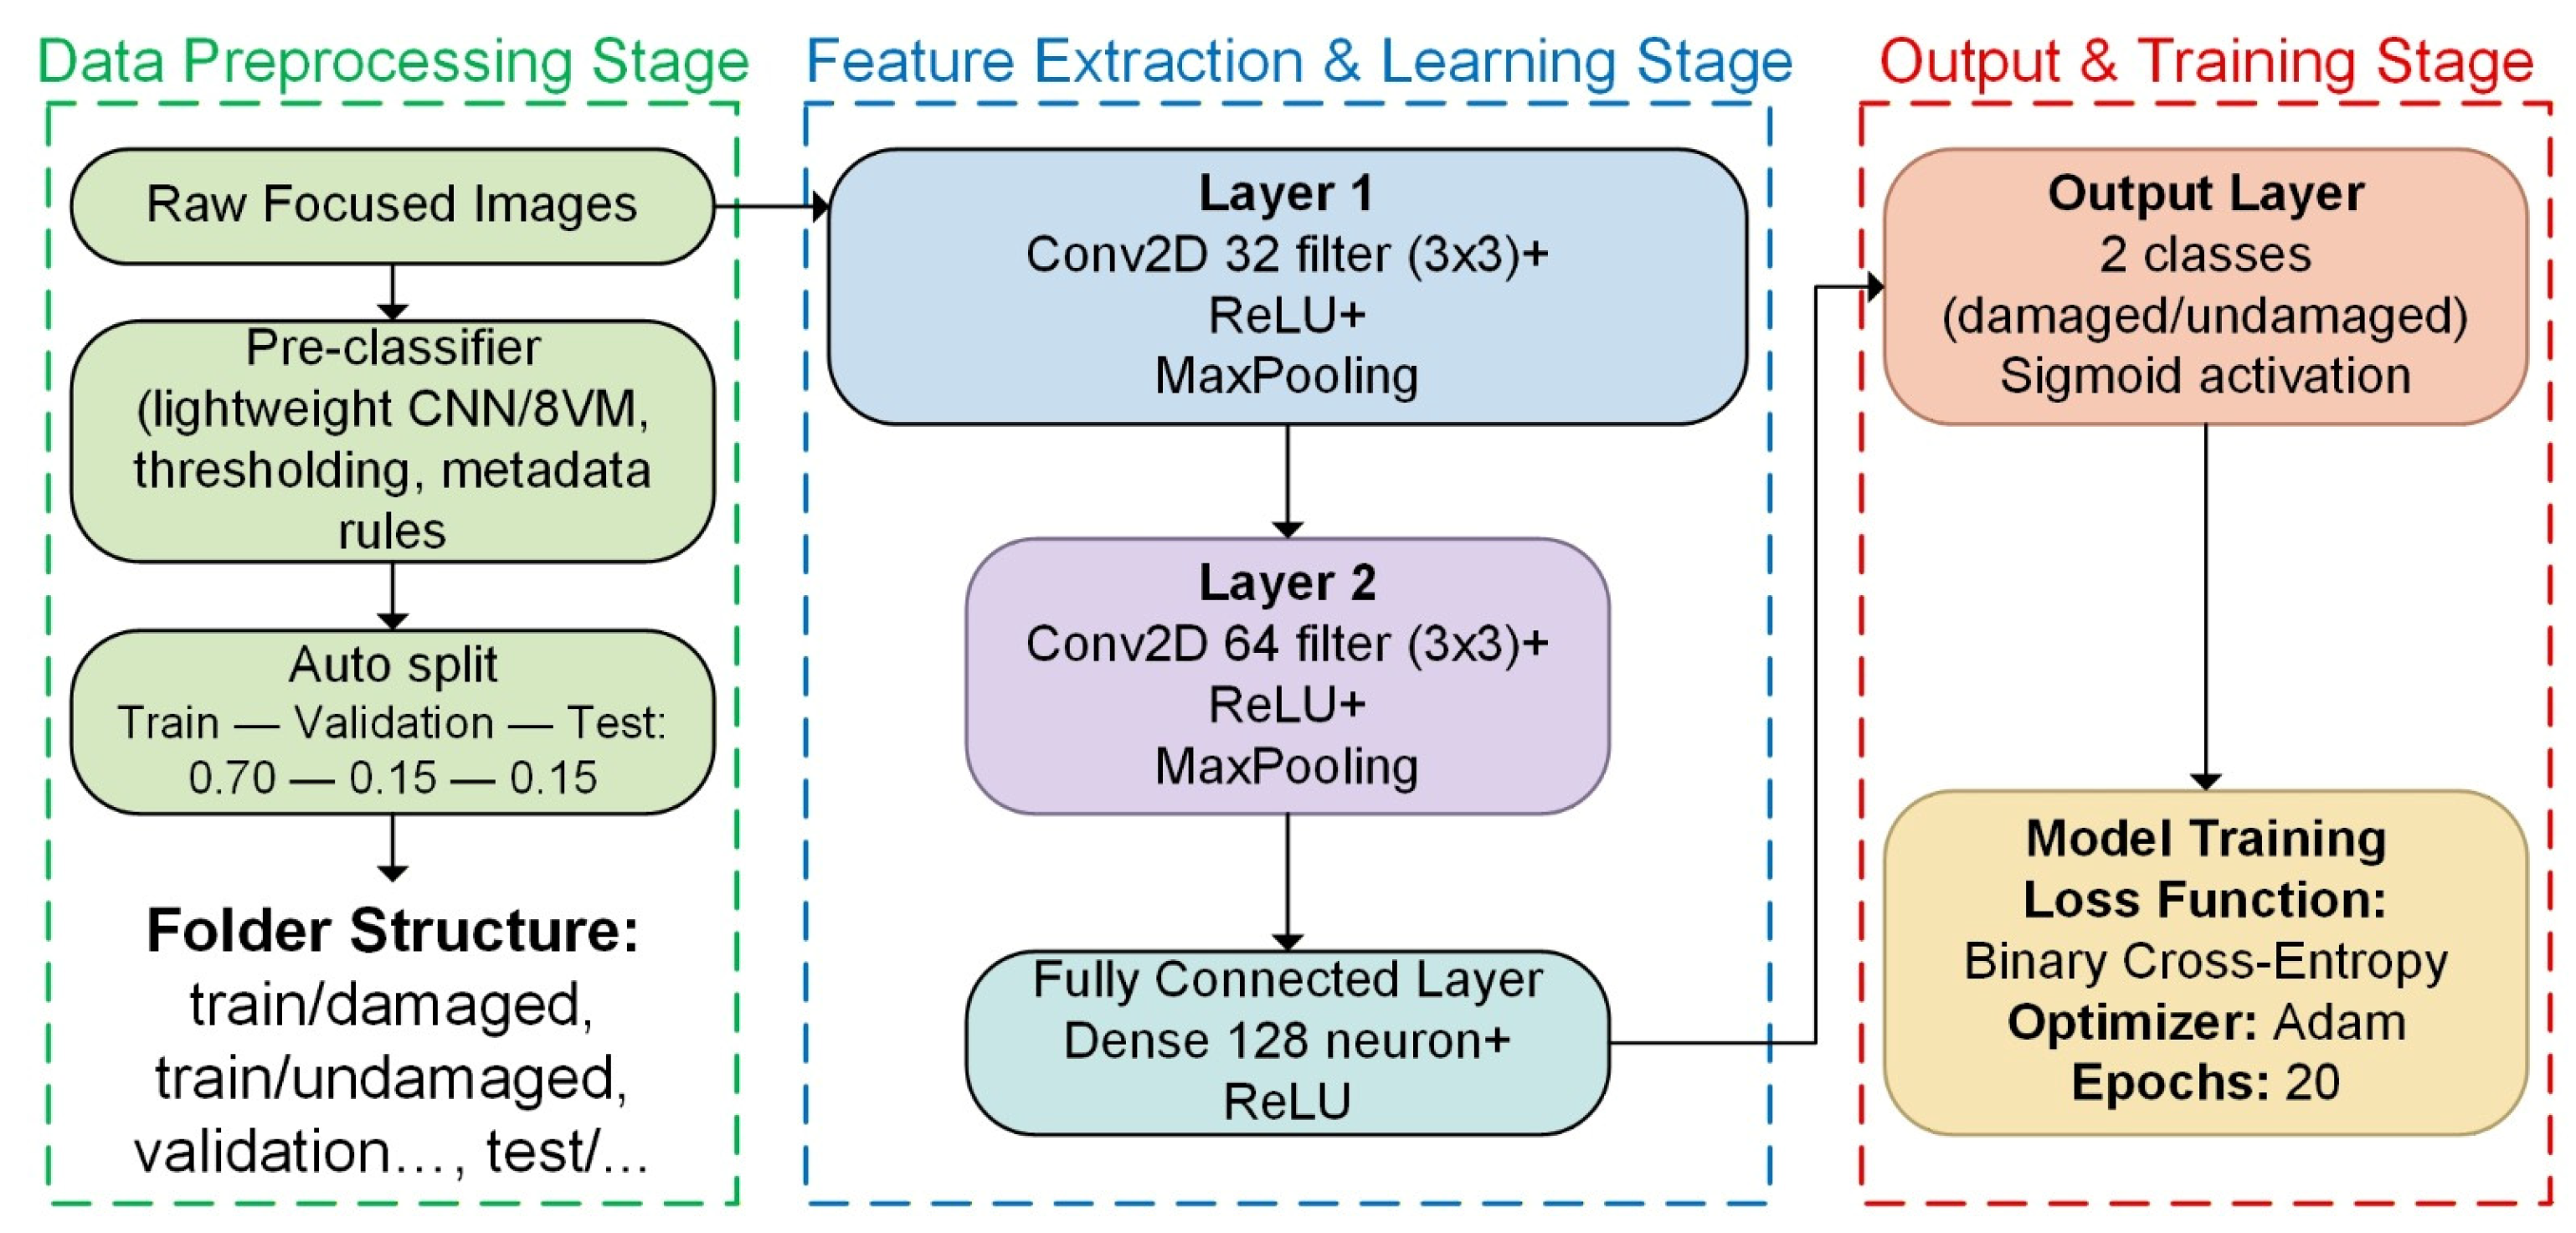
The customized CNN model proposed for this study has been designed with the goal of achieving an optimal balance between computational efficiency and classification accuracy. This model enables the detection of edge contours, texture patterns, and subtle structural irregularities that indicate potential damage to turbine blades, such as the flaking, cracks, wear marks, and surface deformations shown in Figure 4. This framework enables the network to learn to represent both low- and mid-level spatial cues embedded in super-resolution satellite imagery. Model training is performed using the Adam optimization algorithm, which offers adaptive learning rates and improves inter-epoch convergence efficiency. The loss function is defined in (7):
where represents the true class label (1 represents damaged, 0 represents undamaged), and represents the predicted probability for the data point. Various strategies are integrated into the training phase to increase the accuracy of performance results and prevent overfitting.
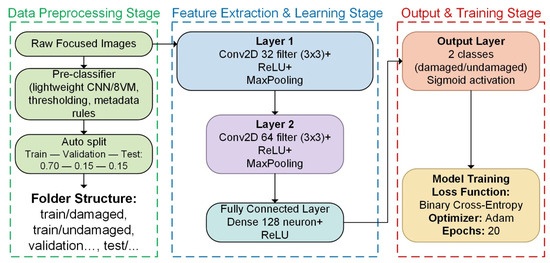
Figure 4.
Summary of the proposed framework.
Data augmentation techniques such as controlled rotations, brightness adjustments, and Gaussian noise injection are used to expose the model to various imaging conditions and increase robustness to illumination and orientation changes. Additionally, an early-stopping method based on validation loss compensation is used to increase training efficiency without unnecessary iterations.
The overall architecture is extremely lightweight yet efficient, making it suitable for real-time deployment in resource-constrained environments such as edge computing units in large-scale wind farms or cloud-based monitoring systems.
2.6. Performance Metrics
Various metrics are used to evaluate classification performance:
Accuracy indicates the proportion of correct predictions (both true positives and true negatives) to the total number of predictions; precision indicates the proportion of predicted damaged samples that are actually damaged; recall measures the proportion of actual damaged samples correctly identified; F1 balances both. The ROC curve and the Area Under the Curve (AUC) provide a threshold-independent measure of discrimination capability.
3. Performance Evaluation and Analysis
In this study, the performance of the proposed SRGAN-CNN-based framework in detecting turbine damage is extensively investigated using accuracy, loss values, classification metrics, confusion matrix, ROC curve and AUC value.
3.1. Training and Validation Performance
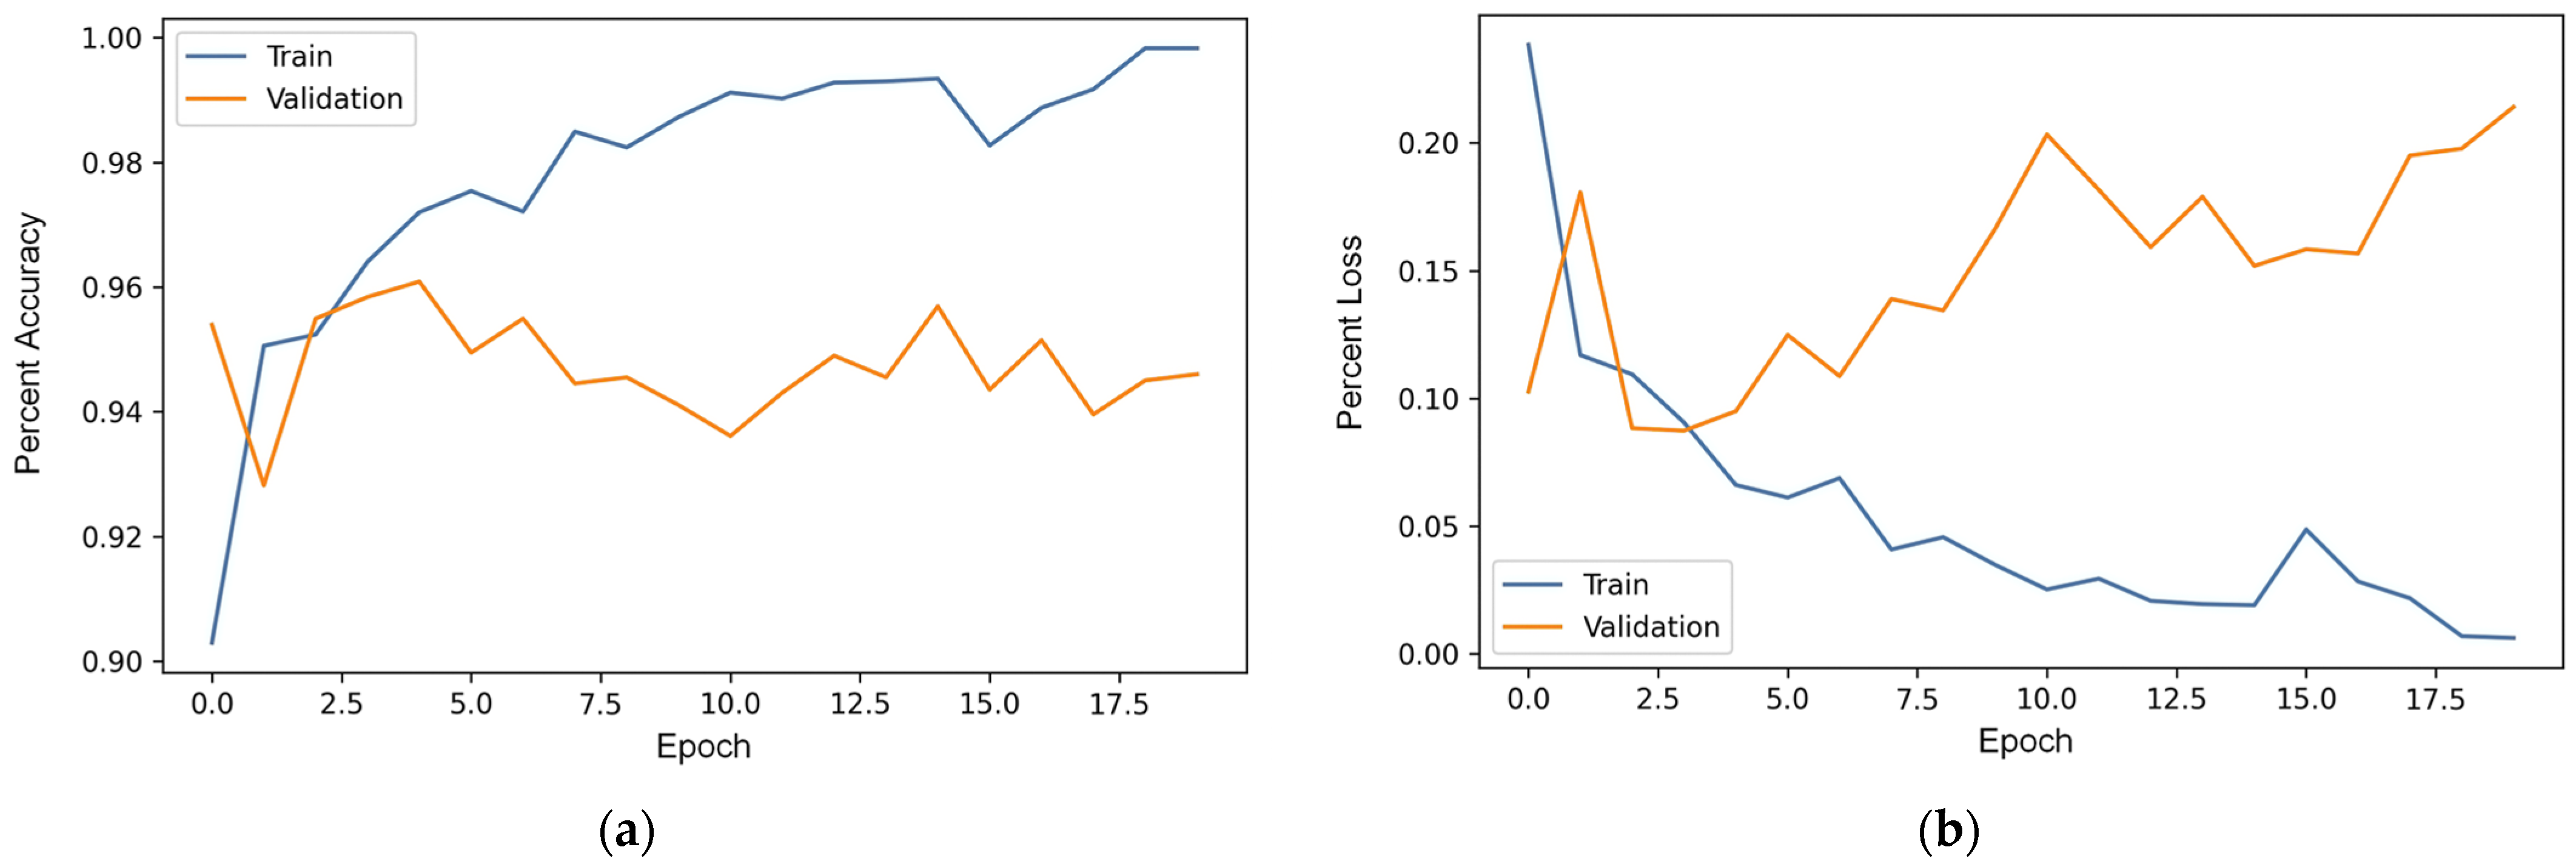
The training of the model consists of 20 epochs. While the training accuracy reached 96%, the validation accuracy remained stable at approximately 94%. The training loss decreased to 0.08, and the validation loss to 0.11, indicating that the model’s parameters were correctly chosen (e.g., dropout) and overfitting did not occur. The results are shown in Table 3, and graphs illustrating the course of the training process are presented in Figure 5.
Table 3.
Accuracy and loss results of the CNN model.
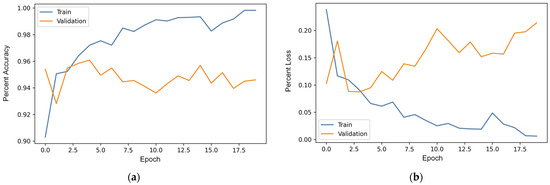
Figure 5.
Evolution of training and validation metrics over 20 epochs: (a) accuracy; (b) loss.
3.2. Classification Performance
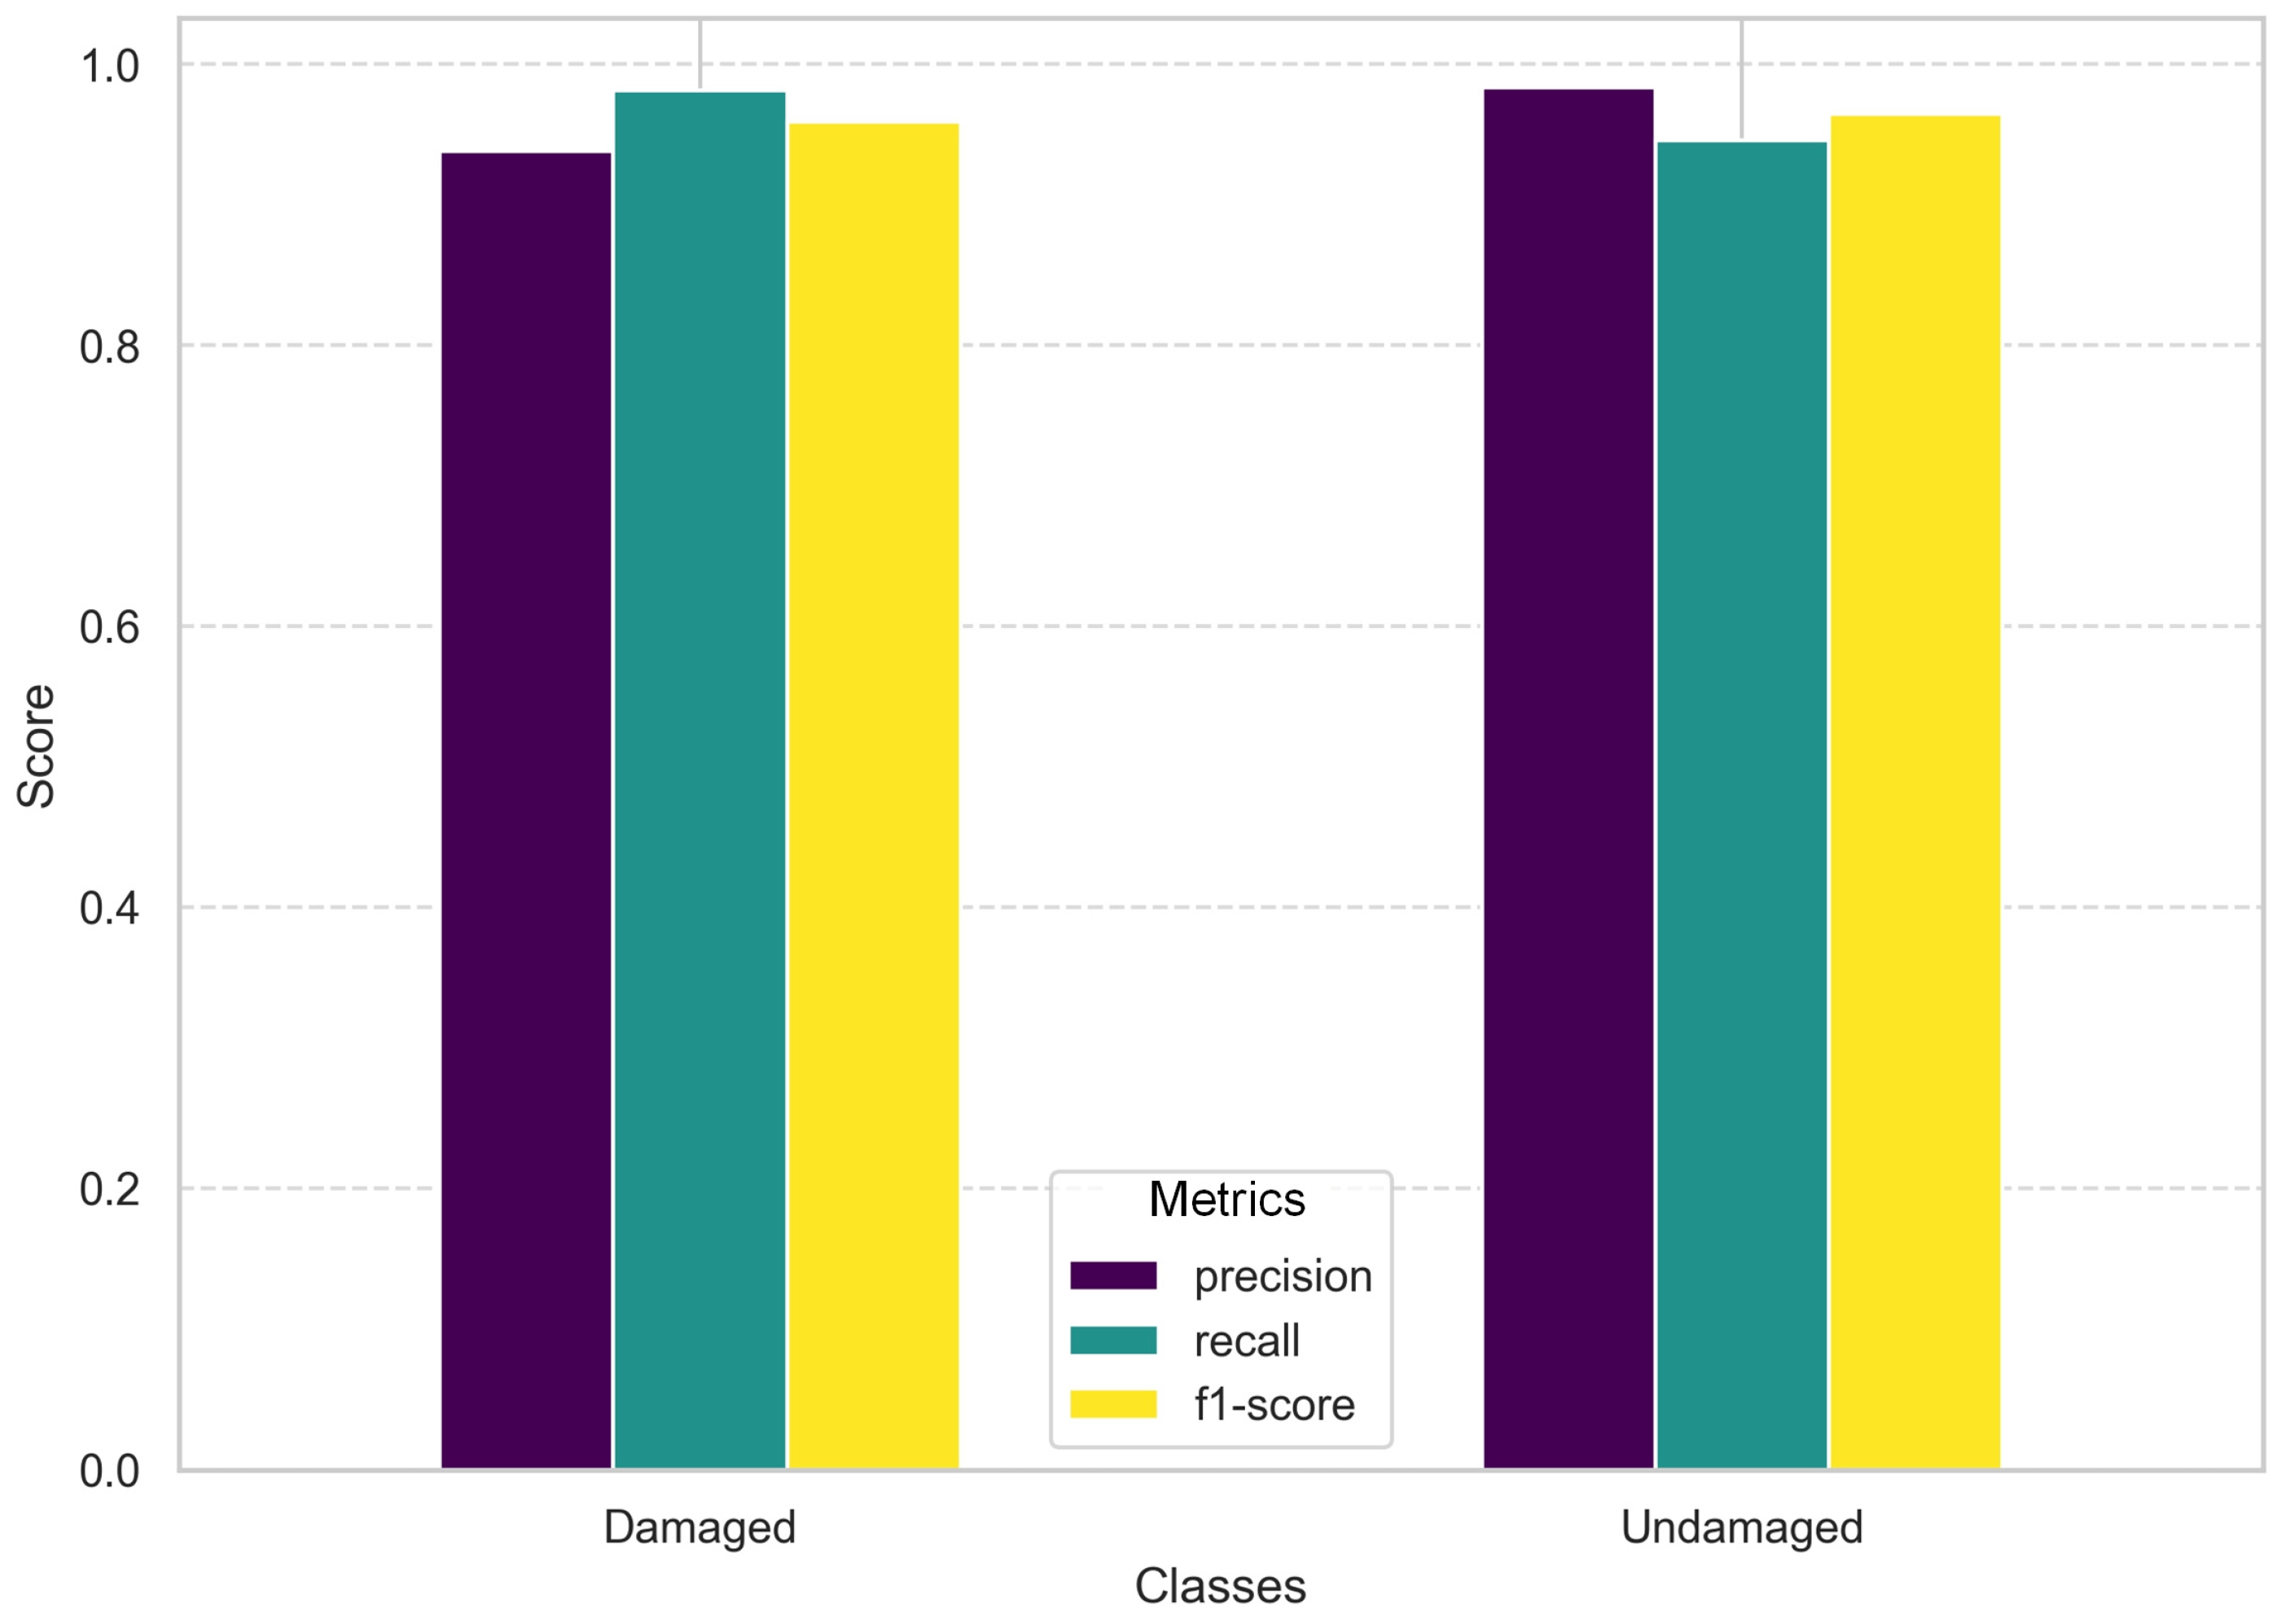
The model’s classification performance is analyzed not only by overall accuracy but also by precision, recall, and F1 score, which are examined separately for each class. The results for the damaged and undamaged turbine classes are presented in Table 4, and visual comparisons are shown in Figure 6.
Table 4.
Precision, recall, and F1 score for both classes.
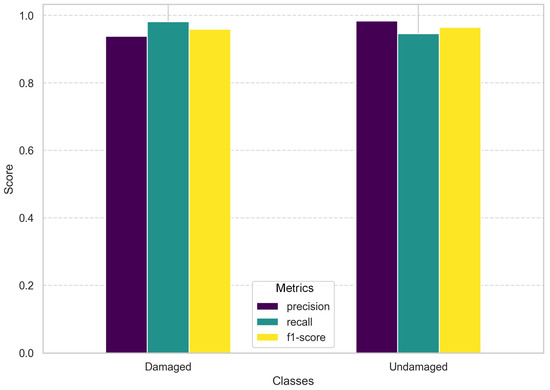
Figure 6.
Precision, recall, and F1 score values for damaged and undamaged turbine images.
3.3. Confusion Matrix Analysis
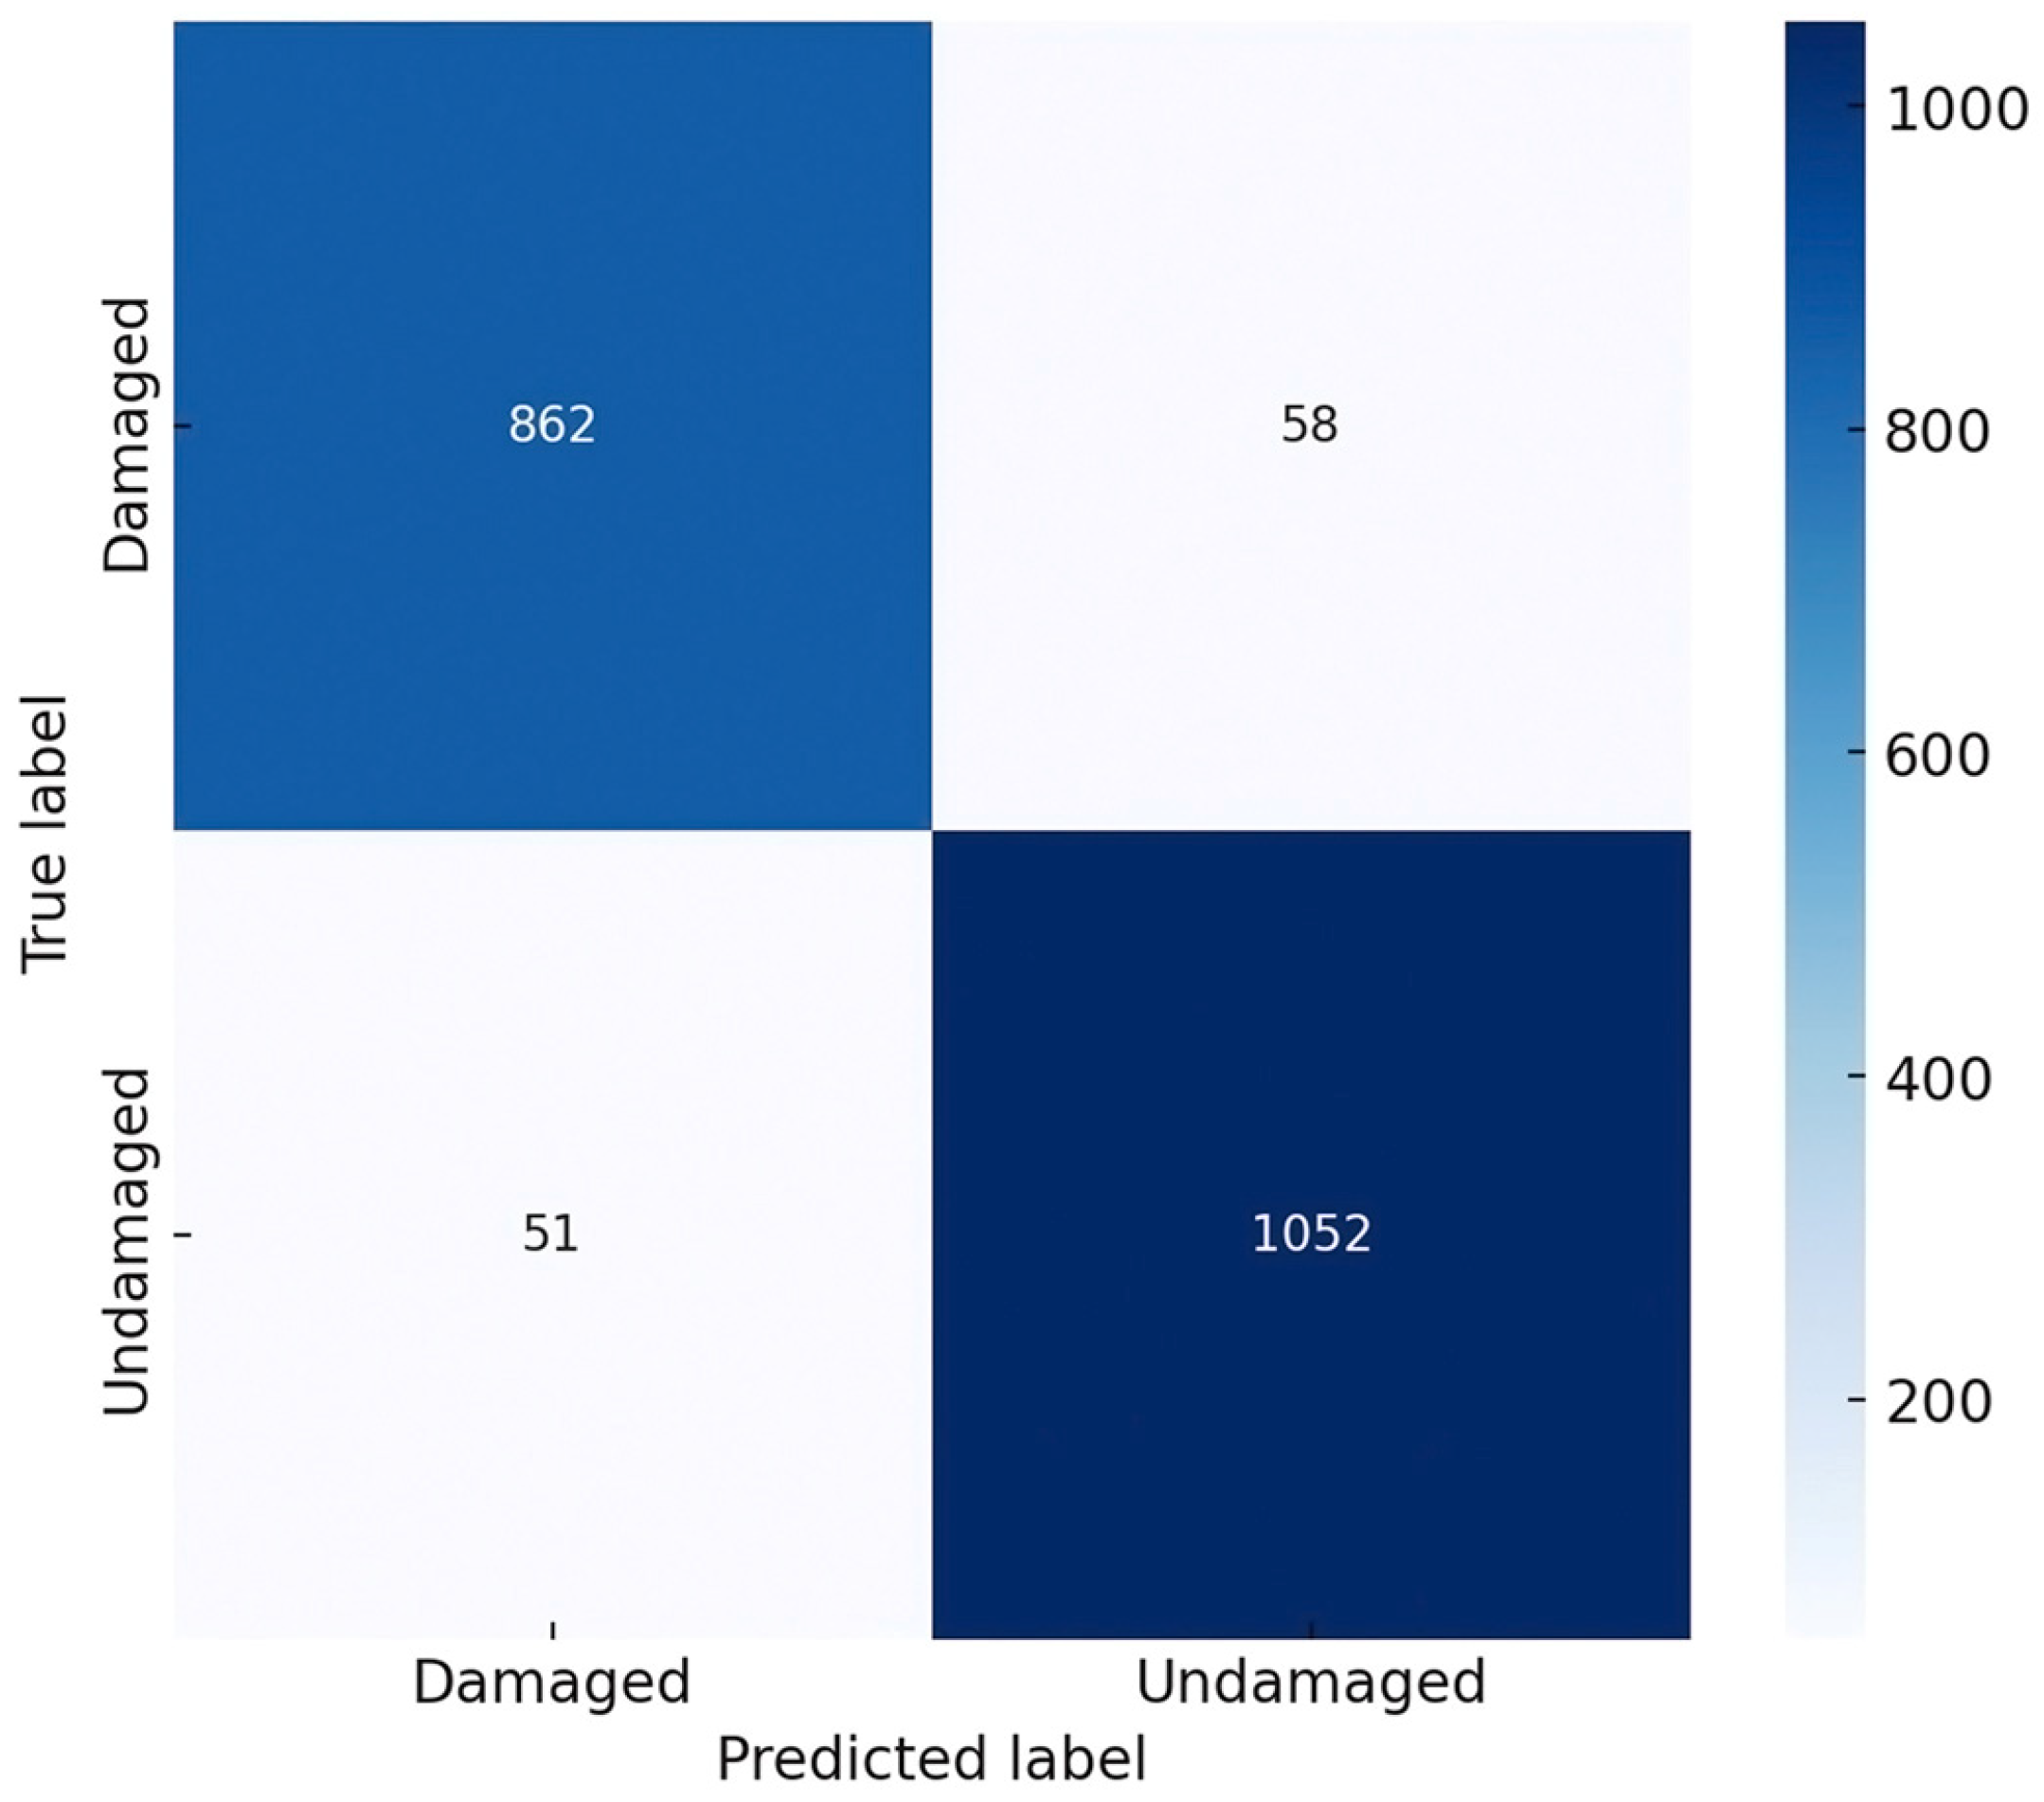
The model’s correct and incorrect predictions are visualized in Figure 7 as a confusion matrix, and the numerical results are detailed in Table 5. On the test data, 862 damaged samples are correctly classified (TP), and 1052 undamaged samples are correctly identified (TN). The number of false negatives (FNs) is 58, while the number of false positives (FPs) is 51. In particular, false negatives are more critical for maintenance planning, and in such cases, it is recommended to support the SRGAN-CNN method with UAV or SCADA-based systems.
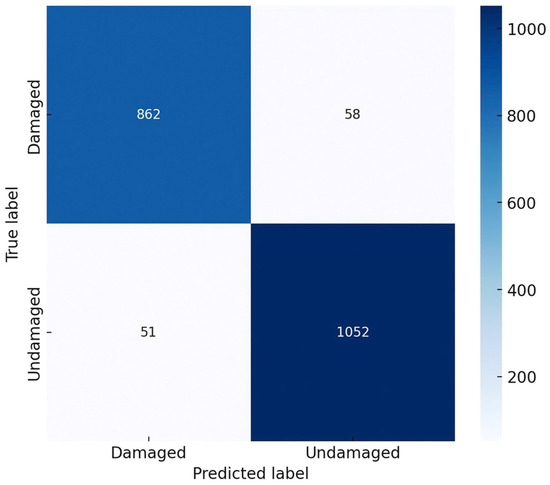
Figure 7.
Confusion matrix visualization for damaged and undamaged classes.
Table 5.
Confusion matrix results for the test set.
3.4. ROC Curve and AUC Evaluation
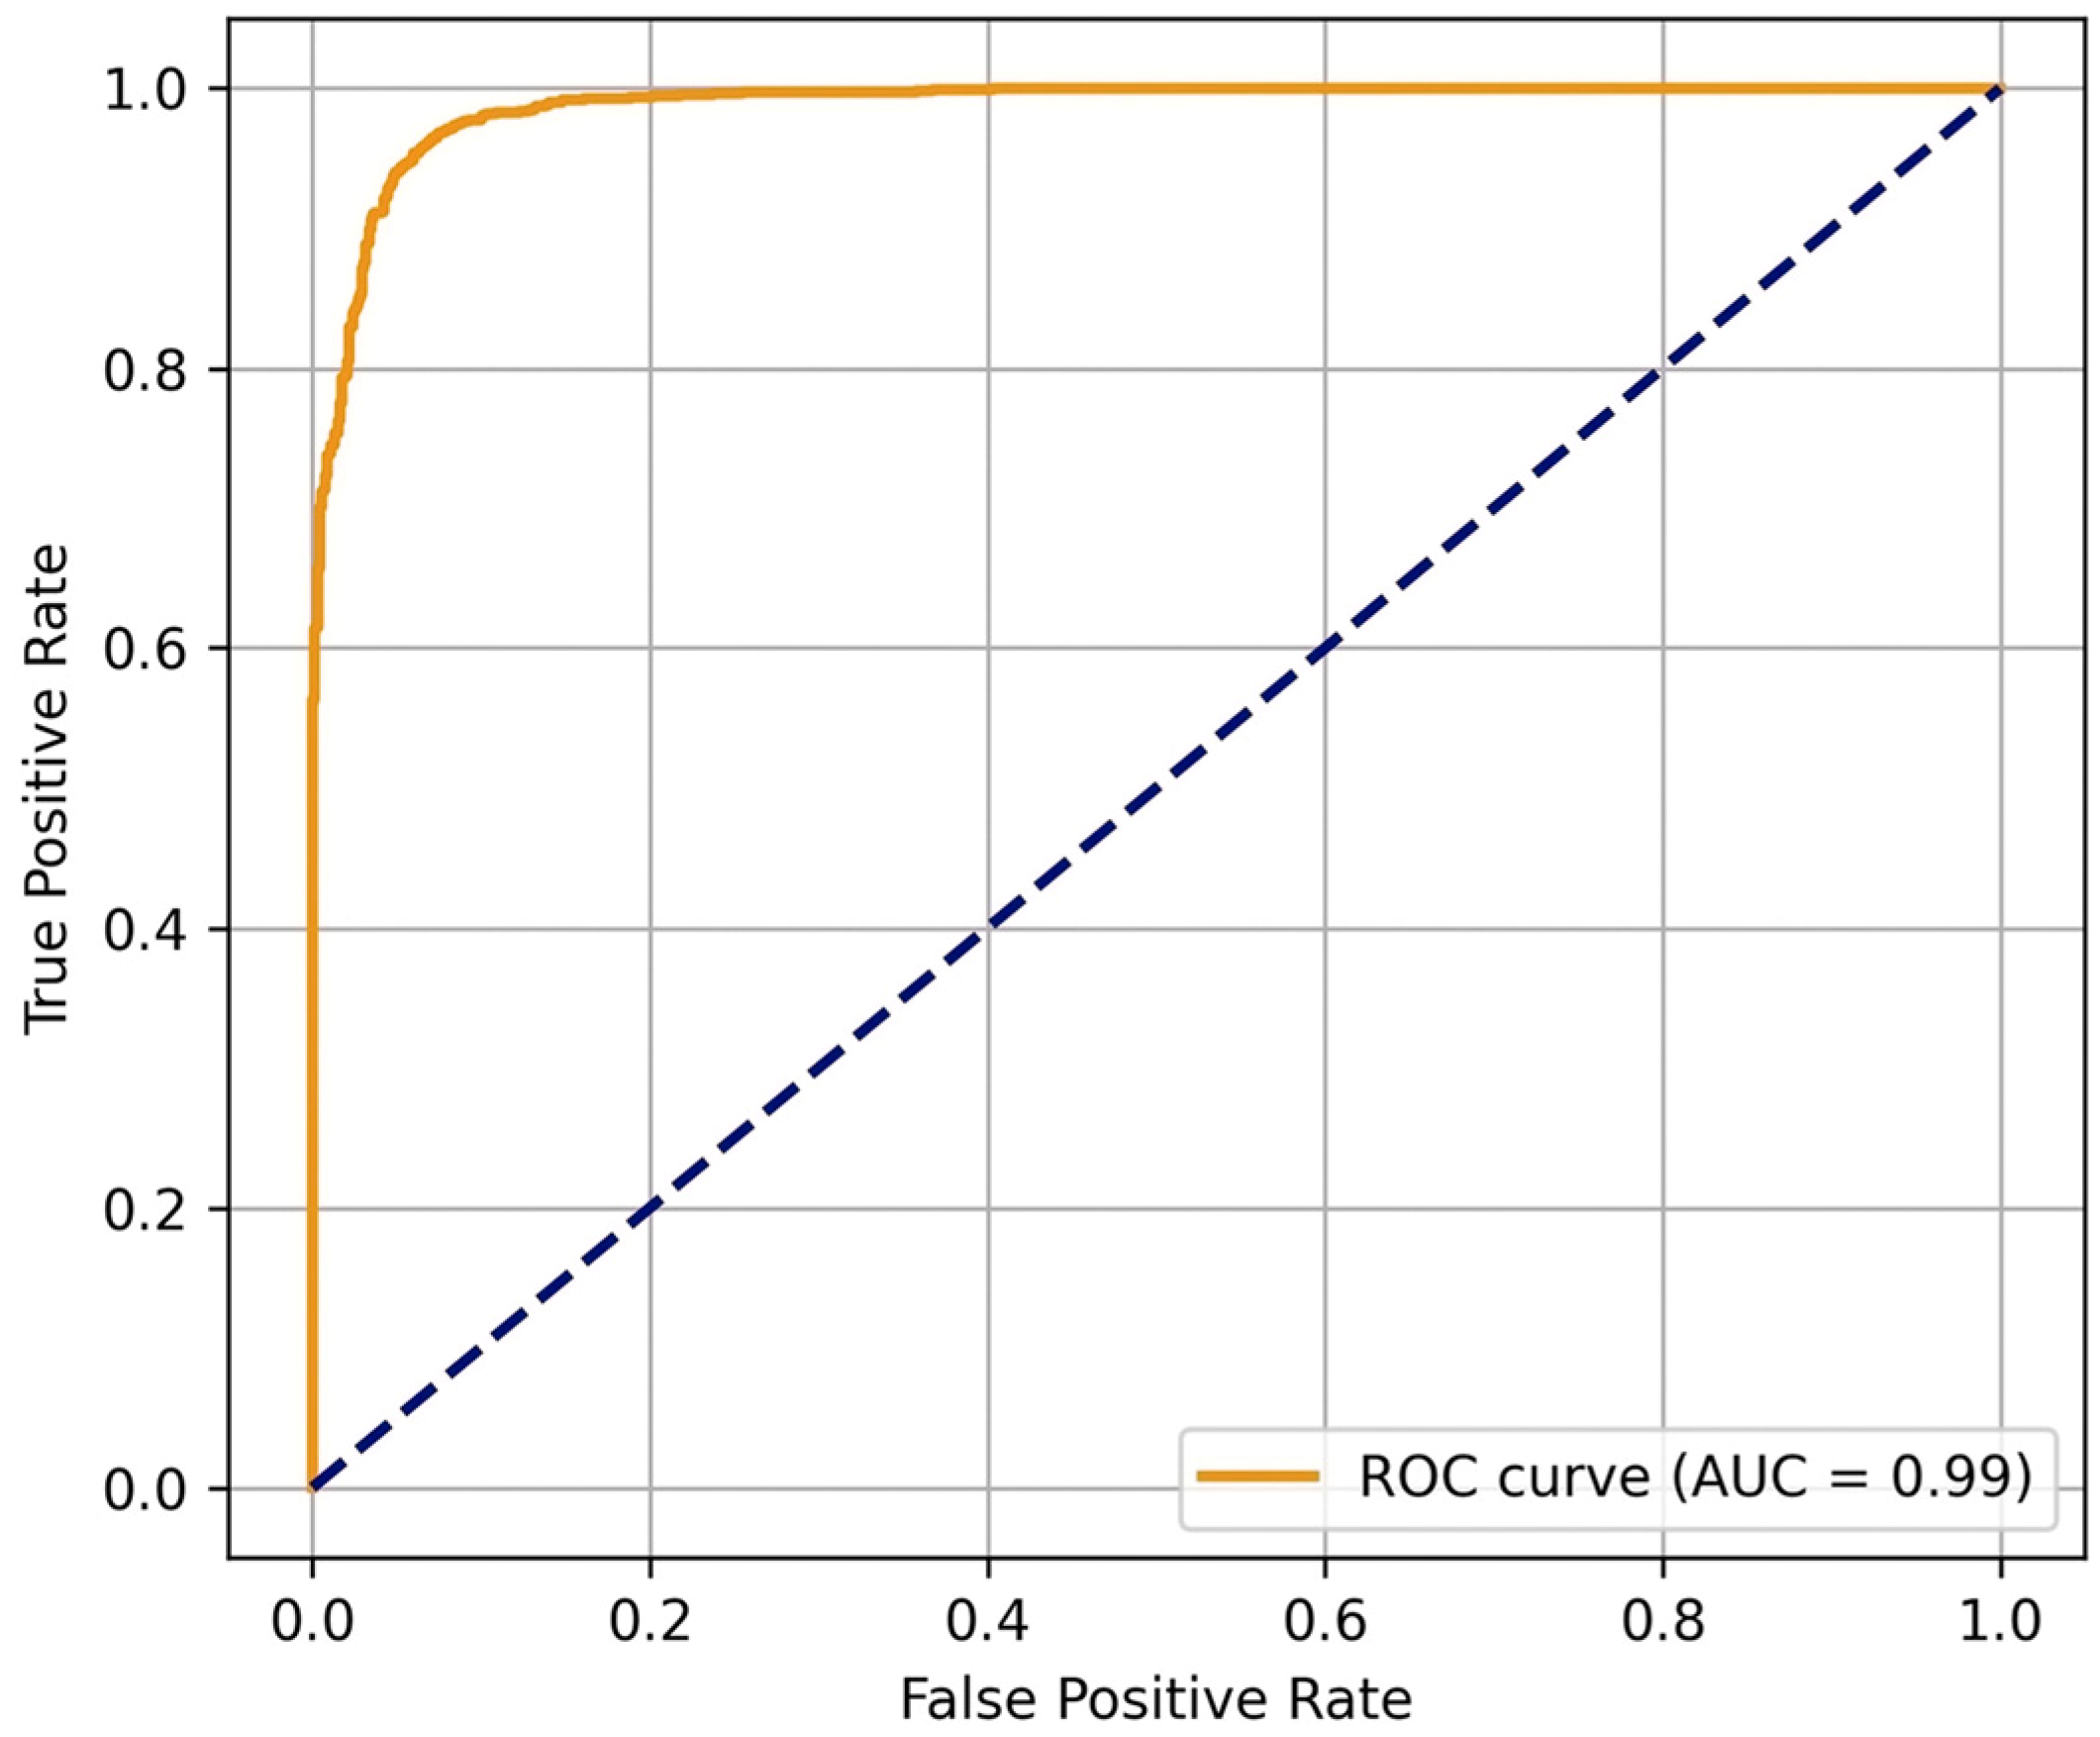
To assess the model’s ability to discriminate between binary classifications, an ROC curve is generated, and AUC is calculated. The ROC curve shown in Figure 8 is quite close to the ideal corner point, the upper left. This closeness demonstrates the success of all processes used in preparing the model and dataset proposed in this study. The AUC value of 0.99 further confirms the model’s high discrimination ability and reliability claims. Furthermore, the fact that the ROC curve lies significantly above the reference line (AUC = 0.5) corresponding to the random classifier, shown as a dashed line in the figure, indicates that the model’s discriminative knowledge between classes far exceeds that of random performance. This demonstrates that the proposed approach not only provides high accuracy but also offers a reliable and consistent classification capability.
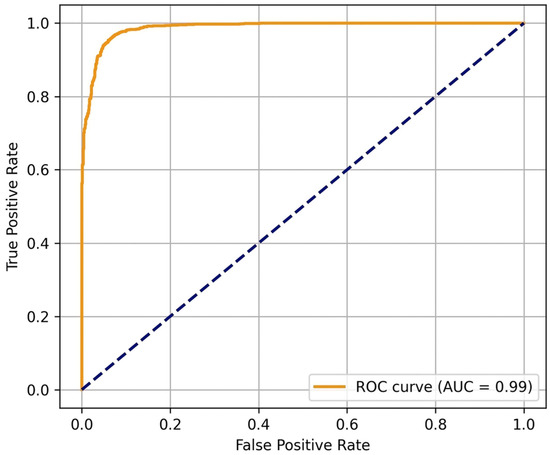
Figure 8.
ROC curve and AUC of the proposed CNN model.
3.5. Comparative Analysis Conclusions
Visual inspection of misclassifications showed that fine cracks, often overlooked by the model, are generally missed in false negatives, while surface blemishes are interpreted as damage in false positives. The proposed SRGAN-CNN method offers advantages in terms of both wider coverage and cost-effectiveness compared to UAV-based inspections. Therefore, it is quite suitable for application as the first screening and early warning system in large-scale wind farms.
4. Conclusions
The findings of this research highlight the potential of data-driven super-resolution and classification methods in advancing renewable energy monitoring systems. This study presents a novel deep learning framework that combines Sentinel-2 satellite imagery with a custom CNN classifier, SRGAN-based super-resolution, and a novel approach for identifying wind turbine damage at the microstructural level. The spatial resolution of the 10 m Sentinel-2 images, freely available under the Copernicus Program, has been increased to approximately 30 cm. This allows for the detection of small defects that would otherwise be hidden in standard resolution data, such as blade deformations, erosion, and cracks. To increase the generalizability of the model and reduce the likelihood of overfitting, 10,000 super-resolution images and 5000 enhanced resolution images were generated from these images. A total of 15,000 samples were generated. The proposed CNN architecture achieved 95% accuracy on the test set, an AUC score of 0.99, and an effective balance between precision, recall, and F1 score. The confusion matrix revealed that the absence of many misclassifications was primarily due to the presence of ambiguous visual signals, such as shadows or dots on the surface. Based on the findings, the proposed approach appears to have the potential to serve as a cost-effective and scalable alternative to traditional monitoring techniques such as SCADA-based monitoring or UAV imaging. However, some issues persist with satellite imagery, such as seasonal variations and atmospheric noise. Future work includes integrating diverse data sources such as UAV imagery, Internet of Things (IoT) sensors, SCADA recordings, and satellite imagery to improve the reliability of damage detection. Furthermore, the use of models such as Image Transformers (ViT) and Swin-Transformers is expected to facilitate learning and improve model performance. As a result, the proposed approach is cost-effective and contributes to the development of intelligent condition-monitoring systems. The success of this approach demonstrates its applicability to different renewable energy sources.
Author Contributions
Conceptualization, O.E.; Methodology, O.E.; Software, K.Ç.; Validation, K.Ç., O.E. and M.K.; Formal analysis, K.Ç.; Investigation, O.E., K.Ç. and M.K.; Resources, K.Ç.; Data curation, K.Ç.; Writing—Original Draft Preparation, K.Ç.; Writing—Review and Editing, M.K. and O.E.; Visualization, K.Ç.; Supervision, M.K.; Project administration, M.K.; Funding acquisition, O.E. and M.K. All authors have read and agreed to the published version of the manuscript.
Funding
This work was supported in part by The Scientific and Technological Research Council of Turkiye (TUBITAK) under the 2219 International Postdoctoral Research Fellowship Program.
Institutional Review Board Statement
Not applicable.
Informed Consent Statement
Not applicable.
Data Availability Statement
This study analyzed publicly available datasets. These data can be accessed at https://dataspace.copernicus.eu/data-collections/copernicus-sentinel-data/sentinel-2 (accessed on 2 September 2025).
Conflicts of Interest
The authors declare no conflicts of interest.
References
- Adeosun, T.A.; Amosu, C.O.; Omitogun, O.A.; Amusa, O.M.; Morenikeji, B.A. Renewable Energy for Sustainable Development in Developing Countries: Benefits to the Environment. J. Energy Res. Rev. 2023, 13, 1–25. [Google Scholar] [CrossRef]
- Khan, P.W.; Byun, Y.C. A Review of Machine Learning Techniques for Wind Turbine’s Fault Detection, Diagnosis, and Prognosis. Int. J. Green Energy 2024, 21, 771–786. [Google Scholar] [CrossRef]
- Huang, X.; Li, Y.; Chai, Y. Intelligent Fault Diagnosis Method of Wind Turbines Planetary Gearboxes Based on a Multi-Scale Dense Fusion Network. Front. Energy Res. 2021, 9, 747622. [Google Scholar] [CrossRef]
- Mandroux, N.; Dagobert, T.; Drouyer, S.; Grompone von Gioi, R. Single Date Wind Turbine Detection on Sentinel-2 Optical Images. Image Process. Line 2022, 12, 198–217. [Google Scholar] [CrossRef]
- Sentinel-2|Copernicus Data Space Ecosystem. Available online: https://dataspace.copernicus.eu/data-collections/copernicus-sentinel-data/sentinel-2 (accessed on 6 November 2025).
- Zhang, K.; Sumbul, G.; Demir, B. An Approach to Super-Resolution of Sentinel-2 Images Based on Generative Adversarial Networks. In Proceedings of the 2020 Mediterranean and Middle-East Geoscience and Remote Sensing Symposium, M2GARSS 2020, Proceedings, Tunis, Tunisia, 9–11 March 2020; pp. 69–72. [Google Scholar] [CrossRef]
- Shihavuddin, A.S.M.; Chen, X.; Fedorov, V.; Christensen, A.N.; Riis, N.A.B.; Branner, K.; Dahl, A.B.; Paulsen, R.R. Wind Turbine Surface Damage Detection by Deep Learning Aided Drone Inspection Analysis. Energies 2019, 12, 676. [Google Scholar] [CrossRef]
- Aminzadeh, A.; Dimitrova, M.; Meiabadi, M.S.; Sattarpanah Karganroudi, S.; Taheri, H.; Ibrahim, H.; Wen, Y. Non-Contact Inspection Methods for Wind Turbine Blade Maintenance: Techno–Economic Review of Techniques for Integration with Industry 4.0. J. Nondestruct. Eval. 2023, 42, 54. [Google Scholar] [CrossRef]
- Pratt, R.; Allen, C.; Masoum, M.A.S.; Seibi, A. Defect Detection and Classification on Wind Turbine Blades Using Deep Learning with Fuzzy Voting. Machines 2025, 13, 283. [Google Scholar] [CrossRef]
- Song, X.; Li, Z. Seasonally Robust Offshore Wind Turbine Detection in Sentinel-2 Imagery Using Imaging Geometry-Aware Deep Learning. Remote Sens. 2025, 17, 2482. [Google Scholar] [CrossRef]
- Wang, X.; Sun, L.; Chehri, A.; Song, Y. A Review of GAN-Based Super-Resolution Reconstruction for Optical Remote Sensing Images. Remote Sens. 2023, 15, 5062. [Google Scholar] [CrossRef]
- Hao, X.; Liu, L.; Yang, R.; Yin, L.; Zhang, L.; Li, X. A Review of Data Augmentation Methods of Remote Sensing Image Target Recognition. Remote Sens. 2023, 15, 827. [Google Scholar] [CrossRef]
- Shermeyer, J.; Van Etten, A. The Effects of Super-Resolution on Object Detection Performance in Satellite Imagery. In Proceedings of the IEEE Computer Society Conference on Computer Vision and Pattern Recognition Workshops, Long Beach, CA, USA, 16–17 June 2019; pp. 1432–1441. [Google Scholar] [CrossRef]
- Xiong, Y.; Guo, S.; Chen, J.; Deng, X.; Sun, L.; Zheng, X.; Xu, W. Improved SRGAN for Remote Sensing Image Super-Resolution Across Locations and Sensors. Remote Sens. 2020, 12, 1263. [Google Scholar] [CrossRef]
- Jiang, N.; Zhao, W.; Wang, H.; Luo, H.; Chen, Z.; Zhu, J. Lightweight Super-Resolution Generative Adversarial Network for SAR Images. Remote Sens. 2024, 16, 1788. [Google Scholar] [CrossRef]
Disclaimer/Publisher’s Note: The statements, opinions and data contained in all publications are solely those of the individual author(s) and contributor(s) and not of MDPI and/or the editor(s). MDPI and/or the editor(s) disclaim responsibility for any injury to people or property resulting from any ideas, methods, instructions or products referred to in the content. |
© 2026 by the authors. Licensee MDPI, Basel, Switzerland. This article is an open access article distributed under the terms and conditions of the Creative Commons Attribution (CC BY) license.