Abstract
This study explores the effectiveness of ultraviolet (UV) irradiation, ozonation (O3), granular activated carbon (GAC) adsorption, and their combinations (UV/GAC, O3/GAC) in removing selected pharmaceuticals and common wastewater micropollutants under controlled laboratory-scale conditions. Eight target compounds—candesartan, irbesartan, valsartan, metoprolol, diclofenac, metformin, sucralose, and caffeine—were identified and quantified in real wastewater samples collected from a municipal wastewater treatment plant. Ozonation proved to be the most effective standalone method, achieving complete removal (100%) of five pharmaceuticals and partial removal of sucralose (~60%) and metformin (~17%). The combined O3/GAC treatment further enhanced overall removal efficiency. In contrast, UV irradiation alone showed limited effectiveness. Importantly, all substances except metformin were fully removed by at least one of the tested methods. These findings underscore the potential of advanced and hybrid treatment technologies—validated here at the laboratory scale—for improving pharmaceutical removal from wastewater and mitigating their environmental impact.
Keywords:
candesartan; irbesartan; valsartan; metoprolol; diclofenac; metformin; sucralose; caffeine 1. Introduction
Pharmaceuticals are increasingly recognized as persistent micropollutants in municipal wastewater, posing ecological and human health risks due to their bioactivity and resistance to conventional treatment. Municipal wastewater treatment plants (WWTPs), primarily designed to reduce organic load and pathogens, are not optimized to eliminate trace contaminants such as pharmaceuticals and other emerging pollutants [1,2,3]. Consequently, residues of these substances are frequently detected in treated effluents, potentially entering aquatic environments [4]. Hospital wastewater further exacerbates this issue, as it contains high concentrations of active pharmaceutical ingredients that are insufficiently removed by standard processes [5,6].
To overcome these limitations, advanced treatment technologies have been developed and tested. Among the most promising are ultraviolet (UV) irradiation, ozonation (O3), and granular activated carbon (GAC) adsorption. UV irradiation utilizes high-energy photons to degrade micropollutants, but its efficiency strongly depends on compound-specific characteristics and operational parameters [7,8]. O3, on the other hand, relies on the generation of reactive species such as hydroxyl radicals, offering broader reactivity and higher removal efficiency, especially for biologically persistent compounds [6,9,10,11].
GAC is widely used for its high adsorption capacity and compatibility with other processes. It has proven effective for a broad range of micropollutants, including pharmaceuticals, by capturing them through surface interactions [12,13]. When combined with UV or O3, GAC can enhance treatment efficiency through synergistic effects—combining oxidative degradation with physical adsorption [14,15,16]. Additionally, ozonation may partially regenerate GAC during operation, extending its functional lifespan [17,18,19].
The removal efficiency of these methods is influenced by the physicochemical properties of target compounds, such as molecular weight, polarity, and hydrophobicity [20,21]. This underscores the importance of compound-specific and combined treatment approaches tailored to the composition of wastewater [22,23].
This study presents laboratory-scale experiments aimed at evaluating the removal of selected pharmaceuticals—candesartan, irbesartan, valsartan, metoprolol, diclofenac—along with caffeine, sucralose, and metformin from real municipal wastewater. The tested treatment processes included UV, O3, GAC, and their combinations (UV/GAC and O3/GAC). The findings contribute to a better understanding of the performance and synergy of advanced treatment methods and provide insight into their practical potential for upgrading wastewater treatment technologies.
2. Materials and Methods
2.1. Experiments
Experiments were conducted using real wastewater samples from a municipal WWTP (270,000 PE). The WWTP technology includes primary sedimentation, a low-load-activated sludge process involving nitrification and pre-denitrification, chemical phosphorus precipitation and anaerobic sludge stabilisation. Composite effluent samples were collected and thoroughly mixed before being filtered through KA 4 filter paper (Papírna Pernštejn, Czech Republic) using a Büchner funnel and an ILMVAC 301861 vacuum pump (Aichtal, Germany). The following subsections describe the individual experiments.
2.1.1. UV
An 8-watt short-wave (254 nm) UV-C G8T5/SW germicidal lamp (Analytik Jena GmbH & Co. KG, Jena, Germany) was used as the UV radiation source. The filtered wastewater sample was collected in beakers and placed in a closed box. The wastewater was then exposed to UV radiation in this sealed box for a total period of 50 min. At 10 min intervals, 30 mL samples were collected to determine the concentration of the selected analytes and therefore the effectiveness of the UV radiation in eliminating them.
2.1.2. O3
The ozone (O3) source was an OT MINI HOME O3 generator (Ozontech, Zlín-Štípa, Czech Republic), which produced 0.4 g of O3 per hour. An aeration disc was placed in a 2-litre glass beaker containing wastewater, and ozone was fed into it via Teflon tubing. The O3 from the ozoniser was applied to the wastewater for 50 min. At 10 min intervals, 30 mL samples were collected to assess the concentration of selected analytes and the efficacy of ozone in their removal.
2.1.3. GAC
For filtration with granular activated carbon (GAC), Carbsorb 40 (Chemviron Carbon GmbH, Hattersheim, Germany) was selected as the adsorbent; its effective particle size was 0.6 mm (detailed specifications of Carbsorb 40 are provided in Table S1). The principle of the setup is based on the flow of tested wastewater through a glass column packed with the adsorbent. During this process, primarily organic compounds are retained on the specific surface area of the GAC. Over time, the adsorption capacity becomes saturated, which is reflected by a subsequent increase in the concentration of selected analytes in the effluent.
The column had a height of 0.6 m and an inner diameter of 0.0315 m. Parameters such as cross-sectional area, column flow rate, respectively, hydraulic loading rate, and linear velocity were calculated; the corresponding equations are also provided in the Supplementary Materials. The mass of the GAC was determined using an OHAUS PRECISION Plus laboratory balance and amounted to 41.5 g. Prior to use, the GAC was wetted and rinsed with distilled water, as recommended by the manufacturer.
The glass column was mounted vertically in a laboratory stand. A support medium in the form of glass beads was placed at the bottom of the column, followed by the appropriate mass of GAC, and covered with another layer of glass beads. The height of the GAC bed was 15 cm (see Figure S1). The support medium was used to prevent displacement or washout of the adsorbent and to ensure even distribution of flow across the GAC surface, thereby enhancing adsorption efficiency. A beaker was placed beneath the column to collect the treated wastewater. The flow rate through the column and the linear velocity were regulated using a control valve, which was set to 5 m·h−1. Wastewater was introduced at the top of the column using a Watson Marlow SCIQ 323 peristaltic pump (Falmouth Cornwall, UK), operated at 20 revolutions per minute (rpm). After initiating the experiment, samples were collected at predefined time intervals (0.5; 1; 1.5; 2; 3; 4; 6; 8; 11; 14; 18; 23; and 30 min), with each sampling lasting 30 s (volume of samples were 30 mL). The concentrations of selected analytes were analysed in each sample to evaluate the GAC’s efficiency in their removal.
2.1.4. UV/GAC
In the experiment combining UV irradiation with column filtration using granular activated carbon (GAC), the same equipment and procedures were used as in the previous individual experiments. Compared to the UV-only experiment, the contact time of the wastewater with UV radiation was reduced by half, to 25 min. After this exposure, a sample was collected to determine the concentration of selected analytes.
Subsequently, the treated wastewater was filtered through a GAC bed with the same mass as previously used (41.5 g). Based on the results obtained from the GAC-only experiment, the sampling times were adjusted accordingly. Samples were collected at 5; 8; 11; 15; 20; 25; 30; 35; 40; 45; 50 and 60 min, with each sampling lasting 30 s. The concentrations of the selected analytes were analysed to assess the overall efficiency of the combined UV/GAC treatment process in their removal.
2.1.5. O3/GAC
In the experiment combining O3 treatment with column filtration using granular activated carbon (GAC), the same equipment and procedures were used as in the previous individual experiments. The wastewater was first treated with ozone and subsequently filtered through the GAC column.
Based on the results of the ozonation-only experiment, the O3 exposure time was limited to 5 min. After this period, a sample was collected for the determination of selected analyte concentrations. The subsequent filtration through GAC was performed using the same procedure as described in Section 2.1.4 (UV/GAC).
2.2. Measurements and Data Analysis
The target analytes were measured using a gradient high-performance liquid chromatograph (HPLC) Shimadzu Nexera X2 (Shimadzu Corporation, Kyoto, Japan) and subsequently analysed with a tandem mass spectrometer SCIEX QTRAP 6500+ (Sciex, Marlborough, MA, USA). Detailed specifications of the measurement method are provided in the Supplementary Materials.
3. Results
The results are processed graphically according to the individual methods used to remove the selected analytes. To improve clarity, the analytes are divided into three groups to ensure the values are legible and do not overlap. Candesartan, irbesartan and valsartan form the first group. The second group comprises diclofenac, metoprolol and caffeine, while the third group comprises sucralose and metformin.
3.1. UV
Figure 1 shows the efficacy of UV irradiation, with the first group of analytes consisting of candesartan, irbesartan and valsartan. The initial concentrations were 0.363 μg·L−1, 0.030 μg·L−1 and 0.504 μg·L−1, respectively. After 50 min, the candesartan concentration decreased by 21.10% (to 0.261 μg·L−1). The decrease was negligible for irbesartan (13.33%) and was only 8.13% for valsartan; this variation in values indicates a possible measurement error. Therefore, UV radiation does not significantly degrade these drugs. The second group includes diclofenac and metoprolol. Caffeine was below the limit of detection; therefore, the graphical plot is not shown. Diclofenac was completely degraded after 10 min, whereas the concentration of metoprolol (initially 0.429 μg·L−1) did not decrease significantly. Due to the fluctuations in the measurements (e.g., an increase after 40 min), the decrease may be more attributable to experimental error. Therefore, UV radiation is only effective on diclofenac. The third group consists of metformin and sucralose. The initial metformin concentration was 14.413 μg·L−1, decreasing by 18.37% to 11.765 μg·L−1 after 50 min. Sucralose, on the other hand, increased slightly (from 19.504 to 20.402 μg·L−1), confirming its resistance to UV irradiation. In this case, the effectiveness of UV irradiation is limited.
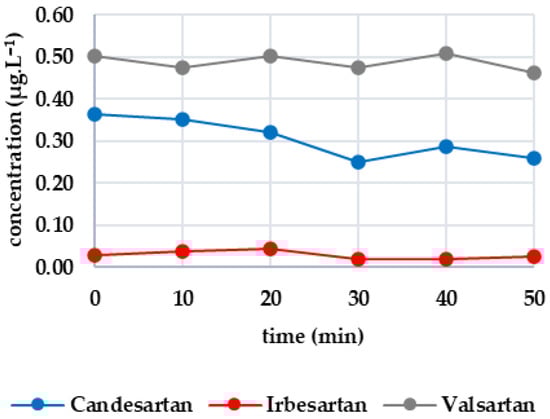
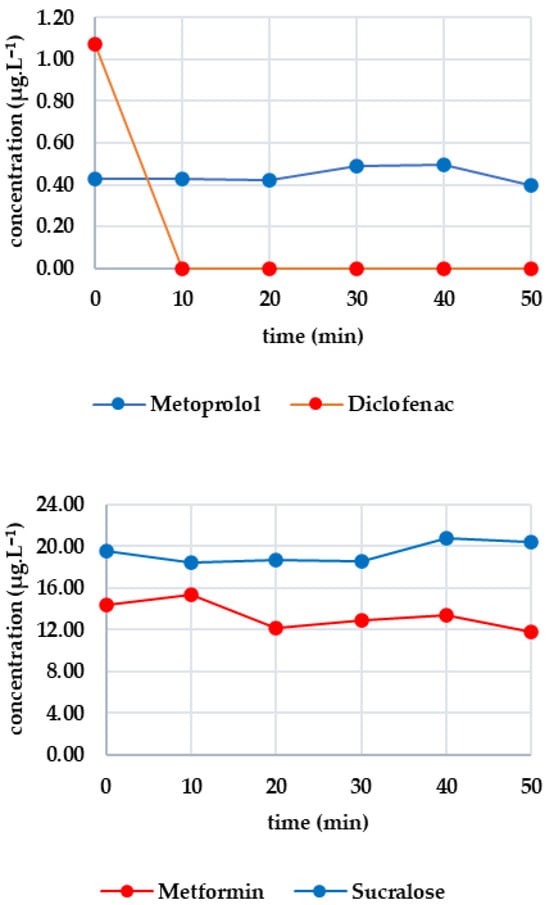
Figure 1.
Dynamics of analyte concentration in the UV irradiation reaction over time.
3.2. O3
As the same sample was used, the initial concentrations were identical to those in the previous experiment. Figure 2 shows the effectiveness of O3 on each analyte. All substances in the first group showed a rapid decrease: candesartan dropped by 48% after 10 min; irbesartan dropped below the limit of detection (complete degradation occurred); and valsartan decreased to 0.452 μg·L−1. Complete degradation occurred with candesartan after 30 min and with valsartan after 40 min. O3 was highly effective in this case. Diclofenac was completely degraded within 10 min, while metoprolol halved and fell below the limit of detection after 20 min. Ozone was also highly effective here. Metformin was stable in the presence of ozone, with only a 17% decrease after 50 min and significant fluctuations. In contrast, sucralose gradually decreased, with 58% degradation after 50 min. These results confirm sucralose’s sensitivity to ozone.
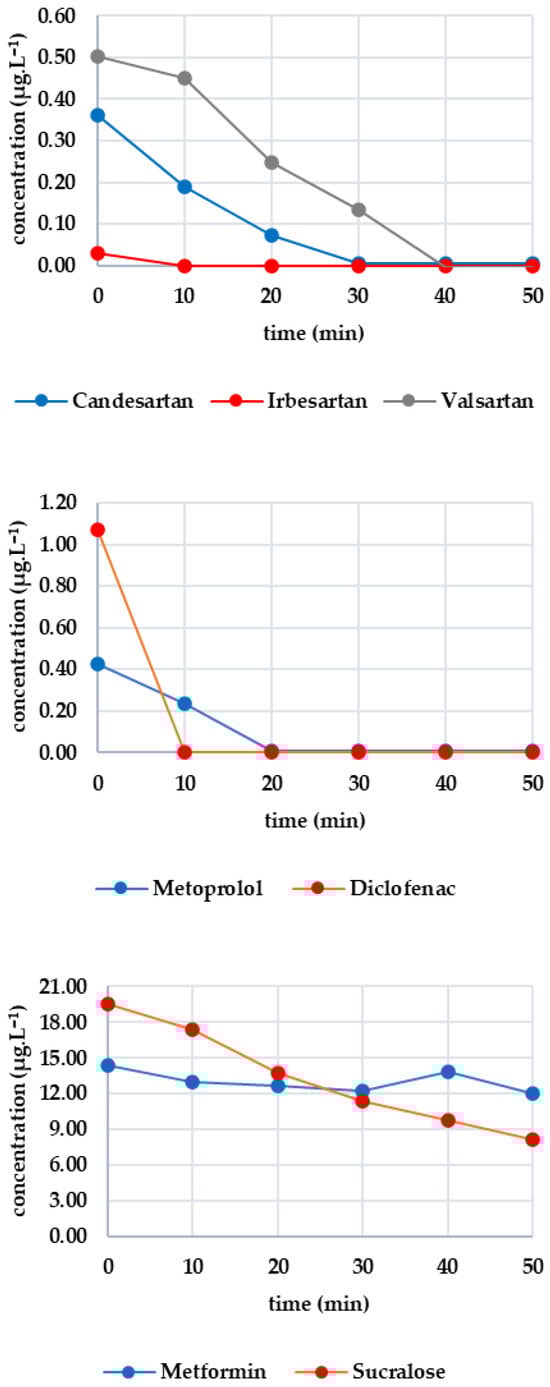
Figure 2.
Dynamics of analyte concentration in the O3 reaction over time.
3.3. GAC
Figure 3 shows the evolution of the monitored analyte concentrations during GAC filtration. As irbesartan was not detected in the sample, it is not plotted in Figure 3. There was a sharp drop in the concentrations of candesartan and valsartan below the limit of detection after only 30 s. The initial concentrations were 0.324 μg·L−1 for candesartan and 1.455 μg·L−1 for valsartan. The valsartan concentration remained below the limit of detection until the sixth minute, after which it began to rise, reaching 0.456 μg·L−1 at the thirtieth minute. The candesartan concentration remained below the limit of detection for almost the entire time, with a slight increase to 0.015 μg·L−1 in the final sampling. For diclofenac (initial concentration: 1.672 μg·L−1), the concentration decreased to 0.063 μg·L−1 within eight minutes. After this, it increased slightly to 0.142 μg·L−1 at the 30th minute. The overall removal efficiency ranged from 90 to 98%. Metoprolol (initial concentration 0.531 μg·L−1) fell below the limit of detection after 30 s and remained below this value throughout. Caffeine (initial concentration 2.665 μg·L−1) decreased more slowly, reaching 1.348 μg·L−1 after eight minutes. However, the concentration subsequently increased again, reaching 2.372 μg·L−1 at minute 30. Sucralose (initial concentration 17.779 μg·L−1) fell below the limit of detection after 30 s and remained there until the 23rd minute. By the end of the experiment (minute 30), the concentration had risen to 2.040 μg·L−1. Metformin exhibited a more consistent pattern, with an initial concentration of 11.349 μg·L−1 decreasing most significantly at minute 4 to 9.945 μg·L−1 (a 12.37% decrease), followed by a slight increase to 10.867 μg·L−1 at minute 30.
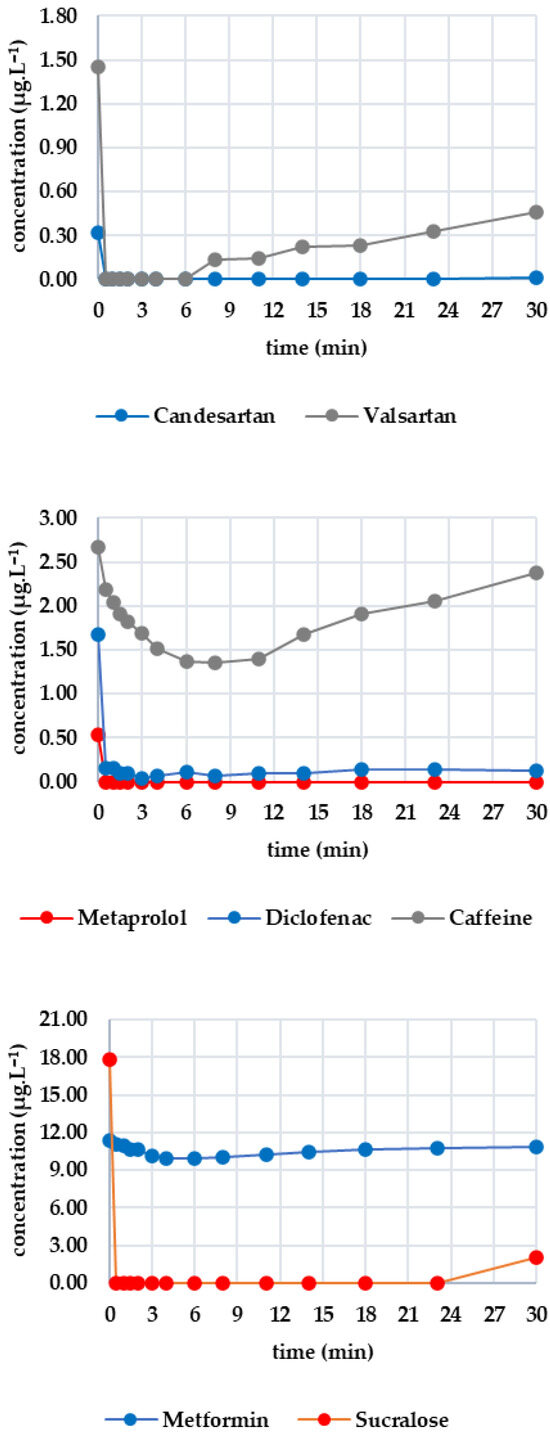
Figure 3.
Dynamics of analyte concentration in the GAC reaction over time.
3.4. UV/GAC
After 25 min of UV exposure, the concentrations of most analytes did not change significantly. In some cases, they increased slightly, which can be attributed to analytical error (e.g., irbesartan increased from 0.118 μg·L−1 to 0.129 μg·L−1, and metoprolol increased from 0.574 μg·L−1 to 0.591 μg·L−1). Only diclofenac showed a significant decrease (from 2.089 to 0.908 μg·L−1; 56.5% efficiency). Valsartan and caffeine also showed slight decreases of 4.98% and 3.11%, respectively, while the other analytes were mainly UV-resistant.
Figure 4 shows how the monitored analytes evolved after GAC filtration. There was a sharp drop below the limit of detection for candesartan, irbesartan and valsartan within the first five minutes. There was then a gradual increase: irbesartan increased to 0.009 μg·L−1 at minute 25, while candesartan increased to 0.065 μg·L−1 at minute 35. Valsartan showed the most significant increase, reaching 0.332 μg·L−1 at minute 60, compared to 0.109 μg·L−1 for candesartan and 0.013 μg·L−1 for irbesartan. The rate of re-ascent was consistent with the initial concentration levels. Both diclofenac and metoprolol fell below the limit of detection within five minutes and remained there until the end of the test (minute 60). Caffeine fell below the limit of detection after 35 min, with the concentration decreasing from 2.209 μg·L−1 to 0.593 μg·L−1 within 10 min and decreasing only slightly thereafter. After 50 min, there was a slight increase to 0.139 μg·L−1, and at 60 min, the concentration was determined to be 0.203 μg·L−1. Sucralose decreased below the limit of detection from an initial concentration of 25.265 µg/L at minute 5. A concentration of 0.506 μg·L−1 was recorded at minute 30, which continued to increase until minute 45. After this, it decreased slightly to 0.437 μg·L−1 (minute 60). Metformin remained stable throughout, with concentrations ranging from 15.800 to 14.300 μg·L−1.
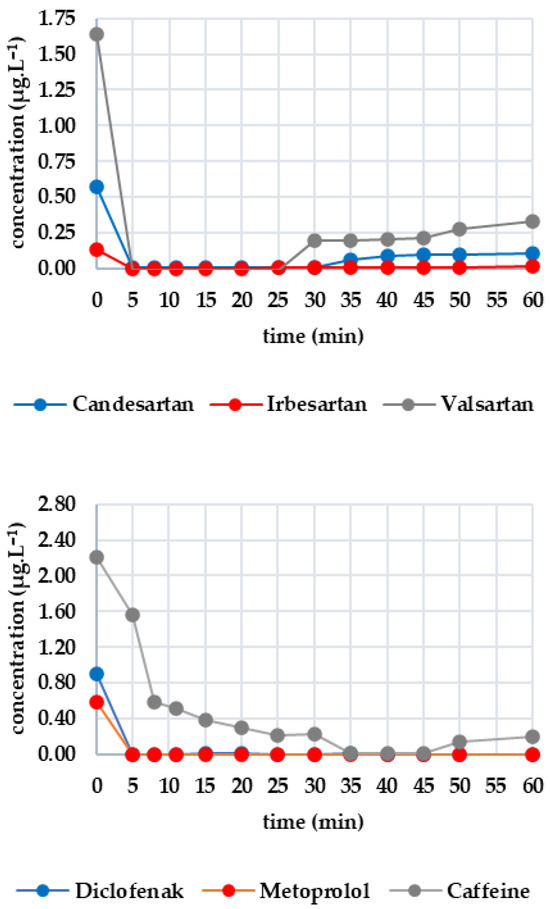
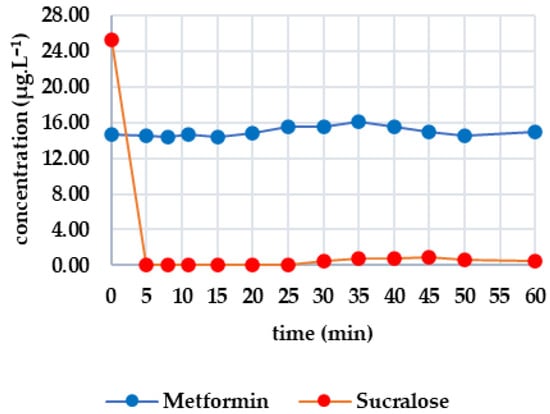
Figure 4.
Dynamics of analyte concentration in the UV/GAC reaction over time.
3.5. O3/GAC
Five minutes of ozone exposure prior to GAC filtration was destructive, particularly for sucralose (decreasing from 27.367 to 21.690 μg·L−1) and diclofenac (decreasing from 2.907 to 1.270 μg·L−1). Caffeine, valsartan and candesartan also exhibited significant post-decreases. In contrast, irbesartan and metformin were unaffected by ozone. Metoprolol showed a minimal decrease, probably within the analytical error margin. Figure 5 shows how the analytes of interest evolved after column filtration. After the first sampling (at minute 5), a significant decrease was evident for candesartan and valsartan, almost reaching zero, except for irbesartan, which remained at 0.009 μg·L−1. Valsartan subsequently increased almost linearly to 0.705 μg·L−1 after 60 min; candesartan and irbesartan increased more slowly. Metoprolol fell to a concentration of zero as early as the fifth minute and remained below the limit of detection until the 60th minute. Diclofenac decreased from 1.270 μg·L−1 to 0.112 μg·L−1 within five minutes, after which the concentration remained stable. Caffeine followed a similar pattern, decreasing from 1.627 μg·L−1 to 0.102 μg·L−1 and subsequently falling below the detection limit from the eighth minute onwards. Sucralose dropped to almost zero after five minutes, then increased slowly to 3.907 μg·L−1 (minute 60). Metformin showed only a slight decrease, from 12.976 to 12.156 μg·L−1, during the first five minutes, followed by a slight increase to 11.999 μg·L−1 after 60 min.
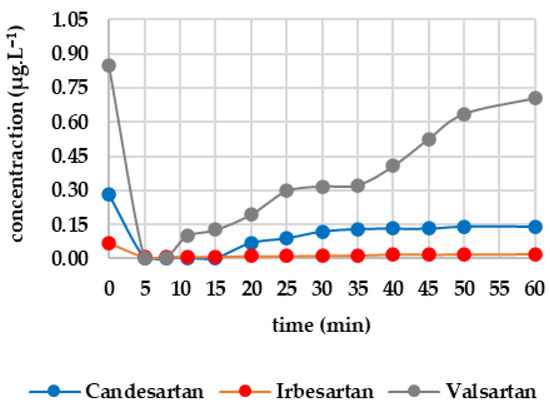
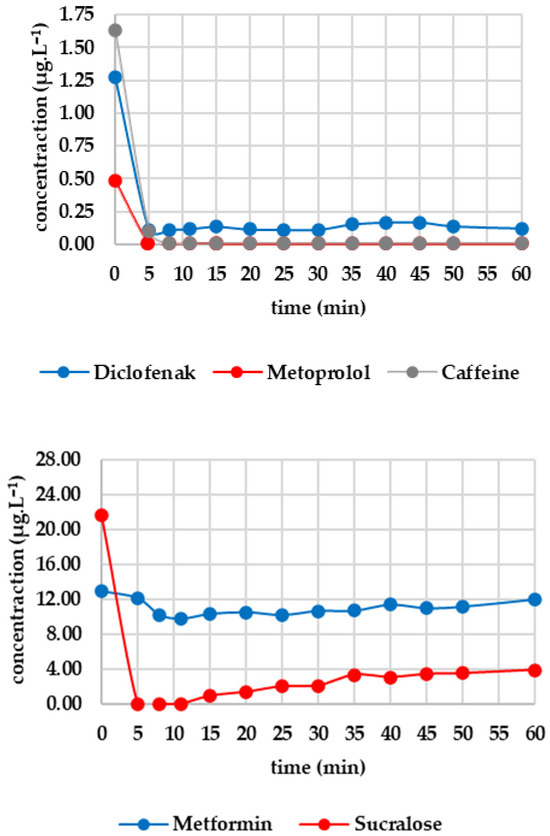
Figure 5.
Dynamics of analyte concentration in the O3/GAC reaction over time.
4. Discussion
The obtained results confirm the high potential of ozonation for the removal of pharmaceutical micropollutants from the aqueous environment. This finding is in agreement with Ternes et al. (2003), who confirmed the effectiveness of ozone in degrading trace contaminants in water in their study [24]. Rosal et al. (2010) also reported similar findings, stating that pharmaceuticals such as metoprolol or caffeine are poorly removed by biological treatment, but their concentrations can be significantly reduced using ozone [25].
Across the full range of methods examined, ozonation emerged as the most effective, a finding corroborated by Sui et al. (2014) who observed almost complete removal of diclofenac and metoprolol by ozone [26]. Conversely, UV irradiation demonstrated negligible efficacy, with the exception of diclofenac, as substantiated by Gagnon et al. (2007) [27]. The remaining pharmaceutical agents exhibited minimal sensitivity to this treatment.
Metformin demonstrated a notable degree of resistance, exhibiting minimal responsiveness to both ozone and UV radiation. This low photolysis efficiency is well documented, with Quintão et al. (2016) [28] reporting an efficiency of 9.2%, and Carbuloni et al. (2020) [29] achieving a maximum of 20% degradation. Sucralose demonstrated comparable stability, exhibiting a reaction only when exposed to ozone.
The utilisation of granular activated carbon (GAC) in an adsorption-based procedure has been demonstrated to yield prompt and substantial outcomes for a wide range of analytes. The efficacy of this approach was exemplified by the effective removal of candesartan, valsartan, metoprolol and sucralose, with high levels of efficiency observed in the removal of these compounds. Conversely, GAC demonstrated low efficacy for caffeine and, most notably, metformin. These observations are consistent with the results of Brienza et al. (2019) [30], where the adsorption of caffeine to GAC was only about 15%, and Jodeh et al. (2016) [31], who achieved 81% removal of diclofenac using activated carbon from plant waste.
The combination of ozone and GAC resulted in the highest efficiencies, even for substances that are difficult to remove, such as caffeine. This synergistic effect is comprehensively delineated by Kennedy & Summers (2015) [32], who reported that ozone-degraded substances exhibit enhanced adsorptive properties due to their diminished molecular weight and augmented polarity.
A comparison can be drawn between the results of this work and the study of Cantoni et al. (2024) [33], in which adsorption and ozonation methods were combined. The combination of technologies was found to yield higher efficiencies than the sum of the individual technologies. The lowest removal was observed for metformin, a substance with low affinity for ozone.
Although GAC alone demonstrated high efficiency for most analytes, for difficult-to-remove contaminants such as metformin, the use of alternative sorbents appears to be more appropriate. For instance, Hethnawi et al. (2020) utilised a SiO2/Al2O3 composite, achieving up to 86.3% removal, contingent on the system parameters [34].
5. Conclusions
In conclusion, this study confirmed that ozonation is the most effective method for removing pharmaceutical micropollutants, particularly when combined with GAC adsorption, where a strong synergistic effect occurs. Most compounds can be effectively treated in this way, but metformin remains highly persistent due to its low reactivity and weak adsorption. Future research should focus on alternative sorbents, the optimization of combined methods, and the assessment of their practical and sustainable application.
Supplementary Materials
The following supporting information can be downloaded at https://www.mdpi.com/article/10.3390/engproc2025116018/s1, Table S1: GAC Carbosorb40; Figure S1: GAC filtration apparatus.
Author Contributions
P.M., J.C. and D.B. have been involved in all aspects of the manuscript such as conceptualization, methodology, software, validation, formal analysis, investigation, resources, data curation, writing—original preparation, writing—review and editing, visualization, supervision, project administration. All authors have read and agreed to the published version of the manuscript.
Funding
This research received no external funding.
Institutional Review Board Statement
Not applicable.
Informed Consent Statement
Not applicable.
Data Availability Statement
Data sets are contained within the article. Further data and materials requests should be addressed to petra.malikova@vsb.cz (P.M.).
Acknowledgments
The authors would like to express their gratitude to the Department of Environmental Engineering, Faculty of Mining and Geology, for their invaluable technical and material support in conducting the laboratory experiments and analyses. Furthermore, the experimental results were obtained using ENREGAT, a substantial research infrastructure that is supported by the Ministry of Education and Science (project NO. LM2018098).
Conflicts of Interest
The authors declare no conflict of interest.
References
- Makowska, M.; Spychała, M.; Gajewska, K. Impact of pharmaceuticals on the individual wastewater treatment system. J. Ecol. Eng. 2024, 25, 257–266. [Google Scholar] [CrossRef]
- Yuan, X.; Qiang, Z.; Ben, W.; Zhu, B.; Qu, J. Distribution, mass load and environmental impact of multiple-class pharmaceuticals in conventional and upgraded municipal wastewater treatment plants in east China. Environ. Sci. Process. Impacts 2015, 17, 596–605. [Google Scholar] [CrossRef]
- Duan, Y.; Wen, Z.H.; Meng, X.Z.; Chen, L. Occurrence and removal of selected pharmaceuticals in a wastewater treatment plant. Adv. Mater. Res. 2012, 573–574, 534–537. [Google Scholar] [CrossRef]
- Placová, K.; Heviánková, S.; Halfar, J.; Brožová, K.; Motyka, O.; Čabanová, K.; Drabinová, S.; Chromíková, J. The ability of UWWTP to remove NSAIDs: Impact on water quality in the Odra River Czech Republic concerning incoming European legislation. J. Hazard. Mater. Adv. 2024, 16, 100477. [Google Scholar] [CrossRef]
- Placova, K.; Halfar, J.; Brozova, K.; Heviankova, S. Issues of Non-Steroidal Anti-Inflammatory Drugs in Aquatic Environments: A Review Study. Eng. Proc. 2023, 57, 13. [Google Scholar] [CrossRef]
- Rodríguez-Serin, H.; Gamez-Jara, A.; Cruz-Noriega, M.D.L.; Rojas-Flores, S.; Yupanqui, M.R.; Gallozzo-Cárdenas, M.; Cruz-Monzon, J. Literature review: Evaluation of drug removal techniques in municipal and hospital wastewater. Int. J. Environ. Res. Public Health 2022, 19, 13105. [Google Scholar] [CrossRef]
- Kim, I.; Kim, J.S.; Tanaka, H. Estimation of UV dose for the effective degradation of pharmaceuticals in secondary treated wastewater. Mater. Sci. Forum 2014, 804, 213–216. [Google Scholar] [CrossRef]
- Zupanc, M.; Kosjek, T.; Petkovšek, M.; Dular, M.; Kompare, B.; Širok, B.; Blažeka, Ž.; Heath, E. Removal of pharmaceuticals from wastewater by biological processes, hydrodynamic cavitation and UV treatment. Ultrason. Sonochem. 2013, 20, 1104–1112. [Google Scholar] [CrossRef]
- Doǧruel, S.; Atesci, Z.C.; Aydın, E.; Pehlivanoğlu-Mantaş, E. Ozonation in advanced treatment of secondary municipal wastewater effluents for the removal of micropollutants. Environ. Sci. Pollut. Res. 2020, 27, 45460–45475. [Google Scholar] [CrossRef]
- Pearce, R.; Hogard, S.; Rosenfeldt, E.J.; Salazar-Benites, G.; Bott, C. Upstream ozone or downstream uvaop: Where to manage 1,4-dioxane and other trace contaminants in high-bromide applications of carbon-based advanced water treatment. ACS ES T Eng. 2024, 4, 1847–1859. [Google Scholar] [CrossRef]
- Margot, J.; Kienle, C.; Magnet, A.; Weil, M.; Rossi, L.; de Alencastro, L.F.; Abegglen, C.; Thonney, D.; Chèvre, N.; Schärer, M.; et al. Treatment of micropollutants in municipal wastewater: Ozone or powdered activated carbon? Sci. Total Environ. 2013, 461–462, 480–498. [Google Scholar] [CrossRef]
- Spit, T.; van der Hoek, J.P.; de Jong, C.; van Halem, D.; de Kreuk, M.; Bicudo, B. Removal of antibiotic resistance from municipal secondary effluents by ozone-activated carbon filtration. Front. Environ. Sci. 2022, 10, 834577. [Google Scholar] [CrossRef]
- Vaidya, R.; Wilson, C.; Salazar-Benites, G.; Pruden, A.; Bott, C. Implementing ozone-bac-gac in potable reuse for removal of emerging contaminants. AWWA Water Sci. 2020, 2, e1203. [Google Scholar] [CrossRef]
- Vatankhah, H.; Szczuka, A.; Mitch, W.A.; Almaraz, N.; Brannum, J.; Bellona, C. Evaluation of enhanced ozone–biologically active filtration treatment for the removal of 1,4-dioxane and disinfection byproduct precursors from wastewater effluent. Environ. Sci. Technol. 2019, 53, 2720–2730. [Google Scholar] [CrossRef] [PubMed]
- Blair, M.F.; Vaidya, R.; Salazar-Benites, G.; Schimmoller, L.; Nading, T.; Wilson, C.; Pruden, A.; Bott, C. Biodegradable dissolved organic carbon profiling reveals capacity of carbon-based potable reuse treatment over a range of operating conditions. AWWA Water Sci. 2023, 5, e1355. [Google Scholar] [CrossRef]
- Obayomi, K.S.; Xie, Z.; Gray, S.; Zhang, J. Assessing the performance of different treatment methods in removing tetracycline from wastewater: Efficiency and cost evaluation. Materials 2025, 18, 2134. [Google Scholar] [CrossRef] [PubMed]
- Chuang, Y.; Mitch, W.A. Effect of ozonation and biological activated carbon treatment of wastewater effluents on formation of n-nitrosamines and halogenated disinfection byproducts. Environ. Sci. Technol. 2017, 51, 2329–2338. [Google Scholar] [CrossRef] [PubMed]
- Zhu, I.X.; Wang, J.; Wieland, A. Ozone-enhanced biologically active filtration for wastewater reuse. J. AWWA 2015, 107, E685–E692. [Google Scholar] [CrossRef]
- Hogard, S.; Salazar-Benites, G.; Pearce, R.; Nading, T.; Schimmoller, L.; Wilson, C.; Heisig-Mitchell, J.; Bott, C. Demonstration-scale evaluation of ozone–biofiltration–granular activated carbon advanced water treatment for managed aquifer recharge. Water Environ. Res. 2021, 93, 1157–1172. [Google Scholar] [CrossRef]
- Andrade, J.R.d.; Oliveira, M.F.d.; Silva, M.G.C.d.; Vieira, M.G.A. Adsorption of pharmaceuticals from water and wastewater using nonconventional low-cost materials: A review. Ind. Eng. Chem. Res. 2018, 57, 3103–3127. [Google Scholar] [CrossRef]
- Sokolov, A.; Kråkström, M.; Eklund, P.; Krönberg, L.; Louhi-Kultanen, M. Abatement of amoxicillin and doxycycline in binary and ternary aqueous solutions by gas-phase pulsed corona discharge oxidation. Chem. Eng. J. 2018, 334, 673–681. [Google Scholar] [CrossRef]
- Schaider, L.A.; Rodgers, K.M.; Rudel, R.A. Review of organic wastewater compound concentrations and removal in onsite wastewater treatment systems. Environ. Sci. Technol. 2017, 51, 7304–7317. [Google Scholar] [CrossRef]
- Guedes-Alonso, R.; Montesdeoca-Esponda, S.; Pacheco-Juárez, J.; Sosa-Ferrera, Z.; Santana-Rodríguez, J.J. A survey of the presence of pharmaceutical residues in wastewaters. evaluation of their removal using conventional and natural treatment procedures. Molecules 2020, 25, 1639. [Google Scholar] [CrossRef] [PubMed]
- Ternes, T.A.; Stüber, J.; Herrmann, N.; McDowell, D.; Ried, A.; Kampmann, M.; Teiser, B. Ozonation: A tool for removal of pharmaceuticals, contrast media and musk fragrances from wastewater? Water Res. 2003, 37, 1976–1982. [Google Scholar] [CrossRef] [PubMed]
- Rosal, R.; Rodríguez, A.; Perdigón-Melón, J.A.; Petre, A.; García-Calvo, E.; Gómez, M.J.; Agüera, A.; Fernández-Alba, A.R. Occurrence of emerging pollutants in urban wastewater and their removal through biological treatment followed by ozonation. Water Res. 2010, 44, 578–588. [Google Scholar] [CrossRef] [PubMed]
- Sui, Q.; Huang, J.; Lu, S.; Fan, W.; Deng, S. Removal of pharmaceutical and personal care products by sequential ultraviolet and ozonation process in a full-scale wastewater treatment plant. Front. Environ. Sci. Eng. 2014, 8, 62–68. [Google Scholar] [CrossRef]
- Gagnon, C.; Lajeunesse, A.; Cejka, P.; Gagné, F.; Hausler, R. Degradation of Selected Acidic and Neutral Pharmaceutical Products in a Primary-Treated Wastewater by Disinfection Processes. Ozone Sci. Eng. 2008, 30, 387–392. [Google Scholar] [CrossRef]
- Quintão, F.; Freitas, J.; Machado, C.; Aquino, S.; Silva, S.; Afonso, R. Characterization of metformin by-products under photolysis, photocatalysis, ozonation and chlorination by high performance liquid chromatography coupled to high-resolution mass spectrometry (HPLC/HRMS). Rapid Commun. Mass Spectrom. 2016, 30, 2419–2428. [Google Scholar] [CrossRef]
- Carbuloni, C.; Savoia, J.; Santos, J.; Pereira, C.; Ganascom Marques, R.; Ribeiro, V.A.; Ferrari, A.M. Degradation of metformin in water by TiO2–ZrO2 photocatalysis. J. Environ. Manag. 2020, 262, 110347. [Google Scholar] [CrossRef]
- Brienza, M.; Nir, S.; Plantard, G.; Goetz, V.; Chiron, S. Combining micelle–clay sorption with solar photo-Fenton processes for domestic wastewater treatment. Environ. Sci. Pollut. Res. 2019, 26, 3717–3725. [Google Scholar] [CrossRef]
- Jodeh, S.; Abdelwahab, F.; Jaradat, N.; Warad, I.; Jodeh, W. Adsorption of diclofenac from aqueous solution using Cyclamen persicum tubers based activated carbon (CTAC). J. Assoc. Arab Univ. Basic Appl. Sci. 2016, 20, 32–38. [Google Scholar] [CrossRef]
- Kennedy, A.M.; Summers, R.S. Effect of DOM size on organic micropollutant adsorption by GAC. Environ. Sci. Technol. 2015, 49, 6617–6624. [Google Scholar] [CrossRef]
- Cantoni, B.; Ianes, J.; Bertolo, B.; Ziccardi, S.; Maffini, F.; Antonelli, M. Adsorption on activated carbon combined with ozonation for the removal of contaminants of emerging concern in drinking water. J. Environ. Manag. 2024, 350, 119537. [Google Scholar] [CrossRef]
- Hethnawi, A.; Alnajjar, M.; Manasrah, A.D.; Hassan, A.; Vitale, G.; Jeong, R.; Nassar, N.N. Metformin removal from water using fixed-bed column of silica–alumina composite. Colloids Surf. A Physicochem. Eng. Asp. 2020, 597, 124814. [Google Scholar] [CrossRef]


Disclaimer/Publisher’s Note: The statements, opinions and data contained in all publications are solely those of the individual author(s) and contributor(s) and not of MDPI and/or the editor(s). MDPI and/or the editor(s) disclaim responsibility for any injury to people or property resulting from any ideas, methods, instructions or products referred to in the content. |
© 2025 by the authors. Licensee MDPI, Basel, Switzerland. This article is an open access article distributed under the terms and conditions of the Creative Commons Attribution (CC BY) license (https://creativecommons.org/licenses/by/4.0/).